Abstract
This study is the first systematic assessment of large herbivore (LH) communities in Limpopo National Park (LNP) in Mozambique, an area where most LH species were extinct until the early 2000s. We investigate whether LH community parameters are linked with the availability of habitat types or the distance between sampling sites and the origin of LH resettlement. We placed camera traps in five habitat types in resettled and not-resettled areas to compare species richness, relative abundance index, grazers–browsers–mixed feeder and naïve occupancy of 15 LH species. While the richness decreased along the distance gradient of LH resettlement, relative abundance index strongly responded to habitat features. The grazer–browser–mixed feeder ratio oscillated, while from resettled to not-resettled areas, the ratio increased. Most species show a wide distribution range. The associations of most LH community parameters with habitat types rather than distance to initial release, together with the species-specific and guild-specific response patterns of LH, suggest LNP to already be in an intermediate stage of restoration. Our results highlight the importance of post-release monitoring of reintroduced wildlife as a tool to assess the success of ecological restoration initiatives in transboundary conservation areas.
1. Introduction
Large herbivores (LHs) are one of the components determining the structure, composition and function of ecosystems in African savannas [1,2]. In the savannas of Sub-Saharan Africa, wildlife still shares pastoral landscapes with people and livestock [3]. As long as this phenomenon persists, these semi-natural habitats progressively become smaller and less available [4,5] and confine the distribution of wildlife to areas that are still safe and suitable. As large herbivores explore large home ranges [6,7,8,9], landscape scale monitoring is needed, although it is costly because the distributions patterns are affected by processes which operate at multiple scales [10], so methods that provide robust information at low-cost are particularly valuable.
Habitat availability and the quality and quantity of food are determinant in the distribution and abundance of LHs [11,12,13]. Habitat choice and LH distribution also depend on water and shelter availability, topography, human settlements, predator occurrence and abundance [14,15], social interactions between individual animals, breeding and territorial behaviour [16]. The landscape is heterogeneous in terms of habitat types forcing LHs to move according to both habitat characteristics and their needs for energy and safety [17,18]. Herbivores with smaller body size (≤100 kg) require relatively less forage but of higher nutritional quality, whereas larger herbivores tolerate low quality food, provided that it is of sufficient quantity [19,20,21,22,23]. As a result of body-size-related nutrient requirements [24], larger species exploit a higher diversity of habitat types than smaller species [21,25] and are therefore more evenly distributed in the landscape than smaller species [26]. Body size and feeding guild interactions also influence the distribution of LHs. Grazers [e.g., warthog (Phacochoerus africanus), blue wildebeest (Connochaetes taurinus) and plains zebra (Equus quagga)] prefer to graze in habitats with short-to-medium grasses [27] and medium-to-tall grasses [African buffalo (Syncerus caffer)] as the body size increases [28,29]. Pure browsers [e.g., greater kudu (Tragelaphus strepsiceros) and giraffes (Giraffa camelopardalis)] select mainly habitats with woody plant forage [30], while mixed feeders [e.g., impala (Aepyceros melampus), nyala (Tragelaphus angasii) and sable antelope (Hippotragus niger)] prefer woodland with minimal undergrowth and low to medium height grasslands [28,31].
The Limpopo National Park (LNP) was established in 2001 [32]. Before that time, it was a hunting concession called “Coutada 16” [33,34]. The area was affected by Mozambique’s civil war (1976–1992) [35] and decades of poaching, which decimated the populations of almost all LH species in the region [36,37]. The LNP is part of the Great Limpopo Transfrontier Park (GLTP) initiative that links LNP in Mozambique, Kruger National Park (KNP) in South Africa and Gonarezhou National Park (GNP) in Zimbabwe [32]. Communities that had fled during the war gradually returned in the 1990s, and by the time the area was declared a national park, it was home to some 20,000 people [38]. An explicit goal of the GLTP is to rehabilitate wildlife populations in the area [32]. For this purpose, a 300 km2 fenced area (Old Sanctuary), easy to patrol and allow wildlife adaptation and growth, was built in the southeastern corner of the LNP. Afterwards, a total of 4725 large herbivore individuals belonging to 10 species [African elephant (Loxodonta africana), white rhino (Ceratotherium simum), waterbuck (Kobus ellipsiprymnus), roan antelope (Hippotragus equinus), Lichtenstein hartebeest (Alcelaphus lichtensteinii), African buffalo, giraffe, blue wildebeest, plains zebra and impala] were actively translocated from KNP to LNP between 2001 and 2008 [36,39]. The fence of the sanctuary was later removed in 2006 to allow animals to disperse and colonize the rest of the park. Some sections of the LNP–KNP international border were also removed to allow passive wildlife reintroduction and wildlife cross-border movements from KNP into LNP [40]. The reintroduction success depends on the adaptation/acclimatization of translocated wildlife to a new environment after their release [41] and its dispersal behavior [42]. Species of LH may disperse from reintroduction sites, as an adaptive response to explore and select high quality habitats surrounding or away from release sites [41,42]. However, human presence limits habitat use by large herbivores and its ability to disperse to other habitats in the landscape [43]. Around 30,000 people live inside LNP. Twenty-three percent (23%) of these people are waiting to be resettled in an area outside the current park borders that is termed a “buffer zone” [38,44]. These villages act as barriers to the use of the habitats in the LNP landscape.
The understanding of spatial distribution and abundance of LH in African savanna ecosystems is critical for adaptive management of species and their habitats [45,46]. Since the beginning of the LNP restoration program in 2001 [36,39], to our knowledge there are no studies to understand the stage of its course, the adaptation of reintroduced LH to the new habitats after release and their ability to invade and colonize other habitats outside the release site. The important ecological parameters (occurrence, relative abundance, species richness, diversity index, grazer-browser-mixed feeder-ratio, ungulate-potential predators and spatial occupancy) of reintroduced LH that can indicate the re-establishment of processes and patterns in the LNP landscape remain poorly explained. Because the LNP is considered one of the core areas for the development of GLTP [32], these parameters can also be indicative of GLTP functionality. Some of these parameters (population trends and density, spatial distribution of selected species) are still estimated only through the aerial census data that cover only 30% of the park [47,48,49]. Furthermore, no study has yet attempted to compare these parameters in relation to the habitat features at the origin of LH resettlement.
Our study aims to investigate whether ecological parameters associated with LH communities in Limpopo National Park (e.g., occurrence, relative abundance, species richness, diversity index, grazer-browser-mixed feeder ratio, ungulate-potential predators and naïve occupancy) are explained by (i) the availability of habitat types or (ii) the distance between sampling site and the “origin of LH resettlement”. Thus, we hypothesized that the ecological parameters (1) will decrease with an increasing distance of the sampling site from the so-called “origin of LH resettlement” (KNP fence and "Old Sanctuary" see Figure 1a,b), (2) will decrease from Lebombo North (West) to Nwambia Sandveld (East) (see Figure 1c), and (3) that mixed feeders and species of larger body size will use a wider range of habitats. The results can be a useful tool for the ecological restoration of the park through measuring of (i) its success or failure or (ii) the post-release adaptation (colonization) of reintroduced LH to new habitats in the LNP. This will ultimately support the developing of a comprehensive conservation management and monitoring plan for further development of the GLTP.
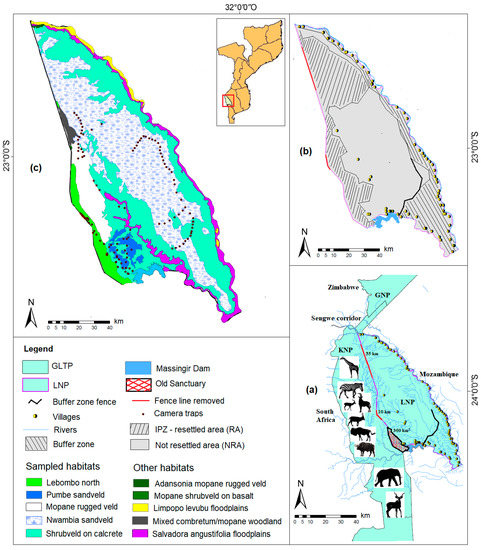
Figure 1.
(a) Overview of large herbivore reintroductions in the LNP and GLTP. (b) Resettled and not-resettled area. (c) Sampling sites in five habitat types [53]. (GLTP—Great Limpopo Transfrontier Park, GNP—Gonarezhou National Park, IPZ—Intensive Protection Zone, KNP—Kruger National Park, LNP—Limpopo National Park).
2. Materials and Methods
2.1. Study Area
The study was carried out from December 2019 to March 2021 in Limpopo National Park (LNP) (22°25′ S–24°10′ S, 31°18′ E–32°39′ E), a 10.000 km2 protected area in Gaza province in Mozambique. The LNP is a crucial element of a transboundary protected area network which, together with Kruger National Park (KNP) in South Africa and Gonarezhou National Park (GNP) in Zimbabwe, forms Great Limpopo Transfrontier Park (GLTP). The western boundary of the LNP is formed by the border with South Africa. The Zimbabwean border touches on the northern-most tip of the area. The Limpopo River forms the eastern boundary, whilst the Olifants River is the southern boundary. The climate is classified as warm dry tropical with mean annual precipitation increasing from 360 mm to over 500 mm from northern to southern. Mean annual temperature fluctuates between 24 °C and 30 °C. Rainfall occurs in the wet season extending from November to April. The dry season extends from May to October [32]. The average of annual rainfall that falls in wet season is about 60% [50]. The altitude in the park varies between 260 and 840 m above sea level. Geologically, LNP is dominated by rhyolite volcanic rock in the southern region, while the North consists of red sand mantle, whereas alluvium and clay sediments characterize the Limpopo floodplains [32].
Hydrologically, the LNP is dominated by three river systems with an overwhelming impact on the land use of the region, which influences wildlife distribution: (1) the Limpopo is the largest, perennial river, although water becomes restricted to pools along the river bed at the end of dry season; (2) the Olifants remains perennial throughout the season; and (3) the Shingwedzi is a much smaller not-perennial river system. As Shingwedzi drains the central portion of the LNP, it has a large effect on the wildlife distribution [32]. Settlements in the LNP are characterized by subsistence farming, free grazing of livestock and “bushmeat poaching” (illegal hunting of wildlife for local consumption) [51]. About 30,000 people live within the park in 50 villages. Most of the population (around 20,000 people) is concentrated in 42 villages along the right bank of the Limpopo River and the left bank of the Olifants River, where the alluvial soils are suitable for agriculture [38]. The remaining inhabitants live in eight villages along the Shingwedzi River [44]. These continuous matrixes of agricultural resettlements along the Limpopo River and Shingwedzi Valley act as the greatest barrier to wildlife distribution and movements. The free grazing of livestock and bushmeat poaching are the main threats in the most extensive habitats (Sandveld habitats) of the park [51,52]. There are over 7000 heads of cattle along Shingwedzi Valley sharing grazing areas with wildlife and over 15,000 in the buffer zone [49]. People hunt with large packs of 10–20 domesticated dogs (Canis lupus f. familiaris), and it is expect that LHs are displaced by these activities, particularly in the open grasslands in the Sandveld [52]. The encroachment of people in the park modifies the composition and structure of habitats and reduces the safety forcing wildlife concentration away from agriculture and settlement areas.
Based on woody vegetation, species composition and physiognomy, ten landscape types with 15 plant communities were described in LNP: (i) Nwambia Sandveld, (ii) Pumbe Sandveld, (iii) Rugged Veld, (iv) Lebombo North, (v) Shrubveld on Calcrete (Combretum sp/Colophospermum mopane), (vi) Shrubveld on Basalt, (vii) Woodland, (viii) Limpopo Levubu Floodplains, (ix) Rugged Veld (Adansonia digitata/ C. mopane) and (x) Salvadora angustifolia floodplains [53]. Since the establishment of the LNP, there has been an increase in the wildlife population, and at least 26 large herbivores species have been documented [47,48,49], as a result of active reintroductions through capture and release of large herbivores from KNP to LNP and passive reintroductions through dropping of three sections of the fence between these two parks to allow transboundary wildlife movements in the context of establishment of the GLTP [38,39,47].
2.2. Study Design
2.2.1. Selection of Species
We selected 15 large herbivore species (body mass > 10 kg) that show some increase in their population number since 2004 [48,49]. These LH species represent also different feeding guilds. Seven of these species were actively reintroduced in the park from 2001 to 2008 (Table 1), and these, together with the rest of the species, are believed to have crossed the borders through the dropped fence sections [39] such that the current number of LH species in the park is an obvious result of reintroductions, migrations and intrinsic population growth.

Table 1.
Large herbivore species (body mass > 10 kg) selected for the study in the Limpopo National Park (the upper and lower limit of weight corresponds to variations between adult males and females).
2.2.2. Selection of Habitats
Based on an assessment made from a helicopter, we selected sites corresponding to five of the ten habitat types [53], which represent 90% of the park surface: (i) Nwambia Sandveld, (ii) Mopane Shrubveld on Calcrete, (iii) Rugged Veld, (iv) Lebombo North and (v) Pumbe Sandveld (Figure 1c). Due to the increase in poaching activities in recent years, the park has been implementing an Intensive Protection Zoning (IPZ) since 2013, which excludes villages and land-use areas for livestock grazing and agriculture from the protected area [48]. The IPZ is ecologically preserved [36] and is where the “Old Sanctuary” and fence dropped sections of the KNP–LNP international border were located. The IPZ is also crucial for the active and passive restoration processes because historically, wildlife undertook seasonal movements between KNP and Mozambique before the erection of the eastern boundary fence of KNP [39]. Thus, we consider the IPZ [(KNP fence, Old Sanctuary and resettled area] as the origin of LH resettlement. We consider the zone outside IPZ excluding the buffer zone as a not-resettled area (Figure 1a,b). By overlapping the IPZ map (Figure 1b) and the sampling sites map (Figure 1c), we calculated the average distances between sampling site and the “origin of LH resettlement” (using geographic information system data from ArcMap 10.6; ESRI 2012). In a next step, we established the gradient in the following order: (1) Lebombo North (completely inside the IPZ); (2) Pumbe Sandveld and (3) Rugged Veld (partially within the IPZ); (4) Shrubveld on Calcrete (16 km from the IPZ) and (5) Nwambia Sandveld (21 km from the IPZ).
(i) Lebombo North—covers 398.78 km2 (3.5% of LNP) and has high richness in its grass composition (44 species), but lower average biomass (2,076.5 ± 569.83 kg/ha) than Nwambia Sandveld and Shrubveld on Calcrete. The ecologically important trees are Colophospermum mopane and Combretum apiculatum. The tree average height is 2.9 m [55]. Heteropogon sp, Digitaria sp, and Uroclhoa mossambicensis are the most dominate grasses [53].
(ii) Pumbe Sandveld—covers 256.08 km2 (2.3% of LNP) and has relatively higher floristic composition (87 species) than Lebombo North, Rugged Veld, Pumbe Sandveld and lower than Nwambia Sandveld. It is dominated by Combretum apiculatum and Terminalia sericea. The grass layer is dominated by Panicum maximum and Eragrostis pallens [53].
(iii) Rugged Veld—covers 699.11 km2 (6.21% of LNP) and is relatively rich (81 species) in botanic composition. The most ecologically important trees are C. mopane, Acacia nigrescens, Sclerocarya birrea and Combretum imberbe. The grass layer is dominated by P. maximum, Uroclhoa mossambicensis and Schmidittia pappaphoroides [53].
(iv) Shrubveld on Calcrete—covers 4158.9 km2 (38.8% of LNP) and, similar to Lebombo North, has highest richness in its grass composition (44 species), however with low average biomass (2968 kg/ha ± 635.63). Digitaria eriantha, Penisetum glaucum and P. maximum are the most dominated grass species. Calcrete is almost homogeneous in terms of species composition; shrubby C. mopane is the overwhelmingly dominating species. The tree average height is lower (~2.25 m) comparatively to other habitats [55].
(v) Nwambia Sandveld—the most extensive habitat covering 4586.41 km2 (41.1% of LNP) and is relatively richer than others with 99 species in overall botanic composition [53]. Although the grass composition is relatively low (35 species), the average biomass is higher (3630.5 ± 298.62 kg/ha) than other habitats. Digitaria eriantha and Uroclhoa mosambicensis are the most dominated grass. The most ecologically important trees are Combretum apiculatum, Sclerocarya birrea and Xeroderris stuhlmannii. The average tree height in this landscape is highest, with ~4.25 m [55].
2.3. Data Collection
We deployed 24 infrared wildlife camera traps (Foxelli Outdoor Gear Oak’s Eye Trail Cam®—14 MP 1080 Full HD) in 146 sites from 3 December 2019 to 4 June 2021. We used a stratified random design with habitat types as the main strata, and we randomly selected ~2 km2 grid cells [56,57] in a 60 × 108 km2 grid cells surveyed. We deployed one camera trap in each grid [58,59] at 0.50 to 1.5 meters height on trees and shrubs. Areas that were difficult to access as well as areas where the risk of cameras being stolen was high (close to roads or settlements and cattle grazing areas) were not covered for sampling. All cameras worked on a passive infrared-triggered basis. The cameras were active 24 hours a day and took bursts of two successively high-resolution photos, 14 MP (4426 × 3312P) with a delay of 60 seconds between trigger activations. The cameras were equipped with eight long-lasting alkaline batteries (Amazon Basics AA High-Capacity Rechargeable) and one Micro Transcend® SD memory card (SanDisk 32GB micro SDHC memory card). Each camera trap location or station constituted a sampling unit (n) [60]. We moved the cameras from one station to another six times and collected LH data in a total of 146 sampling units at average intervals of 69.5 days.
2.4. Photo Processing
We used the software “Camera Base—Adobe Bridge 2020 for windows (Adobe systems)”, an access database designed for managing camera trap survey [61,62]. We sorted all photographs by (1) species [63,64], (2) habitat type, (3) date and time, and we converted to camera-trap events, considered as the whole sequence of photos in which the same animal species appeared [65]. Independent events was defined as (i) consecutive photographs of individuals of different species; (ii) consecutive photographs of individuals of the same species taken more than 0.5 h apart; and (iii) nonconsecutive photos of individuals of the same species [66,67]. For species in herds, we chose the photograph with the highest number of individuals as the independent sample for that species [68]. Detection was considered as one independent event of a species per camera and day (24 h) [69]. Therefore, we counted photos with multiple individuals of the same species in the frame as single detection for that species [70,71] to minimize bias in estimates of relative abundance [72].
2.5. Data Analysis
2.5.1. Survey Effort
The survey effort was the number of camera-trap days or nights, calculated by summing the days (24 h period) each camera was operational [65,73,74]. The number of sampling units sampled in each habitat was Lebombo North n = 40, Pumbe Sandveld n = 16, Shrubveld on Calcrete n = 30, Nwambia Sandveld n = 50; resettled area n = 76 and not-resettled area n = 70. Average length of camera deployment at each sampling unit was 69.5 days (SD = 31.2; min = 28; max = 122). To validate the sufficiency of the study period, we constructed an observed species accumulation curve (SAC) using the cumulative number of independent events with 95% confidence intervals in EstimateS 9.1.0 [75]. SACs plot the cumulative number of species detected against the survey effort (number of camera trap days or number of individuals captured) and reach an asymptote when all species have been recorded [76,77,78]. Additionally, we used the mean of the four commonly used nonparametric abundance-based richness estimators (ACE, Chao1, Jackknife1 and Bootstrap) to assess sampling completeness ratio (i.e., observed species number/estimated species number). In this case, we assumed sampling saturation when the sampling completeness ratio approached one [68,79].
2.5.2. Species Diversity Indices and Relative Capture Frequency (RAI)
To understand how LH community composition changes among habitat types and from resettled to not-resettled areas we estimated the following parameters: (1) species richness (S) as the total number of species captured in each habitat type, resettled area and not-resettled area. The species richness in each habitat type, resettled and not-resettled area was compared in 100 trap nights; (2) diversity was estimated using the Shannon diversity index [H’ = ∑pi × ln (pi)], where pi represents the proportion of individuals from species i. To investigate differences in Shannon diversity index among habitat types, between resettled areas and not-resettled areas, we performed diversity t-test [80]. In order to compare abundance-activity indices among habitat types, between resettled and not-resettled areas, a measure of relative abundance index (RAI) [81,82] was calculated for each camera trap. The RAI was calculated at the species level and at the level of total wildlife. The RAI was calculated by using the number of detections divided by the total number of trap nights and converting this value as per 100 trap nights to facilitate comparisons. By using a Shapiro–Wilk test and homogeneity of variance (Levene’s Test), we detected that RAI means and residuals were not normally distributed (p < 0.05). Thus, medians of RAI and inter-quartile range (IQR) were calculated for each species in each habitat type in resettled area and not-resettled area [83]. Kruskal–Wallis with Dunn’s post hoc test for multiple comparisons at 95% significance level was used to compare RAI medians at the species level and at the level of total wildlife. We assumed that for most species, the number of events that the cameras recorded is proportional to the local density of the species, i.e., cameras will record a species more often where it is more abundant [66,84]. The composition of wildlife communities (browser-grazer-mixed feeder ratio and ungulate-potential predators’ ratio) was compared among habitat types and between resettled areas and not-resettled areas. These ratios show the percentage of independent events of a particular group of species in relation to all independent events associated with wildlife [83,85]. The relationship between ecological parameters (total RAI, grazer-browser-mixed feeder ratio and richness) was assessed by plotting the values of these parameters for each habitat type using Microsoft Excel 2010 [86]. One-way ANOVA or Kruskal–Wallis test in past 4.03, depending on the type of distribution of data, were used to compare grazer-browser-mixed feeder ratio [80] within and among habitat types and between resettled areas and not-resettled areas. The ungulate-potential predators’ ratio and ungulate-total wildlife ratio were used to assess the influence of predators on the distribution of ungulates. We consider those carnivore species as potential predators that have a body mass of ≥13 kg [lion (Panthera leo), leopard (Panthera pardus), cheetah (Acinonyx jubatus), spotted hyena (Crocuta crocuta), caracal (Caracal caracal), wild dog (Lycaon pictus) and black-backed jackal (Canis mesomelas)]. This was based on the assumption that the occurrence of those carnivore species can possibly affect the occurrence, behaviour and distribution patterns of our target species (large herbivores ≥ 10 kg, including their offspring) [63,64]. Thus, we used a Kruskal–Wallis test to compare ungulates events (detection) in relation to total wildlife events in the absence of potential predators and ungulates events when potential predators where present. Comparisons were conducted within habitat types and between the resettled and not-resettled area.
2.5.3. Occurrence Frequency/Naïve Occupancy
The occurrence frequency of species in each habitat type, in resettled areas and not-resettled areas, was calculated as the proportion of sampling unit a species was detected divided by the total number of camera-trap units placed in each habitat type and area [58,74,87] and was considered as an index to compare large herbivore distribution responses to habitat types and distance from resettled areas to not-resettled areas. The habitat use (LH distributional ranges) by each species was defined as the number of sampling units occupied by the species [88] in each habitat and in resettled and not-resettled areas. Based on this, we calculated the naïve occupancy mean of each species in each habitat type, in resettled and not-resettled areas. We considered widely distributed species those occupying all habitat types or both resettled and not-resettled areas with naïve occupancy mean ≥0.4, and narrowly distributed species occupying less than three habitat types or one or two areas (resettled areas and not-resettled areas) with naïve occupancy mean ≤0.39. To understand the effect of habitat type and distance from LH resettlement origin, we computed binomial confidence intervals for proportions at 95% significance [89] only for those species with naïve occupancy ≥0.4. The confidence intervals that do not overlap indicate significant differences in the naïve occupancy.
3. Results
3.1. Trapping Effort
Camera traps produced 21,553 successful photographs in 9533 camera-trap days (Lebombo North = 1999; Pumbe Sandveld = 1062; Rugged Veld = 582; Shrubveld on Calcrete = 2178; Nwambia Sandveld = 3712/ resettled area = 4164; not resettled area = 5369) (Table S1). Observed species accumulation curve approached an asymptote at ~49 species. The sampling completeness ratio was 0.95 (ACE = 50.78; Chao1 = 49.6; Jack1 = 53.96; Bootstrap = 52.14; mean average = 51.62). This suggests that a full inventory in the study area was almost done (Figure 2).
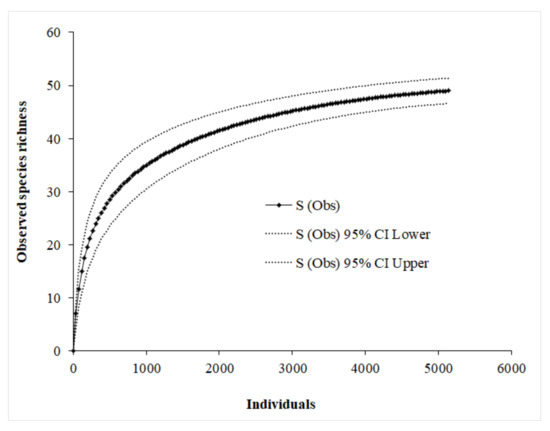
Figure 2.
The observed species accumulation curves for all species captured in LNP. The curves were constructed using sample-based rarefaction approach with 1000 randomisation runs in EstimateS 9.1.0 [75].
3.2. Species Diversity Index and Relative Capture Frequency (RAI)
We collected a total of 5138 animal triggered events, of which 4235 events (82.4%) represent our 15 target species (herbivores >10 kg), and 3909 events (76%) represent 14 ungulates species. A total of 903 events (17.6% of all events) are associated with 34 nontarget species, of which 237 events (4.6%) were caused by one out of seven potential predators’ species. We identified a total of 8,584 individuals, belonging to 13 taxonomic orders and 25 families. The Order Artiodactyla was the most represented with 17 species (Table S2). While species richness (S) is highest in Lebombo North (LN) and a resettled area (RA) (SLN = SRA = 15) and similar among the other habitat types and in a not-resettled area (NRA) (SPS=NS=NRA = 12 and SSC=RV = 11), Shannon diversity index and evenness did not change (Table S3). Total RAI is significantly higher in Lebombo North and Rugged Veld than Pumbe Sandveld, Shrubveld on Calcrete, Nwambia Sandveld, and it is not significantly different between resettled areas and not-resettled areas (Figure 3, Table 2). There is a clear effect of habitat type on mixed feeder ratio and browser ratio along the distance gradient of LH resettlement. However, the grazer-browser-mixed feeder ratio values oscillate among habitat types. (Figure 4, Table S4). Only the grazer’s ratio is significantly higher in resettled areas than not-resettled areas, and the browser ratio is significantly higher in not-resettled areas than resettled areas (Table S4). At the species-specific RAI level, there are some significant differences among habitat types (Kruskal–Wallis: 15.23, df = 4; p = 0.004) and between RA and NRA (Kruskal–Wallis: 4.4, df = 1; p = 0.03): while waterbuck, plains zebra, greater kudu, giraffe, impala and nyala show a significantly higher RAI in Lebombo North; common duiker (Sylvicapra grimmia) and steenbok (Raphicerus campestris) show a significantly higher RAI in Rugged Veld and Nwambia Sandveld and blue wildebeest in Pumbe Sandveld. Unlike common duiker and steenbok, warthog, waterbuck, plains zebra, giraffe and impala show a significantly higher RAI in a resettled area. There are no significant differences in ungulates events (detection) in both presence and absence of potential predators within habitat types (Kruskal–Wallis: 19.6, df = 4; p = 0.5) and between resettled area and not-resettled area (Kruskal–Wallis: 4.74, df = 1; p = 0.12) (Table 2).
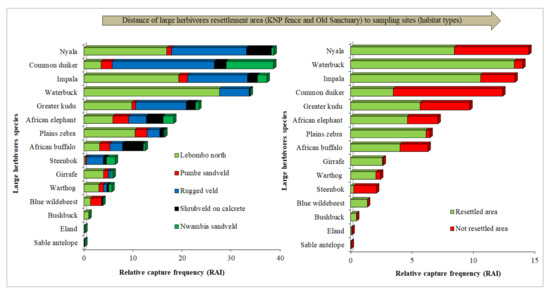
Figure 3.
Species composition and capture frequency (RAI—detections/100 trap nights) among habitat types and between resettled areas and not-resettled areas.
Table 2.
Comparison of relative abundance index (RAI) at species level and at total wildlife RAI, ungulate ratio with presence and absence of potential predators among habitat types and between resettled areas and not-resettled areas in Limpopo National Park.
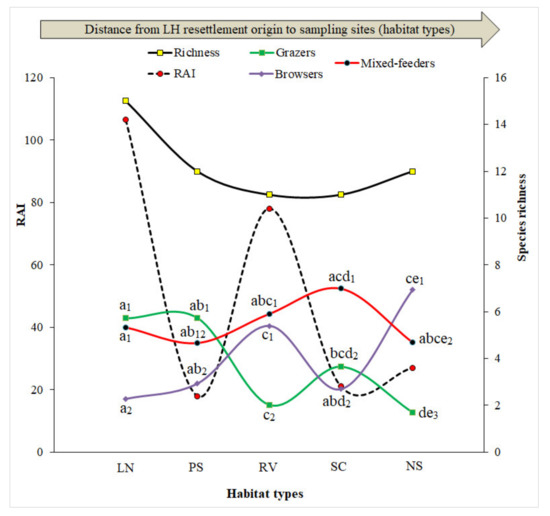
Figure 4.
Relationship between ecological parameters (total RAI, S, grazer-browser-mixed feeder-ratio). Different letters (a,b,c,d,e) and numbers (1,2,3) show significant differences (p < 0.05) in the comparisons of grazers-browsers-mixed feeders ratio among and within habitat types, respectively. LN—LebomboNorth, PS—Pumbe Sandveld, RV—Rugged Veld, SC—Shrubveld on Calcrete, NS—Nwambia Sandveld.
Furthermore, the relationship between the ecological parameters [relative capture index (RAI), grazer-browser-mixed feeder ratio and species richness (S)] point towards different patterns of LH community responses to habitat type and increasing distance between sampling site and the origin of LH resettlement. The change of habitat type from Lebombo North to Pumbe Sandveld leads to a significant decrease in both species richness and RAI. The change from Pumbe Sandveld to Rugged Veld leads to a significant increase in both RAI and browsers ratio and decrease in grazers’ ratio. The change from Rugged Veld to Shrubveld on Calcrete leads to a significant decrease in RAI and browsers ratio. Finally, the change from Shrubveld on Calcrete to Nwambia Sandveld leads to a significant increase in browsers ratio and a significant decrease in mixed feeders ratio (Figure 4 and Table 2). Regarding the LH resettlement origin, the increasing distance from resettled areas to not-resettled areas leads to a significant decrease only in species richness, grazers’ ratio and significant increase in browsers ratio (Table 2 and Table S4).
3.3. Occurrence Frequency/Naïve Occupancy
While African elephant, African buffalo, plains zebra, greater kudu, nyala, impala and common duiker show a wide distribution range, blue wildebeest, eland (Taurotragus oryx), sable antelope and bushbuck (Tragelaphus scriptus) show a narrow distribution range among habitat types and from resettled to not-resettled areas (Figure S1). As the habitat type changes, the results point towards different patterns of LH responses: the occupancy range of impala and plains zebra is significantly wider in Lebombo North, the occupancy range of common duiker is significantly wider in Rugged Veld and Nwambia Sandveld and the occupancy range of greater kudu is significantly wider in Nwambia sandveld (Figure 5a). However, as the distance between sampling sites and the origin of LH resettlement increases, only the occupancy range of plains zebra is significantly wider in resettled areas, while common duiker shows an opposite behaviour (Figure 5b).
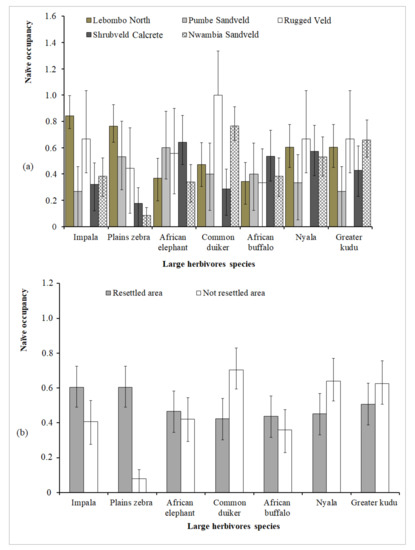
Figure 5.
Species-specific naïve occupancy (mean ≥ 0.4) comparison among habitat types (a); between resettled and not-resettled areas (b). Vertical bars indicate binomial confidence intervals (α = 0.05) for proportions. The vertical bars that do not overlap indicate species significant differences in the naïve occupancy.
4. Discussion
This study is the first systematic assessment of large herbivore (LH) communities in Limpopo National Park (LNP), an area where most LH species were extinct until the early 2000s. We investigate whether parameters of the LH community in LNP are linked with the availability of habitat types or the distance between sampling site and the “origin of LH resettlement”. Previously, 26 species had been reported in the LNP [48,49,90]. In this study, 23 more species were recorded, accounting for 49 species in total. However, three of actively reintroduced species [Lichtenstein’s hartebeest (Alcelaphus lichtensteinii), White rhinoceros (Ceratotherium simum) and Roan antelope (Hippotragus equinus)] could not be recorded, neither with camera traps nor via opportunistic observations.
We found that species richness, relative abundance index and grazer–browser ratio clearly changed with regards to habitat types. From resettled to not-resettled areas, only species richness and grazers–browsers ratio changed. The highest number of species recorded in Lebombo North and resettled area correspond with the fact that these areas are close to the Kruger National Park (KNP) border and benefit directly from LH entering from sections of dropped fence. Apart from these officially broken sections, there are many other “scape sites” into LNP along the fence due to lack of maintenance. Furthermore, the entire length of the transects in Lebombo North and resettled area are within the Intensive Protection Zone (IPZ) with many anti-poaching control posts [49], providing LH security from poaching.
The area of Lebombo North and part of resettled areas, despite being hilly, are crossed by seasonal rivers (Machampane, Sambalala and Guazi) [32] and are made up by rocky soils [91], which promote water retention in the rainy season, creating diverse pools that extend into the late dry season. This can attract water-dependent grazers and mixed-feeders from the neighboring KNP and other habitats around Lebombo North. Similar to our study, [47] found that the richness and distribution patterns of LHs were highest in Lebombo North and along the KNP border, and simultaneously, they recorded about 252 natural waterholes in spite of a rather poor rainfall season. These patterns (water-rich and safe area) not only explain the high species richness in Lebombo North and resettled area, but also may explain the highest RAI and grazer’s ratio found in these two sites. However, the grazers’ ratio decreased significantly from Pumbe Sandveld to Nwambia Sandveld, probably due to lack of water and prevalence of human settlements in this habitat. As the distance increases from Lebombo North towards Nwambia Sandveld, the area between the Shingwedzi Valley and the Limpopo River becomes waterless except for the small pans, which retain water only during the wet season [32].
The Lebombo North and resettled area are part of Intensive Protection Zone and therefore are ecologically preserved [36] because there are fewer human settlements and other disturbances when compared to other habitats, such as Rugged Veld, Shrubveld on Calcrete and Nwambia Sandveld [38,48]. Because agriculture, livestock grazing and resource extraction by humans are not allowed within the Intensive Protection Zone and poaching is more controlled than in other parts of the LNP [49], the Intensive Protection Zone represents a relatively undisturbed savanna ecosystem in LNP. This can probably lead to increase the species richness and RAI due to the lack of anthropogenic barriers that prevent the LH dispersal and colonization of new areas. This finding is supported by observations in Uganda, Tanzania, Indonesia, Brazil, Costa Rica [92] and Singapore [93], where different researchers documented higher species richness in intact than in fragmented habitats. However, the significant reduction in total RAI from Rugged Veld to Nwambia Sandveld can be explained by opposite patterns to those presented above: from Rugged Veld to Shrubveld on Calcrete and Nwambia Sandveld (West–East gradient), the intensity of land use and forest resources exploitation increases due to the human settlements and livestock (grazing areas) [49]. This leads to increased habitat degradation, which can lead to reduced total wildlife RAI. Likewise, studies conducted in Gabon [87], Namibia and Tanzania [83] confirm a decline in total wildlife RAI of small, medium and large herbivorous mammal communities resulting from increasing grazing pressure and poaching.
There is a significant increase in RAI in Rugged Veld owing to individual RAI contributions of two mixed feeders (impala and nyala) and two browsers (common duiker and great kudu) (Table S5). This increase in RAI can be explained by the fact that Rugged Veld is a heterogeneous mixture of tall woodland, tall shrub land and short woodland forest [53], which are preferred habitat types of browsers, providing their main food resources [30]. Rugged Veld also has a rich grass component including the species Panicum maximum, Urochloa mossambicensis and Schmidittia pappaphoroides [53] that are main food resources for grazers and mixed feeders [64]. The highest values of common duiker and great kudu events (Table S5) also lead to significant increase in browsers ratio in Nwambia Sandveld (Figure 4) and not-resettled areas (Table S5). Nwambia Sandveld and not-resettled areas are low thicket forest areas with shrubby condition of Colophospermum mopane [53], providing an important food resource for browsers [94].
Our results give reason to assume that the different species of potential predators in LNP have not yet reached population sizes that might have a significant impact or cause a measurable effect on the distribution pattern of ungulates in the five habitat types, as well as the resettled and not-resettled areas. There is scientific evidence for the existence of a viable population of cheetah (Acinonyx jubatus) in LNP and in the corridors to neighboring Banhine National Park [95]. However, given the size of the respective area, it is not surprising that these cheetahs do not cause a measurable effect on the LH communities in LNP. The spatial avoidance in agro-pastoralist human settlements areas and harassment of domestic dogs during illegal poaching by predators can also be the other reason of our findings. Similarly, different researchers [51,52] in LNP documented low occurrence of predators (cheetahs) in the core area of the park (Shingwedzi Valley) that contains villages and near agro-pastoralist communities along the not-resettled area. Furthermore, the authors found high levels of livestock and bushmeat poaching without predators and their signals in an abandoned village related to the undergoing voluntary resettlement of communities from the core area. Regarding species-specific distribution (naïve occupancy) of the 15 large herbivores target species, seven (African elephant, African buffalo, plains zebra, greater kudu, nyala, impala and common duiker) are widely distributed among habitat types and from resettled to not-resettled areas, and four (blue wildebeest, sable antelope, eland and bushbuck) are narrowly distributed. In the seven widely distributed species, there is a strong support for effects of habitat type on naïve occupancy because the occupancy range of five of them is significantly wider. However, there is a little support for effects of increasing distance from resettled to not-resettled areas on naïve occupancy because the occupancy range of only two of those seven species is significantly wider (Figure 5a,b). This shows clearly that a natural colonization process of different LH species has already started in the LNP. This natural colonization process appears to be more linked with the availability of habitat features than the distance between sampling site and the origin of large herbivore resettlement. Our results are corroborated by park censuses data (2006–2014) [47,48,49,90]. We found that blue wildebeest, sable antelope and bushbuck had not expanded their range too far to the East from Lebombo North, possibly due to organismic limitations caused by these species’ ecological adaptations and their inability to invade habitats disturbed by human settlements in the Shingwedzi Valley. This is consistent with findings by Limpopo aerial censuses that recorded the above-mentioned species to occur only in the “Old Sanctuary” and surroundings [47,49]. Although no sable was actively introduced to the LNP from KNP, their numbers could probably be experiencing declines because it is currently the case in the KNP. Furthermore, sable antelopes are low density herbivores [96] with a restricted distribution throughout the landscape.
5. Conclusions
Our results, particularly the association of most LH community parameters with habitat types rather than distance to initial release/recolonization, together with the species-specific and guild-specific response patterns of large herbivores, suggest Limpopo National Park to be already in an intermediate stage of restoration. Areas with human settlements were avoided by reintroduced animals. The park will likely reach an advanced stage of restoration when the ongoing process of resettlement of communities from some habitat types (Shrubveld on calcrete and Salvadora angustifolia floodplains) in the Shingwedzi valley ends. Our results highlight the importance of post-release monitoring of reintroduced wildlife as a tool to assess the success of ecological restoration initiatives in transboundary conservation areas. Moreover, our study shows that LNP has an intrinsic conservation value to contribute to the development of the Great Limpopo Transfrontier Park. Besides the regional significance, our results represent arguments for the conservation of various large herbivore species, their habitats and the potential to create basis for management and policy making for further development of the Great Limpopo Transfrontier Park. Our study also provides a key to better understanding and contributing to the current knowledge of large herbivores conservation biology in an unfenced/fenced (LNP/KNP) landscape mixture that is also impacted by agro-pastoralist and human settlements. Because many protected areas in Sub-Saharan Africa are also human dominated landscapes, our results can therefore be applied across these areas for conservation planning and management.
Supplementary Materials
The following are available online at https://www.mdpi.com/article/10.3390/d13100456/s1, Table S1: Camera trap survey effort and detailed information about camera trap performance in five habitat types, resettled and not-resettled areas in Limpopo National Park. Table S2: Checklist of overall species recorded grouped by taxonomic order and family in Limpopo National Park. Table S3: Comparisons of Shannon–diversity index using Diversity t test among habitat types, between resettled and not-resettled areas in Limpopo National Park. Table S4: Pairwise comparison (One-Way ANOVA or Kruskal-Wallis test) of grazer–browser–mixed feeder ratio within and among habitat types, between resettled and not-resettled areas. Table S5: Relative abundance index based on detected individuals per species per 100 trap nights among habitat types, between resettled and not-resettled areas in Limpopo National Park. Figure S1: Specie-specific naïve occupancy of reintroduced large herbivores among habitat types in the Limpopo National Park.
Author Contributions
Conceptualization and methodology: D.V.R., T.G., V.A.M. and U.Z.; sample collection: D.V.R. and V.A.M.; data curation: D.V.R. and T.G.; data analysis: D.V.R., T.G., V.A.M. and U.Z.; writing-original draft preparation: D.V.R., T.G. and V.A.M.; writing-review and editing: D.V.R., T.G., V.A.M. and U.Z.; funding acquisition: U.Z. and T.G.; supervision: U.Z., T.G. and V.A.M.; project administration: U.Z., T.G. and V.A.M. All authors have read and agreed to the published version of the manuscript.
Funding
This research was funded by the German Development Bank (KFW).
Institutional Review Board Statement
Not applicable.
Data Availability Statement
Data sharing is not applicable to this article.
Acknowledgments
We thank the German Development Bank (KFW) for funding the study, the Zwillenberg-Tietz Foundation for supporting physical meetings of project partners to discuss, prepare and plan the field work, the National Administration of Conservation Areas (ANAC) of Mozambique for allowing us to conduct this study in the Limpopo National Park and for the necessary data collecting permits (Permit Nr. 22/2019). We gratefully acknowledge the Limpopo National Park Administration for granting our safety during data collection in the field and for providing us with a helicopter for the preliminary assessment of the study area.
Conflicts of Interest
The authors declare no conflict of interest. The funders had no role in the design of the study; in the collection, analyses, or interpretation of data; in the writing of the manuscript, or in the decision to publish the results.
References
- Winnie, J.A.; Cross, P.; Getz, W. Habitat quality and heterogeneity influence distribution and behaviour in African buffalo (Syncerus caffer). Ecology 2008, 89, 1457–1468. [Google Scholar] [CrossRef] [Green Version]
- Anderson, T.M.; White, S.; Davis, B.; Erhardt, R.; Palmer, M.; Swanson, A.; Kosmala, M.; Packer, C. The spatial distribution of African savannah herbivores: Species associations and habitat occupancy in a landscape context. Phil. Trans. R. Soc. B 2016, 371, 20150314. [Google Scholar] [CrossRef]
- Sawyer, H.; Merkle, J.A.; Middleton, A.D.; Dwinnell, S.P.H.; Monteith, K.L. Migratory plasticity is not ubiquitous among large herbivores. J. Anim. Ecol. 2018, 88, 450–460. [Google Scholar] [CrossRef]
- Zeller, U.; Starik, N.; Göttert, T. Biodiversity, land use and ecosystem services—An organismic and comparative approach to different geographical regions. Glob. Ecol. Conserv. 2017, 10, 114–125. [Google Scholar] [CrossRef]
- Stoldt, M.; Göttert, T.; Mann, C.; Zeller, U. Transfrontier Conservation Areas and Human-Wildlife Conflict: The Case of the Namibian Component of the Kavango-Zambezi (KAZA) TFCA. Sci. Rep. 2020, 10, 7964. [Google Scholar] [CrossRef]
- Smuts, G.L. Home range size for Burchell’s Zebra—Equus burchelli antiquorum—From the Kruger National Park. Koedoe 1975, 18, 139–146. [Google Scholar] [CrossRef] [Green Version]
- Shannon, G.; Page, B.; Slotow, R.; Duffy, K. African elephant home range and habitat selection in Pongola Game Reserve, South Africa. Afr. Zool. 2006, 41, 37–44. [Google Scholar] [CrossRef]
- Owen-Smith, N.; Martin, J. Identifying Space Use at Foraging Arena Scale within the Home Ranges of Large Herbivores. PLoS ONE 2015, 10, e0128821. [Google Scholar] [CrossRef]
- Göttert, T.; Schöne, J.; Hodges, J.K.; Böer, M. Habitat use and spatial organisation of relocated black rhinos in Namibia. Mammalia 2010, 74, 35–42. [Google Scholar] [CrossRef]
- Jones, J.P.G. Monitoring species abundance and distribution at the landscape scale. J. Appl. Ecol. 2011, 48, 9–13. [Google Scholar] [CrossRef]
- Chirima, J.G. Habitat Suitability Assessments for Sable Antelope. Ph.D. Thesis, University of the Witwatersrand, Johannesburg, South Africa, 2009. [Google Scholar]
- Cornélis, D.; Benhamou, S.; Janeau, G.; Morellet, N.; Ouedraogo, M.; Visscher, M.N.E. Spatiotemporal dynamics of forage and water resources shape space use of West African savanna buffaloes. J. Mammal. 2011, 92, 1287–1297. [Google Scholar] [CrossRef] [Green Version]
- Boyce, M.S.; Johnson, C.J.; Merrill, E.H.; Nielsen, S.E.; Solberg, E.J.; van Moorter, B. Can habitat selection predict abundance? J. Anim. Ecol. 2016, 85, 11–20. [Google Scholar] [CrossRef] [PubMed] [Green Version]
- Sinclair, A.R.E. Does Interspecific Competition or Predation Shape the African Ungulate Community? J. Anim. Ecol. 1985, 54, 899–918. [Google Scholar] [CrossRef]
- Redfern, J.V.; Grant, R.; Biggs, H.; Getz, W.M. Surface water constraints on herbivore foraging in the Kruger National Park, South Africa. Ecology 2003, 84, 2092–2107. [Google Scholar] [CrossRef]
- Roath, L.R.; Krueger, W.C. Cattle Grazing and Behavior on a Forested Range. J. Range Manag. 1982, 35, 332–338. [Google Scholar] [CrossRef]
- Duparc, A.; Garel, M.; Marchand, P.; Dubray, D.; Maillard, D.; Loisona, A. Revisiting the functional response in habitat selection for large herbivores: A matter of spatial variation in resource distribution? Behav. Ecol. 2019, 30, 1725–1733. [Google Scholar] [CrossRef]
- Holbrook, J.D.; Olson, L.E.; de Cesare, N.J.; Hebblewhite, M.; Squires, J.R.; Steenweg, R. Functional responses in habitat selection: Clarifying hypotheses and interpretations. Ecol. Appl. 2019, 29, e01852. [Google Scholar] [CrossRef]
- Bell, R.H.V. A Grazing Ecosystem in the Serengeti. Sci. Am. 1971, 225, 86–93. [Google Scholar] [CrossRef]
- Jarman, P.J. The Social Organisation of Antelope in Relation to Their Ecology. Behaviour 1974, 48, 215–267. [Google Scholar] [CrossRef] [Green Version]
- Olff, H.; Ritchie, M.E.; Prins, H.H.T. Global environmental controls of diversity in large herbivores. Nature 2002, 415, 901–904. [Google Scholar] [CrossRef] [PubMed] [Green Version]
- Hopcraft, J.G.C.; Anderson, T.M.; Perez-Vila, S.; Mayemba, E.; Olff, H. Body size and the division of niche space: Food and predation differentially shape the distribution of Serengeti grazers. J. Anim. Ecol. 2012, 81, 201–213. [Google Scholar] [CrossRef] [PubMed] [Green Version]
- Le Roux, E.; van Veenhuisen, L.S.; Kerley, G.I.H.; Cromsigt, J.P.G.M. Animal body size distribution influences the ratios of nutrients supplied to plants. Proc. Natl. Acad. Sci. USA 2020, 117, 22256–22263. [Google Scholar] [CrossRef]
- Riginos, C.; Grace, J.B. Savanna tree density, herbivores, and the herbaceous community: Bottom-up vs. top-down effects. Ecology 2008, 89, 2228–2238. [Google Scholar] [CrossRef] [Green Version]
- Cromsigt, J.P.G.; Prins, H.H.T.; Olff, H. Habitat heterogeneity as a driver of ungulate diversity and distribution patterns: Interaction of body mass and digestive strategy. Divers. Distrib. 2009, 15, 513–522. [Google Scholar] [CrossRef] [Green Version]
- Du Toit, J.T.; Owen-Smith, N. Body Size, Population Metabolism, and Habitat Specialization Among Large African Herbivores. Am. Nat. 1989, 133, 736–740. [Google Scholar] [CrossRef] [Green Version]
- Traill, L.W. Seasonal utilization of habitat by large grazing herbivores in semi-arid Zimbabwe. S. Afr. J. Wildl. Res. 2004, 34, 13–24. [Google Scholar]
- Skinner, J.D.; Chimimba, C. The Mammals of the Southern African Sub-Region, 3rd ed.; Cambridge University Press: Cambridge, UK, 2005. [Google Scholar]
- Musiega, D.E.; Kazadi, S.-N.; Fukuyama, K. A framework for predicting and visualizing the East African wildebeest migration-route patterns in variable climatic conditions using geographic information system and remote sensing. Ecol. Res. 2006, 21, 530–543. [Google Scholar] [CrossRef]
- Owen-Smith, N.; Cooper, S.M. Nutritional ecology of a browsing ruminant, the kudu (Traglaphus strepsiceros), through the seasonal cycle. J. Zool. 1989, 219, 29–43. [Google Scholar] [CrossRef]
- Botha, M.; Stock, W. Stable isotope composition of faeces as an indicator of seasonal diet selection in wild herbivores in Southern Africa. S. Afr. J. Sci. 2005, 101, 371–374. [Google Scholar]
- Administração Nacional das Áreas de Conservação (ANAC). Limpopo National Park Management and Development Plan; Ministério do Turismo: Maputo, Mozambique, 2003.
- Mavhunga, C.; Spierenburg, M. Transfrontier Talk, Cordon Politics: The Early History of the Great Limpopo Transfrontier Park in Southern Africa, 1925–1940. J. S. Afr. Stud. 2009, 35, 715–735. [Google Scholar] [CrossRef]
- Massé, F. The Political Ecology of Human-Wildlife Conflict: Producing Wilderness, Insecurity, and Displacement in the Limpopo National Park. Conservat. Soc. 2016, 14, 100–111. [Google Scholar] [CrossRef]
- Hatton, J.; Couto, M.; Oglethorpe, J. Biodiversity and War: A Case Study of Mozambique; Biodiversity Support: Washington, DC, USA, 2001. [Google Scholar]
- Hofmeyr, M. Translocation of elephant from the Kruger National Park to the Limpopo National Park as part of the initial development of the greater Limpopo Transfrontier Park. In Proceedings of the EMOA Elephant Symposium, Pilanesberg National Park, South Africa, 13–17 September 2004. [Google Scholar]
- Lunstrum, E. Green grabs, land grabs and the spatiality of displacement: Eviction from Mozambique’s Limpopo National Park. Area 2016, 48, 142–152. [Google Scholar] [CrossRef]
- Bazin, F.; Quesne, G.; Nhancale, C.; Aberlen, E. Ex Post Written and Audiovisual Evaluation of the Limpopo National Park Development Project; Agence Française de Développement: Paris, France, 2016; pp. 1–204. [Google Scholar]
- Mabunda, D.; Venter, F.; Pienaar, D.; Theron, P. Transfrontier Conservation Areas: The Southern African experience. In Parks, Peace, and Partnership: Global Initiatives in Transboundary Conservation; Quinn, M.S., Broberg, L., Freimund, W., Eds.; University of Calgary Press: Calgary, Canada, 2012; Volume 4, pp. 176–178. [Google Scholar]
- Mabunda, D.; Pienaar, D.J.; Verhoef, J. The Kruger National Park: A Century of Management and Research. In The Kruger Experience: Ecology and Management of Savanna Heterogeneity; du Toit, J.T., Rogers, K.K., Biggs, H.C., Eds.; Island Press: Washington, DC, USA, 2003; pp. 5–8. [Google Scholar]
- Scillitani, L.; Darmon, G.; Monaco, A.; Cocca, G.; Sturaro, E.; Rossi, L.; Ramanzin, M. Habitat Selection in Translocated Gregarious Ungulate Species: An Interplay between Sociality and Ecological Requirements. J. Wildl. Manag. 2013, 77, 761–769. [Google Scholar] [CrossRef]
- Richardson, K.M.; Doerr, V.; Ebrahimi, M.; Lovegrove, T.G.; Parker, K.A. Considering dispersal in reintroduction and restoration planning. In Advances in Reintroduction Biology of Australian and New Zealand Fauna; Armstrong, D.B., Hayward, M.W., Moro, D., Seddon, P.J., Eds.; CSIRO Publishing: Melbourne, Australia, 2015; pp. 59–92. [Google Scholar]
- Larkin, J.L.; Cox, J.J.; Wichrowski, M.W.; Dzialak, M.R.; Maehr, D.S. Influences on Release-Site Fidelity of Translocated Elk. Restor. Ecol. 2004, 12, 97–105. [Google Scholar] [CrossRef]
- Milgroom, J.; Spierenburg, M. Induced Volition: Resettlement from the Limpopo National Park, Mozambique. J. Contemp. Afr. Stud. 2008, 26, 435–448. [Google Scholar] [CrossRef]
- Muposhi, V.K.; Gandiwa, E.; Chemura, A.; Bartels, P.; Makuza, S.M.; Madiri, T.H. Habitat Heterogeneity Variably Influences Habitat Selection by Wild Herbivores in a Semi-Arid Tropical Savanna Ecosystem. PLoS ONE 2016, 11, e0163084. [Google Scholar] [CrossRef] [Green Version]
- Murwendo, T.; Murwira, A.; Masocha, M. Modelling and predicting mammalian wildlife abundance and distribution in semi-arid Gonarezhou National Park, South Eastern Zimbabwe. EFCC 2020, 1, 151–163. [Google Scholar] [CrossRef]
- Whyte, I.; Swanepoel, B. An Aerial Census of the Shingwedzi Basin Area of the Limpopo National Park in Mozambique; Census Report 02; South African National Parks: Pretoria, South Africa, 2006. [Google Scholar]
- Stephenson, A. Parque Nacional Do Limpopo: Aerial Wildlife Census. Mozambique; Census Report; Limpopo National Park: Maputo, Mozambique, 2013. [Google Scholar]
- Grossmann, F.; Lopes Pereira, C.; Chambal, D.; Maluleque, G.; Bendzane, E.; Parker, N.; Foloma, M.; Ntumi, C.; Polana, E.; Nelson, A. Aerial Survey of Elephant, Other Wildlife and Human Activity in Limpopo National Park and the Southern Extension; Census Report; Wildlife Conservation Society: New York, NY, USA, 2014. [Google Scholar]
- Brito, R.; Julaia, C. Descrição Das Secas Na Bacia Do Limpopo Em Moçambique; UEM—Faculdade de Agronomia e Engenharia Florestal: Maputo, Mozambique, 2007. [Google Scholar]
- Andresen, L.; Everatt, K.T.; Somers, M.J. Use of site occupancy models for targeted monitoring of the cheetah. J. Zool. 2014, 292, 212–220. [Google Scholar] [CrossRef] [Green Version]
- Andresen, L. Cheetah distribution, threats and landscape connectivity in South-Western Mozambique; Annual Progress Report; Nelson Mandela Metropolitan University: South Africa, 2015. [Google Scholar]
- Stalmans, M.; Gertenbach, W.P.D.; Carvalho-Serfontein, F. Plant Communities and Landscapes of the Parque Nacional Do Limpopo, Moçambique. Koedoe 2004, 47, 61–81. [Google Scholar] [CrossRef]
- Estes, R.D. The Behavior Guide to African Mammals: Including Hoofed Mammals, Carnivores, Primates, 1st ed.; University of California Press: Berkeley, CA, USA, 2012. [Google Scholar]
- Ribeiro, N.; Ruecker, G.; Govender, N.; Macandza, V.; Pais, A.; Machava, D.; Chauque, A.; Lisboa, S.N.; Bandeira, R. The influence of fire frequency on the structure and botanical composition of savanna ecosystems. Ecol. Evol. 2019, 9, 8253–8264. [Google Scholar] [CrossRef]
- Woog, F.; Renner, S.C.; Fjeldså, J. Tips for bird surveys and censuses in countries without existing monitoring schemes. In Manual on Field Recording Techniques and Protocols for All Taxa Biodiversity Inventories and Monmitoring; Eymann, J., Degreef, J., Häuser, C., Monje, J.C., Samyn, Y., Vanden Spiegel, D., Eds.; The Belgian Development Cooperation: Brussels, Belgium, 2010; Volume 8, p. 570. [Google Scholar]
- Rovero, F.; Zimmermannc, F.; Berzid, D.; Meeke, P. “Which camera trap type and how many do I need?” A review of camera features and study designs for a range of wildlife research applications. Hystrix It. J. Mamm. 2013, 24, 148–156. [Google Scholar] [CrossRef]
- Rovero, F.; Martin, E.; Rosa, M.; Ahumada, J.A.; Spitale, D. Estimating Species Richness and Modelling Habitat Preferences of Tropical Forest Mammals from Camera Trap Data. PLoS ONE 2014, 9, e103300. [Google Scholar] [CrossRef] [PubMed]
- Debata, S.; Swain, K.K. Estimating Mammalian Diversity and Relative Abundance Using Camera Traps in a Tropical Deciduous Forest of Kuldiha Wildlife Sanctuary, Eastern India. Mammal Study 2018, 43, 45–53. [Google Scholar] [CrossRef]
- Mena, J.L.; Yagui, H.; Tejeda, V.; Cabrera, J.; Pacheco-Esquivel, J.; Rivero, J.; Pastor, P. Abundance of jaguars and occupancy of medium- and large-sized vertebrates in a transboundary conservation landscape in the Northwestern Amazon. Glob. Ecol. Conserv. 2020, 23, e01079. [Google Scholar] [CrossRef]
- Tobler, M.W.; Carrillo-Percastegui, S.E.; Powell, G. Habitat use, activity patterns and use of mineral licks by five species of ungulate in South-Eastern Peru. J. Trop. Ecol. 2009, 25, 261–270. [Google Scholar] [CrossRef]
- Rovero, F.; Tobler, M.; Sanderson, J. Camera trap for inventorying terrestrial vertebrate. In Manual on field recording techniques and protocols for All Taxa Biodiversity Inventories and Monmitoring; Eymann, J., Degreef, J., Häuser, C., Monje, J.C., Samyn, Y., Vanden Spiegel, D., Eds.; The Belgian Development Cooperation: Brussels, Belgium, 2010; Volume 8, pp. 102–120. [Google Scholar]
- Walker, C. Signs of the Wild. A field guide to the spoor & signs of the mammals of Southern Africa, 5th ed.; Struik Publishers: Cape Town, South Africa, 1997. [Google Scholar]
- Stuart, C.T.; Stuart, M.D. Field guide to mammals of Southern Africa, 3rd ed.; Struik Publishers: Cape Town, South Africa, 2001. [Google Scholar]
- Meek, P.D.; Ballard, G.; Claridge, A.; Kays, R.; Moseby, K.; O’Brien, T.; O’Connell, A.; Sanderson, J.; Swann, D.E.; Tobler, M.; et al. Recommended guiding principles for reporting on camera trapping research. Biodivers. Conserv. 2014, 23, 2321–2343. [Google Scholar] [CrossRef]
- O’Brien, T.G.; Kinnaird, M.F.; Wibisono, H.T. Crouching tigers, hidden prey: Sumatran tiger and prey populations in a tropical forest landscape. Anim. Conserv. 2003, 6, 131–139. [Google Scholar] [CrossRef] [Green Version]
- Tobler, M.W.; Carrillo-Percastegui, S.E.; Pitman, R.L.; Mares, R.; Powell, G. An evaluation of camera traps for inventorying large- and medium-sized terrestrial rainforest mammals. Anim. Conserv. 2008, 11, 169–178. [Google Scholar] [CrossRef]
- Bernard, H.; Ahmad, A.H.; Brodie, J.; Giordano, A.J.; Lakim, M.; Amat, R.; Hue, S.K.P.; Khee, L.S.; Tuuga, A.; Malim, P.T.; et al. Camera-trapping survey of mammals in and around Imbak Canyon Conservation Area in Sabah, Malaysian Borneo. Raffles Bull. Zool. 2013, 61, 861–870. [Google Scholar]
- Garriga, R.M. Camera Trap Survey in the Western Area Peninsular Forest Reserve, Sierra Leone; Final Report; Tacugama Chimpanzee Sanctuary: Freetown, Sierra Leone, 2012. [Google Scholar]
- Palei, H.S.; Pradhan, T.; Sahu, H.K.; Nayak, A.K. Estimating Mammalian Abundance Using Camera Traps in the Tropical Forest of Similipal Tiger Reserve, Odisha, India. Proc. Zool. Soc. 2016, 69, 181–188. [Google Scholar] [CrossRef]
- Jędrzejewski, W.; Puerto, M.F.; Goldberg, J.F.; Hebblewhite, M.; Abarca, M.; Gamarra, G.; Calderón, L.E.; Romero, J.F.; Viloria, A.L.; Carreño, R.; et al. Density and population structure of the jaguar (Panthera onca) in a protected area of Los Llanos, Venezuela, from 1 year of camera trap monitoring. Mammal Res. 2017, 62, 9–19. [Google Scholar] [CrossRef] [Green Version]
- Evans, M.J.; Rittenhouse, T.A.G. Evaluating spatially explicit density estimates of unmarked wildlife detected by remote cameras. J. Appl. Ecol. 2018, 55, 2565–2574. [Google Scholar] [CrossRef]
- Bowkett, A.E.; Rovero, F.; Marshall, A.R. The Use of camera-trap data to model habitat use by antelope species in the Udzungwa Mountain Forests, Tanzania. Afr. J. Ecol. 2008, 46, 47–487. [Google Scholar] [CrossRef]
- Oberosler, V.; Groff, C.; Iemma, A.; Pedrini, P.; Rovero, F. The influence of human disturbance on occupancy and activity patterns of mammals in the Italian Alps from systematic camera trapping. Mamm. Biol. 2017, 87, 50–61. [Google Scholar] [CrossRef]
- Colwell, R.K. Estimates: Statistical Estimation of Species Richness and Shared Species from Samples. Available online: http://viceroy.eeb.uconn.edu/estimates (accessed on 3 November 2020).
- Willott, S.J. Species accumulation curves and the measure of sampling effort. J. Appl. Ecol. 2001, 38, 484–486. [Google Scholar] [CrossRef]
- Ugland, K.I.; Gray, J.S.; Ellingsen, K.E. The species-accumulation curve and estimation of species richness. J. Anim. Ecol. 2003, 72, 888–897. [Google Scholar] [CrossRef] [Green Version]
- Meyer, N.F.V.; Esser, H.J.; Moreno, R.; van Langevelde, F.; Liefting, Y.; Oller, D.R.; Vogels, C.B.F.; Carver, A.D.; Nielsen, C.K.; Jansen, P.A. An assessment of the terrestrial mammal communities in forests of Central Panama, using camera-trap surveys. J. Nat. Conserv. 2015, 26, 28–35. [Google Scholar] [CrossRef] [Green Version]
- Edwards, D.P.; Ansell, F.A.; Ahmad, A.H.; Nilus, R.; Hamer, K.C. The Value of Rehabilitating Logged Rainforest for Birds. Conserv. Biol. 2009, 23, 1628–1633. [Google Scholar] [CrossRef]
- Hammer, O.; Ryan, P.D.; Harper, D.A.T. PAST: Paleontological Statistics Software Package for Education and Data Analysis. Available online: https://palaeoelectronica.org/2001_1/past/issue1_01.htm (accessed on 10 January 2021).
- Jenks, K.E.; Chanteap, P.; Damrongchainarong, K.; Cutter, P.; Cutter, P.; Redford, T.; Lynam, A.J.; Howard, J.; Leimgruber, P. Using Relative Abundance Indices from Camera-Trapping to Test Wildlife Conservation Hypotheses—An Example from Khao Yai National Park, Thailand. Trop. Conserv. Sci. 2011, 4, 113–131. [Google Scholar] [CrossRef] [Green Version]
- Fiderer, C.; Göttert, T.; Zeller, U. Spatial interrelations between raccoons (Procyon lotor), red foxes (Vulpes vulpes), and ground-nesting birds in a Special Protection Area of Germany. Eur. J. Wildl. Res. 2019, 65, 1–14. [Google Scholar] [CrossRef] [Green Version]
- Rottstock, T.; Göttert, T.; Zeller, U. Relatively undisturbed African savannas—an important reference for assessing wildlife responses to livestock grazing systems in European rangelands. Glob. Ecol. Conserv. 2020, 23, e01124. [Google Scholar] [CrossRef]
- Rovero, F.; Marshall, A.R. Camera trapping photographic rate as an index of density in forest ungulates. J. Appl. Ecol. 2009, 46, 1011–1017. [Google Scholar] [CrossRef] [Green Version]
- Liu, X.; Wu, P.; Songer, M.; Cai, Q.; He, X.; Zhu, Y.; Shao, X. Monitoring wildlife abundance and diversity with infra-red camera traps in Guanyinshan Nature Reserve of Shaanxi Province, China. Ecol. Indic. 2013, 33, 121–128. [Google Scholar] [CrossRef]
- Starik, N.; Mbango, O.K.; Bengsch, S.; Göttert, T.; Zeller, U. Landscape Transformation Influences Responses of Terrestrial Small Mammals to Land Use Intensity in North-Central Namibia. Diversity 2020, 12, 488. [Google Scholar] [CrossRef]
- Hedwig, D.; Kienast, I.; Bonnet, M.; Curran, B.K.; Courage, A.; Boesch, C.; Kühl, H.S.; King, T. A camera trap assessment of the forest mammal community within the transitional savannah-forest mosaic of the Batéké Plateau National Park, Gabon. Afr. J. Ecol. 2018, 56, 777–790. [Google Scholar] [CrossRef] [Green Version]
- Moore, J.F.; Hines, J.E.; Mulindahabi, F.; Masozera, M.K. Factors affecting species richness and distribution spatially and temporally within a protected area using multi-season occupancy models. Anim. Conserv. 2019, 22, 503–514. [Google Scholar] [CrossRef]
- Pezzullo, J.C. Exact Binomial and Poisson Confidence Intervals. Available online: https://statpages.info/confint.html (accessed on 12 January 2020).
- Stephenson, A. Parque Nacional Do Limpopo: Aerial Wildlife Census; Census Report; Limpopo National Park: Maputo, Mozambique, 2010. [Google Scholar]
- Jones, C.L.; Smithers, N.L.; Scholes, M.C.; Scholes, R.J. The Effect of Fire Frequency on the Organic Components of a Basaltic Soil in the Kruger National Park. S. Afr. J. Plant Soil. 1990, 7, 236–238. [Google Scholar]
- Ahumada, J.A.; Silva, C.E.F.; Gajapersad, K.; Hallam, C.; Hurtado, J.; Martin, E.; McWilliam, A.; Mugerwa, B.; O’Brien, T.; Rovero, F.; et al. Community structure and diversity of tropical forest mammals: Data from a global camera trap network. Phil. Trans. R. Soc. B 2011, 366, 2703–2711. [Google Scholar] [CrossRef]
- Turner, I.M. Species Loss in fragments of tropical rain forest: A review of the evidence. J. Appl. Ecol. 1996, 33, 200–209. [Google Scholar] [CrossRef]
- McNaughton, S.J.; Georgiadis, N.J. Ecology of African Grazing and Browsing Mammals. Ann. Rev. Ecol. Syst. 1986, 17, 39–65. [Google Scholar] [CrossRef]
- Andresen, L.; Everatt, K.T.; Somers, M.J.; Purchase, G.K. Evidence for a Resident Population of Cheetah in the Parque Nacional Do Limpopo, Mozambique. S. Afr. J. Wildl. Res. 2012, 42, 144–146. [Google Scholar] [CrossRef] [Green Version]
- Owen-Smith, N.; Mills, M.G.L. Shifting prey selection generates contrasting herbivore dynamics within a large-mammal predator–prey web. Ecology 2008, 89, 1120–1133. [Google Scholar] [CrossRef] [PubMed] [Green Version]
Publisher’s Note: MDPI stays neutral with regard to jurisdictional claims in published maps and institutional affiliations. |
© 2021 by the authors. Licensee MDPI, Basel, Switzerland. This article is an open access article distributed under the terms and conditions of the Creative Commons Attribution (CC BY) license (https://creativecommons.org/licenses/by/4.0/).