Article

AFLP-Based Analysis of Variation and Population Structure in Mutagenesis Induced Faba Bean

1
Legume Research Group, Plant Production Department, Faculty of Food and Agriculture Sciences, King Saud University, P.O. BOX 2460, Riyadh 11451, Saudi Arabia
2
Department of Agronomy, Faculty of Agriculture, Universitas Gadjah Mada, Yogyakarta 55281, Indonesia
*
Authors to whom correspondence should be addressed.
Diversity 2020, 12(8), 303; https://doi.org/10.3390/d12080303
Submission received: 28 June 2020 / Revised: 30 July 2020 / Accepted: 1 August 2020 / Published: 3 August 2020
(This article belongs to the Section Plant Diversity)

Abstract

:
Genetic diversity enrichment is urgently necessary to develop climate-resilient faba bean cultivars. The present study aimed to measure the enrichment of genetic diversity and changes in the population structure of faba bean, following induced mutagenesis. 120 samples, including 116 M2 mutant plants, generated by exposing the ILB4347 accession to four mutagen treatments (25 and 50 Gray gamma radiation and 0.01%, and 0.05% diethyl sulfate) and four reference genotypes were characterized using 11 amplified fragment length polymorphism (AFLP) primer combinations. The AFLP markers generated 1687 polymorphic alleles, including 756 alleles (45%) that were detected infrequently (f ≤ 0.1). The total allele count of the mutant plants ranged from 117 to 545. We observed a wide range of banding patterns and counts among the mutant plants, showing the high genetic diversity induced by mutation. Mutations also changed the population structure, by altering 31.78% of the total membership coefficient (Q). Although mutations changed the population structure, Nei’s genetic distance showed that the mutant population remained closely related to its control parent. This is the first report examining genetic diversity and population changes in faba bean mutant populations and, thus, could facilitate the application of induced mutagenesis during faba bean breeding.

1. Introduction

Modern plant breeding and agronomic techniques have increased global food production by an average of 32 million metric tons per year, between 1961 to 2007. However, the Food and Agriculture Organization (FAO) has predicted more than an additional 70% of food will be necessary to feed nine billion people in 2050, which will require an increase in food production of 44 million metric tons per year, annual incremental increases of 37% [1,2]. Future crop production is likely to face other challenges, such as the impacts of climate change. Therefore, crops that are resilient to changes in the environment, including biotic and abiotic stresses, are urgently necessary to adequately feed the growing population.
The development of climate-resilient crops depends on the availability of genetic diversity. However, many studies have reported that crop improvements have been accompanied by reductions in genetic diversity [3,4,5,6]. Liu et al. [7] explained that domestication, the oldest breeding method recognized by human history, has reduced genetic diversity by changing the pattern of gene expression. Another breeding method that has been associated with reduced crop genetic diversity is intraspecific hybridization, through the utilization of similar parents [8]. For example, Fu et al. [3] explained that the reduction in the average genetic diversity among Canadian oat genotypes that have been released since 1950 may due to the utilization of the same resistant parental lines, which was supported by the finding of allelic reduction, as revealed by simple sequence repeat (SSR) markers. Although the reductions in genetic diversity at the genomic level that are caused by plant breeding practices are minor, high allelic reductions among chromosomal segments have been recorded at the individual level [6].
Faba beans represent the seventh most produced legume crop, worldwide, but have been recorded with the lowest yield-growth rate among legume crops, with only a 0.8% increase in yields between 1994 to 2010 [9]. These limited yield increases are due to the yield instability of faba beans, often associated with abiotic and biotic stresses [10]. Although no comprehensive study has demonstrated the declining genetic diversity of faba beans associated with crop improvements, a study conducted by Gong et al. [11], using 11 expressed sequence tag “EST-SSR” markers on faba bean accessions from China and Europe, revealed that faba bean accessions from China, which is the largest faba bean producer, presented narrow genetic diversity. Recently, Babay et al. [12] found that narrow genetic changes have occurred in Tunisian faba beans during the past 50 years. Therefore, enriching faba bean genetic diversity remains necessary for the development of faba bean varieties that are resistant and tolerant to biotic and abiotic stresses.
Mba [13] suggested that induced mutagenesis can be used to generate new alleles that are important for crop improvements. Many studies have been performed to increase faba bean genetic diversity, using induced mutagenesis [14,15,16,17]. However, most of these studies have examined morphology-based diversity. Studies examining genetic diversity and the population structures of faba beans have been conducted on several population types, using various molecular markers. Genetic diversity and population structure studies have been performed among accessions within the same geographical region, among genotypes/cultivars from different geographical regions and cultivated and wild relatives of faba bean. However, to the best of our knowledge, no studies have examined the genetic diversity and population structures of faba bean mutant populations. The genetic diversity assessments of these populations have used various molecular markers, such as restriction fragment length polymorphism (RFLP) [18], random amplified polymorphic DNA (RAPD) [19], sequence-specific amplification polymorphism (SSAP) [20], amplified fragment length polymorphism (AFLP) [21], inter simple sequence repeat (ISSR) [22], sequence-related amplified polymorphism (SRAP) [23], single-nucleotide polymorphism (SNP) [24], and SSR [25].
However, AFLP-based molecular markers have several advantages over other molecular markers, including high reproducibility and the capacity to generate high-polymorphism bands, without prior knowledge of the DNA sequence. Automated analysis, using a sequencer and software, to compare banding patterns facilitates rapid analysis [26]. Moreover, Kurowska et al. [27] stated that AFLP can be used for genome-wide mutation screening, due to the distribution/high coverage of AFLP markers across the genome. The authors sequenced the AFLP products of barley mutant plants, induced by gamma radiation and N-methyl-N-nitrosourea (MNU), and found that the produced AFLP alleles reflect the organization of the barley genome. This result was strengthened by an in silico restriction analysis, conducted by Caballero et al. [28], which found the high coverage of AFLP markers throughout the genomes of nine eukaryotic species. Due to these advantages, AFLP-based molecular markers are preferred for genetic diversity assessments.
Our previous study [16,17] presented various phenotypic variations as well as novel mutants from faba bean M2 generations that were treated with gamma radiation and diethyl sulfate (DES). A total of 32 mutant types were generated based on 12 qualitative traits. However, these findings did not represent the effectiveness of mutagen on inducing mutation due to the limited number of observed morphological traits. The molecular data could contribute to a more comprehensive picture of genetic diversity induced by mutation. Therefore, the present study aimed to measure the enrichment of genetic diversity and changes in population structures associated with the faba bean population, at the molecular level, following induced mutagenesis. AFLP markers were used to study genetic diversity and population structures of faba bean M2 populations. Moreover, the relationship between molecular and phenotypic data was also studied.

2. Materials and Methods

2.1. Plant Materials, Phenotypic Characterization, and DNA Extraction

Four M2 mutant populations were developed from an M1 generation of the ILB4347 accession. The M1 generation was generated by exposing separate 120 dry seeds to four treatments: two doses of gamma radiation (25 and 50 Gray) and two concentrations of DES (0.01% and 0.05%) [29]. A total of 116 out of 1324 mutant plants, representing 116 mutant families, were chosen from the mutant populations. Selection criteria of selected mutants were based on survival rates at the M1 and M2 generations followed by phenotypic differences as described by our previous study [17]. The phenotypic characterization was based on 12 qualitative traits that include growth habit, standard petal color, wing petal color, the intensity of streak, streak color, and anthocyanin coloration at standard petal, seed coat color, seed shape, hilum color, leaf shape, leaf size, and stem pigmentation. The leaves of 116 M2 mutant plants and four non-mutated reference plants, which served as a genetic diversity baseline, were collected and stored at −80 °C until DNA isolation was performed. DNA isolation was performed using a modified sodium dodecyl sulfate (SDS) protocol, as described by Alghamdi et al. [23]. The four reference genotypes were ILB4347, Hassawi 2, Hassawi 3, and Misr 3, which represented three different regions with wide genetic diversity. ILB4347 is an inbred line from the International Center for Agricultural Research in the Dry Areas (ICARDA), Syria; Hassawi 2 and 3 are landraces from Saudi Arabia; and Misr 3 is a cultivar from Egypt.

2.2. AFLP

The AFLP plant mapping protocol from Applied Bio-systems (ABI, Waltham, MA, USA) was adopted for this study, with some modifications. Samples containing 500 ng genomic DNA were added to 0.2 mL tubes, 5.5 µL of the digestion-ligation mix was added to each sample, and the samples were incubated overnight, at room temperature. TE0.1 (90 mL) was added to each tube and stored at 4 °C. Pre-selective amplification was performed using primers that matched the adapter sequence and included one additional ‘selective’ base (EcoRI + G and MseI + C). In a 96-well PCR plate, the PCR mix was formulated with 10 µL 2× PCR Master Mix (Promega, Madison, WI, USA), 0.5 µL each of EcoRI-G and MseI-C, 2 µL diluted digestion-ligation product, and 7 µL double-distilled water, for a final volume of 20 µL. The PCR parameters were as follows: 72 °C for 2 min, 30 cycles of 94 °C for 30 s, 56 °C for 30 s, 72 °C for 2 min, followed by 60 °C for 10 min, before holding at 4 °C until use. The product was diluted 10 times with TE buffer.
Selective amplification uses the diluted, pre-selective amplification product as the new template. The primers for this reaction had the same sequences as the pre-selective primers, with two and three additional selective bases in EcoRI and MseI primers, respectively. The EcoRI +2 primers were labeled with a fluorescent dye (6-FAM) that could be detected with the ABI 3130xl Genetic Analyzer. In a 96-well PCR plate, the PCR mix was formulated, containing 10 µL 2× PCR Master Mix (Promega, Madison, WI, USA), 1 µL each of the EcoRI +2 and MseI +3 primers, 2 µL diluted pre-selective amplification product, and 6 µL double-distilled water, for a final volume of 20 µL. The PCR parameters were as follows: initial denaturation at 94 °C for 2 min, followed by 10 cycles of 94 °C for 30 s, 66 °C for 30 s, decreasing by 1 °C per cycle, and 72 °C for 2 min, followed by 20 cycles of 94 °C for 30 s, 56 °C for 30 s, and 72 °C for 2 min, and then 60 °C for 30 min, followed by holding at 4 °C until further use.

2.3. Running the AFLP Gel on the ABI 3130xl Genetic Analyzer

Two microliters of the selective amplification product were mixed with 0.15 µL GeneScan 500 LIZ size standard (Applied Biosystems P/N 4322682) and 14.85 µL Hi-Di Formamide (Applied Biosystems P/N 4311320). The mixture was denatured at 94 °C for 5 min and directly placed on ice, prior to loading into the 16-capillary system of the Applied Biosystems 3130xl Genetic Analyzer. A 36 cm capillary array (Applied Biosystems P/N 4315931) and 3130 POP-7 polymers (Applied Biosystems P/N 4352759) were used.

2.4. AFLP-Fragment Analysis

Eleven out of 36 selective combination primers were selected to assess the genetic diversity among the mutant populations. The primer combinations were selected based on gel electrophoresis observations. The AFLP adapter/primer names and sequences used are shown in Supplementary Table S1. AFLP fragment analysis was performed using GeneMapper Analysis Software v3.7 (ABI), and the data were assembled in binary format, with 1 representing the presence of an allele and 0 representing the absence of an allele. The threshold for allele calling was set to 100 relative fluorescence units (rfu). Peaks at 100 rfu or higher were assigned a value of 1 and those with lower rfu values were assigned value of 0. Fragment analysis was performed for allele sizes in the range of 100–500 bp, as recommended by Paris et al. [30]. To avoid biased parameter estimates, the loci or alleles generated from all primers in all samples were checked and corrected, based on Lynch and Milligan’s [31] critical value of (1+ 3 / N )/(2 3 / N ), where N = the number of individuals sampled. Based on this estimation, loci with fewer than four total fragments across all samples were deleted from the analysis. The total number of alleles, total number of bands, average bands per sample, and average bands per allele for each primer were calculated to evaluate the primer combinations. The discrimination power (DP) was calculated by dividing the total number of polymorphic alleles amplified by each primer by the total number of polymorphic alleles obtained for all primers [32].

2.5. Genetic Diversity Parameters and Analysis of Molecular Variance (AMOVA)

The binary matrix displaying the presence/absence of each allele was analyzed further, using the GenAlEx 6.503 complement for MS Excel [33]. The total number of different alleles (Na), the total number of effective alleles (Ne), Shannon’s information index (I), the expected heterozygosity (He), the percentage of polymorphic loci (%P), and the number of private alleles per population were calculated using this approach. The PAST (Paleontological Statistics) v. 3.20 program [34] was used to evaluate pairwise Jaccard genetic similarity, to assess the genetic diversity among the 116 mutant plants and the four reference genotypes. An analysis of molecular variance (AMOVA) was performed, using GenAlEx 6.503 [33], with 9999 permutations. AMOVA was performed by partitioning the genetic variations between five populations which were the reference genotypes and four mutant populations, based on the mutation treatment applied (25 or 50 Gy of gamma radiation or 0.01% or 0.05% of DES).

2.6. Population Structure

The mutant population structure was evaluated using the STRUCTURE 2.3.4 program [35,36,37,38]. The STRUCTURE analysis was performed using an admixture model, with 10,000 burn-in periods and 20,000 Monte Carlo Markov Chain (MCMC) simulations. Ten independent runs were performed for each K value, ranging from 1 to 10, to evaluate the best K. The K value was determined using Evanno’s ΔK, based on Structure Harvester software [39]. Nei’s genetic distance among the mutant populations was calculated, using GenAlEx [33]. Cluster analysis was performed based on the unweighted pair group method, with arithmetic averaging (UPGMA) and principal component analysis (PCA), using the Euclidean similarity index, in the PAST (Paleontological Statistics) v. 3.20 program [34].

3. Results

3.1. AFLP Polymorphism

Eleven AFLP primer combinations were used to assess the genetic diversity among the mutant plants. The characteristics of 11 AFLP primer combinations are presented in Table 1. A total of 1687 polymorphic alleles were generated from 120 samples (116 mutant and four reference genotypes). The number of alleles ranged from 78, for primer combination (EcoRI/MseI) TT/CTT, to 268, for primer combination TG/CTT. The 11 AFLP primer combinations generated 39,362 bands, with an average of 3578.36 bands per primer combination. The average bands per allele ranged from 16.21 to 28.17, with an average of 23.33 bands. All primer combinations exhibited 100% polymorphism, with DP values ranging from 4.62%, for TT/CTT, to 15.89%, for TG/CTT.

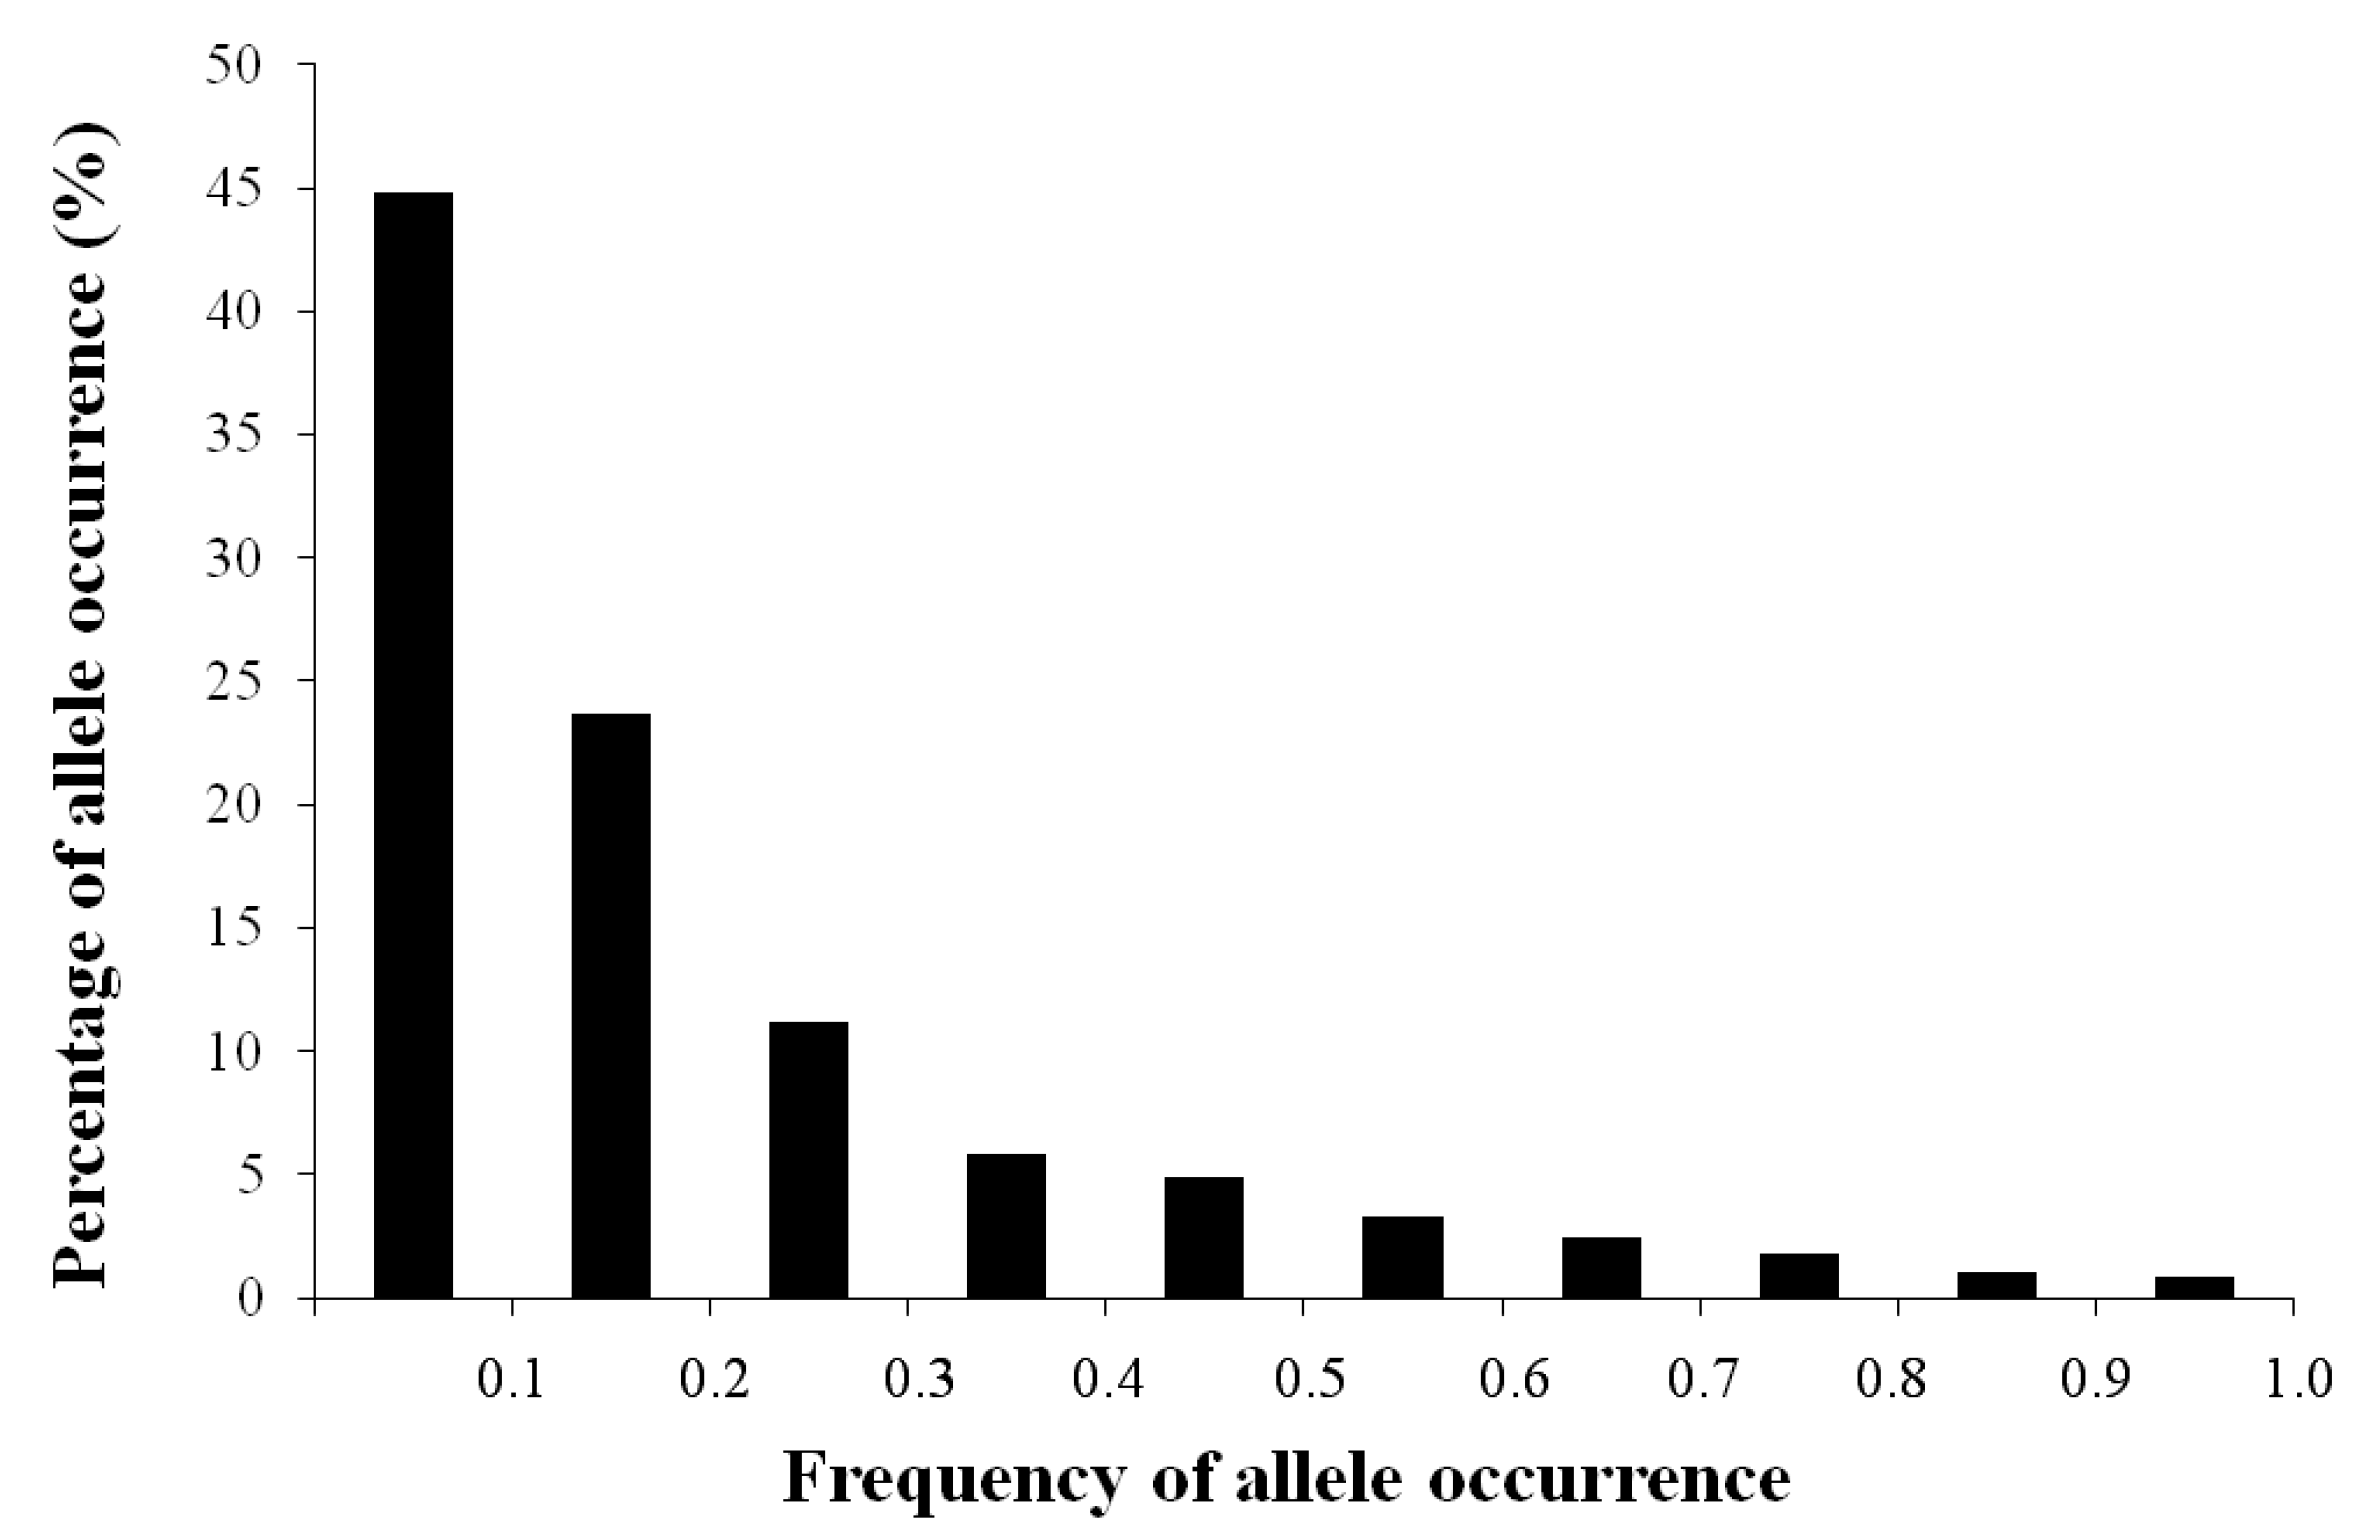
3.2. AFLP Band Abundance

The frequencies of the 1687 alleles detected from among the mutant plants and reference genotypes are presented in Figure 1. The allelic frequency ranged from 0.01 to 0.99, with an average frequency of 0.18. A total of 756 alleles, or 45% of the total alleles detected, were detected at a low frequency (f ≤ 0.1), whereas only 15 alleles, or 1%, were detected at a high frequency (f > 0.9), which indicated that allelic abundance and richness were generated by mutations. ILB4347, the control parent, generated 195 alleles across 11 AFLP primer combinations, whereas the total number of alleles detected in mutant plants ranged from 117 to 545, which revealed that mutations could both generate new alleles and reduce or lose alleles. The mean number of AFLP bands observed throughout the mutant plants was 327.79. Whereas the mean number of AFLP bands observed on reference genotypes was 334.50. The standard deviation of mutant plants and reference genotypes were 108.22 and 161.21, respectively. A wide range of standard deviation on mutant plants and reference genotypes indicated high variation of banding pattern among individuals. Moreover, increasing the level of mutagen treatments increased the mean performance, standard deviation, and range of AFLP bands observed as shown in Table 2.

3.3. Genetic Diversity Parameters and Analysis of Molecular Variance (AMOVA)

The genetic diversity parameter analysis is presented in Table 3. The comparison analysis was divided into three groups. The first group compared the genetic diversity between the mutant population and the reference genotypes. The second group compared the genetic diversity among the reference genotypes and two mutant populations, divided based on the mutagen used (gamma radiation or DES). The third group compared the genetic diversity among the reference genotypes and four mutant populations, divided based on the levels of mutagen used (25 or 50 Gy gamma radiation or 0.01% or 0.05% DES). The genetic diversity parameters revealed that the mutant population generated from ILB4347 was more diverse than the reference genotypes, as indicated by the higher values observed for all the genetic diversity parameters. The number of alleles (Na) and the number of effective alleles (Ne) of mutants and the reference genotypes were 2.000 and 1.008, respectively. The mean values of Shannon’s information index (I) were 0.283 and 0.234, respectively. The expected heterozygosity (He) values were 0.164 and 0.150, and the percentages of polymorphic loci (%P) were 100% and 49.38%, respectively. A total of 820 private alleles were associated with ILB4347 mutant plants, whereas the reference genotypes did not have any private alleles.
Two subpopulations were analyzed, according to the mutagen used, which revealed that the highest genetic diversity was identified in the mutant population induced by DES (Na = 1.697, Ne = 1.256, I = 0.284, He = 0.171). The lowest genetic diversity was recorded for the reference genotypes. The %P ranged from 49.38%, for the reference genotypes, to 99.84%, for ILB4347 mutations induced by gamma radiation. The number of private alleles ranged from 0 to 164. Based on the levels of mutagenic treatments, the highest and lowest genetic diversity values were recorded in the mutant population induced by 50 Gy gamma radiation and the mutant population induced by 25 Gy gamma radiation, respectively. The %P ranged from 49.38%, for the reference genotypes, to 93.06% for the mutant population induced by 25 Gy gamma radiation. The number of private alleles ranged from 0 to 30. These results also revealed that when higher doses or levels of mutagenic treatments were used, broader genetic diversity was generated, regardless of the type of mutagen used. The AMOVA result revealed that 89% of the variation was concentrated within populations, whereas the variation among populations contributed to the remaining 11% of the variation (Table 4). The pairwise Jaccard’s genetic similarity among the 116 mutant plants and the four reference genotypes ranged from 0.06 to 0.67, with an average value of 0.23 (Supplementary Table S2).

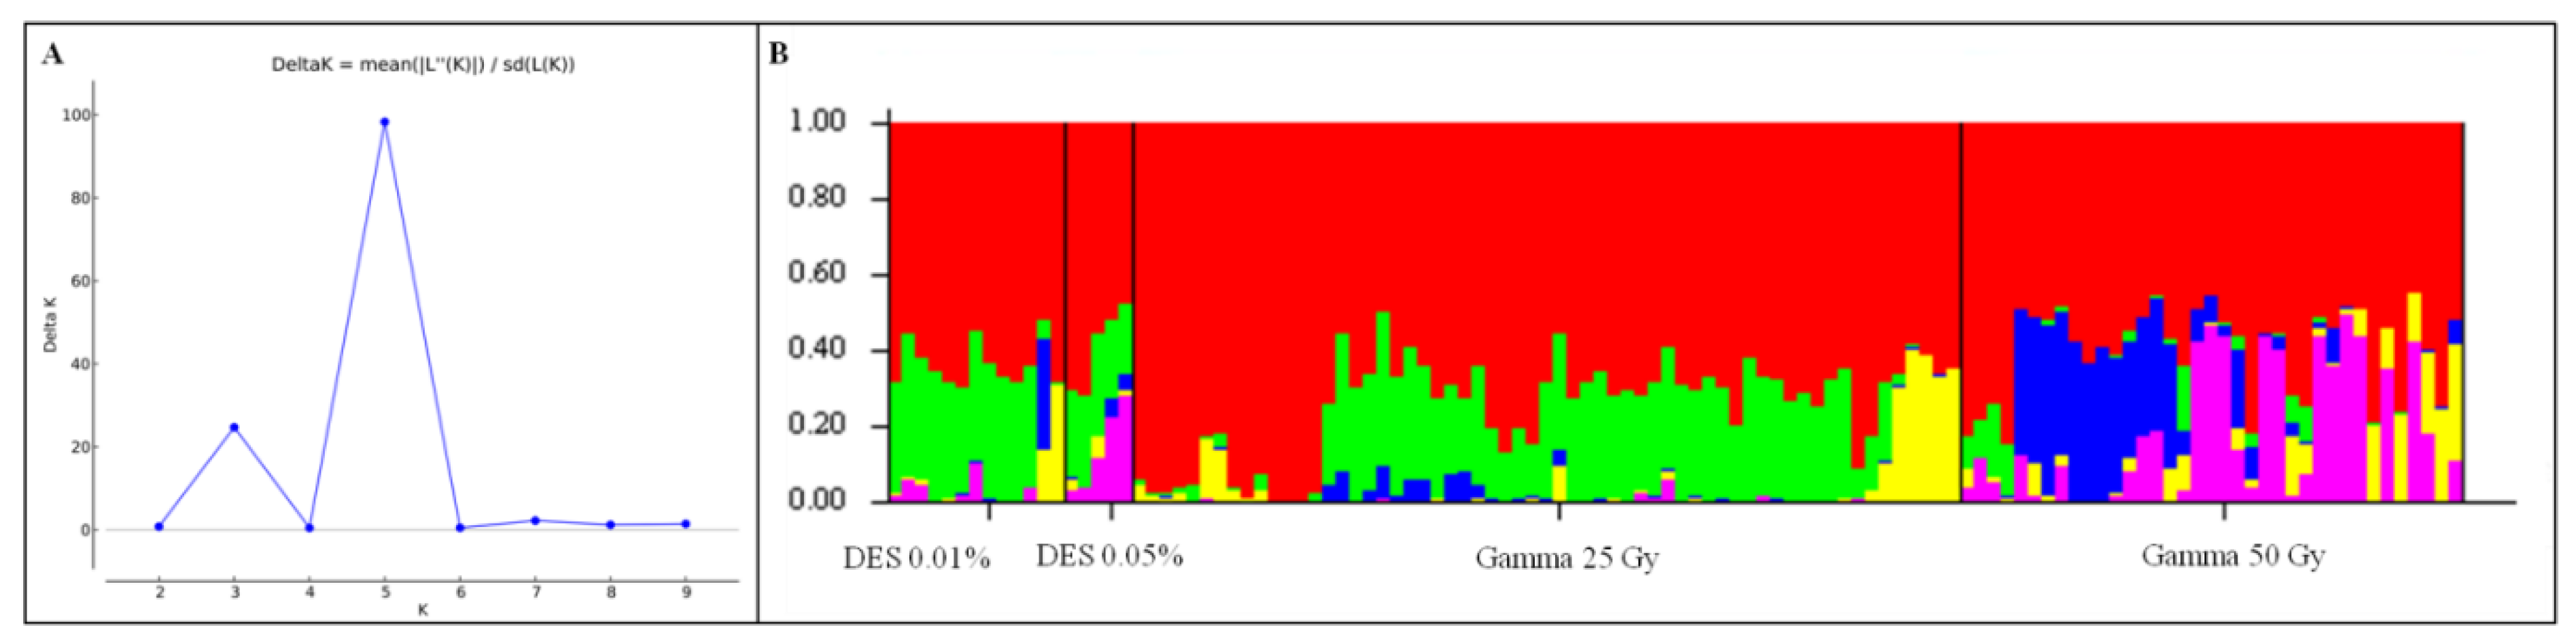
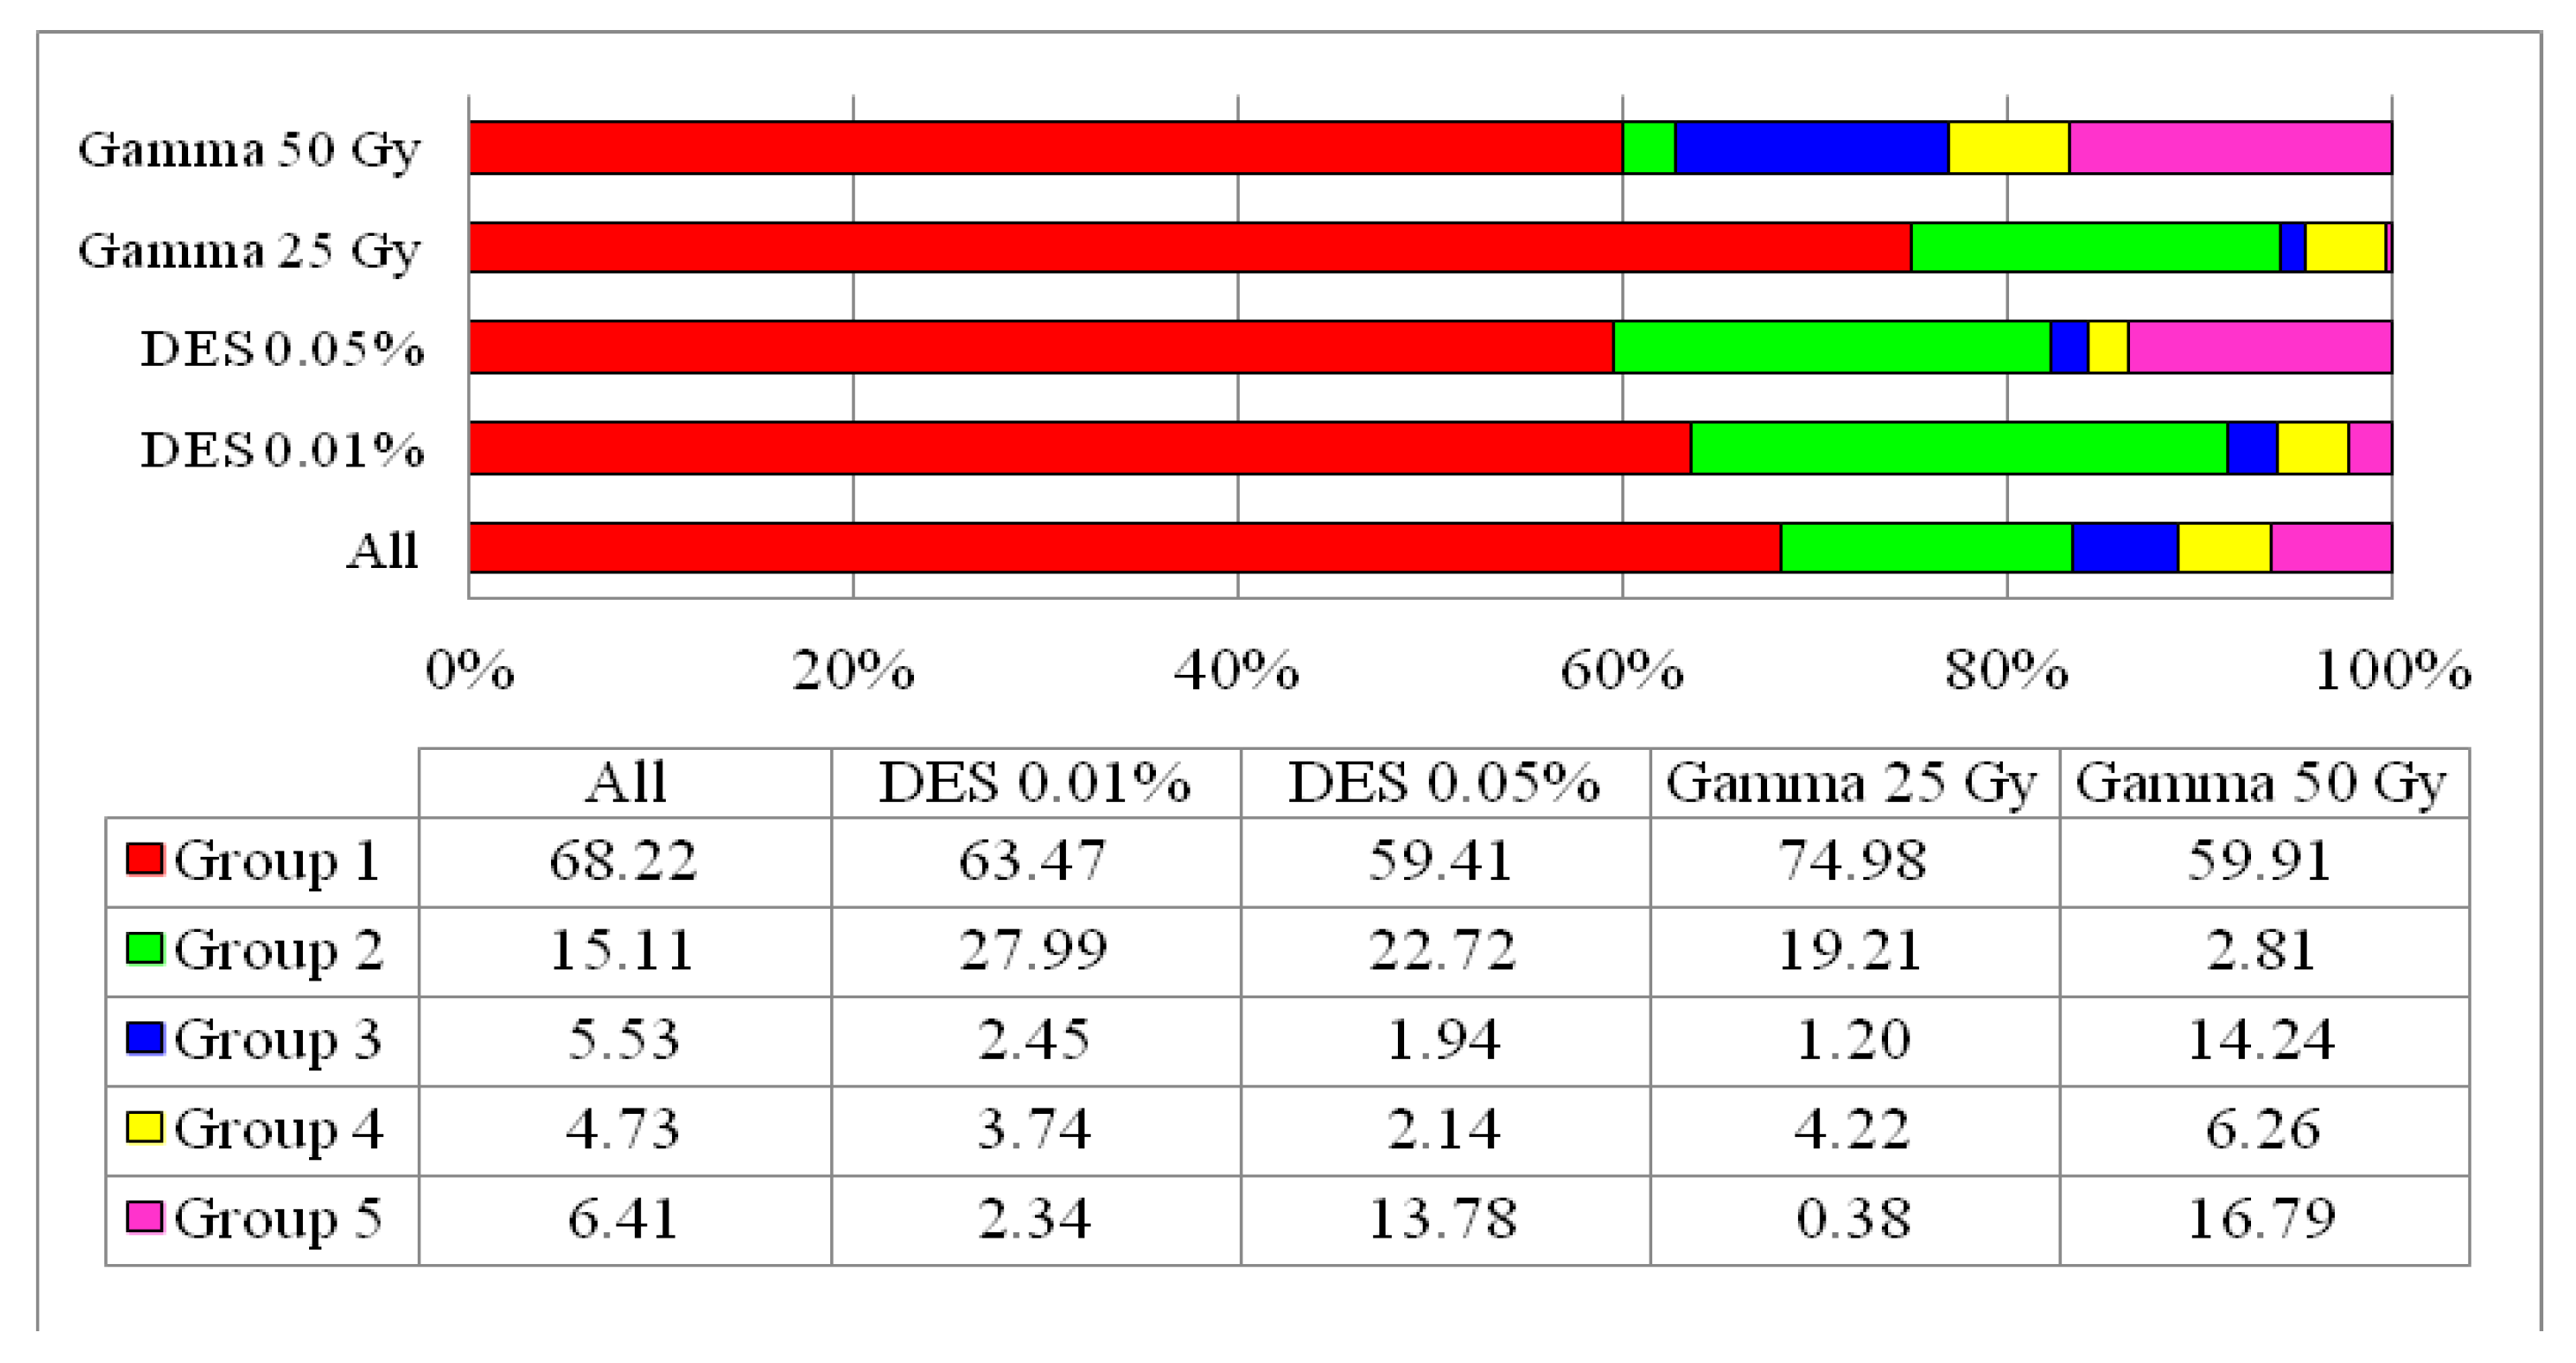
3.4. Population Structure

The population structure analysis indicated that the faba bean mutant population could be divided into five groups, based on the highest Evanno’s ΔK value of K = 5 (Figure 2A). Figure 2B shows the results of the STRUCTURE analysis for the ILB4347 mutant populations. The group or cluster assignment was based on the proportion of admixture within a single mutant plant. In this study, a 70% probability value was used to group the mutant plants. Mutant plants with a probability value below 70% were considered to be intermixed. The grouping distribution of mutant plants, based on results from the STRUCTURE software analysis, is presented in Supplementary Table S3. Based on this grouping, none of the mutant plants were assigned to a group, except for group 1 (red).
The degree of population change induced by mutagens was analyzed by averaging the grouping proportions or the membership coefficient (Q) of the mutant populations. The Q values of each individual mutant plant are shown in Supplementary Table S3. Figure 3 shows that the red portion, which coincides with the genetic background, of all mutant plants was 68.22%, indicating that 31.78% of the population structure changed due to the mutation process. The mutant population induced by 0.05% DES displayed the largest change to the population structure, followed by the mutant population induced by 50 Gy gamma radiation, 0.01% DES, and 25 Gy gamma radiation, in that order. The color or group proportions affected by population change also differed among the mutant populations. In the mutant populations induced by 0.01% DES and 25 Gy gamma radiation, the green portion of the population structure greatly changed compared with the other colors. Whereas in the mutant population induced by 50 Gy gamma radiation, the pink and the blue portions of the population structure were affected more strongly. In the mutant population induced by 0.05% DES, the green and the pink portions showed greater population structure changes.

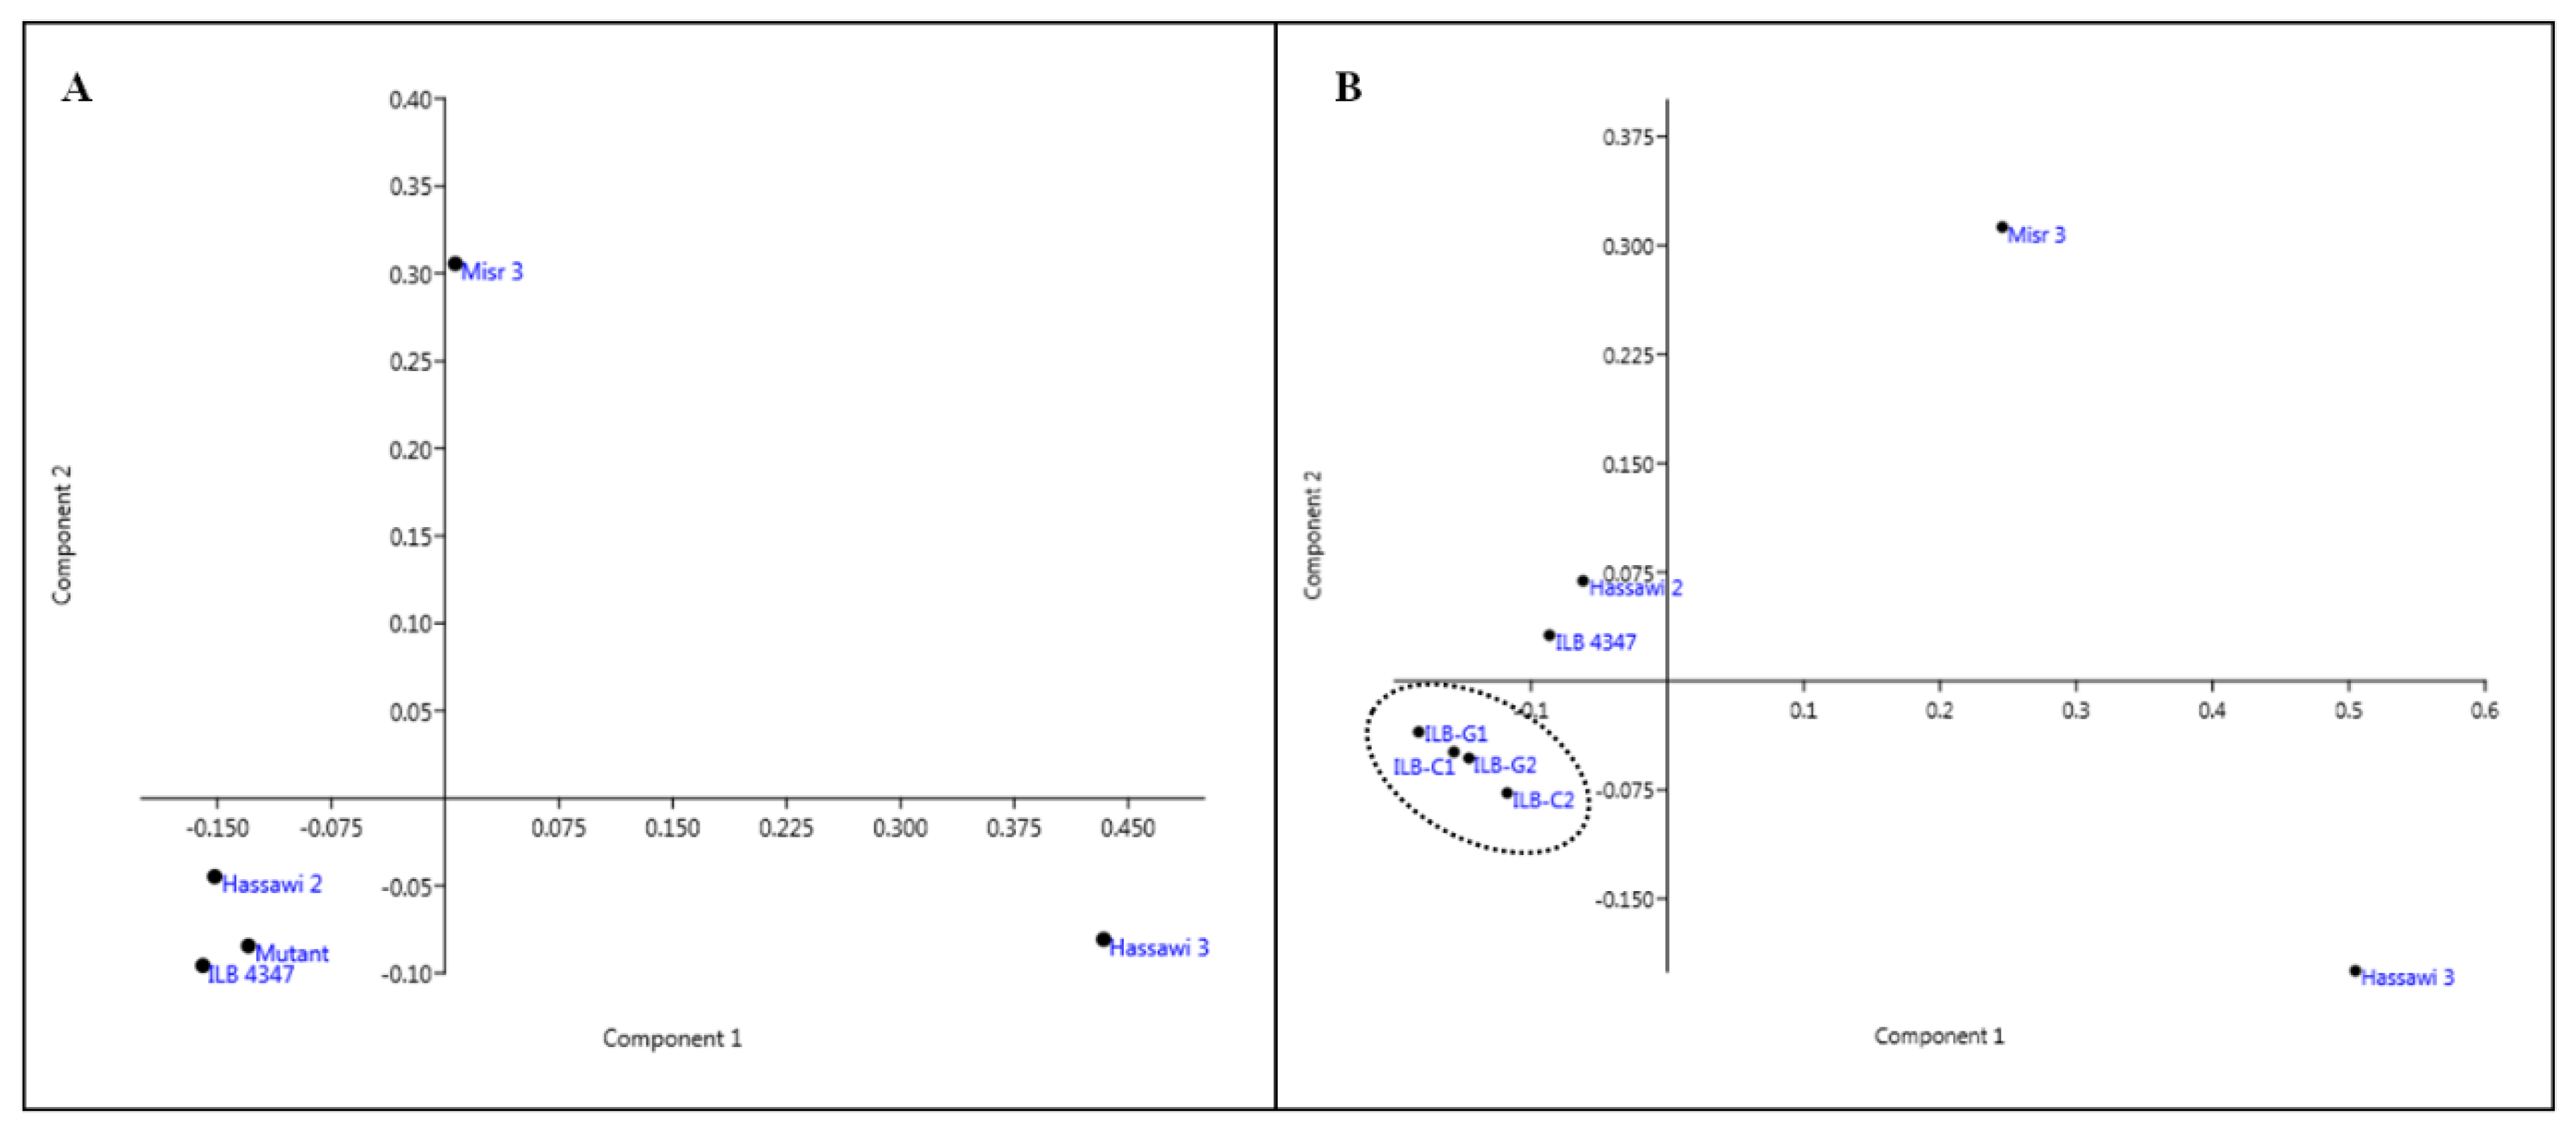
3.5. Genetic Relatedness

Four reference genotypes, representing three different regions, were selected to provide the genetic diversity baseline. A total of 867 polymorphic alleles from 11 AFLP primer combinations were recorded across these reference genotypes. Hassawi 3 had the highest total alleles count, with 515 alleles, or 59.4% of the total alleles, followed by Misr 3, with 426 alleles, Hassawi 2, with 202 alleles, and ILB4347, with 195 alleles. The wide range of the selected genetic diversity baseline is shown in the scatter biplot in Figure 4A. The two principal coordinates, based on Jaccard’s similarity index, distributed four genotypes into three quarters, supported by the value of Jaccard’s genetic similarity index, which ranged from 0.14 to 0.26.
The matrix of Nei genetic distance and identity shows the relatedness among mutant population and the four reference genotypes (Supplementary Table 4). The values showed that the mutant population closely related with its parent genotypes, ILB 4347, followed by Hassawi 2, Misr 3, and Hassawi 3. It illustrated by principle component analysis (PCA) of Nei’s genetic distance (Figure 4A). Further investigation was conducted among four mutant populations and four reference genotypes based on Nei’s genetic distance. The analysis showed that the mutant populations gathered in one cluster near to the ILB 4347 and Hassawi 2 and far from Misr 3 and Hassawi 3 (Figure 4B).

3.6. Relationship between Molecular and Phenotypic Data

The previous study [17] was conducted to assess genetic diversity of M2 population at the morphological level based on 12 qualitative traits, including inflorescence, flower, seed, leaf, and stem traits. The summary of mutant variation on different populations is presented in Table 5. Table 5 showed that increasing the level of mutagen treatments increased the number of phenotypic variation per sample. The highest phenotypic variation was recorded in 50 Gy gamma radiation-induced mutant population with 2.76 variations per sample, followed by the mutant population induced by 25 Gy gamma radiation, 0.05%, and 0.01% DES with 1.87, 1.80, 1.27 variations per sample, respectively. The correlation between phenotypic and molecular variation showed positive and no significant correlation with r = 0.801.

4. Discussion

The present study was conducted to examine genetic diversity and population structure changes in faba bean M2 populations. The study used 11 AFLP primer combinations to evaluate 116 M2 mutant plants, representing 116 mutant families that were generated by four treatments (two kinds of mutagen and two kinds of intensity), using four reference genotypes as a genetic diversity baseline. AFLP was used due to the high reproducibility of this technique and the power to detect point mutations throughout the genome. The high reproducibility was demonstrated by the average number of polymorphism alleles detected, which generated 153.36 alleles. In total, the 11 AFLP primer combinations generated 1687 polymorphic alleles from 120 sample plants. The number of alleles obtained exceeded those described by previous studies examining genetic diversity in faba bean populations, such as the 302 alleles in 255 samples identified using SSR [25], the 104 alleles in 187 samples identified using nuclear SSR [40], the 657 SNPs identified in 45 samples [24], the 1036 alleles detected in 58 samples using SRAP [23], the 209 alleles detected in 802 samples using ISSR [22], the 71 alleles identified in 34 samples using ISSR [41], and the 289 alleles examined in 28 samples using RAPD [19].
A total of 39,362 bands (data points) were obtained, with an average of 23.33 bands per sample, per primer combination. These results returned more bands than those obtained using SRAP markers, during which 10,700 data points were obtained, with an average of 13.17 bands per sample per primer combination [23]. These results validate the power of the AFLP technique to assess genetic diversity, due to the high reproducibility of this technique compared with other types of molecular markers. The efficiency and effectiveness of AFLP markers for the evaluation of genetic diversity can be explained by the high polymorphism rate and polymorphism information content (PIC) values. All of the primer combinations utilized in this study exhibited 100% polymorphism, with an average PIC value of 0.99%.
Enriching genetic diversity, in terms of molecular-based diversity, simply increases the number of polymorphic bands or new alleles detected. Our study identified many new alleles within the mutant population, in which greater than 88% of the alleles detected were classified as new alleles compare with the control plant. Moreover, various banding patterns were also identified in every mutant plant. The total allele count in mutant plants ranged from 117 to 545, whereas 195 alleles were detected in the control plant, which indicated that induced mutagenesis resulted in random mutations that both generated new alleles and resulted in the loss of existing alleles. These results agree with the sequencing data for 1504 rice mutants, in which a wide range of mutations was observed across the mutant plants [42]. Moreover, genome-wide comparisons using resequencing was performed by Yang et al. [43], to compare four mutant rice plants induced by 250 Gy gamma radiation. The results showed that the individual mutants had different total numbers of mutations and proportions of mutation types. The banding pattern analysis also revealed that the higher doses of mutagens resulted in a larger range of banding patterns, which were detected as shown in Table 2. Comparisons among mutant populations, according to the treatment used, showed that increasing the dose or concentration of mutagen treatments also increased the mean performance, standard deviation, and range of AFLP bands observed, indicating that higher mutagen doses can result in larger changes in the DNA arrangement and structure.
Genetic diversity analysis comparing between the mutant populations and the reference genotypes revealed that the mutant populations were more diverse than the reference genotypes, due to the high AFLP band polymorphism rate found in the mutant populations. The mutant population induced by DES at selected doses showed higher genetic diversity than the mutant population induced by gamma radiation. Similar results have previously been reported, when Kurowska et al. [27] reported that N-methyl-N-nitrosourea (MNU) at doses of 0.5–1.5 mM was more efficient for inducing point mutations in barley than gamma radiation at doses of 150–210 Gy. The AMOVA model compared four mutant populations and the reference genotypes. The AMOVA showed that the maximum genetic variation was found within the populations. These results are in line with the results of other studies performed in faba beans [44,45]. A total of 89% of the variation was concentrated within populations, and only 11% of the variation was observed between the populations. The 11% variation between populations may be due to the different genetic makeup relative to the reference genotype or differences in the mutagen used to generate different mutation types.
The population structure analysis showed that a total of 62% of the mutant plants were characterized as intermixed. This high proportion of intermix far exceeds the population structure analysis of faba bean accessions, based on several geographical areas. Gӧl et al. [25] evaluated 255 accessions from 30 different countries, using SSR, and reported that only 3.9% of the accessions were intermixed. Previously, Wang et al. [22] evaluated 802 faba bean accessions, worldwide, using ISSR markers, and were able to separate Chinese accessions from non-Chinese accessions. They concluded that China was an independent center of diversity for faba beans, due to being reproductively isolated from the rest of the Asian, African, and European gene pools. Furthermore, population structure analyses between cultivated and wild relatives of faba beans, conducted by Oliveira et al. [40], showed grouping between the two populations, indicating a very limited amount of gene flow between cultivated and wild faba beans. Therefore, the high proportion of intermixed populations indicated by the population structure analysis in the present study demonstrated the effects of random mutations induced by gamma radiation and DES.
The Evanno test showed that the mutant population could be divided into five groups (K = 5). However, only one group had members with coefficient memberships greater than 0.70. The other mutant plants had coefficient memberships lower than 0.70, explained by the high mutation effects on individual mutant plants, which indicated that ILB4347 mutant population belonged to a single genetic background, which is represented by the red portion in Figure 2. The portions represented by the other colors of each plant genome in the population structure analysis could be attributed to the diversity generated by the different types of mutations or to the locations of mutations within the genome. Unassigned members to inferred groups, generated by the STRUCTURE program, were also identified in a population structure study examining Tunisian faba bean landraces, conducted by Babay et al. [12]. The authors tested 29 faba bean landraces and determined that these populations could be divided into three groups/subpopulations, as inferred by the STRUCTURE program. However, none of the landraces belonged to these subpopulations, due to high levels of cross-pollination and human-mediated seed flow. Altogether, mutation, cross-pollination, and gene flow due to human-mediated seed flow can influence population structures.
The coefficient membership means of the mutant populations suggested that higher doses of mutagenic treatments caused higher changes in the coefficient membership proportion. Mutant populations induced by 0.05% DES presented larger changes in the coefficient membership proportion, with a 40.59% alteration, compared with the 36.53% alteration observed in the 0.01% DES-induced mutant population. Whereas, the 50 Gy gamma radiation-induced mutant population modified 40.09% of the coefficient membership proportion, which was 15.07% higher than that of the 25 Gy gamma radiation-induced mutant population. Interestingly, the changes in the coefficient membership of these mutant populations were significantly and positively correlated (r = 0.953) with the value of Nei’s unbiased genetic distance (Supplementary Table S5).
Genetic relatedness among the mutant populations and the four reference genotypes showed a close relationship between the mutant population and its control parent. The four reference genotypes represented three different regions. The PCA analysis separated the reference genotypes into three out of four quarters, indicating wide variations among the four reference genotypes. Cluster analysis, based on Nei’s genetic distance, showed a distinct cluster, consisting of the four mutant populations. This mutant cluster was near ILB4347, which was the control parent, and far from the other reference genotypes, indicating that although induced mutagenesis changes the banding pattern of the individual mutant plant, it is not sufficient to completely alter the identity relative to the control parent.
The relationship between phenotypic and molecular variation showed that the higher level of mutagen treatment increased both phenotypic and molecular variations. However, there is no significant correlation between phenotypic and molecular data due to the different order of treatment that gave higher variation. The order of phenotypic variation was 50 Gy > 25 Gy > 0.05% DES > 0.01%, whereas the order of molecular variation was 50 Gy > 0.05% DES > 0.01% > 25 Gy. The difference can be explained due to the difference between the number of alleles screened and morphological traits evaluated. A total of 1687 alleles were screened in 116 mutant plants compare to 12 morphological traits evaluated. Moreover, any mutation at the DNA level did not express at the morphological level as mutation could be changed at non-coding DNA sequences.

5. Conclusions

The present study revealed that induced mutagenesis enriched genetic diversity and changed the population structure of faba beans. The abundance of new AFLP bands and the high number of infrequent alleles (f ≤ 0.1) that were observed in the mutant population reflects the high degree of genetic diversity induced by gamma radiation and DES. Higher doses of mutagens generated increased genetic diversity; thus, high doses of mutagenic agents could be further applied to faba bean mutation breeding. The structure of the mutant population changed with increased mutagen levels; however, a close genetic relationship continued to be observed between the mutant population and its control parent, relative to the other reference genotypes.

Supplementary Materials

The following are available online at https://www.mdpi.com/1424-2818/12/8/303/s1. Table S1. Adapter and primer sequence used for AFLP analysis, Table S2. The pairwise Jaccard’s genetic similarity among the 116 mutant plants along with four reference genotypes, Table S3. The membership coefficient (Q) of individual mutant plant at K = 5, Table S4. The value of Nei’s genetic distance and identity among mutant population and four reference genotypes, Table S5. The value of Nei’s unbiased genetic distance among mutant populations and four reference genotypes.

Author Contributions

Conceptualization, S.S.A. and H.M.M. methodology, N. and M.A.K. software, N. and M.A.; formal analysis, N. and H.M.M.; investigation, N.; data curation, N. and H.M.M.; writing—original draft preparation, N. and S.S.A.; writing—review and editing, N. and S.S.A.; project administration, H.M.M. All authors have read and agreed to the published version of the manuscript.

Funding

King Abdulaziz City for Science and Technology: NSTIP strategic technologies program number (11-AGR1861-02) in the Kingdom of Saudi Arabia.

Acknowledgments

The authors, acknowledge with thanks for financial support by the NSTIP strategic technologies program number (11-AGR1861-02) in the Kingdom of Saudi Arabia, and the Deanship of Scientific Research and RSSU at King Saud University for their technical support.

Conflicts of Interest

The authors declare that they have no conflict of interest.

References

  1. Food and Agriculture Organisation (FAO) of the United Nations. Declaration of the World Summit on Food Security; Food and Agriculture Organisation (FAO) of the United Nations: Rome, Italy, 2009; Available online: http://www.fao.org/fileadmin/templates/wsfs/Summit/Docs/Declaration/WSFS09_Draft_Declaration.pdf (accessed on 11 June 2020).
  2. Tester, M.; Langridge, P. Breeding technologies to increase crop production in a changing world. Science 2010, 320, 818–822. [Google Scholar] [CrossRef] [PubMed]
  3. Fu, Y.B.; Peterson, G.W.; Scoles, G.; Rossnagel, B.; Schoen, D.J.; Richards, K.W. Allelic diversity changes in 96 Canadian oat genotypes released from 1886 to 2001. Crop Sci. 2013, 43, 1989–1995. [Google Scholar] [CrossRef] [Green Version]
  4. Fu, Y.B.; Peterson, G.W.; Richards, K.W.; Somers, D.; DePauw, R.M.; Clarke, J.M. Allelic reduction and genetic shift in the Canadian hard red spring wheat germplasm released from 1845 to 2004. Theor. Appl. Genet. 2005, 110, 1505–1516. [Google Scholar] [CrossRef]
  5. Roussell, V.; Koenig, J.; Bechert, M.; Balfourier, F. Molecular diversity in French bread wheat accessions related to temporal trends and breeding programmes. Theor. Appl. Genet. 2004, 108, 920–930. [Google Scholar] [CrossRef] [PubMed]
  6. Fu, Y.B.; Peterson, G.W.; Yu, J.K.; Gao, L.; Jia, J.; Richards, K.W. Impact of plant breeding on genetic diversity of the Canadian hard red spring wheat germplasm as revealed by EST-derived SSR markers. Theor. Appl. Genet. 2006, 112, 1239–1247. [Google Scholar] [CrossRef] [PubMed]
  7. Liu, W.; Chen, L.; Zhang, S.; Hu, F.; Wang, Z.; Lyu, J.; Wang, B.; Xiang, H.; Zhao, R.; Tian, Z.; et al. Decrease of gene expression diversity during domestication of animals and plants. BMC Evol. Biol. 2019, 19, 19. [Google Scholar] [CrossRef] [Green Version]
  8. Rauf, S.; Da Silva, J.A.T.; Khan, A.A.; Naveed, A. Consequences of plant breeding on genetic diversity. Int. J. Plant Breed. 2010, 4, 1–21. [Google Scholar]
  9. Nedumaran, S.; Abinaya, P.; Jyosthnaa, P.; Shraavya, B.; Rao, P.; Bantilan, C. Grain Legumes Production, Consumption and Trade Trends in Developing Countries; Working Paper Series No. 60; ICRISAT Research Program, Markets, Institutions and Policies: Patancheru, India, 2015; 64p. [Google Scholar]
  10. Maalouf, F.; Hu, J.; O’Sullivan, D.M.; Zong, X.; Hamwieh, A.; Kumar, S.; Baum, M. Breeding and genomics status in faba bean (Vicia faba). Plant Breed. 2019, 138, 465–473. [Google Scholar] [CrossRef] [Green Version]
  11. Gong, Y.; Xu, S.; Mao, W.; Li, Z.; Hu, Q.; Zhang, G.; Ding, J. Genetic diversity analysis of faba bean (Vicia faba L.) based on EST-SSR markers. Agric. Sci. China 2011, 10, 838–844. [Google Scholar] [CrossRef]
  12. Babay, E.; Khamassi, K.; Sabetta, W.; Miazzi, M.M.; Montemurro, C.; Pignone, D.; Danzi, D.; Finetti-Sialer, M.M.; Mangini, G. Serendipitous in situ conservation of faba bean landraces in Tunisia: A case study. Genes 2020, 11, 236. [Google Scholar] [CrossRef] [Green Version]
  13. Mba, C. Induced mutations unleash the potentials of plant genetic resources for food and agriculture. Agronomy 2013, 3, 200–231. [Google Scholar] [CrossRef] [Green Version]
  14. Sjodin, J. Induced morphological variation in Vicia faba L. Hereditas 1971, 67, 155–180. [Google Scholar] [CrossRef]
  15. Khursheed, S.; Khan, S. Genetic improvement of two cultivars of Vicia faba L. using gamma irradiation and ethyl methane sulphonate mutagenesis. Legume Res. 2017, 40, 338–344. [Google Scholar] [CrossRef] [Green Version]
  16. Nurmansyah; Alghamdi, S.S.; Migdadi, H.M.; Farooq, M. Novel inflorescence architecture in gamma radiation-induced faba bean mutant populations. Int. J. Rad. Biol. 2019, 95, 1744–1751. [Google Scholar] [CrossRef]
  17. Alghamdi, S.S.; Migdadi, H.M. Morphological diversity of faba bean (Vicia faba L.) M2 mutant populations induced by gamma radiation and diethyl sulfate. J. King Saud Univ. Sci. 2020, 32, 1647–1658. [Google Scholar] [CrossRef]
  18. Van de Ven, M.; Powell, W.; Ramsay, G.; Waugh, R. Restriction fragment length polymorphisms as genetic markers in Vicia. Heredity 1990, 65, 329–342. [Google Scholar] [CrossRef] [Green Version]
  19. Link, W.; Dixkens, C.; Singh, M.; Schwall, M.; Melchinger, A.E. Genetic diversity in European and Mediterranean faba bean germplasm revealed by RAPD markers. Theor. Appl. Genet. 1995, 90, 27–32. [Google Scholar] [CrossRef]
  20. Sanz, A.M.; Gonzalez, S.G.; Syed, N.H.; Suso, M.J.; Saldana, C.C.; Flavell, A.J. Genetic diversity analysis in Vicia species using retrotransposon-based SSAP markers. Mol. Genet. Genom. 2007, 278, 433–441. [Google Scholar] [CrossRef]
  21. Zong, X.; Ren, J.; Guan, J.; Wang, S.; Liu, Q.; Paull, J.G.; Redden, R. Molecular variation among Chinese and global germplasm in spring faba bean areas. Plant Breed. 2010, 129, 508–513. [Google Scholar] [CrossRef]
  22. Wang, H.; Zong, X.; Guan, J.; Yang, T.; Sun, X.; Ma, Y.; Redden, R. Genetic diversity and relationship of global faba bean (Vicia faba L.) germplasm revealed by ISSR markers. Theor. Appl. Genet. 2012, 124, 789–797. [Google Scholar] [CrossRef]
  23. Alghamdi, S.S.; Al-Faifi, S.A.; Migdadi, H.M.; Khan, M.A.; EL-Harty, E.H.; Ammar, M.H. Molecular diversity assessment using Sequence Related Amplified Polymorphism (SRAP) markers in Vicia faba L. Int. J. Mol. Sci. 2012, 13, 16457–16471. [Google Scholar] [CrossRef] [PubMed]
  24. Kaur, S.; Cogan, N.O.I.; Forster, J.W.; Paull, J.G. Assessment of genetic diversity in faba bean based on single nucleotide polymorphism. Diversity 2014, 6, 88–101. [Google Scholar] [CrossRef] [Green Version]
  25. Gӧl, S.; Doganlar, S.; Frary, A. Relationship between geographical origin, seed size and genetic diversity in faba bean (Vicia faba L.) as revealed by SSR markers. Mol. Genet. Genom. 2017, 292, 991–999. [Google Scholar] [CrossRef] [PubMed]
  26. Sorkheh, K.; Shiran, B.; Aranzana, M.J.; Mohammadi, S.A.; Martinez-Gomez, P. Application of amplified fragment length polymorphism (AFLPs) analysis to plant breeding and genetics: Procedures, applications and prospects. J. Food. Agric. Environ. 2007, 5, 197–204. [Google Scholar]
  27. Kurowska, M.; Labocha-Pawłowska, A.; Gnizda, D.; Maluszynski, M.; Szarejko, I. Molecular analysis of point mutations in a barley genome exposed to MNU and gamma rays. Mutant Res. 2012, 738–739, 52–70. [Google Scholar] [CrossRef]
  28. Caballero, A.; Garcia-Pereira, M.J.; Quesda, H. Genomic distribution of AFLP markers relative to gene locations for different eukaryotic species. BMC Genom. 2013, 14, 528. [Google Scholar] [CrossRef] [Green Version]
  29. Nurmansyah; Alghamdi, S.S.; Migdadi, H.M.; Farooq, M. Morphological and chromosomal abnormalities in gamma radiation-induced faba bean mutant populations. Int. J. Rad. Biol. 2018, 94, 174–185. [Google Scholar] [CrossRef]
  30. Paris, M.; Bonnes, B.; Ficetola, G.F.; Poncet, B.N.; Després, L. Amplified fragment length homoplasy: In silico analysis for model and non-model species. BMC Genom. 2010, 11, 287. [Google Scholar] [CrossRef] [Green Version]
  31. Lynch, M.; Milligan, B.G. Analysis of population genetic structure with RAPD markers. Mol. Ecol. 1994, 3, 91–99. [Google Scholar] [CrossRef]
  32. Khierallah, H.S.M.; Bader, S.M.; Baum, M.; Hamwieh, A. Assessment of genetic diversity of some Iraqi date palms (Phoenix dactylifera L.) using AFLP markers. Afr. J. Biotechnol. 2011, 10, 9570–9575. [Google Scholar] [CrossRef] [Green Version]
  33. Peakall, R.; Smouse, P.E. GenAlEx 6.5: Genetic Analysis in Excel. Population Genetic Software for Teaching and Research—An Update. Bioinformatics 2012, 28, 2537–2539. [Google Scholar] [CrossRef] [PubMed] [Green Version]
  34. Hammer, Ø.; David, A.T.; Ryan, P.D. Past: Paleontological Statistics Software Package for Education and Data Analysis. Palaeontol. Electron. 2001, 4, 4–9. [Google Scholar]
  35. Pritchard, J.K.; Stephens, M.; Donnelly, P.J. Inference of population Structure using multilocus genotype data. Genetics 2000, 155, 945–959. [Google Scholar] [PubMed]
  36. Falush, D.M.; Stephens, M.; Pritchard, J.K. Inference of population structure using multilocus genotype data: Linked loci and correlated allele frequencies. Genetics 2003, 164, 1567–1587. [Google Scholar]
  37. Falush, D.M.; Stephens, M.; Pritchard, J.K. Inference of population structure using multilocus genotype data: Dominant markers and null alleles. Mol. Ecol. Notes 2007, 7, 574–578. [Google Scholar] [CrossRef]
  38. Hubisz, M.J.D.; Falush, D.M.; Stephens, M.; Pritchard, J.K. Inferring weak population structure with the assistance of sample group information. Mol. Ecol. Resour. 2009, 9, 1322–1332. [Google Scholar] [CrossRef] [Green Version]
  39. Earl, D.A.; vonHoldt, B.M. STRUCTURE HARVESTER: A website and program for visualizing STRUCTURE output and implementing the Evanno method. Conserv. Genet. Res. 2012, 4, 359–361. [Google Scholar] [CrossRef]
  40. Oliveira, H.R.; Tomás, D.; Silva, M.; Lopes, S.; Viegas, W.; Veloso, M.M. Genetic diversity and population structure in Vicia faba L. landraces and wild related species assessed by nuclear SSRs. PLoS ONE 2016, 11, e0154801. [Google Scholar] [CrossRef] [Green Version]
  41. Alghamdi, S.S.; Al-Faifi, S.A.; Migdadi, H.M.; Ammar, M.H.; Siddique, K.M. Inter-simple sequence repeat (ISSR)-based diversity assessment among faba bean genotypes. Crop Pasture Sci. 2011, 62, 755–760. [Google Scholar] [CrossRef]
  42. Li, G.; Jain, R.; Chern, M.; Pham, N.T.; Martin, J.A.; Wei, T.; Schackwitz, W.S.; Lipzen, A.M.; Duong, P.Q.; Jones, K.C.; et al. The sequence of 1504 mutant in the model rice variety Kitaake facilitate rapid functional genomic studies. Plant Cell 2017, 29, 1218–1231. [Google Scholar] [CrossRef] [Green Version]
  43. Yang, G.; Luo, W.; Zhang, J.; Yan, X.; Du, Y.; Zhou, L.; Li, W.; Wang, H.; Chen, Z.; Guo, T. Genome-wide coparisons of mutations induced by carbon-ion beam and gamma-rays irradiation in rice via resequencing multiple mutants. Front. Plant Sci. 2019, 10, 1514. [Google Scholar] [CrossRef] [PubMed] [Green Version]
  44. El-Esawi, M.A. SSR analysis of genetic diversity and structure of the germplasm of faba bean (Vicia faba L.). CR Biol. 2017, 340, 474–480. [Google Scholar] [CrossRef] [PubMed]
  45. Rebaa, F.; Abid, G.; Aouida, M.; Abdelkarim, S.; Aroua, I.; Muhovski, Y.; Baudoin, J.; M’hamdi, M.; Sassi, K.; Jebara, M. Genetic variability in Tunisian populations of faba bean (Vicia faba L. var. major) assessed by morphological and SSR markers. Physiol. Mol. Biol. Plants 2017, 23, 397–409. [Google Scholar] [CrossRef] [PubMed] [Green Version]
Figure 1. The frequency of occurrence of 1687 AFLP bands in 116 mutant plants and reference plants.
Diversity 12 00303 g001
Figure 2. Population structure of the ILB4347 mutant populations. (A) Evanno’s ΔK value, with K = 1–10, showing peak at K = 5. (B) Genetic structure inferred by STRUCTURE program, with K = 5. Each sample is represented by a vertical bar segmented into K colored parts. The length of each colored part is proportional to the membership of coefficient (Q). The black vertical lines separate different mutant populations.
Diversity 12 00303 g002
Figure 3. Membership coefficient (Q) means of mutated faba bean plants, inferred by the STRUCTURE program.
Diversity 12 00303 g003
Figure 4. Relatedness among mutant populations and the four reference genotypes. (A) Two-dimensional principal component analysis (PCA) of mutant population and the four reference genotypes. (B) PCA of the four mutant populations and the four reference genotypes, for the first and second components, based on Nei’s genetic distance data. Mutant: All mutant plants, ILB-G1: mutant population treated by 25 Gy gamma radiation, ILB-G2: mutant population treated by 50 Gy gamma radiation, ILB-C1: mutant population treated by 0.01% DES, ILB-C2: mutant population treated by 0.05% DES.
Diversity 12 00303 g004
Table 1. Characteristics of 11 amplified fragment length polymorphism (AFLP) primers selected from 120 samples.
Primer Combination Eco R1/Mse 1Total AllelesTotal No. of BandsAverage Bands per Allele (Range)Polymorphism Rate (%)DP (%)
TG/CTT268754928.17 (4–118)10015.89
TA/CCA185418222.61 (4–105)10010.97
TC/CCA175399322.82 (4–110)10010.37
AA/CCC168396823.62 (4–112)1009.96
TC/CAC151293719.45 (4–116)1008.95
AA/CCT149358424.05 (4–105)1008.83
TC/CAG149241616.21 (4–100)1008.83
TA/CAG137357526.09 (4–113)1008.12
TT/CAC132308023.33 (4–137)1007.82
CC/CCA95212722.39 (4–109)1005.63
TT/CTT78195125.01 (4–112)1004.62
Total 1687 ---
Average153.363578.3623.331009.09
DP: discrimination power.
Table 2. Mean performance and range of AFLP bands among mutant populations.
PopulationNo. of SamplesAFLP Band Observed
MeanSDRangeLowestHighest
Reference genotypes4334.50161.21320195515
All mutant plants116327.79108.22428117545
DES 0.01%13354.5448.45149305454
DES 0.05%5401.2096.14210295505
Gamma 25 Gy61271.9785.84352117469
Gamma 50 Gy37400.51107.69357188545
Table 3. Diversity parameters of mutant populations obtained from the analysis of 1687 AFLP alleles.
PopulationNo. of SamplesNo. of AllelesNaNeIHe% PPrivate Alleles
Reference genotypes48671.0081.2320.2340.15049.380
ILB434711616872.0001.2360.2830.164100.00820
Mean60 1.5041.2340.2590.15774.69
Reference genotypes48671.0081.2320.2340.15049.380
ILB4347 (Gamma Radiation)9816841.9961.2310.2770.16199.82164
ILB4347 (DES)1814371.6971.2560.2840.17184.471
Mean40 1.5671.2400.2650.16077.89
Reference genotypes48671.0081.2320.2340.15049.380
ILB4347 (25 Gy Gamma)6115701.8611.1950.2380.13693.0630
ILB4347 (50 Gy Gamma)3715041.7811.2890.3040.18688.9726
ILB4347 (0.01% DES)1312271.4341.2310.2500.15270.660
ILB4347 (0.05% DES)59921.1531.2810.2720.17656.490
Mean24 1.4471.2460.2600.16071.71
Na: number of alleles, Ne: number of effective alleles, I: Shannon’s information index, He: expected heterozygosity, %P: percentage of polymorphic loci, Private alleles: number of alleles unique to a single population.
Table 4. AMOVA of molecular variation among and within five populations.
SourcedfSum of SquareMean SquareEstimated Variance%φPT
Among populations42457.808614.45222.53011%0.107 **
Within populations11521,541.825187.320187.32089%
Total11923,999.633 209.850100%
** Indicates significance p < 0.001.
Table 5. Summary of phenotypic variation on different mutant populations.
Mutant PopulationNo. of SampleNo. of Phenotypic VariationNo. of Phenotypic Variation/SampleCorrelation Phenotype vs. Shannon’s Index
rp
25 Gy Gamma611141.870.801 ns0.199
50 Gy Gamma371022.76
0.01% DES11141.27
0.05% DES591.80
ns indicates no significant difference.

