Article

Phenotypic Variation in Endangered Texas Salamanders: Application of Model-Based Clustering for Identifying Species and Hybrids

1
Department of Biological Sciences, Tarleton State University, Box T-0100, Stephenville, TX 76402, USA
2
Watershed Protection Department, City of Austin, TX 78704, USA
*
Author to whom correspondence should be addressed.
Diversity 2020, 12(8), 297; https://doi.org/10.3390/d12080297
Submission received: 29 June 2020 / Revised: 18 July 2020 / Accepted: 27 July 2020 / Published: 29 July 2020
(This article belongs to the Section Biodiversity Conservation)

Abstract

:
The endangered Barton Springs and Austin blind salamanders (Eurycea sosorum and E. waterlooensis, respectively) are micro-endemics to the Barton Springs segment of the Edwards Aquifer and its contributing zone in Central Texas. Although vertically segregated within the aquifer system, both species are known from the same spring outflows and occasionally hybridize. We used geometric morphometrics and model-based clustering applied to a large sample of standardized salamander photographs to evaluate the potential for objective phenotypic assignment to either species, as well as putative hybrids. In addition to characterizing variation in head shape, our analyses inferred sets of clusters corresponding to ontogenetic series in both species but did not infer any distinct hybrid clusters. Eurycea sosorum and E. waterlooensis have distinctive head size to trunk length allometries, which contributed to the effective clustering of species, even at small body sizes. We also observed subtle, but significant, microgeographic variation in E. sosorum, suggesting the possibility of population substructuring, phenotypic plasticity, or undetected hybridization.

Graphical Abstract

1. Introduction

Model-based clustering methods have been used increasingly in biology for objectively partitioning observations into cohesive groups based on high-dimensional datasets [1,2]. These methods are frequently deployed in studies of gene expression and species delimitation [3,4,5,6,7] but have numerous other applications. Advances in mixed-model clustering are particularly promising in that they are based on multivariate normal mixture models in which the number and parameterization of clusters are optimized simultaneously using the Bayesian information criterion (BIC) [8,9]. However, while clustering has proven invaluable for understanding the underlying structure of multivariate datasets, it is often difficult to determine whether, and in what way, mathematically tractable results are also biologically meaningful [10]. Owing to the complexity of biological systems, both relevant and random (meaningless) relationships could be inferred from the same dataset or from different clustering algorithms, and studies that heuristically validate these approaches are needed.
Here, we evaluate phenotypic variation in head shape as well as overall accuracy of Bayesian model-based clustering when compared with expert identification for distinguishing among species and hybrids of two endangered salamander species endemic only to the Barton Springs segment and its contributing zone of the Edwards Aquifer in Central Texas. Barton Springs and Austin blind salamanders (Eurycea sosorum and E. waterlooensis, respectively) are part of a radiation of at least 15 species of primarily neotenic plethodontid salamanders with highly restricted distributions within the karst groundwater systems of the Edwards Plateau [11,12,13]. Both species are encountered primarily at the major spring outflows of Barton Springs and based on molecular data are confirmed to hybridize at least infrequently [14]. Although syntopic with E. sosorum at Barton Springs, E. waterlooensis is considered a cave-obligate species, and is only rarely encountered at surface outflows [15]. This species exhibits specialized troglobitic morphology with an overall translucent appearance, hypertrophy and elongation of locomotor structures, broadening and flattening of the skull, reduction in numbers of trunk vertebrae, and eye reduction [15,16]. In contrast, E. sosorum is a habitat generalist, occurring in both surface and subsurface groundwater, and represents approximately 99% of all salamander observations from spring outflows and low-order streams associated with Barton Springs. This species exhibits variation consistent with occupying both surface and subterranean habitats but generally has well-developed eyes, muscular limbs, elongated trunk, and varying levels of skin pigmentation [17]. In addition to differences in eye development, E. waterlooensis can be distinguished from E. sosorum by having 12 versus 13–16 costal grooves [15]; however, this trait is difficult to score accurately from live specimens, and from juveniles in particular.
As part of an ongoing population monitoring effort, the City of Austin maintains a photographic database of all wild salamanders (i.e., mixed Eurycea sosorum, E. waterlooensis, putative hybrids) captured during surveys at the four major flow outlets of Barton Springs: Eliza, Old Mill/Sunken Gardens, Parthenia, and Upper Barton. These photographs are used to document salamander recaptures based on unique pigment patterns for ongoing demographic studies [18,19], but also allow for the collection of a wealth of other phenotypic data. For example, geometric morphometric approaches could potentially be used in conjunction with model-based clustering to identify individuals to species or putative hybrids, which would be useful for evaluating long-term trends in abundance. Although both species are readily distinguishable as adults, the majority of E. waterlooensis captured from spring outflows are juveniles under 10 mm in length [15,20], a size class where visual identification (i.e., expert identification) could be more ambiguous. Furthermore, any discordant variation among individuals is often informally assigned to hybridization, but clustering algorithms have the potential to objectively identify putative hybrids. If successful, such methods could provide estimates of hybridization frequency for ongoing demographic studies of these endangered micro-endemics.

2. Materials and Methods

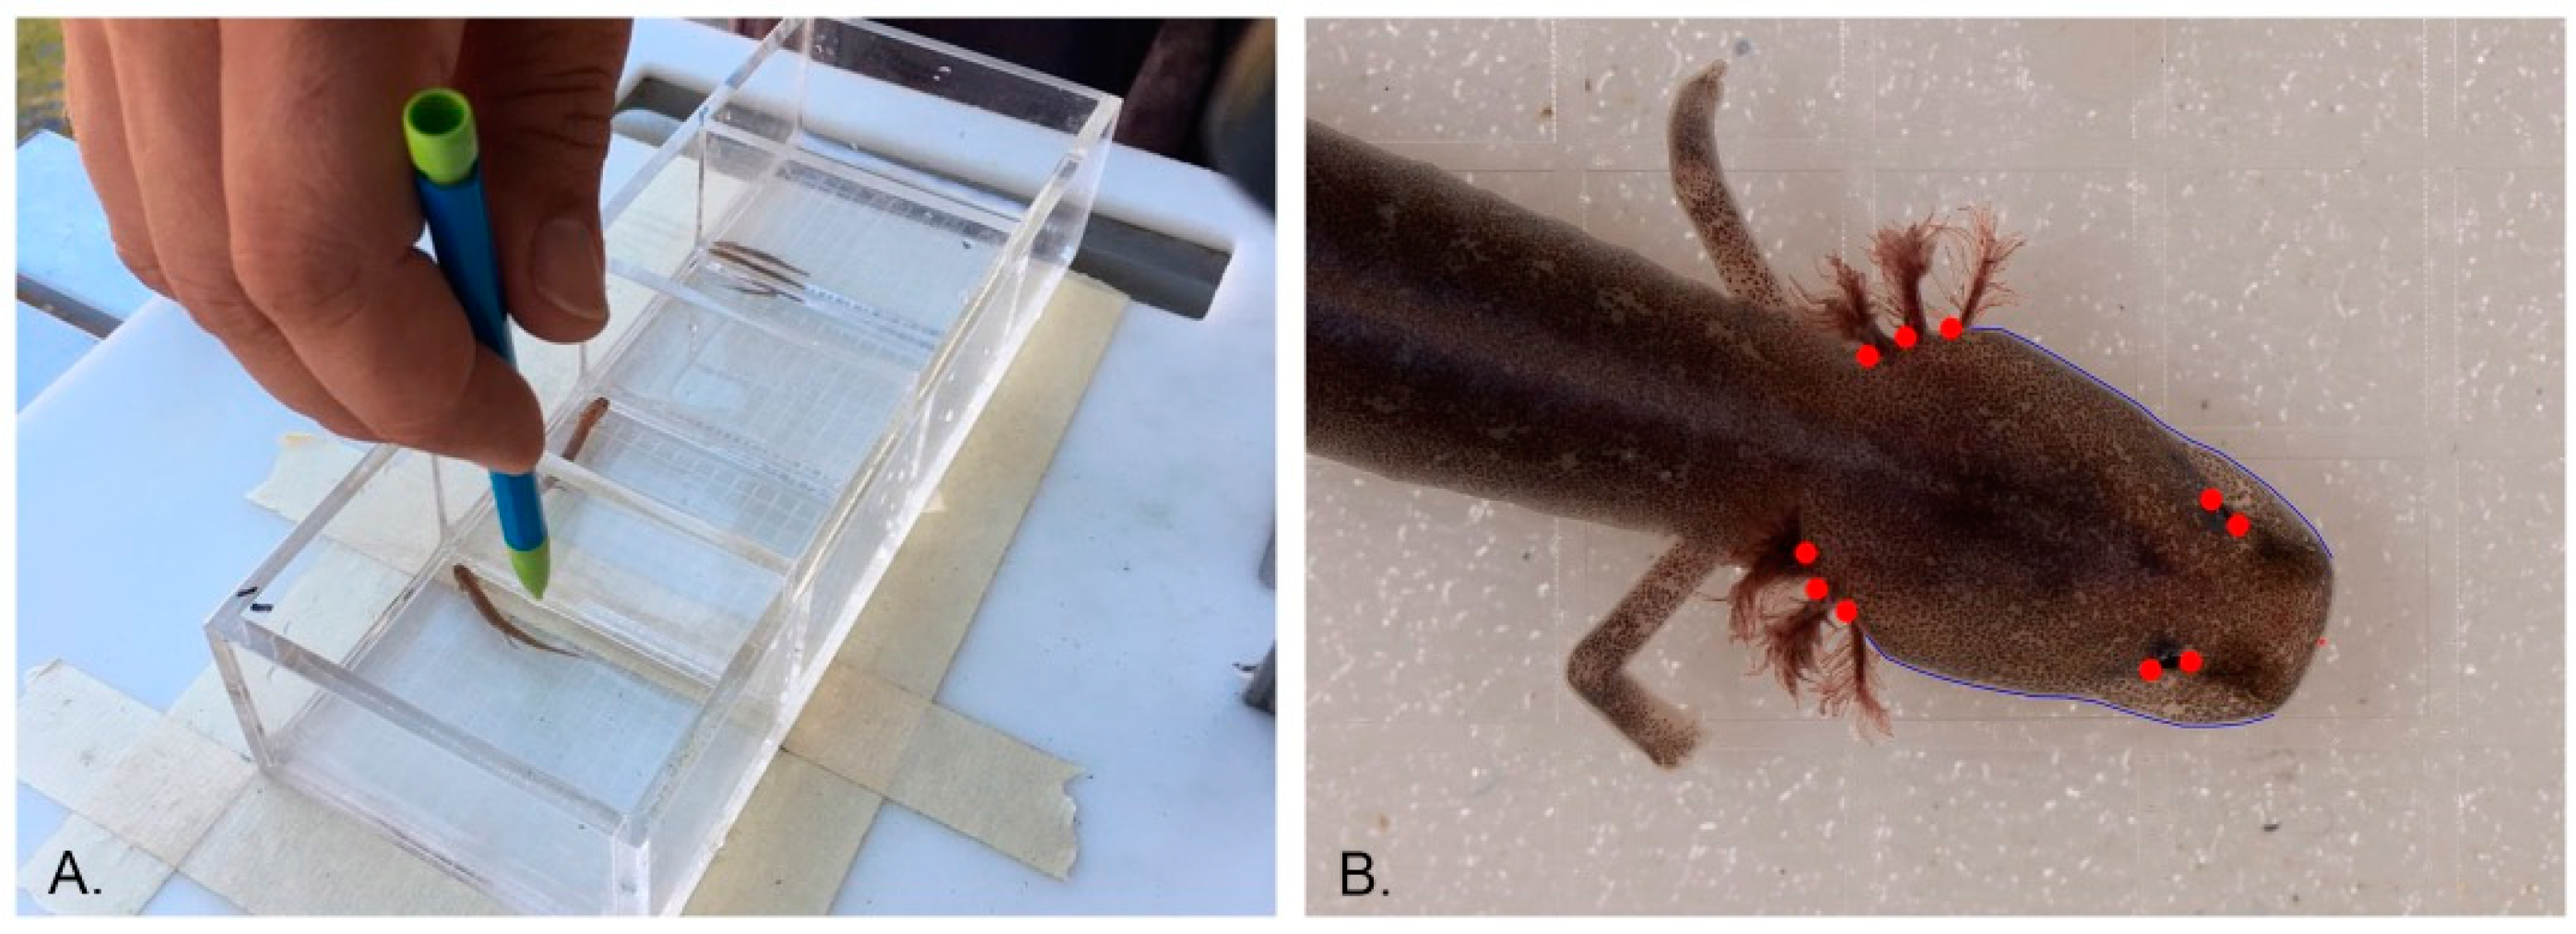
2.1. Photographic Dataset and Landmark Digitization

We obtained an initial sample of 800 standardized photographs of wild-caught salamanders from Barton Springs outflows that were suitable for phenotypic analysis (i.e., specimens that did not have obvious head tilt, missing gill insertions, or other apparent abnormalities). The great majority of specimens represented E. sosorum, which is the dominant species at the spring outflows. We added to this dataset any additional wild individuals previously identified as E. waterlooensis (n = 22) as well as individuals of E. waterlooensis from the Austin Salamander Conservation Center (n = 24) in order to increase our sample size and to more accurately evaluate the spectrum of phenotypic variation for this species, which represents only about 1% of the salamanders encountered at Barton Springs [15,20]. The captive E. waterlooensis were mostly large adults, some of which have been maintained in the facility for over a decade, and far exceeded the size of the juveniles that are typically encountered at surface outflows. All salamanders were photographed individually in acrylic chambers with a 5 mm square grid background using a Nikon DSLR and macro lens (Figure 1A). These chambers contained enough spring water to maintain salamanders fully submerged and in a horizontal position for dorsal photographs.
To ensure independence of samples for statistical analyses, we first filtered the dataset for any recaptures of wild salamanders—after omitting these photographs our complete dataset was reduced to 773 unique individuals. For each salamander photograph, we used TpsDig2 [21] to measure snout–vent length (SVL; measured along the dorsal midline from the tip of the snout to the posterior insert of the hindlimbs) and trunk length (TL), as well as to digitize a landmark scheme that captured major aspects of head shape on a Cartesian coordinate system (Figure 1B). We selected 10 fixed landmarks, including the anterior and posterior extent of eye pigment (longest axis) and the posterior gill inserts for each of the six gills. We also selected 30 sliding semi-landmarks corresponding to the lateral outline of each side of the head (15 per side), as using both sides of a bilateral structure is generally more accurate than digitizing and reflecting a single side [22]. These semi-landmarks were evenly spaced between two fixed anchor points: the nasolabial groove and first gill insert. Because salamanders were able to move freely for photographs, trunks and limbs were not in standardized positions, and this precluded any repeatable postcranial landmarks. The landmark data matrix and associated data used for this study are available as Table S1.

2.2. Assignment of Individuals to Species/Groups and Assessment of Phenotypic Variation

We aligned landmarks using least squares generalized Procrustes analysis (GPA), which minimizes distances between specimen configurations and isolates shape information from size information [23,24,25]. Head size was calculated as the centroid size (CS), which is the square root of the summed squared distances of each landmark from the center of the configuration. We applied principal components analysis (PCA) to Procrustes shape coordinates to reduce dimensionality of the data into fewer composite variables (PC axes) that summarized the major axes of shape covariation. We retained for further analysis components that explained more than 4% of the total variation in the landmark dataset, with the assumption that axes explaining less than 4% of the variation contributed little biologically relevant information (see [26]) and were likely to structure noise variation from digitization or photographic artefacts.
One of our objectives was to validate Gaussian model-based clustering for distinguishing between the salamander species at Barton Springs, particularly at small body sizes, and to identify possible hybrids. From a multivariate perspective, hybrid phenotypes are often intermediate between parental phenotypes, but may also diverge from either parental species, a phenomenon known as transgressive segregation [27,28]. Model-based clustering is an unsupervised machine learning approach that has several advantages over k-means clustering, including that clusters are permitted various shapes, volumes, and variance structures [29,30]. As implemented in mclust [9], model-based clustering uses the Expectation-Maximization (EM) algorithm to delimit the number and assignment of individual cases to groups based on the best-fitting set of multivariate normal distributions, while optimizing over different parameterizations of the covariance matrix [8,9]. Clusters represent the best allocation of a mixed sample to separate multivariate normal distributions independent of a priori group assignments [9]. We hypothesized that mclust would infer a minimum of three groups corresponding to E. sosorum, E. waterlooensis, and putative hybrids, respectively. For model-based clustering, we included log CS, and log TL, and factor scores from the retained PC axes. We evaluated results of model-based clustering for congruence to classifications based on expert identifications.
We updated assignments of specimens to species based on results of model-based clustering and evaluated allometric differences in head size (log CS) and trunk length (log TL) between E. sosorum and E. waterlooensis. We then reran PCAs separately for each species and visualized taxon-specific head shape variation using thin-plate spline deformation grids, which here show shifts in head shape modeled at two standard deviations above and below the sample mean for each PC axis retained. Generalized Procrustes analysis, PCA, and thin-plate spline deformation grids were performed in R v.3.6.1 [31], using the Statistical Shape Analysis (SHAPES) package [32].

2.3. Microgeographic Variation in Eurycea Sosorum

Because sample size for E. sosorum was sufficiently large, we also evaluated microgeographic (i.e., different spring outflows) variation in head morphology within this taxon. Although the individual spring outlets are interconnected as the Barton Springs segment of the Edwards Aquifer, to date, individual salamanders have not been recaptured from different spring outflows [20]. While E. sosorum individuals move between surface and subterranean habitats [20], migration within the karst system might be restricted. Accordingly, structured phenotypic variation might be detectable among spring outlets. Alternatively, microgeographic variation could result from phenotypic plasticity or polyphenism related to different microhabitat availability, or different frequencies of hybridization with E. waterlooensis, across the different spring outlets. For this analysis, we used a MANOVA approach, using the package heplots [33], with factor scores from the first six PC axes of the analysis of the complete dataset as the dependent variables (excluding E. waterlooensis individuals), locality and season as main effects, CS as a covariate, and interaction terms for locality*CS and season*CS. For this model, the multivariate F-values were approximated using the Pillai method.

3. Results

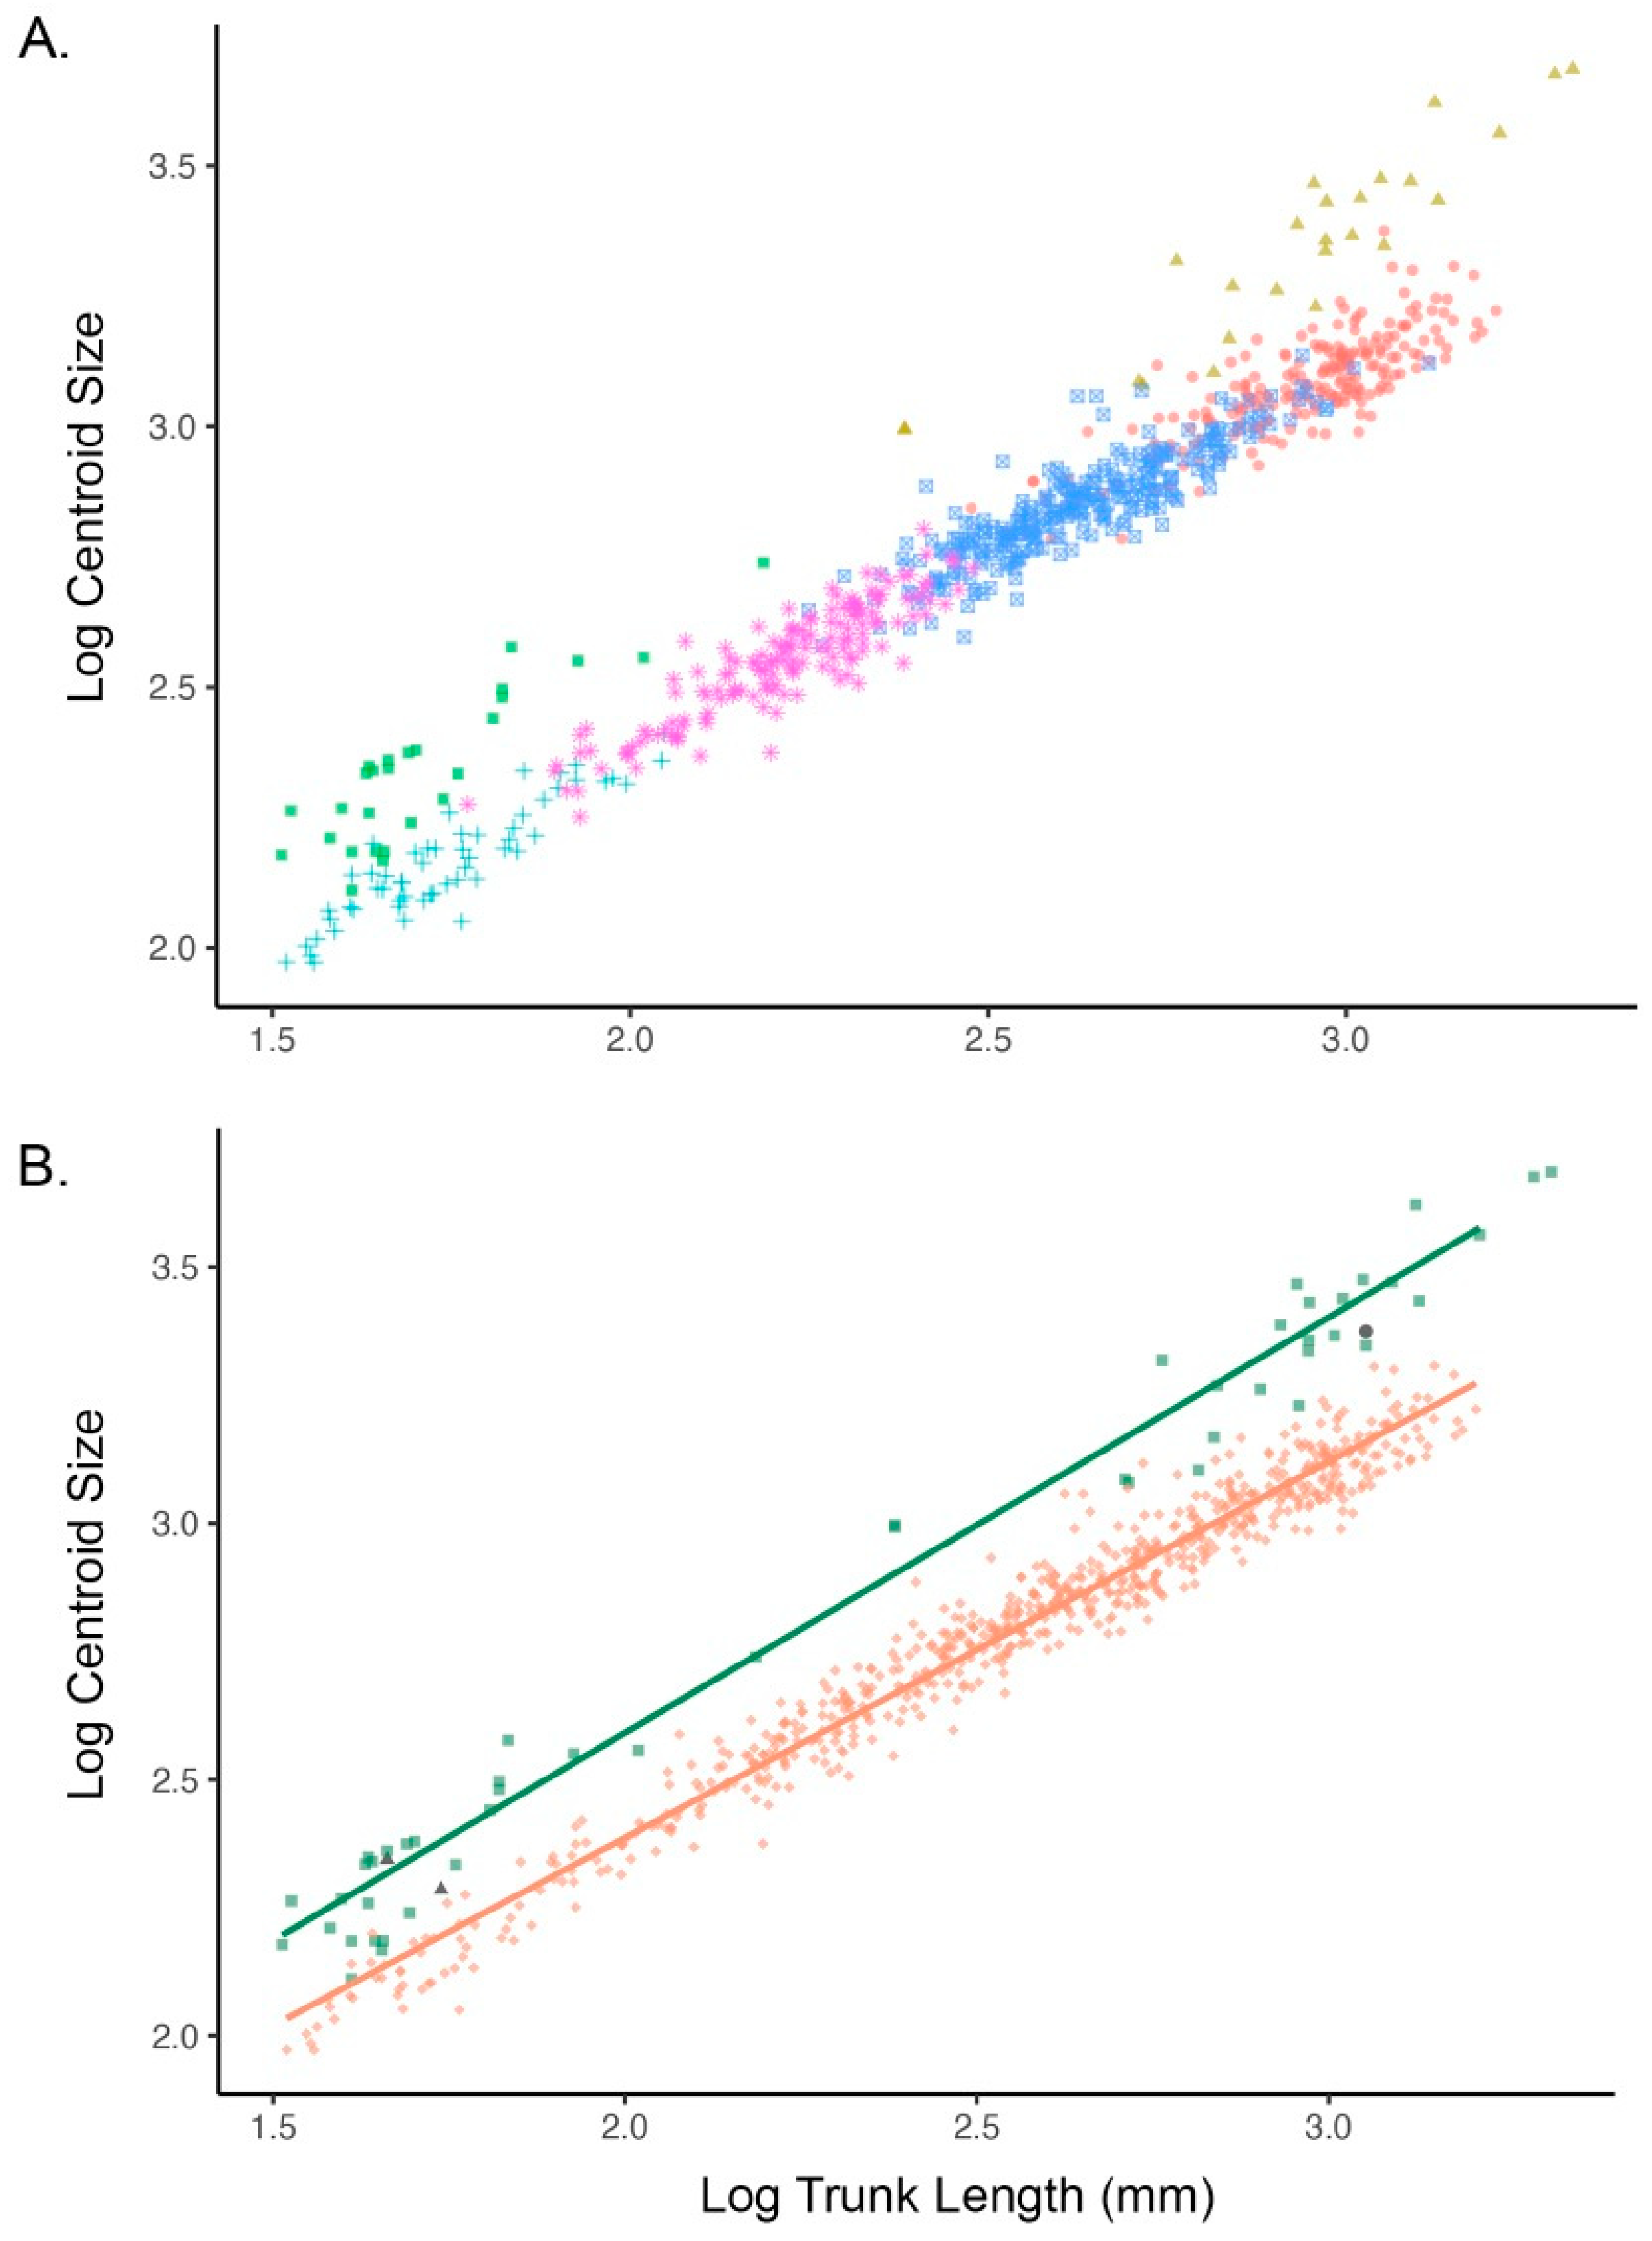
3.1. Model-Based Clustering

We retained the first six components from the preliminary PCA of the complete (i.e., mixed species) dataset, which collectively explained nearly 79.5% of the total variance in the salamander head shape data. Bayesian clustering of the PC factor scores, log CS, and log TL inferred six clusters under the ellipsoidal, equal volume, shape, and orientation (EEE) model (Figure 2A), which had the highest BIC value. Two of these six clusters were consistent with all individuals previously identified as E. waterlooensis. One of these groups comprised 27 specimens of wild E. waterlooensis juveniles, and the other consisted of 23 large adults from the captive facility as well as two additional wild subadult E. waterlooensis. The remaining four clusters appeared to comprise an ontogenetic series of mostly E. sosorum. Although natural hybrids were likely included in our dataset, none of the clusters appeared to represent any putative hybrid groups. Collectively, the two E. waterlooensis and four E. sosorum clusters were 99.6% congruent with expert identification at the species level, with only three discrepancies across the entire dataset. Two small specimens previously not identified as E. waterlooensis were assigned to the cluster of juveniles of this species, and one specimen of E. waterlooensis from the captive facility was erroneously assigned to an E. sosorum cluster (Figure 2B).

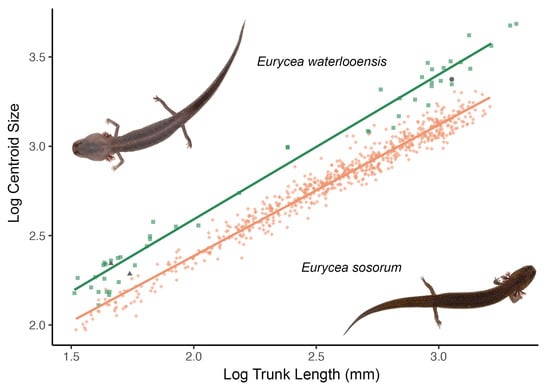
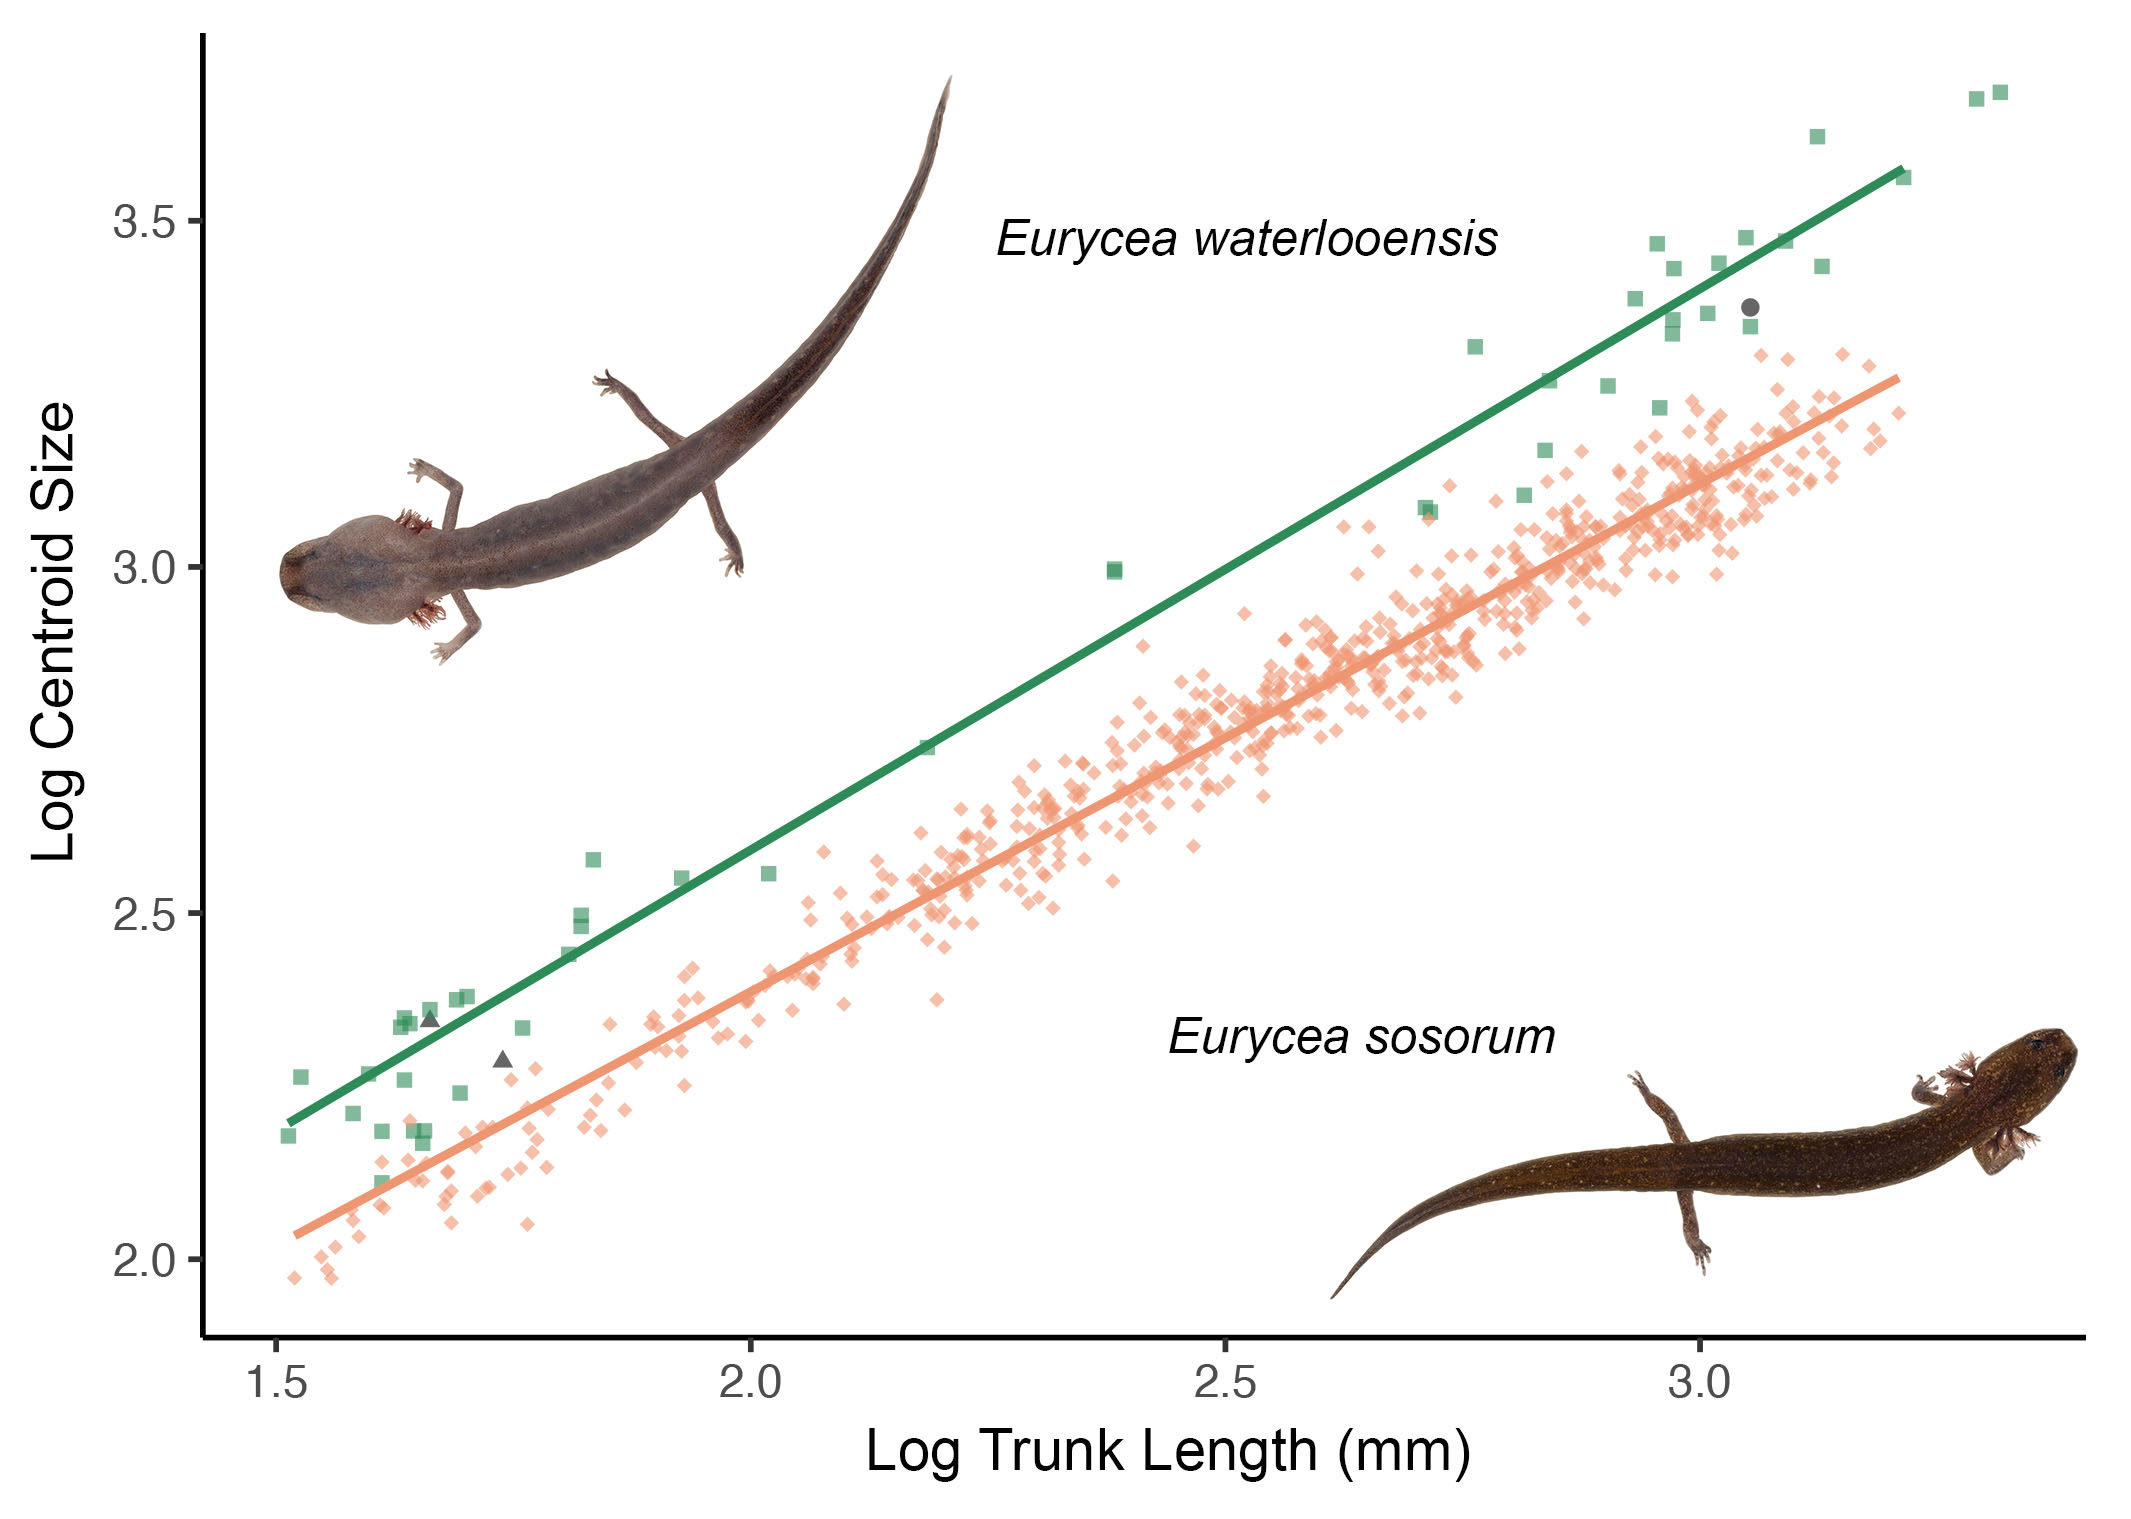
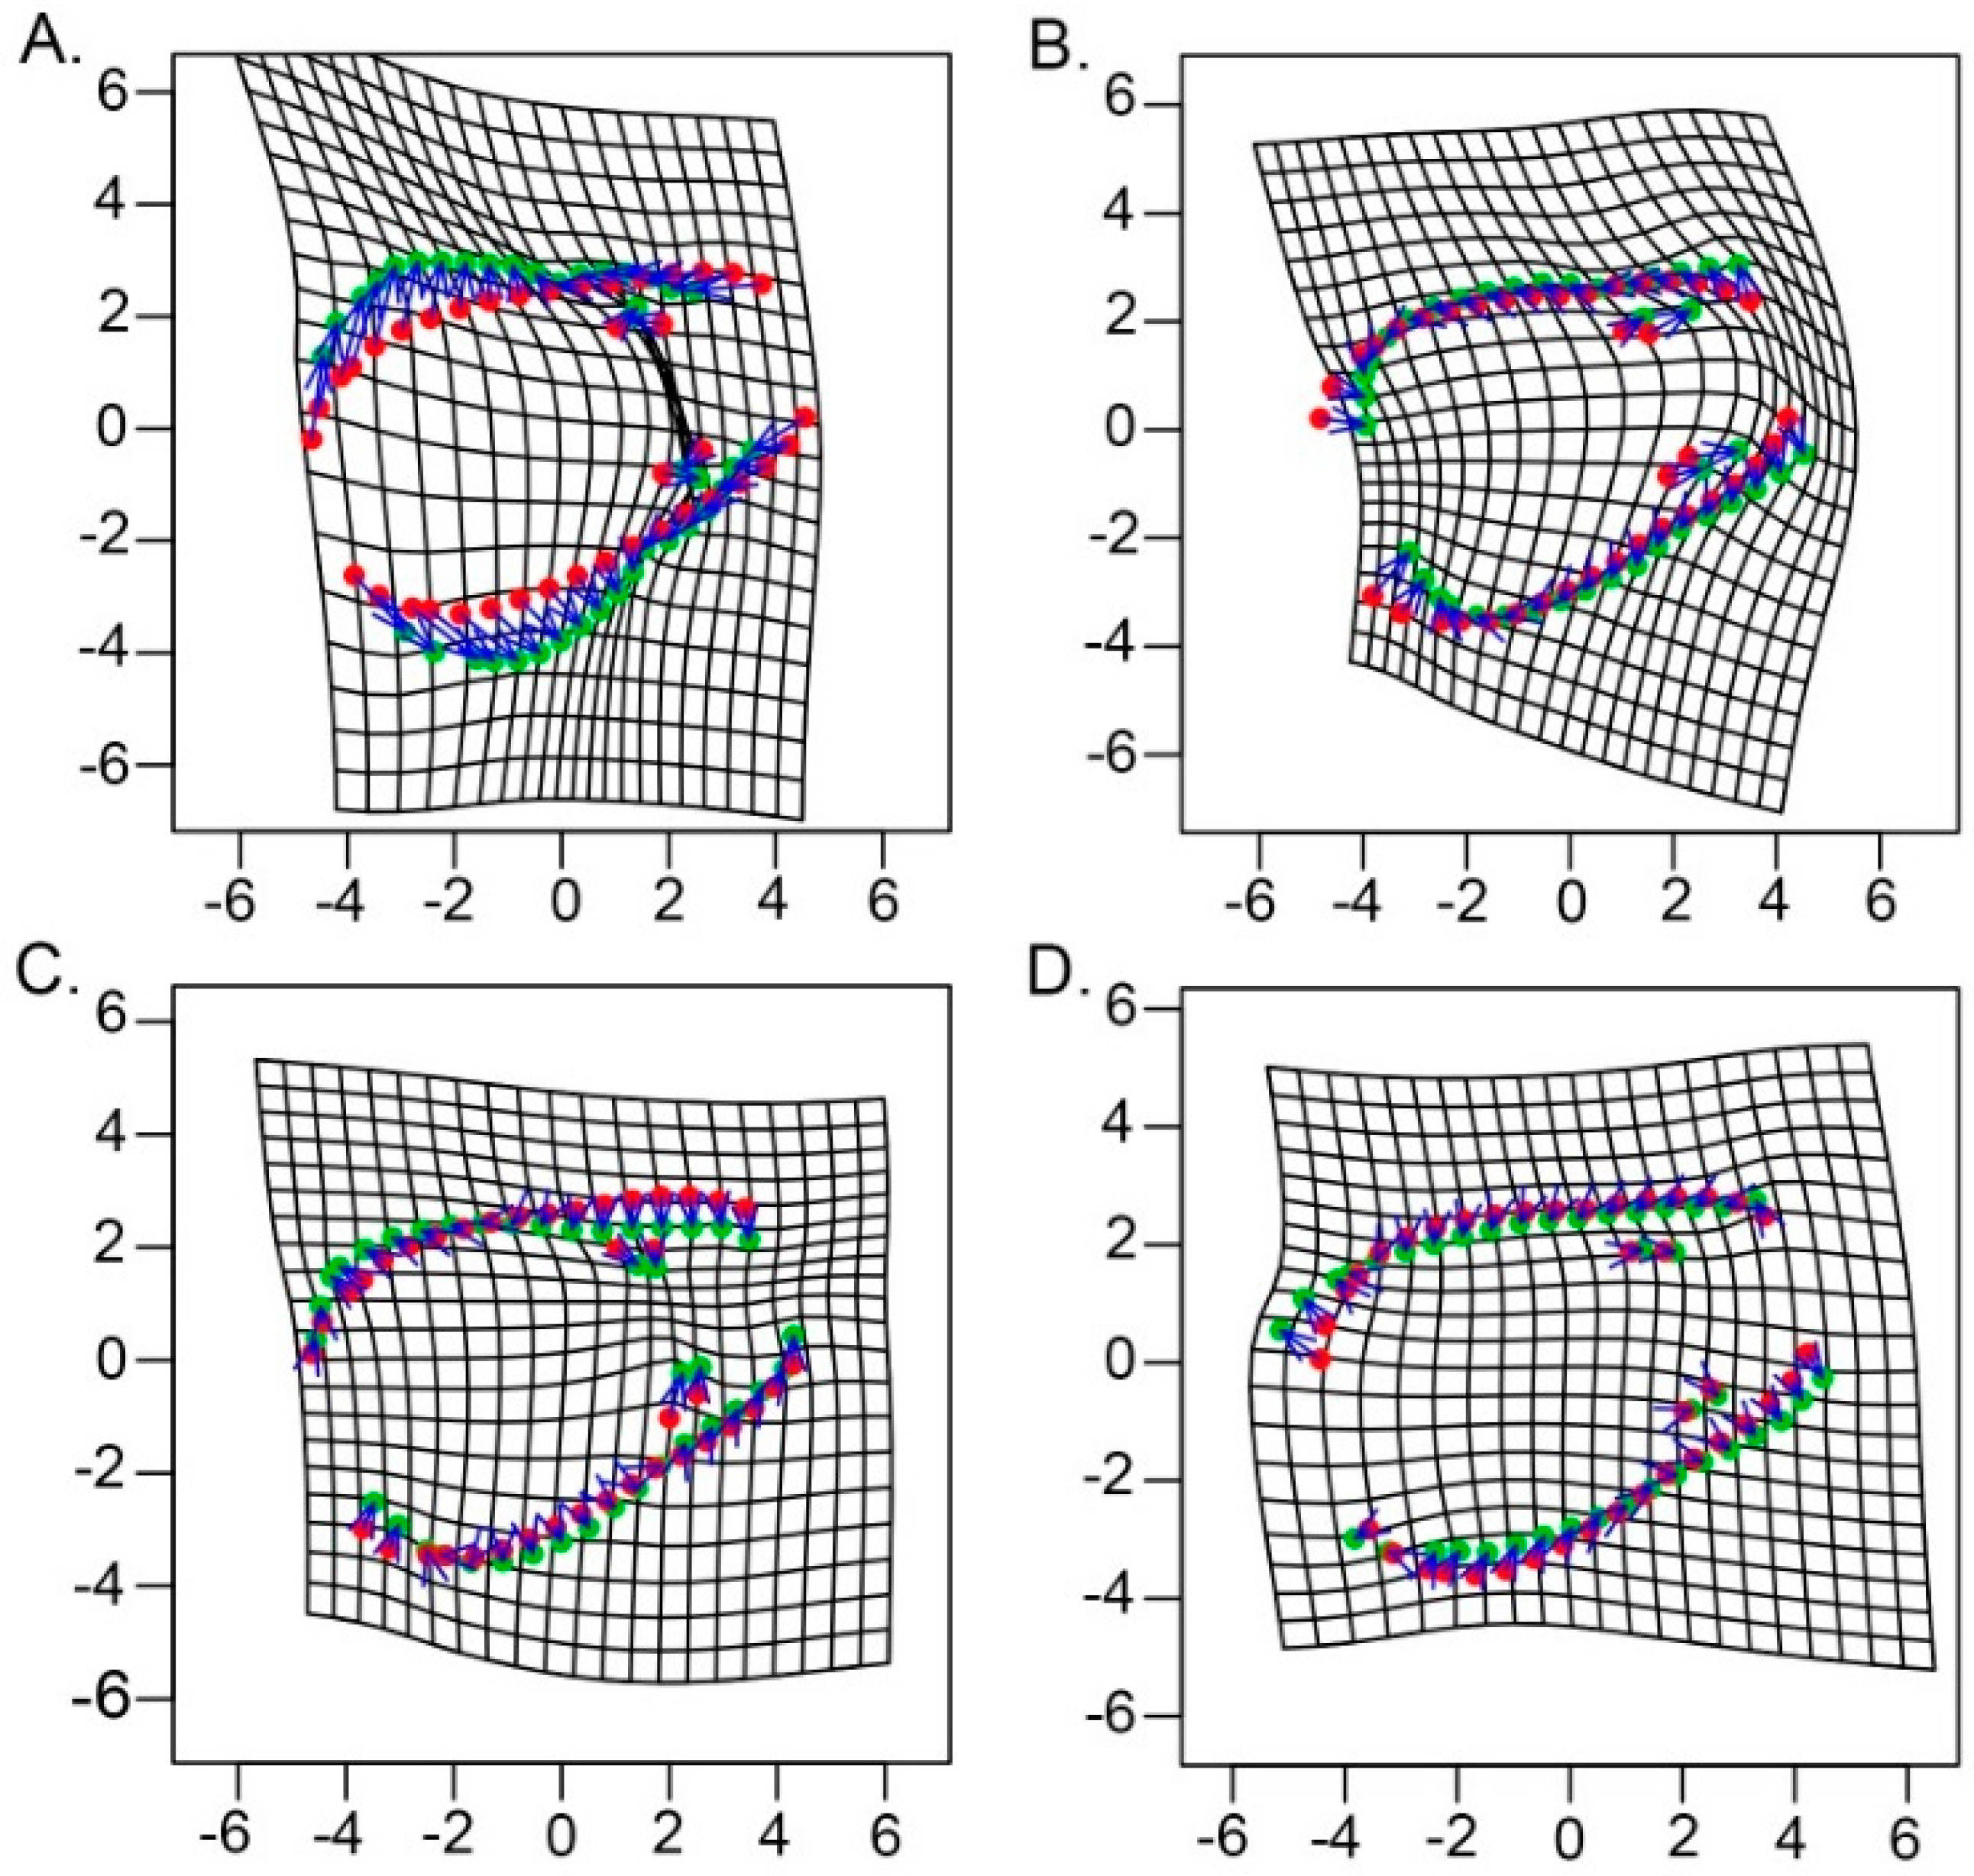
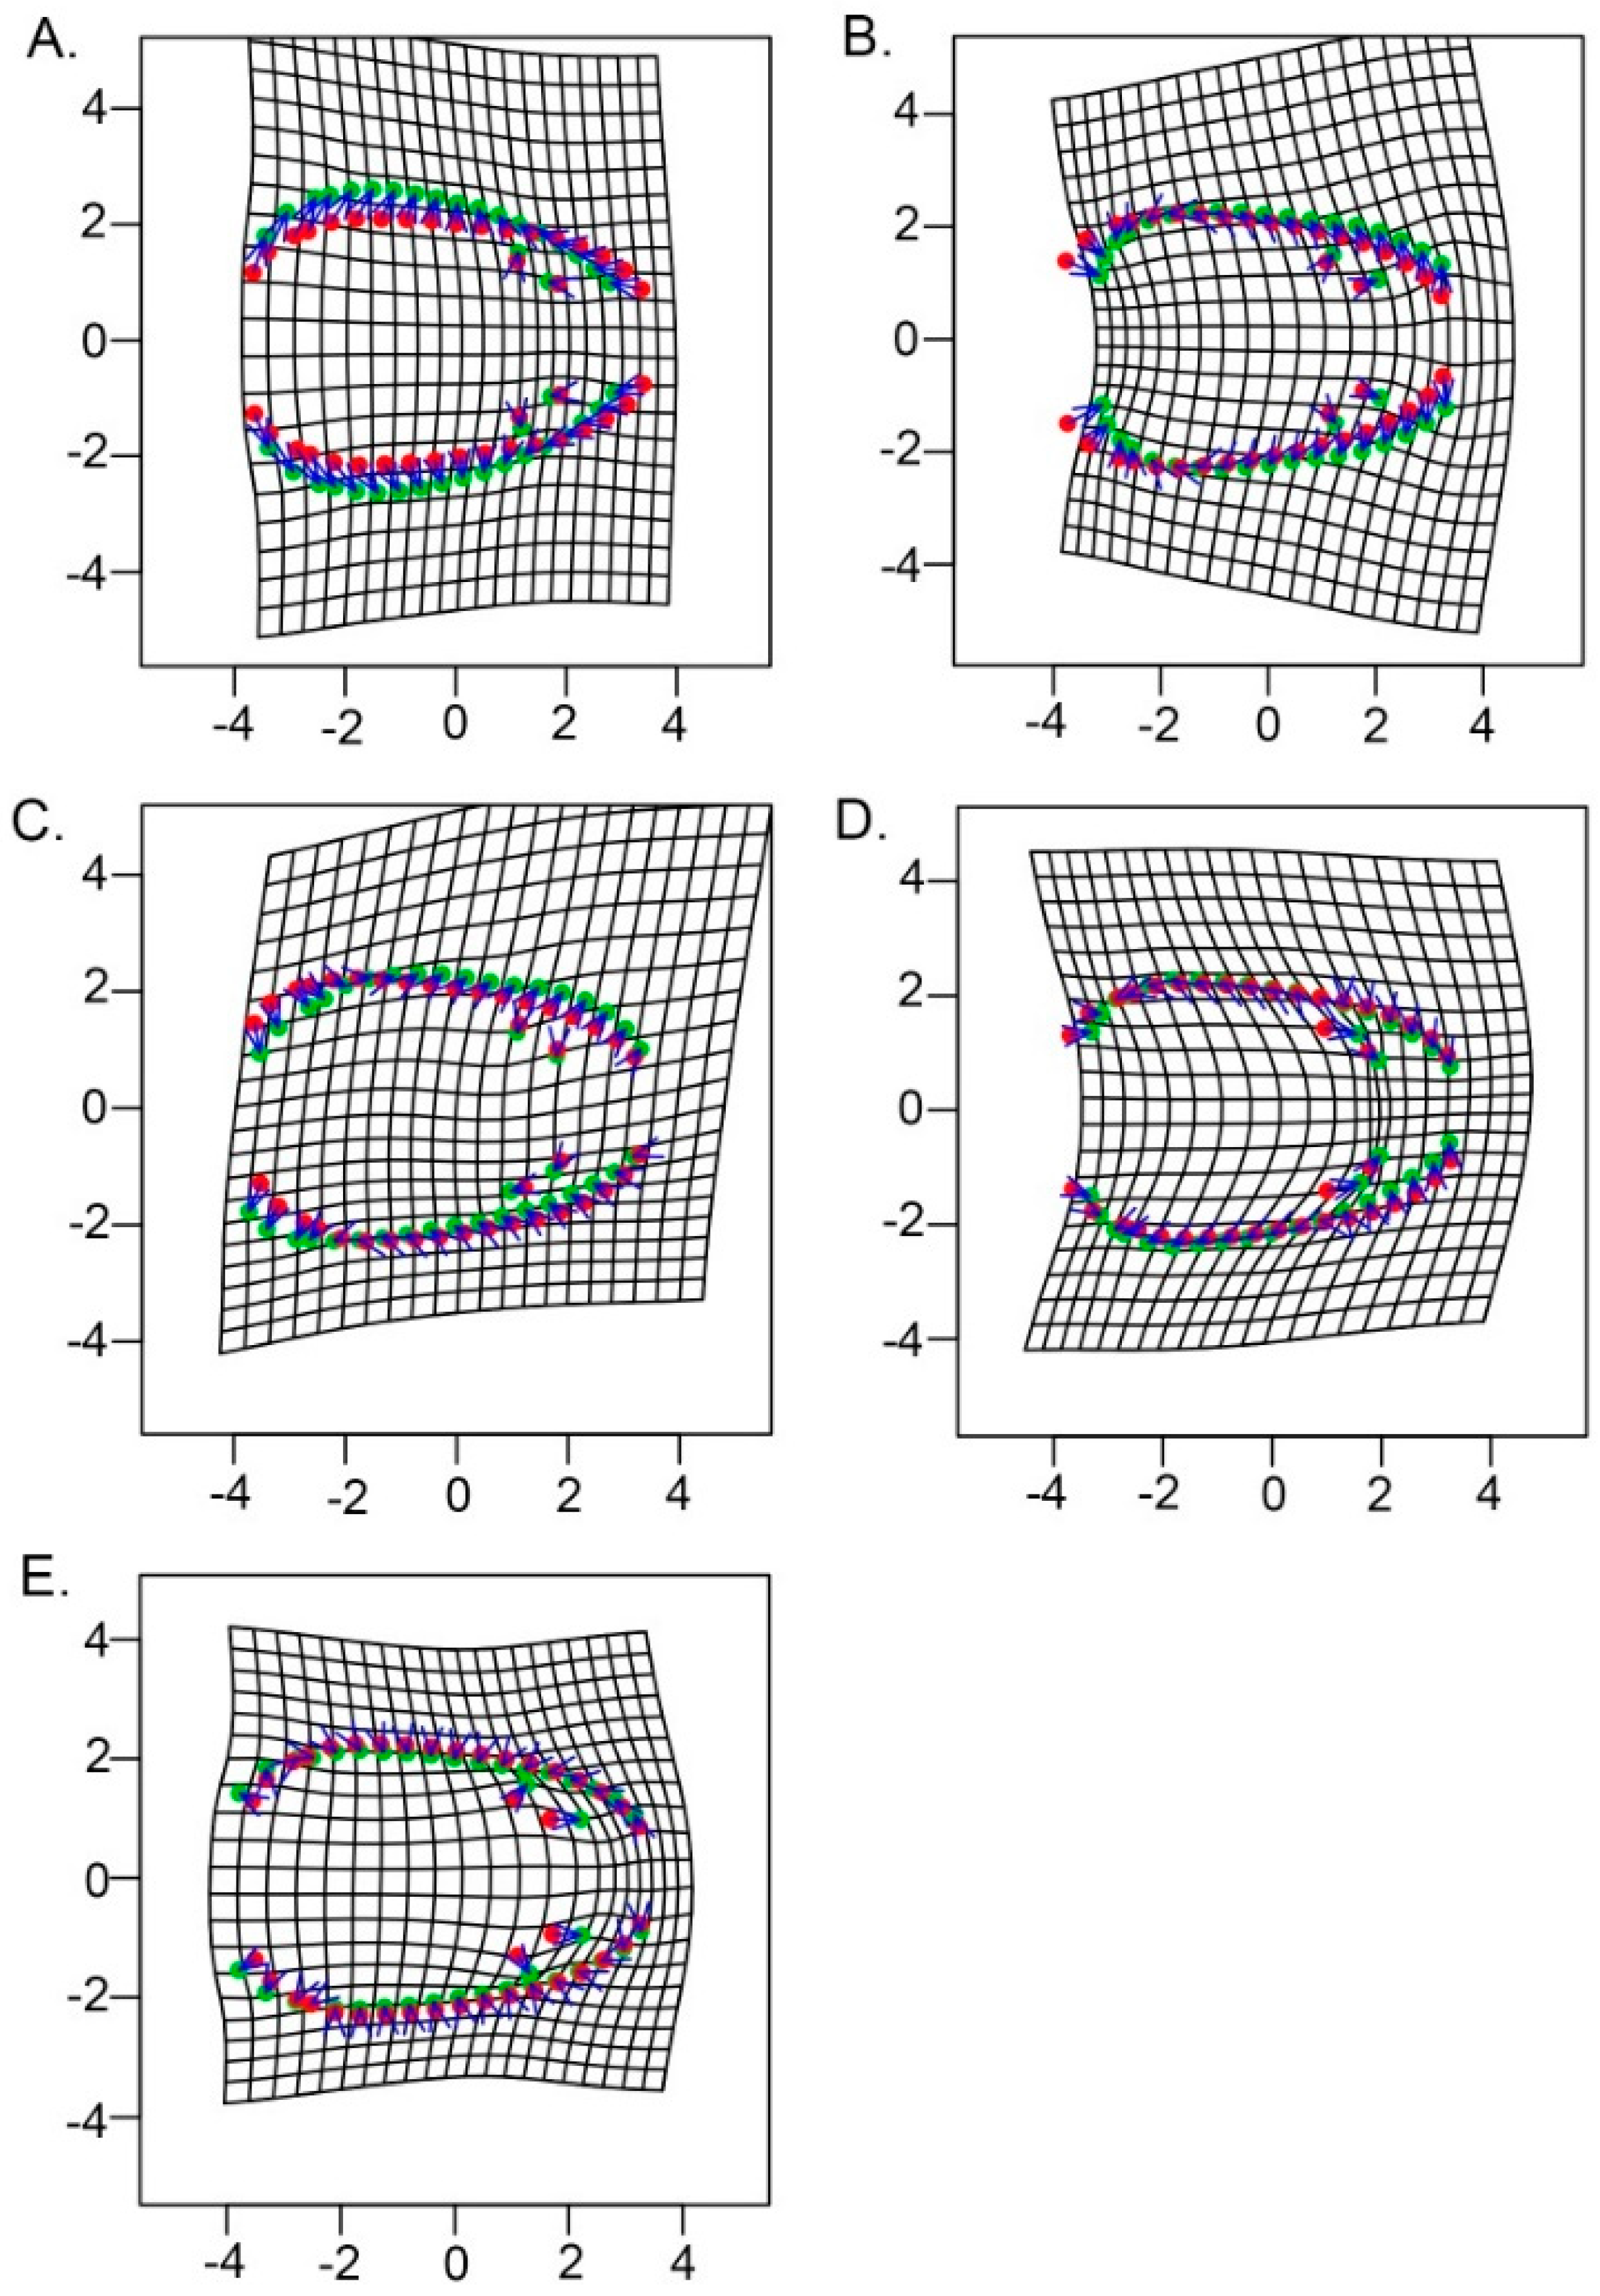
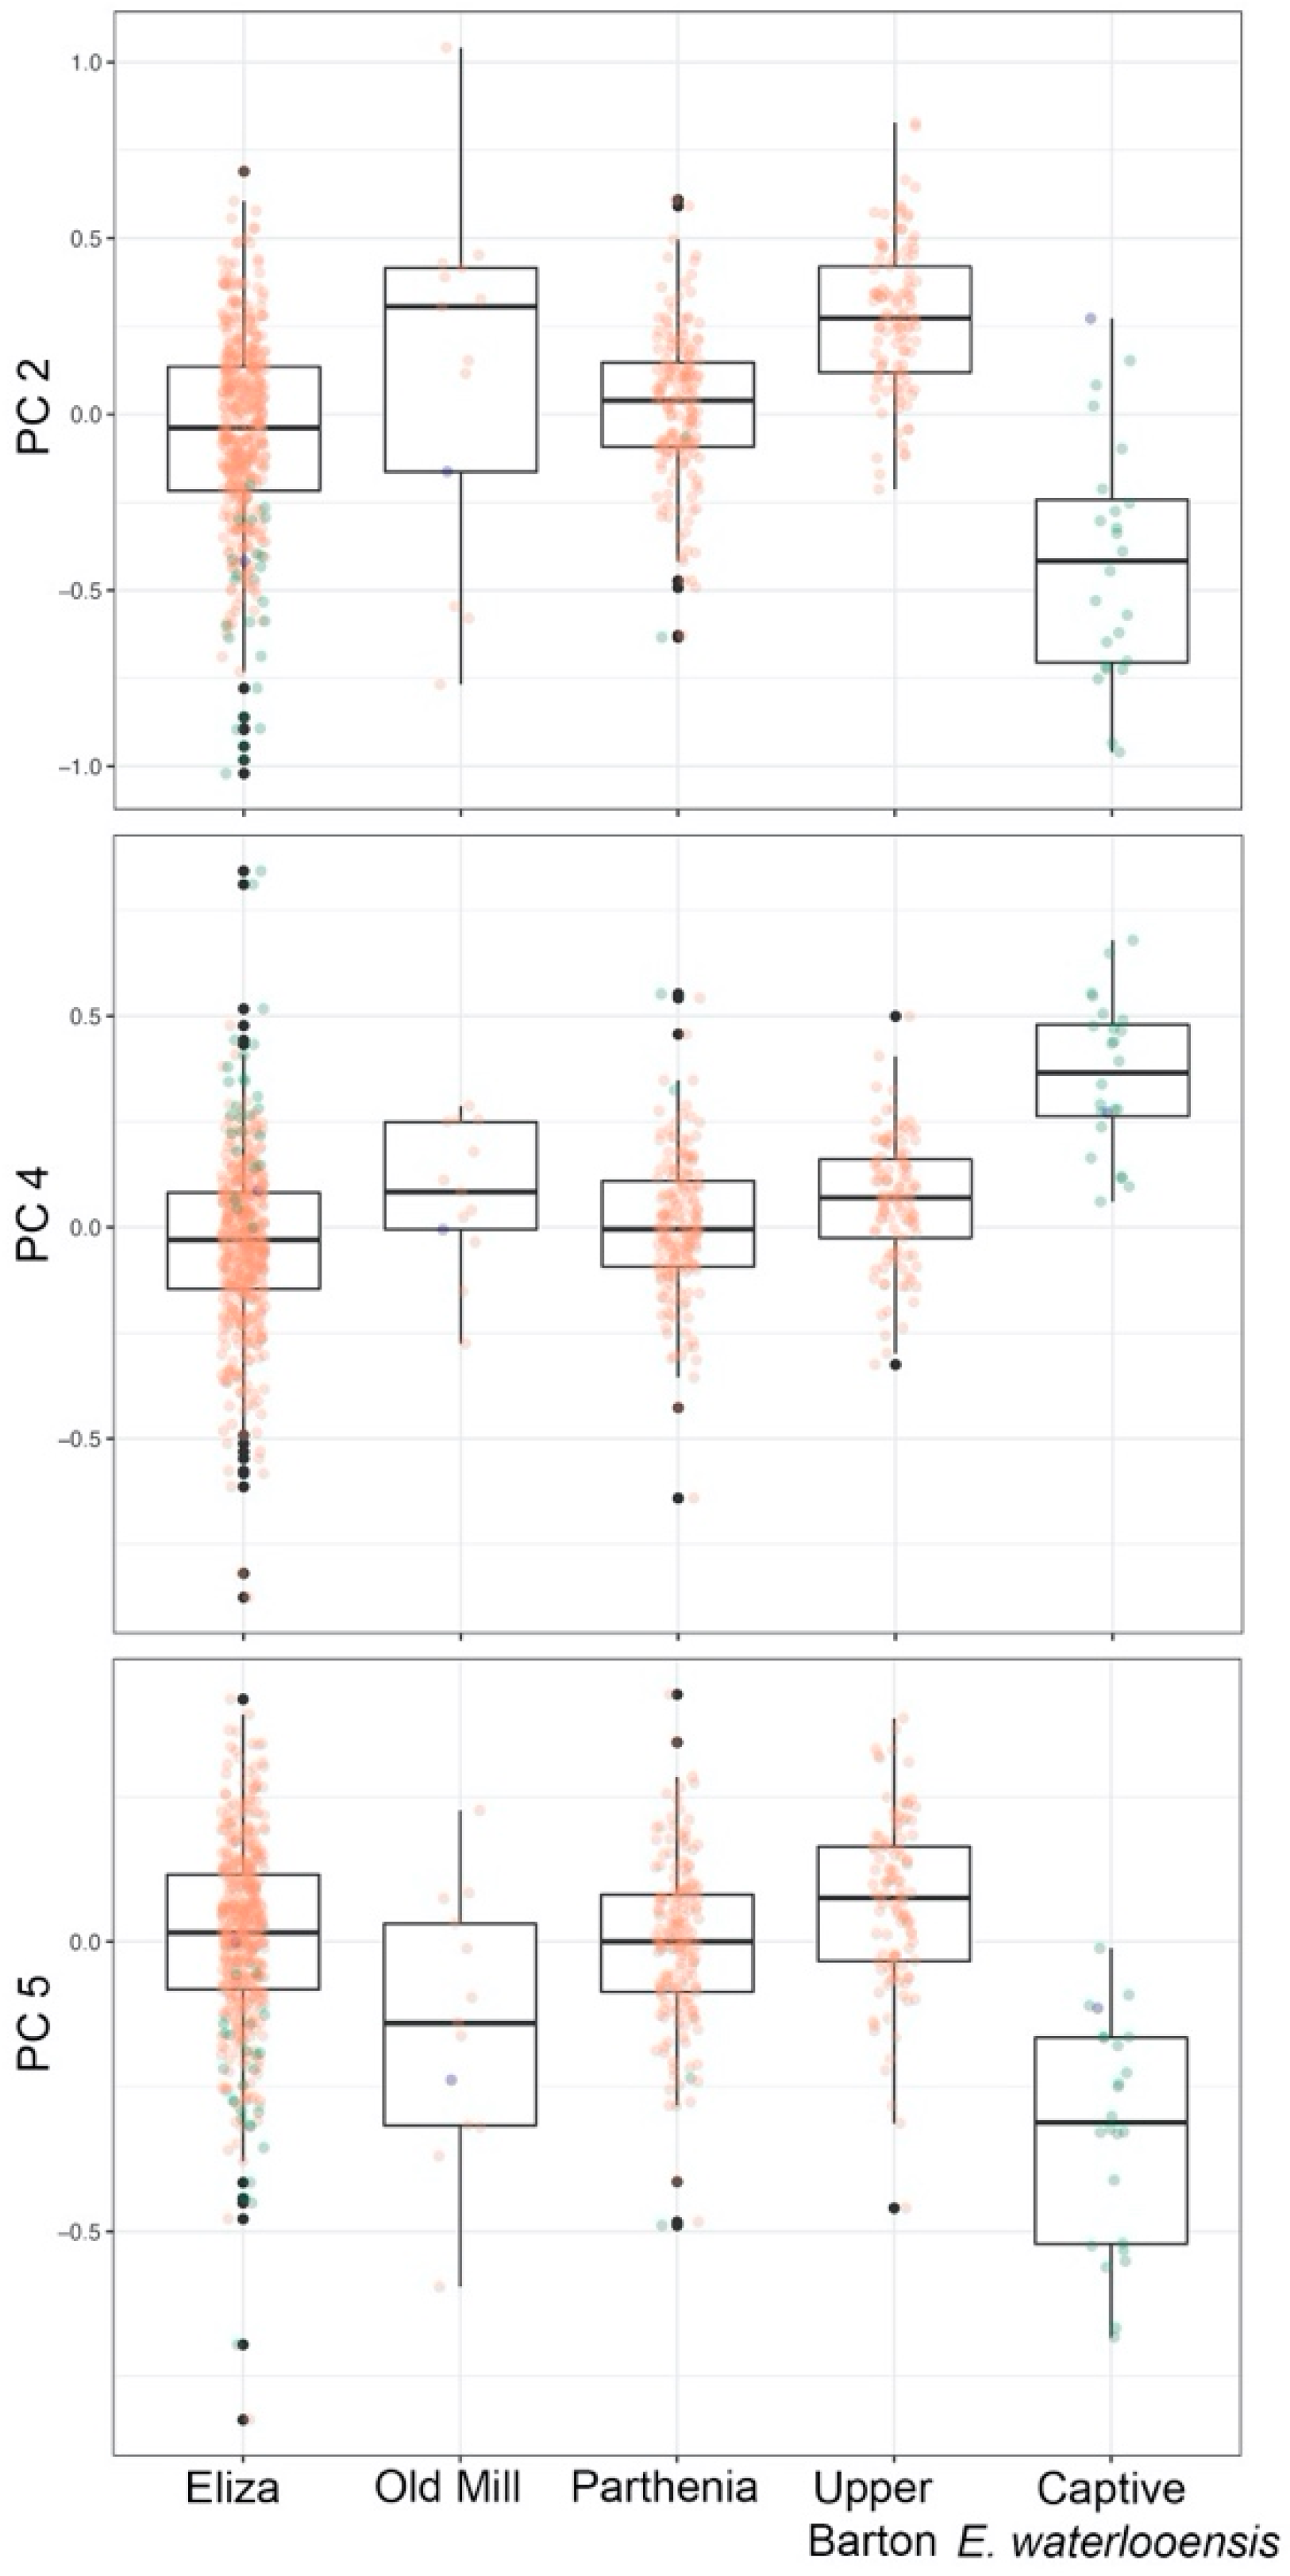
3.2. Allometry and Phenotypic Variation

The scaling relationship between CS and TL demonstrated negative allometry (i.e., slope < 1) for both E. waterlooensis (0.81 ± 0.03 SE, adj. R2 = 0.98) and E. sosorum (0.73 ± 0.01, adj. R2 = 0.96), with a somewhat lower slope for E. sosorum (Figure 2B). The intercept estimate was also somewhat higher for E. waterlooensis (0.97 ± 0.08) than for E. sosorum (0.92 ± 0.01), although standard errors overlapped. Collectively, these parameter estimates indicated that the larger relative head size to trunk length of E. waterlooensis is established during embryonic development but continues to diverge during ontogeny.
Although phenotypically distinctive, we noted some parallels in the structuring of head shape variation between E. sosorum and E. waterlooensis as evident from PCA and thin plate spline deformation grids. The first four PC axes accounted for 80% of the total variation in E. waterlooensis and the first five PC axes accounted for 74.8% in E. sosorum, indicating more complex covariance structure in the latter species. For both species, PC1 described a gradient from a narrow, elongated head shape to a broader head shape, but the expansion of the posterior two-thirds of the head was notably more pronounced in E. waterlooensis (Figure 3A, Figure 4A). Moreover, PC1 represented a distinct gradient from moderate-sized to virtually nonexistent eyes for E. waterlooensis with increasing head width but was negligible with respect to change in eye size for E. sosorum. For both species, PC2 described a shift from a rounded to an abrupt angular shape at the posterior region of the skull and a correlated expansion of the anterior snout with increased separation of the external nares (Figure 3B, Figure 4B). In addition to these features being more exaggerated in E. waterlooensis, this species also exhibited a concomitant forward and lateral placement of the eyes, which was less apparent in E. sosorum. Subsequent axes were less interpretable for both species; however, for E. sosorum PC4 reflected a decrease in eye size and simultaneous depression of the frontal region and PC5 reflected a subtle expansion of the frontal region as well as limited variation in eye size and placement. These axes were associated with more ‘troglomorphic’ variation in E. sosorum.

3.3. Microgeographic Variation in E. sosorum

Results from MANOVA indicated significant effects of season and locality on head shape variation in E. sosorum after controlling for the influence of log CS. However, these factors were subtle relative to the strong allometric effect that log CS had on head shape, which explained 49% of the total variation in head shape (Table 1). Interaction effects between locality and log CS and season and log CS were minor, if present at all, providing reasonable parameter estimates for main effects. Seasonal variation in head shape explained only 4% of the variance in the model and was related indirectly to an increase in average log CS across the subpopulations from fall to winter. Locality explained 15% of the variance in head shape after controlling for log CS, indicating modest but potentially relevant differences in phenotype between spring outflows (Table 1). For example, Upper Barton Springs had high values for PC2, PC4, and PC5, whereas Eliza had low values for PC2 and PC4 (Figure 5).

4. Discussion

Overall, model-based clustering using trunk length, head size, and head shape was highly effective at assigning individuals to E. waterlooensis and further to each of the two different sampling populations for this species based on expert identifications, i.e., clusters corresponding to wild juveniles and mostly captive adults. Although this result may seem trivial given the distinctive troglomorphic phenotype of this species, our analysis identified two additional E. waterlooensis juveniles that were misidentified as E. sosorum in the database (Figure 2B and Figure 6). Importantly, clustering was particularly effective at identifying salamanders of small body size (<15 mm TL), where visual identification is likely to be more ambiguous. The effectiveness of clustering for distinguishing species at the smallest body sizes is noteworthy because CS:TL allometry at hatching is less divergent than in adults. Our assessment of morphological variation demonstrated parallel allometric shifts in head morphology for E. waterlooensis and E. sosorum, but unique to E. waterlooensis was the dramatic decrease in eye size and anterolateral shift in eye position concomitant with the lateral expansion of the snout. Our results indicated that eye formation is initiated in E. waterlooensis but is developmentally arrested before or near the time of lens induction. Through normal growth, relative size of the eye spot decreases and is often further obscured by encroachment of overlying skin. These observations on eye development and ontogeny are consistent with previous assessments of other troglomorphic salamanders from Central Texas [34,35,36]. We posit that juveniles of E. waterlooensis could be readily misidentified visually because eye size and development are relatively greater at this life stage.
The partitioning of E. waterlooensis into two distinct clusters, rather than a single group, was expected given the large gap in data for body sizes intermediate between wild juveniles and large captive adults. However, the mclust algorithm partitioned the much larger sample of wild E. sosorum individuals into four multivariate normal clusters despite a lack of clear gaps in body size across the sample (Figure 2A). Although these four clusters together represent an ontogenetic series for E. sosorum, it is unclear what underlying data structures supported the inference of these distinct groups given the largely continuous data for this sampling population. We suspect that the clusters reflected idiosyncrasies in the sampling distribution of E. sosorum as the clustering algorithm optimized changes in head shape and covariance structure across the range of body size. A single adult E. waterlooensis from the captive facility was assigned to the cluster of E. sosorum that included individuals in the largest body size class. This specimen had CS:TL allometry and other morphological features consistent with E. waterlooensis (Figure 2B), but with well-developed eyes.
In a recent report, the City of Austin [14] concluded that six out of 90 specimens sampled from Barton Springs were hybrids between E. waterlooensis and E. sosorum based on nuclear DNA data (including backcrossed individuals); extrapolating from this frequency we can assume that our photographic dataset included at least some hybrids. Recombination of parental genomes in hybrids is expected to produce unique multivariate distributions of traits [27,37], which have the potential to be inferred as distinct clusters a posteriori. Nonetheless, while sets of clusters clearly represented each of the species in this study, none of the inferred clusters delineated groups that could be construed as putative hybrids. One explanation for an absence of hybrid clusters is that hybrids might not adhere to a cohesive phenotype, but rather exhibit unique parental traits that would result in their assignment to the cluster with the closest centroid. This phenomenon likely would be reinforced by backcrossing and low sample size of hybrids and could represent phenotypic outliers within their respective clusters [38]. An alternative explanation is that hybrid effects on morphological patterns are subtle relative to the strong allometric effects on head morphology (49% of variation in head shape was explained by allometry), and therefore, hybrids were not inferred as distinct clusters.
Although initially considered a primarily surface-dwelling species, the description of E. sosorum noted that the species is morphologically intermediate between surface-dwelling and subterranean salamander populations [17]. Recent research has confirmed that the species uses both surface and subterranean groundwater extensively [12,20,39,40]. Because our landmark configurations were the same for both E. sosorum and E. waterlooensis, separate PCAs were directly comparable, and we noted that variation is more complex for E. sosorum. One possibility for the more complex covariance structure could be related to the fact that E. sosorum regularly exploits two different environments and their interface, promoting different selection regimes within the species. We noted microgeographic intraspecific variation that seemed to reflect aspects of morphology related to troglomorphism. For example, E. sosorum at Old Mill had factor scores on PC4 and PC5 that were more similar to captive E. waterlooensis (Figure 5), and individuals from this subpopulation might inhabit the subterranean parts of the springs, as they are found rarely at the surface at this site. Alternatively, the more troglomorphic phenotypes at Old Mill might represent higher frequency of undetected hybridization with E. waterlooensis relative to other spring outflows. Taken together, these results suggest that natural hybrids might be difficult to distinguish phenotypically given the extensive variation in E. sosorum that includes troglomorphic features.
The major objectives of this study were to evaluate phenotypic variation in two endangered syntopic salamanders using geometric morphometrics and to evaluate the potential for a recent model-based clustering approach to identify between the species as well as possible hybrids, which are difficult to objectively distinguish from anomalous intraspecific variation using only visual identification. Given the current biodiversity crisis and efforts to move away from collecting physical vouchers as well as minimizing disturbances of endangered species, conservation biologists must rely increasingly on high-resolution photographs and machine learning algorithms to collect and analyze biological data [41]. Moreover, we contend that biologists have an ethical mandate to maximize data collected from each disruptive event of any wild endangered species. Although photographs of Barton Springs and Austin blind salamanders were taken for other purposes in a semi-controlled environment without restraint or anesthesia, we were able to use these photographs retrospectively to characterize phenotypic variation in head shape and assign clusters to species with a remarkable degree of correspondence with expert identification. Along with incorporating new methods for automating the digitization process e.g., [42], refinement of this clustering pipeline will allow for accurate and objective assignment of species for even small juveniles without expert identification. Unfortunately, our analyses did not infer any clusters that corresponded to putative hybrids, despite the fact that some hybrids likely were included in the dataset. Future studies will require phenotypic evaluation of confirmed hybrids (i.e., through crossing experiments or by genotyping) in comparison to confirmed parentals to better evaluate whether hybridization between E. waterlooensis and E. sosorum can be detected from standardized photographs.

Supplementary Materials

The following is available online at https://www.mdpi.com/1424-2818/12/8/297/s1, Table S1: Landmark matrix and associated data for geometric morphometrics analysis.

Author Contributions

Conceptualization, D.M.S., N.F.B., J.M.M.; methodology, D.M.S., N.F.B., J.A.W., J.M.M.; formal analysis, D.M.S., J.A.W., J.M.M.; resources, N.F.B., D.A.C.; data curation, D.M.S., N.F.B., D.A.C.; writing—original draft preparation, D.M.S., J.M.M.; writing—review and editing, D.M.S., N.F.B., D.A.C., J.A.W., J.M.M. All authors have read and agreed to the published version of the manuscript.

Funding

This research received no external funding.

Acknowledgments

We thank A.M. Lawing for sharing her expertise on geometric morphometrics, and P.D. Sudman and V.L.S. Chraïbi for comments on an earlier version of this manuscript.

Conflicts of Interest

The authors declare no conflict of interest.

References

  1. Bensmail, H.; Celeux, G.; Raftery, A.E.; Robert, C.P. Inference in model-based cluster analysis. Stat. Comput. 1997, 7, 1–10. [Google Scholar] [CrossRef]
  2. Bing, X.; Bunea, F.; Royer, M.; Das, J. Latent model-based clustering for biological discovery. iScience 2019, 14, 125–135. [Google Scholar] [CrossRef] [PubMed] [Green Version]
  3. Pan, W.; Lin, J.; Le, C.T. Model-based cluster analysis of microarray gene-expression data. Genome Biol. 2002, 3, research0009.1. [Google Scholar]
  4. Medvedovic, M.; Yeung, K.Y.; Bumgarner, R.E. Bayesian mixture model-based clustering of replicated microarray data. Bioinformatics 2004, 20, 1222–1232. [Google Scholar] [CrossRef] [PubMed] [Green Version]
  5. Ezard, T.H.G.; Pearson, P.N.; Purvis, A. Algorithmic approaches to aid species’ delimitation in multidimensional morphospace. BMC Evol. Biol. 2010, 10, 175. [Google Scholar] [CrossRef] [Green Version]
  6. Meik, J.M.; Streicher, J.W.; Lawing, A.M.; Flores-Villela, O.; Fujita, M.K. Limitations of climatic data for inferring species boundaries: Insights from speckled rattlesnakes. PLoS ONE 2015, 10, e0131435. [Google Scholar] [CrossRef] [Green Version]
  7. Cadena, C.D.; Zapata, F.; Jiménez, I. Issues and perspectives in species delimitation using phenotypic data: Atlantean evolution in Darwin’s finches. Syst. Biol. 2018, 67, 181–194. [Google Scholar] [CrossRef]
  8. Fraley, C.; Raftery, A.E. Model-based clustering, discriminant analysis, and density estimation. J. Am. Stat. Assoc. 2002, 97, 611–631. [Google Scholar] [CrossRef]
  9. Scrucca, L.; Fop, M.; Murphy, T.B.; Raftery, A.E. mclust 5: Clustering, classification and density estimation using Gaussian finite mixture models. R J. 2016, 8, 289–317. [Google Scholar] [CrossRef] [Green Version]
  10. Ronan, T.; Qi, Z.; Naegle, K.M. Avoiding common pitfalls when clustering biological data. Sci. Signal. 2016, 9, re6. [Google Scholar] [CrossRef] [Green Version]
  11. Chippindale, P.T.; Price, A.H.; Wiens, J.J.; Hillis, D.M. Phylogenetic relationships and systematic revision of central Texas hemidactyliine plethodontid salamanders. Herpetol. Monogr. 2000, 14, 1–80. [Google Scholar] [CrossRef] [Green Version]
  12. Bendik, N.F.; Meik, J.M.; Gluesenkamp, A.G.; Roelke, C.E.; Chippindale, P.T. Biogeography, phylogeny, and morphological evolution of central Texas cave and spring salamanders. BMC Evol. Biol. 2013, 13, 201. [Google Scholar] [CrossRef] [PubMed] [Green Version]
  13. Devitt, T.J.; Wright, A.M.; Cannatella, D.C.; Hillis, D.M. Species delimitation in endangered groundwater salamanders: Implications for aquifer management and biodiversity conservation. Proc. Natl. Acad. Sci. USA 2019, 116, 2624–2633. [Google Scholar] [CrossRef] [PubMed] [Green Version]
  14. City of Austin. 2018 Annual Report U.S. Fish and Wildlife Service Scientific Permit (TE-833851); Watershed Protection Department: Austin, TX, USA, 2018. Available online: www.austintexas.gov/edims/pio/document.cfm?id=314140 (accessed on 20 June 2020).
  15. Hillis, D.M.; Chamberlain, D.A.; Wilcox, T.P.; Chippindale, P.T. A New species of subterranean blind salamander (Plethodontidae: Hemidactyliini: Eurycea: Typhlomolge) from Austin, Texas, and a systematic revision of central Texas paedomorphic salamanders. Herpetologica 2001, 57, 266–280. [Google Scholar]
  16. Wiens, J.J.; Chippindale, P.T.; Hillis, D.M. When are phylogenetic analyses misled by convergence? A case study in Texas cave salamanders. Syst. Biol. 2003, 52, 501–514. [Google Scholar] [CrossRef]
  17. Chippindale, P.T.; Price, A.H.; Hillis, D.M. A new species of perennibranchiate salamander (Eurycea: Plethodontidae) from Austin, Texas. Herpetologica 1993, 49, 248–259. [Google Scholar]
  18. Bendik, N.F.; Morrison, T.A.; Gluesenkamp, A.G.; Sanders, M.S.; O’Donnell, L.J. Computer-assisted photo identification outperforms visible implant elastomers in an endangered salamander, Eurycea tonkawae. PLoS ONE 2013, 8, e59424. [Google Scholar] [CrossRef] [Green Version]
  19. Bendik, N.F.; Dries, L.A. Density-dependent and density-independent drivers of population change in Barton Springs salamanders. Ecol. Evol. 2018, 8, 5912–5923. [Google Scholar] [CrossRef]
  20. Bendik, N.F.; Chamberlain, D.A.; Devitt, T.J.; Robinson, D. Barton Springs and Austin Blind Salamander Capture-Recapture Study: Interim Report Submitted to City of Austin Watershed Protection Department. 2019. Available online: http://www.austintexas.gov/watershed_protection/publications/document.cfm?id=339918 (accessed on 20 June 2020).
  21. Rohlf, F.J. TpsDig2. 2010. Available online: https://tpsdig2.software.informer.com/download (accessed on 20 June 2020).
  22. Cardini, A. Lost in the other half: Improving accuracy in geometric morphometric analyses of one side of bilaterally symmetric structures. Syst. Biol. 2016, 65, 1096–1106. [Google Scholar] [CrossRef]
  23. Lawing, A.M.; Polly, P.D. Geometric morphometrics: Recent applications to the study of evolution and development. J. Zool. 2010, 280, 1–7. [Google Scholar] [CrossRef]
  24. Kaliontzopoulou, A. Geometric morphometrics in herpetology: Modern tools for enhancing the study of morphological variation in amphibians and reptiles. Basic Appl. Herpetol. 2011, 25, 5–32. [Google Scholar] [CrossRef] [Green Version]
  25. Zelditch, M.L.; Swiderski, D.L.; Sheets, H.D. Geometric Morphometrics for Biologists: A Primer, 2nd ed.; Academic Press: San Diego, CA, USA, 2012; pp. 105–128. [Google Scholar]
  26. Björklund, M. Be careful with your principal components. Evolution 2019, 73, 2151–2158. [Google Scholar] [CrossRef] [PubMed]
  27. Rieseberg, L.H.; Archer, M.A.; Wayne, R.K. Transgressive segregation, adaptation and speciation. Heredity 1999, 83, 363–372. [Google Scholar] [CrossRef] [PubMed]
  28. Bell, M.A.; Travis, M.P. Hybridization, transgressive segregation, genetic covariation, and adaptive radiation. Trends Ecol. Evol. 2005, 20, 358–361. [Google Scholar] [CrossRef] [PubMed]
  29. Bruce, P.; Bruce, A. Practical Statistics for Data Scientists: 50 Essential Concepts, 1st ed.; O’Reilly Media Inc.: Sebastopol, CA, USA, 2017; pp. 270–276. [Google Scholar]
  30. Fruhwirth-Schnatter, S.; Celeux, G.; Robert, C.P. Model-based clustering. In Handbook of Mixture Analysis; Chapman and Hall: New York, NY, USA, 2019; pp. 158–184. [Google Scholar]
  31. R: A Language and Environment for Statistical Computing. Available online: https://www.gbif.org/tool/81287/r-a-language-and-environment-for-statistical-computing (accessed on 20 June 2020).
  32. Shapes: Statistical Shape Analysis. Available online: https://cran.r-project.org/package=shapes (accessed on 20 June 2020).
  33. Fox, J.; Friendly, M.; Monette, G. Visualizing hypothesis tests in multivariate linear models: The heplots package for R. Comput. Stat. 2008, 24, 233–246. [Google Scholar] [CrossRef] [Green Version]
  34. Mitchell, R.W.; Reddell, J.R. Eurycea tridentifera, a new species of troglobitic salamander from Texas and a reclassification of Typhlomolge rathbuni. Tex. J. Sci. 1965, 17, 12–27. [Google Scholar]
  35. Mitchell, R.W.; Smith, R.E. Some aspects of the osteology and evolution of the neotenic spring and cave salamanders (Eurycea, Plethodontidae) of central Texas. Tex. J. Sci. 1972, 23, 343–362. [Google Scholar]
  36. Sweet, S.S. Secondary contact and hybridization in the Texas cave salamanders Eurycea neotenes and E. tridentifera. Copeia 1984, 1984, 428–441. [Google Scholar] [CrossRef] [Green Version]
  37. Coyne, J.A.; Orr, H.A. Speciation; Sinauer Assoc.: Sunderland, MA, USA, 2004; pp. 1–25. [Google Scholar]
  38. Nichols, P.; Genner, M.J.; Oosterhout, C.V.; Smith, A.; Parsons, P.; Sungani, H.; Swanstrom, J.; Joyce, D.A. Secondary contact seeds phenotypic novelty in cichlid fishes. Proc. R. Soc. B. 2015, 282, 20142272. [Google Scholar] [CrossRef] [Green Version]
  39. McDermid, K.; Sprouse, P.; Krejca, J. Geographical distribution: Eurycea sosorum (Barton Springs salamander). Herpetol. Rev. 2015, 556–578. [Google Scholar]
  40. Devitt, T.; Nissen, B.D. New occurrence records for Eurycea sosorum Chippindale, Price & Hillis, 1993 (Caudata, Plethodontidae) in Travis and Hays counties, Texas, USA. Check List 2018, 14, 297–301. [Google Scholar]
  41. Santos, C.M.D.; Amorim, D.S.; Klassa, B.; Fachin, D.A.; Nihei, S.S.; De Carvalho, C.J.B.; Falaschi, R.L.; Mello-Patiu, C.A.; Couri, M.S.; Iliveira, S.S.; et al. On typeless species and the perils of fast taxonomy. Syst. Entomol. 2016, 41, 511–515. [Google Scholar] [CrossRef] [Green Version]
  42. Porto, A.; Voje, K.L. ML-morph: A fast, accurate and general approach for automated detection and landmarking of biological structures in images. Methods Ecol. Evol. 2020, 11, 500–512. [Google Scholar] [CrossRef] [Green Version]
Figure 1. (A) Acrylic chambers for salamander photography on site at Eliza Spring, with 5 mm background grids for measurement calibration; (B) Landmark configuration used for geometric morphometrics analyses of head shape. Red symbols represent fixed landmarks and the blue lines represent sliding semi-landmarks (15 equidistant landmarks for each side of the head).
Diversity 12 00297 g001
Figure 2. Allometric plots showing relationship between log centroid size (CS) and log trunk length (TL) for all individuals included in the study (n = 773). (A) Individuals grouped by mclust; green squares and golden triangles represent Eurycea waterlooensis clusters; (B) Specimens grouped by species, indicating two E. waterlooensis specimens previously misidentified as E. sosorum (grey triangles) and the single specimen of E. waterlooensis assigned to E. sosorum by mclust (grey circle). Teal symbols represent E. waterlooensis and salmon symbols represent E. sosorum.
Diversity 12 00297 g002
Figure 3. Thin plate spline deformation grids of Eurycea waterlooensis showing transformations from low to high principal component (PC) factor scores modeled at two standard deviations below and above the mean value for (A) PC 1; (B) PC 2; (C) PC 3; (D) PC 4.
Diversity 12 00297 g003
Figure 4. Thin plate spline deformation grids of Eurycea sosorum showing transformations from low to high principal component (PC) factor scores modeled at two standard deviations below and above the mean value for (A) PC 1; (B) PC 2; (C) PC 3; (D) PC 4; (E) PC 5.
Diversity 12 00297 g004
Figure 5. Boxplots of principal component (PC) factor scores across different axes showing variation in wild salamanders among spring outflows of Barton Springs as well as for captive Eurycea waterlooensis. Salmon symbols represent E. sosorum, and teal symbols represent E. waterlooensis. For visualization purposes, we presented values for both species; however, we excluded individuals of E. waterlooensis from the statistical analysis of microgeographic variation in E. sosorum (see text).
Diversity 12 00297 g005
Figure 6. Representative images of salamanders, clockwise from top left: adult Eurycea sosorum, adult E. waterlooensis, juvenile E. waterlooensis specimen previously misidentified as E. sosorum, and E. waterlooensis assigned by expert identification and clustering. Note that eyes are well developed in juveniles of E. waterlooensis.
Diversity 12 00297 g006
Table 1. MANOVA of effects of season, locality, and centroid size (covariate) on head shape variables (i.e., first five principal component factor scores) for Eurycea sosorum.
Sourceη2Group dfPillai~F-Valuep-Value
Season0.0430.124.97<0.001
Locality0.1530.4520.40<0.001
Size0.4910.49110.97<0.001
Locality:Size0.0230.072.72<0.001
Season:Size0.0130.041.370.14

