Article

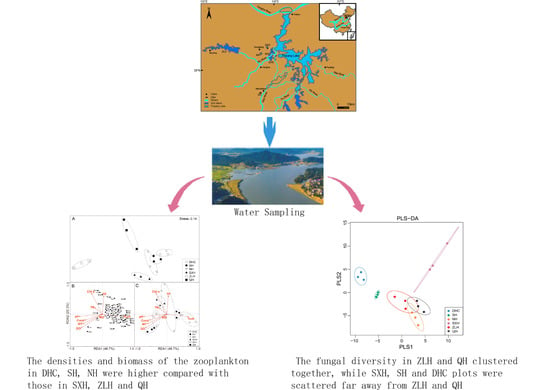
The Influence of Human Interference on Zooplankton and Fungal Diversity in Poyang Lake Watershed in China

1
Key Laboratory of Poyang Lake Environment and Resource Utilization, Ministry of Education, Nanchang University, Nanchang 330031, China
2
School of Life Sciences, Qufu Normal University, Qufu 273165, China
3
National Engineering Research Center for Bioengineering Drugs and the Technologies, Institution of Translational Medicine, Nanchang University, Nanchang 330031, China
*
Authors to whom correspondence should be addressed.
Haiming Qin and Xinyi Cao contributed equally to this work.
Diversity 2020, 12(8), 296; https://doi.org/10.3390/d12080296
Submission received: 1 July 2020 / Revised: 25 July 2020 / Accepted: 27 July 2020 / Published: 28 July 2020
(This article belongs to the Special Issue Microbial Ecology of Aquatic Habitats)

Abstract

:
The Poyang water system in Jiangxi Province, China, is important for floodwater storage, diversity maintenance, and the economy of the Poyang Lake watershed. In recent years, pollution has destroyed the ecosystem and impacted human health and the related economy. The water quality of the Poyang Lake watershed and the impact of human interference must be assessed. Conventional analysis and high-throughput sequencing were used to evaluate the structure of both zooplankton and fungi in six sub-lakes of the Poyang Lake watershed under different anthropogenic influences. The sub-lakes included were Dahuchi Lake (in natural preserve, DHC), Shahu Lake (in natural reserve, SH), Nanhu Lake (out of natural preserve, NH), Zhelinhu Lake (artificial reservoir, ZLH), Sixiahu Lake (agricultural lake artificially isolated from Poyang Lake, SXH), and Qianhu Lake (urban lake, QH). The densities and biomass of the zooplankton in DHC, SH, NH were higher compared with those in SXH, ZLH and QH (p < 0.05). Zooplankton distribution of SXH was the most strongly associated with total nitrogen (TN), total phosphorus (TP) and chlorophyll a (Chl a), while QH was highly associated with pH, conductivity (Cond), and water temperature (WT). For fungal diversity, a large number of beneficial fungi, Basidiomycota (phylum level) and Massarina (genus level) were obtained from DHC (55.3% and 27.5%, respectively), SH (54.4% and 28.9%, respectively), and NH (48.6% and 1.4%, respectively), while a large number of pathogenic Chytridiomycota (at phylum level) were identified from SXH (21.0%), ZLH (5.5%), and QH (7.5%). Manmade pollutants have impacted the natural hydrology and water quality and promoted variation between the zooplankton and fungi in the six sub-lakes, reducing the relative abundance of beneficial fungi and increasing the number of pathogens in the environment, which threatens human health and economic production. Understanding the diversity among the zooplankton and fungi in the six sub-lakes of the Poyang Lake watershed may help guide future water management practices.

Graphical Abstract

1. Introduction

Poyang Lake is the largest inland lake in China and is located along the main part of the low-to-mid section of the Yangtze River, which is the longest river in Asia. A total of 44 million people live on 166,900 km2 of land in the Poyang Lake watershed [1]. The Poyang Lake ecosystem provides billions of Renminbi (RMB) for floodwater storage and contaminant degradation. Its fishery resources provide nearly one million fishermen with 46.7% of the total fishery resources caught in the Yangtze River [2,3,4]. The increased inflow from inland aquaculture and higher concentrations of industrial wastewater concentrates, chemicals, pigments, disinfectants, nitrogen, and phosphorus in the water have affected water quality in the Poyang basin [5,6]. The reclamation of the lakeshore, which began in the 1960s, has led to more instances of flooding [7]. The ecosystem is threatened by the tributary influx of varying degrees of heavy metal pollution in the sediment, which subsequently impacts the health of those who live in the area [8,9]. Advanced eutrophication triggered by human interference created large-scale cyanobacterial blooms in Taihu Lake, China, in 2007. The polluted lake water threatened the health of 10 million people by contaminating the water supply [10]. The connectivity of Poyang Lake with the surrounding watershed is better than that of Taihu Lake, but a growing human population and greater utilization of resources are destroying the ecosystem of the Poyang watershed and negatively impacting the surrounding residents.
The Poyang watershed ecosystem is characterized by complexity, mutability, sensitivity and fragility in report [11]. The microbes respond quickly to changes of water quality as primary producers and decomposers of the basal food web, which make nutrients available in the food chain [12,13].
Zooplankton, as a central part of the food chain, graze bacteria and organic detritus and secrete phosphorus into the water, which contributes to autotrophic production [14,15]. Zooplankton communities are sensitive to a variety of manmade activities including pollution [16], overfishing [17], and watershed land use [18]. Rotifera and crustaceans (Copepoda and Cladocera) indicate water quality well [19], and Rotifera are able to indicate the particular oligotrophic, mesotrophic, or eutrophic state of a lake [20]. Fungi are estimated around 1.5 million [21] and high-throughput sequencing is ideal for processing their large set of bio-information at a molecular level. Water-borne fungi take part in nutrient cycling by degrading submerged substrates to stabilize the plankton food web [22] and provide food for zooplankton [23]. Some aquatic fungi can detoxify phenol during water self-purification [24] while some species contaminate water by releasing toxic material [25]. Certain fungal species are pathogenic and infectious in water, especially the phylum Chytridiomycota, which causes chytridiomycosis in amphibians, and genus Basidiobolus, which causes zygomycosis in humans. Zooplankton and fungi can enhance the flow of energy and are represented by predator, prey, or decomposers; they may warn of environmental changes and possible outcomes.
Zooplankton community analysis and high-throughput sequencing of aquatic fungi provided insights into their sensitivity to environmental change. The aims of our study were:
  • To analyze the assemblage of zooplankton and fungi to determine whether human activities have led to significant eco-environmental variance between six sub-lakes.
  • To study whether the change of microbial assemblage will threaten human health and economic production.

2. Materials and Methods

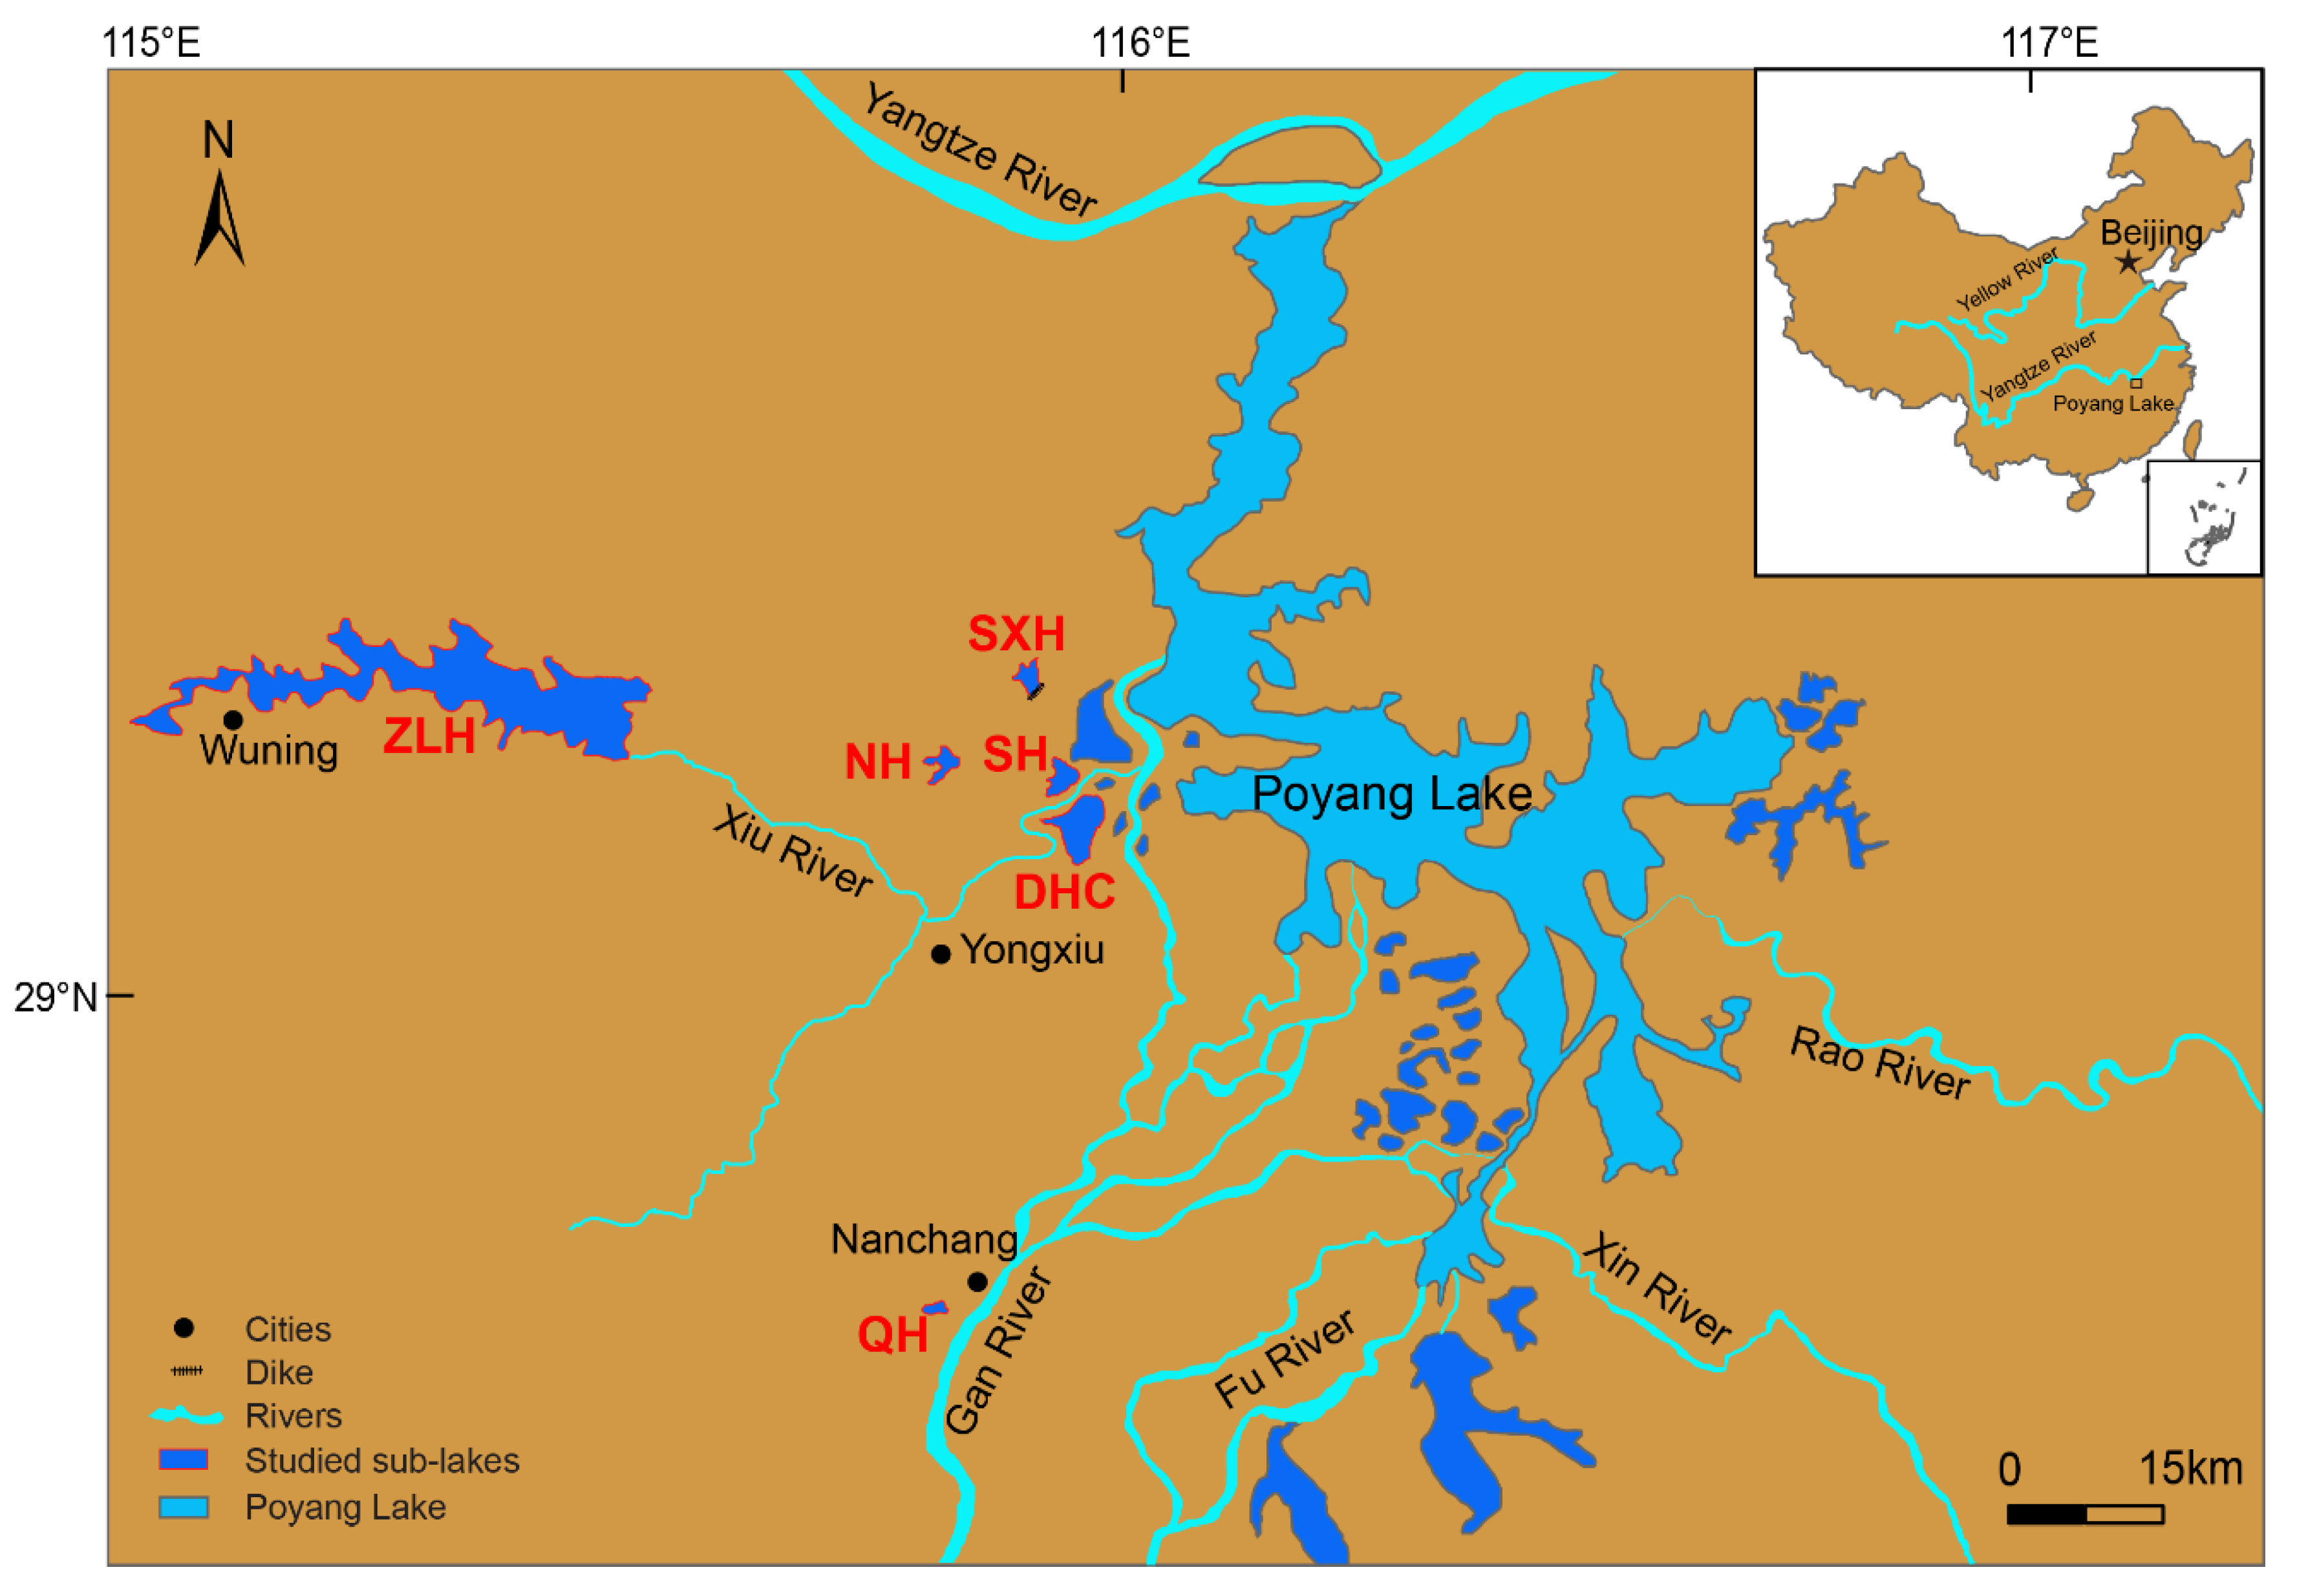
2.1. Study Site Description and Water Sampling

Dahuchi Lake (DHC, 29.138358 N, 115.955195 E), Shahu Lake (SH, 29.168276 N, 115.933349 E), and Nanhu Lake (NH, 29.198585 N, 115.860815 E) are sub-basins of Poyang Lake (Table 1). DHC and SH lie in the Poyang Lake National Nature Reserve while NH Lake is outside of the reserve. These three sub-lakes connect to Poyang Lake. Zhelinhu (ZLH, 29.228336 N, 115.510613 E) is an artificial reservoir located upstream of Poyang Lake. Sixiahu Lake (SXH, 29.281464 N, 115.906471 E) was a sub-basin of Poyang Lake but is now separated from Poyang Lake by a dam that supports fishing. Qianhu Lake (QH, 28.655046 N, 115.820929 E) is an artificial urban lake surrounded by several colleges, the Administrative Center of Jiangxi Province, and Qianhu Hotel. Table 1 shows the sampling times, human interferences, and the number of sampling sites tested from the sub-lakes.
Zooplankton and fungi were collected from DHC, SH, NH, ZLH, SXH, and QH lakes on July 12th and 13th, 2018 in the Poyang watershed, Jiangxi Province, China (Figure 1). Samples were obtained from the lakeshore of each of the sub-lakes at three discrete sampling sites at 1-km intervals at a depth of 50 cm. Then, 10 L samples of zooplankton were obtained, 250 mL samples of fungi were obtained, and 250 mL samples were taken for physicochemical analysis. A Plexiglas water collector (WB-PM, Beijing Purity Instrument Co., Ltd., Beijing, China) was used for water sampling and the water collector was submerged and washed twice before water samples were collected. At sampling sites, the zooplankton samples were fixed by 4% formalin to avoid imprecise biomass and density measurements. In the laboratory, water samples for fungi were filtered with Whatman GF/F filters (pore size: 0.7 μm) to obtain sediments, which were stored in a refrigerator at 4 ℃ for further DNA extraction and high-throughput sequencing analyses of fungi. Water samples for nutrient salts (total nitrogen and total phosphorus) and chlorophyll a concentration were stored in a 4 °C refrigerator in the lab, and measured for total nitrogen (TP), total phosphorus (TP), and chlorophyll a concentration within 24 h of collection.

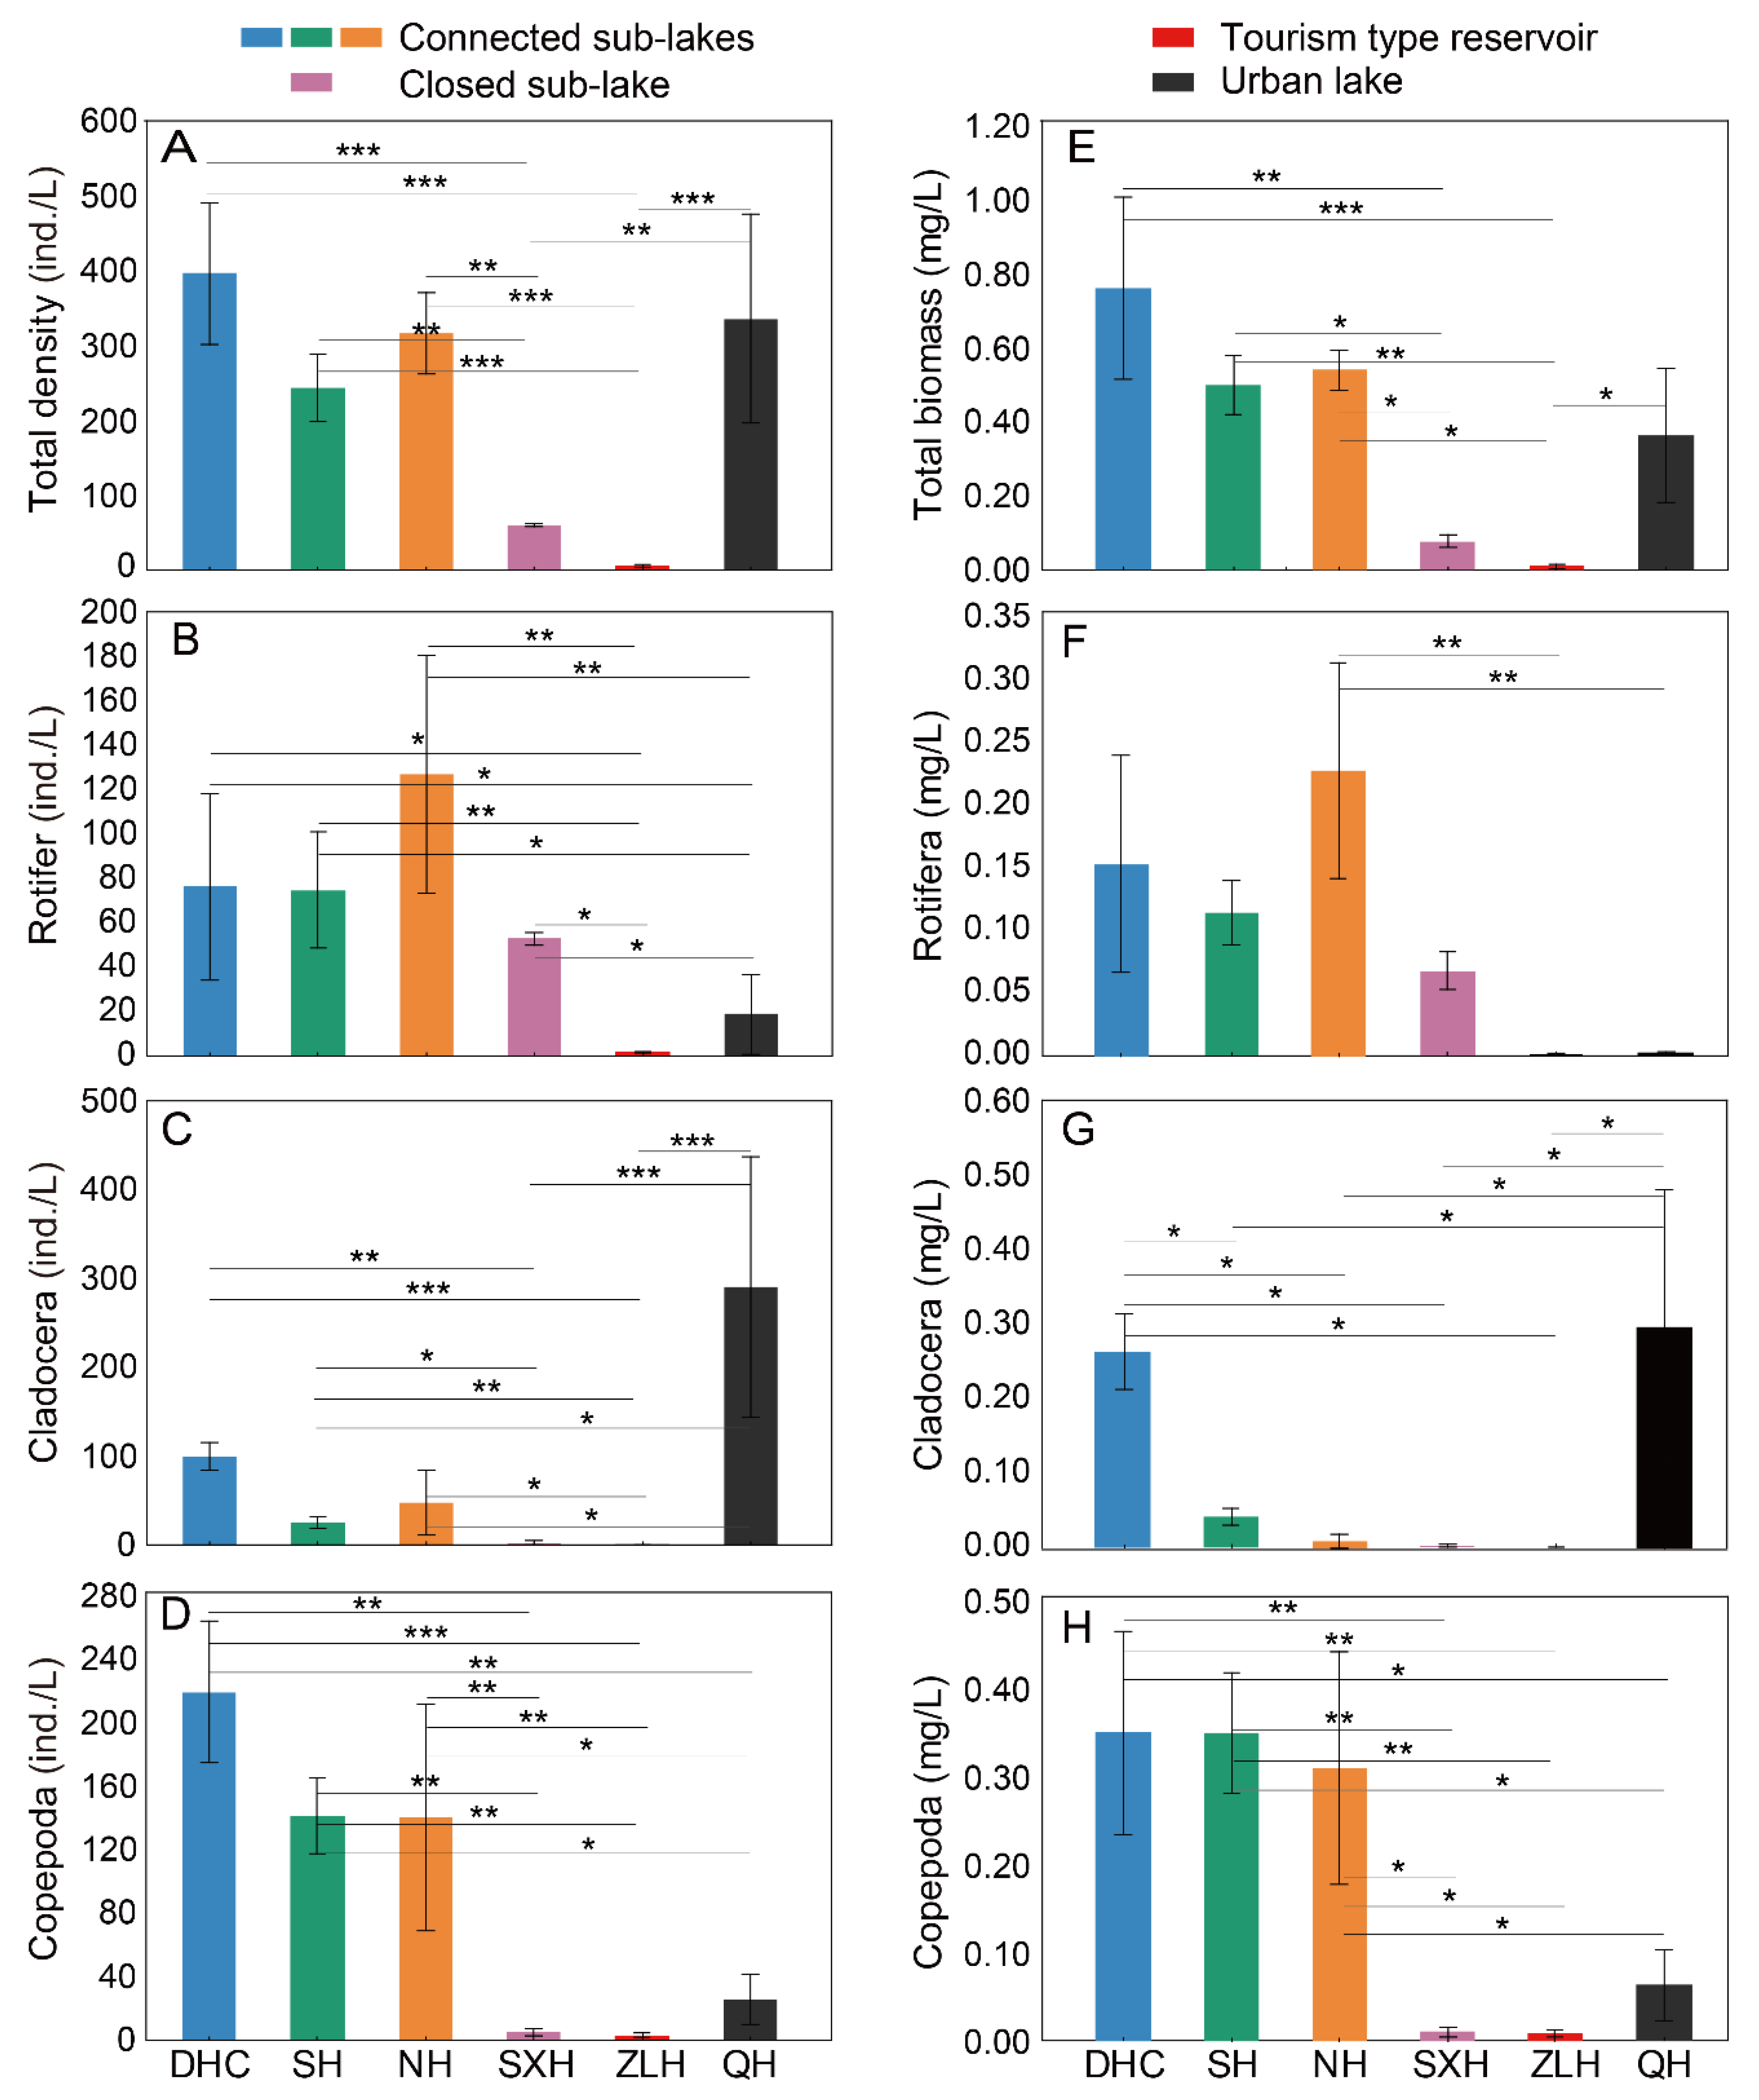
2.2. Densityand Biomass of Zooplankton

Zooplankton samples were filtered on site using a 25# zooplankton net (200-μm mesh size, net opening 20 cm diameter, Beijing Purity Instrument Company) and the sample volume was concentrated to 40 mL. The concentrated sample used in density calculations was well-stirred and a 5-mL subsample was observed under a dissecting microscope at 10 × 10 magnification to count the species and number of Rotifera, Cladocera, and Copepoda. The lengths of crustaceans were measured for biomass calculations to determine their weight according to the length–weight regression curve. Rotifera were measured by volume to determine their weight [26].

2.3. Physiochemical Analysis of Water

Conductivity (Cond), pH, water temperature (WT), dissolved oxygen (DO), and turbidity (Turb) were measured in situ at the sampling site using the Multi-function Water Quality Monitor (YSI 6600 V2, YSI Inc., Yellow Springs, OH, USA). Chlorophyll a (Chl-a) was extracted from the samples using 45% acetone for 24 h and was analyzed and calculated using the fluorometric method (Turner Designs, San Jose, CA, USA) [27]. Total nitrogen and total phosphorus were calculated using the colorimetry method [28].

2.4. Extraction, Polymerase Chain Reaction (PCR) Amplification and High-Throughput Sequencing of Aquatic Fungal Genome

Lake water was filtered through a Whatman GF/F filter (Whatman, Maidstone, UK; Pore size, 0.7 μm), and then the fungal DNA was extracted from fungi in sediments filtered by GF/F filter using DNA genomic kit (Tiangen Biotech Co., Ltd., Beijing, China). The concentration and purity of each DNA sample were determined by UV spectrophotometer to prepare the samples for amplification (Nano Drop, Thermo Scientific Inc., Waltham, MA, USA). PCR amplification relies on the V4 region, which is a preserved region of fungal 18S ribosomal DNA. This site was amplified by primer 547F/V4R (547F, 5′-CCAGCASCYGCGGTAATTCC-3′; V4R, 5′-ACTTTCGTTCTTGATYRA-3′). PCR products were analyzed with sequence reads using Illumina HiSeq 2000 (BioProject accession number PRJNA560147).

2.5. Bioinformatics and Statistics Analysis

The paired-end reads from the original DNA fragments were processed and assembled according to a specific barcode using FLASH (Fast Length Adjustment of Short Reads to Improve Genome Assemblies; http://www.cbcb.umd.edu/software/flash/). Chimera checking of operational taxonomic unit (OTU) clustering was done with USEARCH (v5.2.236, http://www.drive5.com/usearch/). QIIME (Quantitative Insights Into Microbial Ecology, v1.9.1, http://qiime.org/) was used to partition sequences into OTUs via algorithm UCLUST 2.1 [29] at a 97% similarity. QIIME realized the denoiser procedures, including α diversity (within samples, Shannon, etc.) and β diversity (between samples, NMDS, PLS-DA, etc.) analyses [30]. The gplots package with R software (R core team, 2015) was used to perform Partial Least Squares Discriminant Analysis (PLS-DA) to estimate the variance between groups in a lower dimension. The denoised OTUs were classified to the genus level according to the Silva database (Release 115, https://www.arb-silva.de/) [31]. The Kyoto Encyclopedia of Genes and Genomes (KEGG) database (http://www.kegg.jp/ or http://www.genome.jp/kegg/) was used to interpret high-throughput data to provide further metabolic function.
The Shannon–Wiener diversity index (H’), Pielou’s evenness index (J) and Margalef richness index (D) of zooplankton were calculated using the formulas:
H = i = 1 S P i log 2 P i
J = H / log 2 N
D = ( S 1 ) / log 2 N
where N is the total number of specimens; S is the total number of zooplankton at species level (Table A1); P i is the ratio of number of the i species to total number of zooplankton ( n i / N ). The evaluation standard of H’ and D: 0 <H’(D) < 1 is heavy pollution; 1 <H’(D) < 2 is α-medium pollution; 2 <H’(D) < 3 is β-medium pollution; H’(D) > 3 is light pollution [32].
Redundancy analysis (RDA) used the zooplankton communities from different lakes as dependent variables based on the physicochemical factors of water (environmental variables). The Monte Carlo Permutation Test calculated the distribution rate of each factor to determine the significant physicochemical factors. The rare communities were ruled out using forward selection [18] and the collinear environmental variables were discarded to avoid type I error [16]. CANOCO for Windows (version 4.5, Biometrics-Plant Research International, Wageningen, the Netherlands) was used to perform the Monte Carlo test and RDA. PRIMER 5.0 helped form the non-metric multidimensional scaling ordination (NMDS) image to determine the Euclidean distance between samples and Bray–Curtis similarity was used in community clustering [33].
SPSS version 17.0 (SPSS Inc., Chicago, IL, USA) was used for one-way ANOVA analysis of the biomass and diversity of Rotifera, Cladocera, Copepoda, and total zooplankton species between different sub-lakes. Data were presented as mean ± SD or mean ± SEM; p < 0.05 indicated a significant result.

3. Results

3.1. Zooplankton and Environment Data from Different Lakes

A total of 35 species of zooplankton were collected (Table A1). As shown in Figure 2 and Table 2, higher values for total density and biomass were obtained from DHC, SH, NH, and QH. The values of total density and biomass were lower in SXH and ZLH. For specific zooplankton, Rotifera, specifically, had higher values of density and biomass in DHC, SH, NH, and SXH versus in ZLH and QH (p < 0.05). Cladocera values were high in QH.
The diversity indexes (D and H’) (Table 3) showed that DHC and SH had medium pollution levels, and NH, SXH, ZLH and QH were heavily polluted.
One-way ANOSIM revealed that the sub-lakes had a significant impact on zooplankton communities (Global test: R = 0.849, p = 0.001). Non-metric multidimensional scaling analysis (NMDS) based on the number of individual zooplankton varied between zooplankton community structures among the six sub-lakes. The zooplankton from the six sub-lakes were divided into the following communities: DHC, SH, and NH, SXH, ZLH, and QH (Figure 3A). Redundancy analysis (RDA) results showed that the total variance contribution of the physicochemical factors of pH, Turb, Chl-a, Cond, and DO to the changes of zooplankton communities is 67%. The characteristic value of the first ranking axis is 0.335 and the variance contribution rate is 46.7%. The eigenvalue of the second ranking axis is 0.146 and the variance contribution rate is 20.3%. Among the six sub-lakes, QH had highest Cond and pH and SXH had high concentrations of TN, TP, and Chl-a. A high pH was identified in SXH and ZLH (Table 4). The Monte Carlo test found that pH and Chl-a concentrations were significantly related to the changes of zooplankton communities (F = 3.79, p = 0.004; F = 3.03, p = 0.004), and Turb had a significant effect on the zooplankton community structure (F = 2.9, p = 0.004, Figure 3B). pH, Turb, and Chl-a concentrations were the main environmental factors causing spatial differences in zooplankton communities. However, nutrient concentrations were not important environmental factors causing spatial differences among the zooplankton communities (Figure 3C).

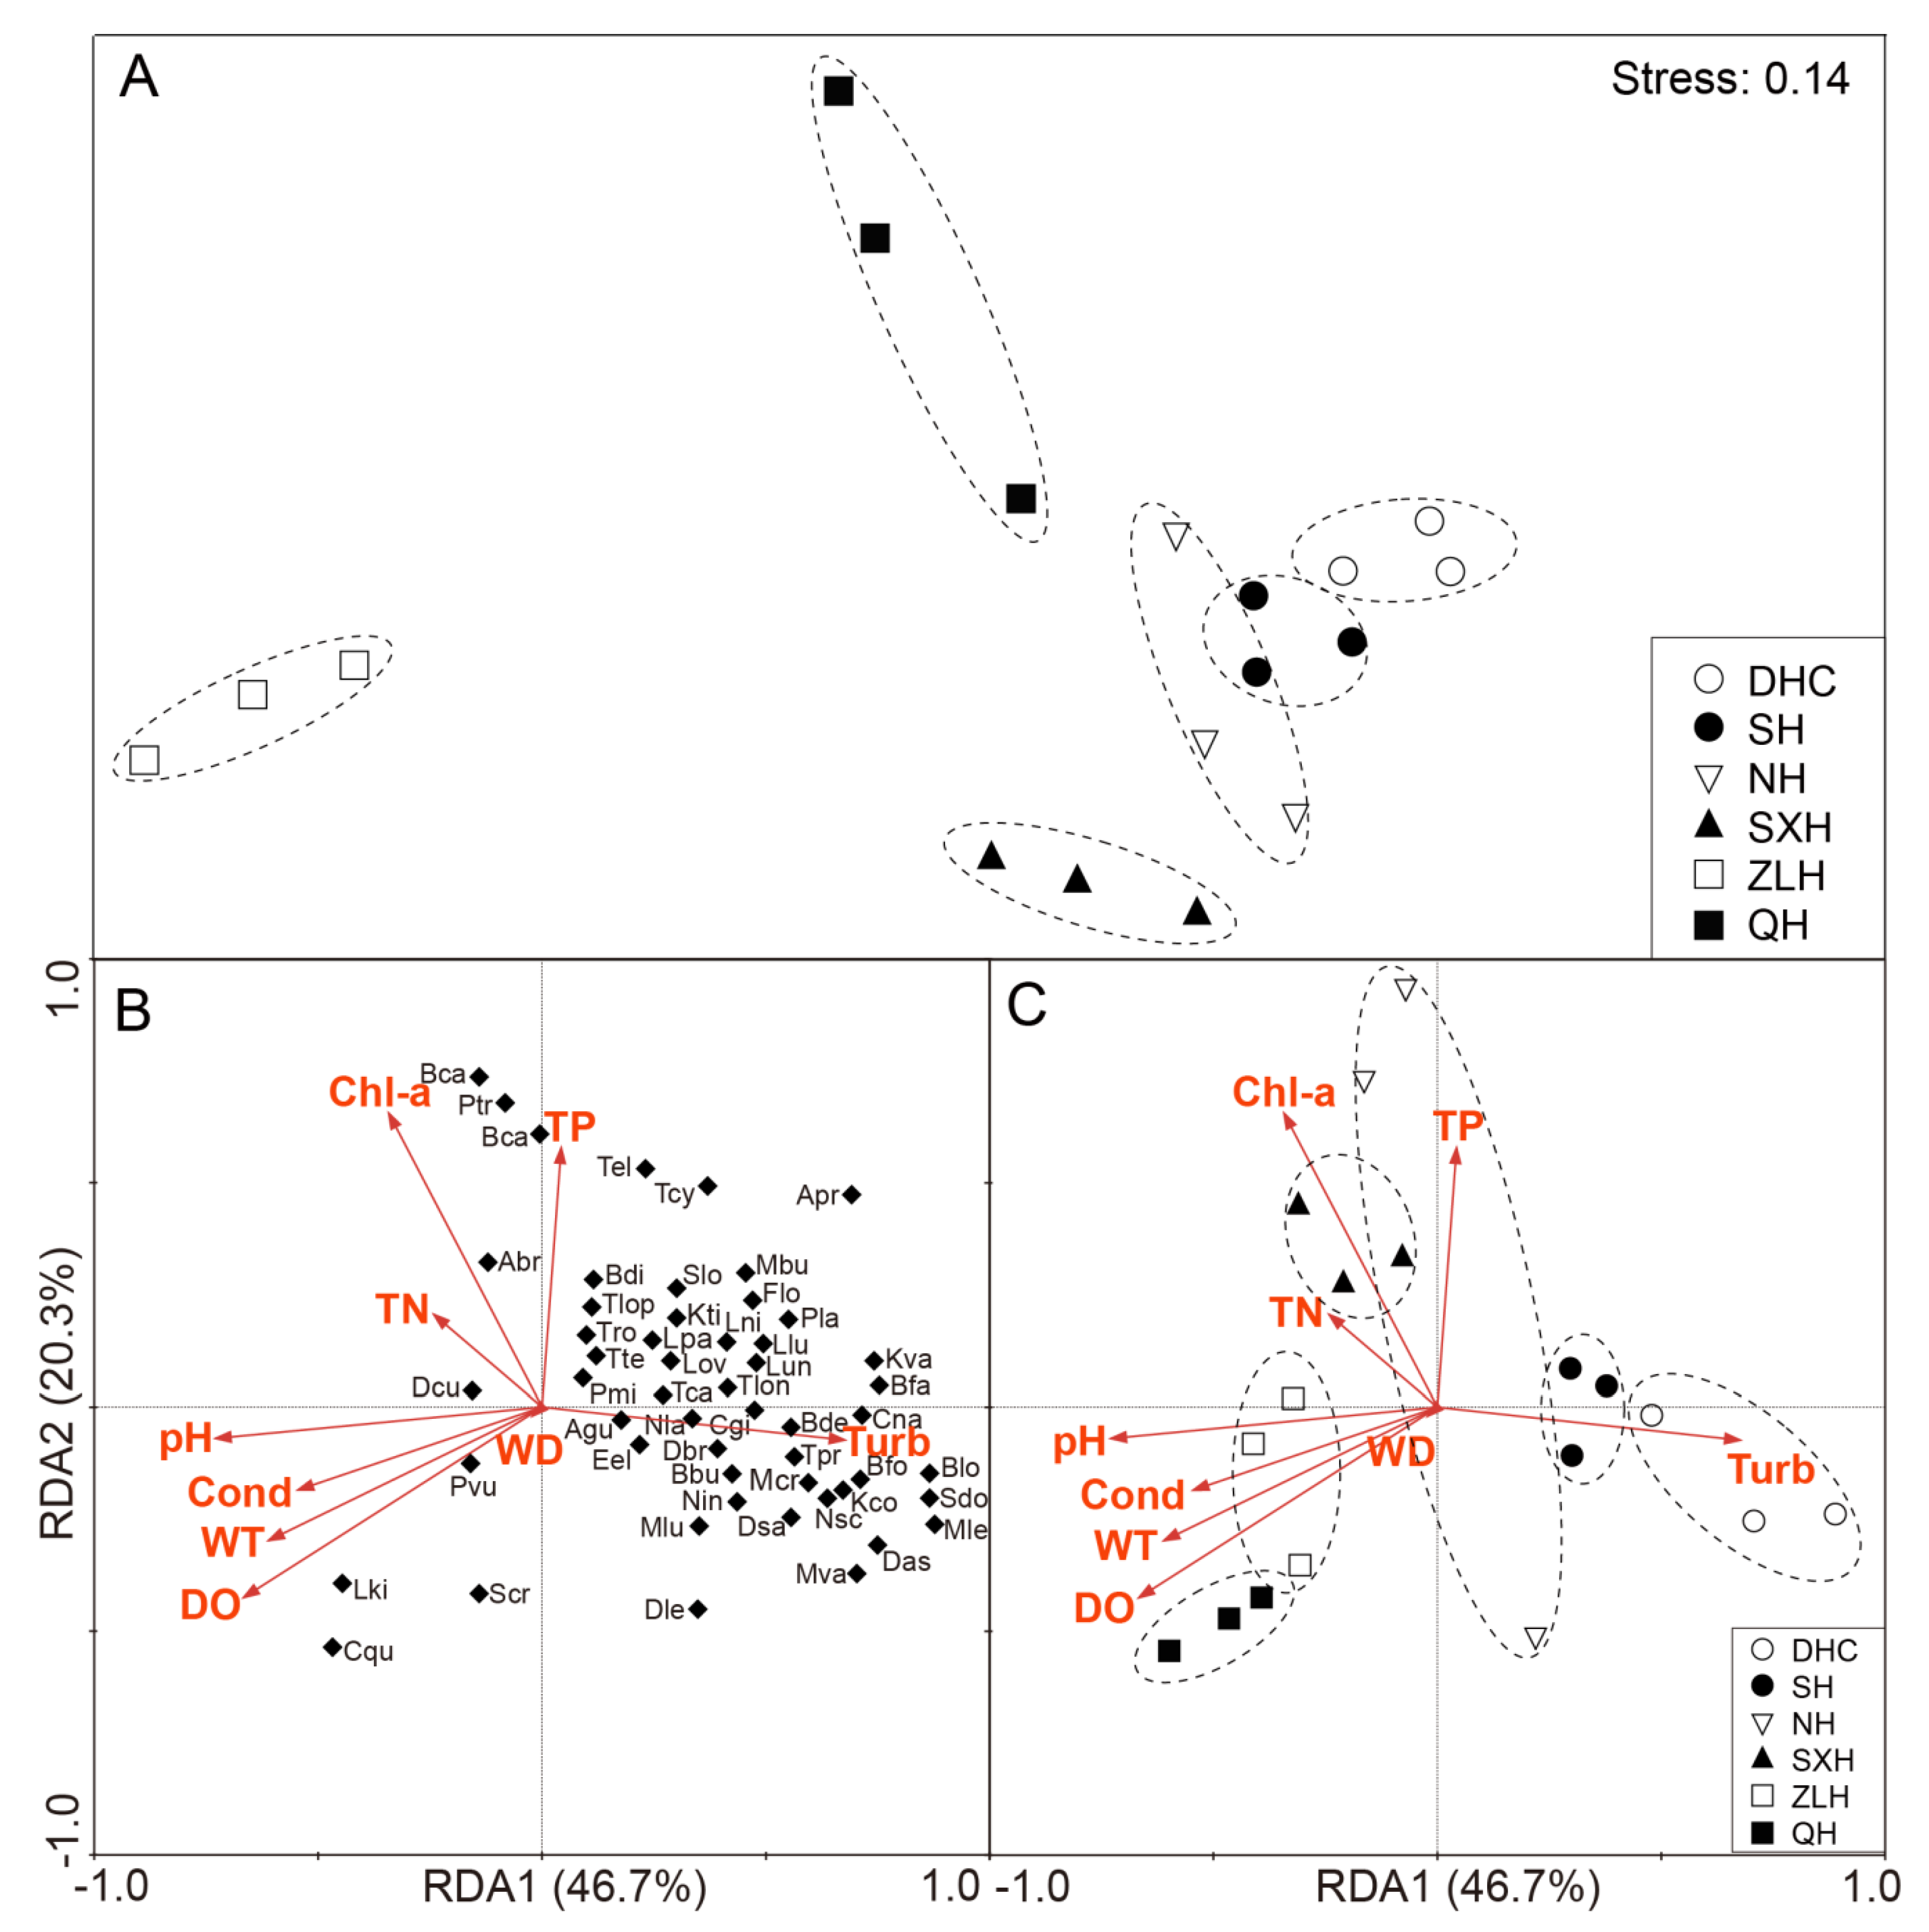
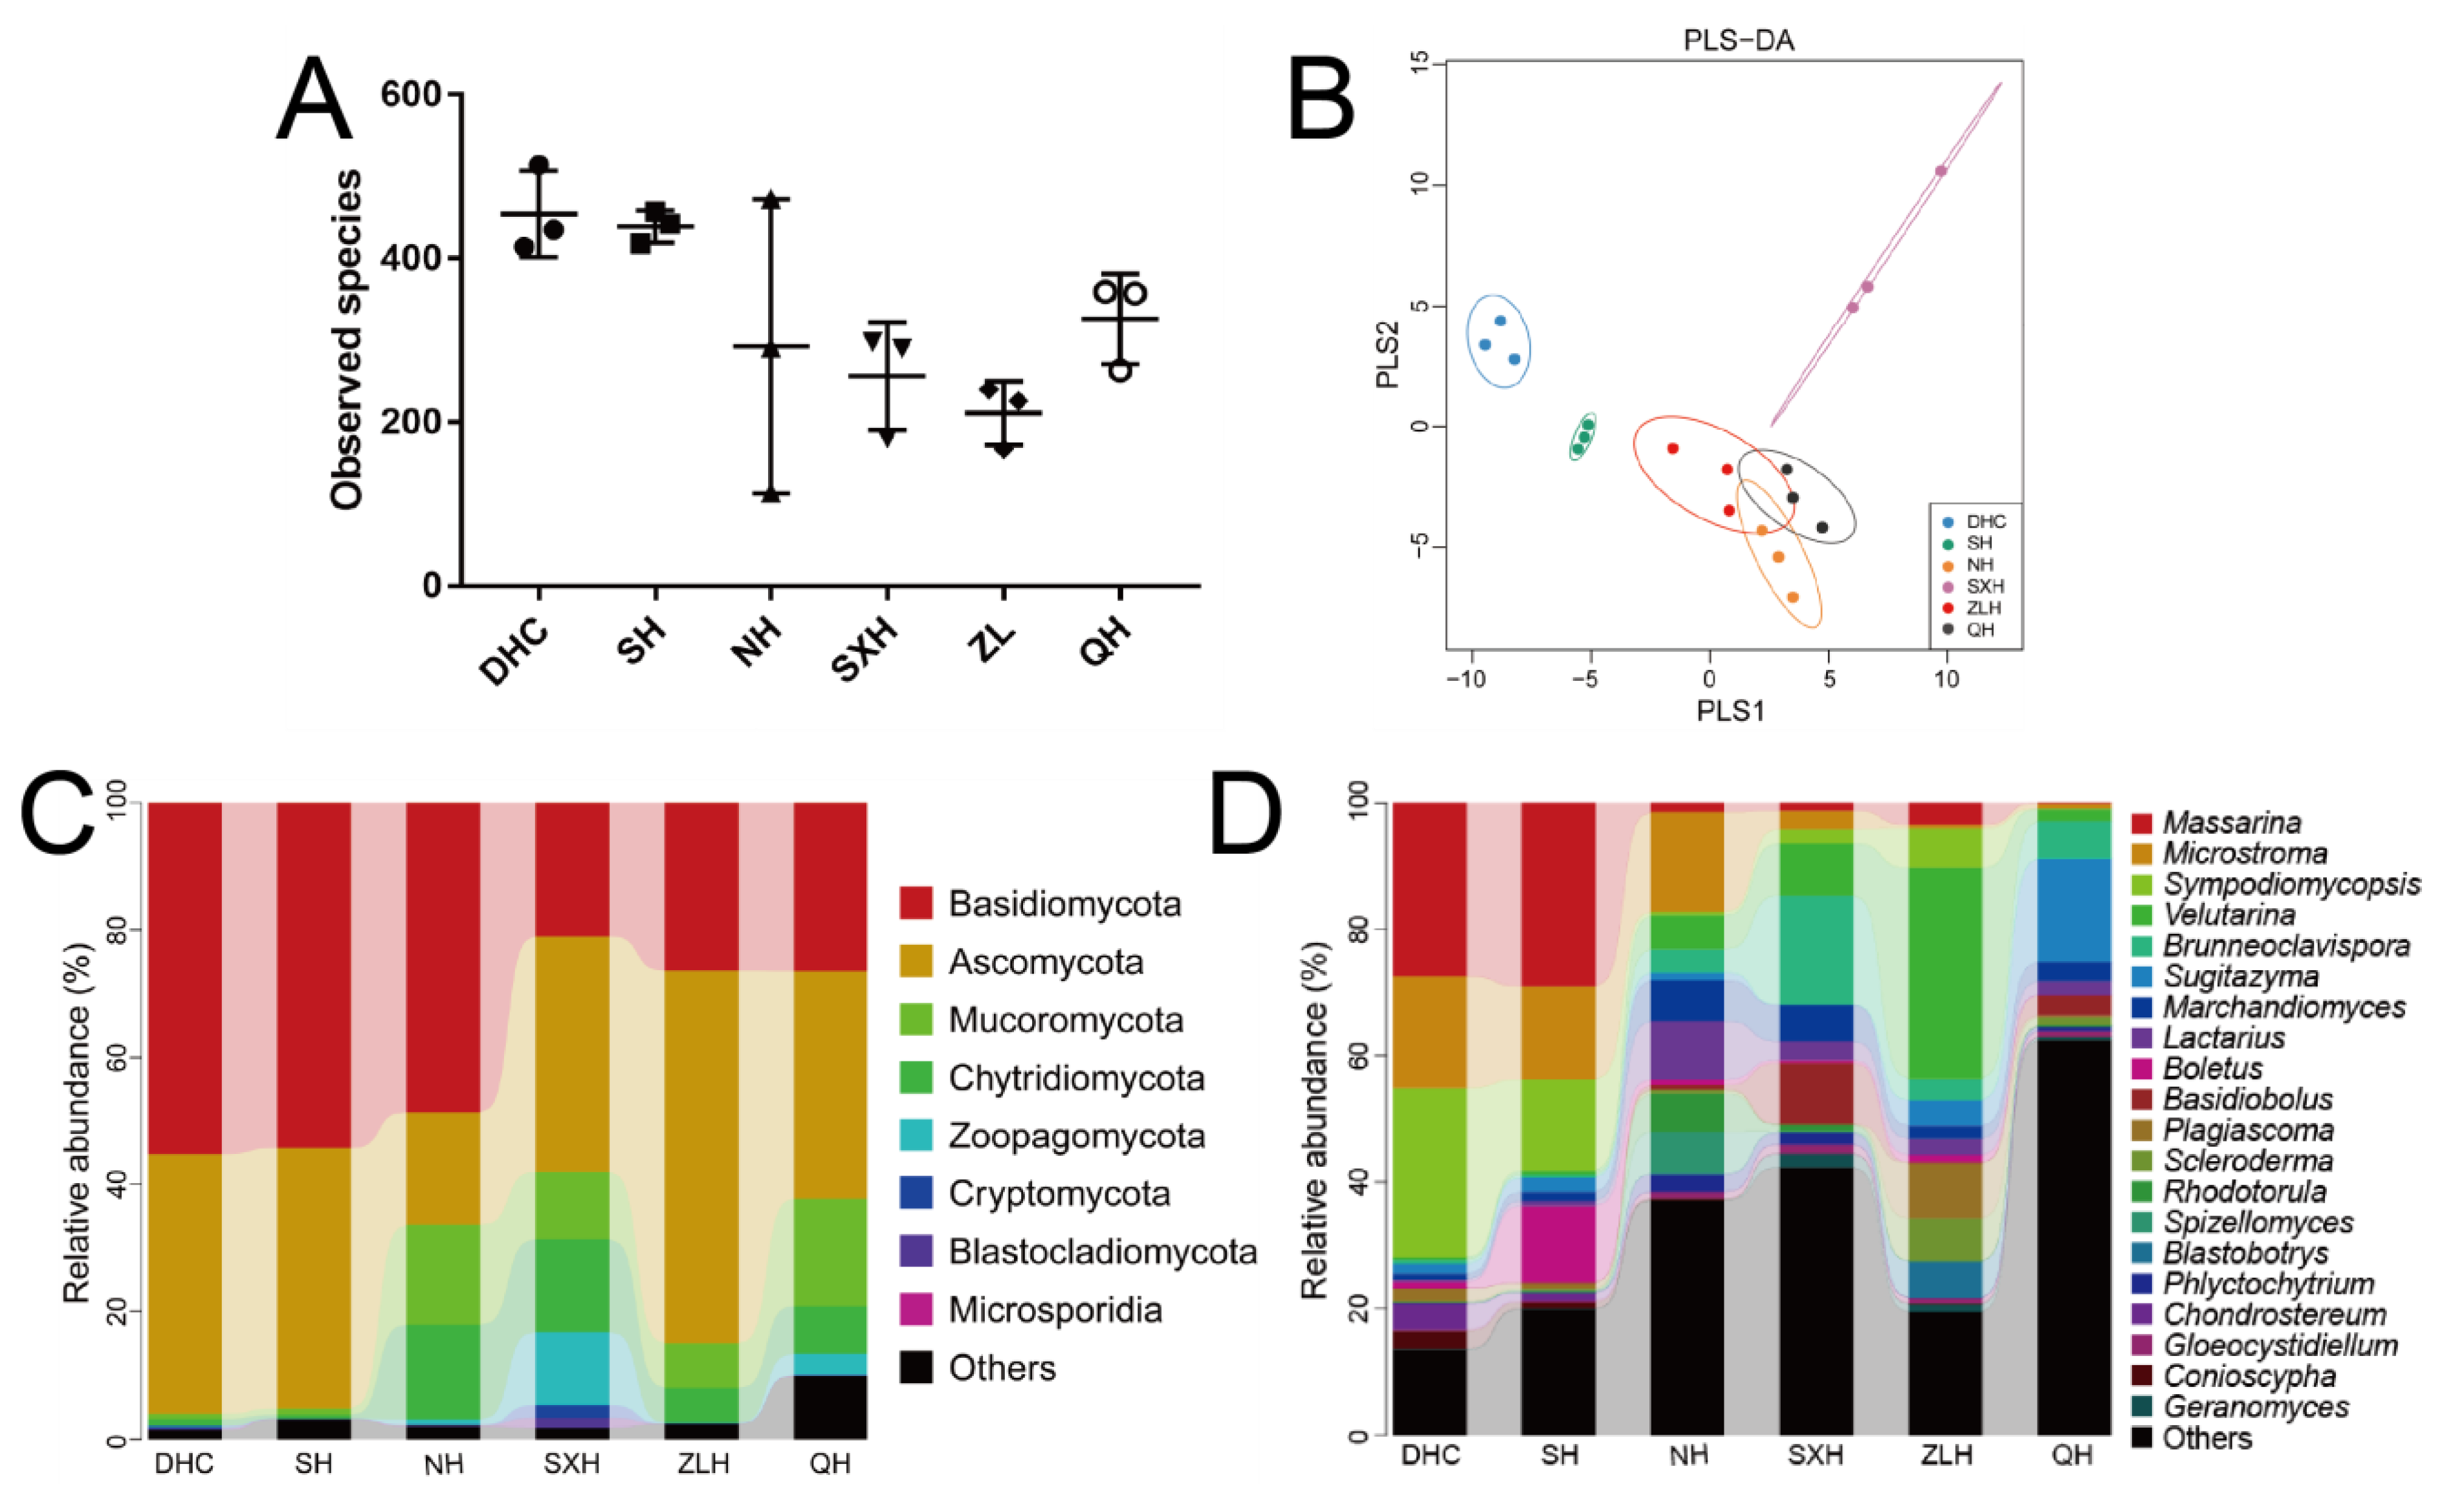
3.2. The Diversity and Composition of Aquatic Fungi in Six Lakes

A total of 2,624,974 filtered clean reads (4525.81 reads/sample) and 3413 OTUs were obtained from all samples with an average of 58.84 OTUs per group (data not shown). The high values of observed species were identified from the DHC (454 ± 53) and SH (439 ± 20) groups (Figure 4A). PLS-DA results indicated that the microbial diversity in ZLH and QH clustered together, while SXH, SH and DHC plots were scattered far away from ZLH and QH (Figure 4B). We further analyzed the aquatic fungi composition at the phylum and genus levels. Basidiomycota, Ascomycota, Mucoromycota, and Chytridiomycota were the most common dominant phyla in the DHC group (55.3%, 40.8%, 0.8% and 1.0%, respectively), the SH group (54.4%, 40.8%, 1.1% and 0.6%, respectively), the NH group (48.6%, 17.8%, 15.7% and 14.9%, respectively), the SXH group (21.0%, 37.2%, 10.6% and 14.5%, respectively), the ZLH group (26.4%, 58.7%, 7% and 5.5%, respectively) and the QH group (26.4%, 35.9%, 16.9% and 7.5%, respectively), accounting for more than 80% of the total sequencing numbers in these six groups (Figure 4C). The relative abundance of Chytridiomycota was high in NH and SXH, and the relative abundance of Mucoromycota was low in DHC and SH. The relative abundance of Massarina and Sympodiomycopsis were higher in DHC (27.5% and 26.8%) and SH (28.9% and 14.5%) compared with NH (1.4% and 0.6%), SXH (1.2% and 2.3%), ZLH (3.4% and 6.3%), and QH (0.0% and 0.1%) at the genus level (Figure 4D). Velutarina and Brunneoclavispora were the most abundant genera in ZLH (33.4%) and SXH (17.3%), respectively. The highest relative abundance of Basidiobolus was observed in SXH (9.7%).

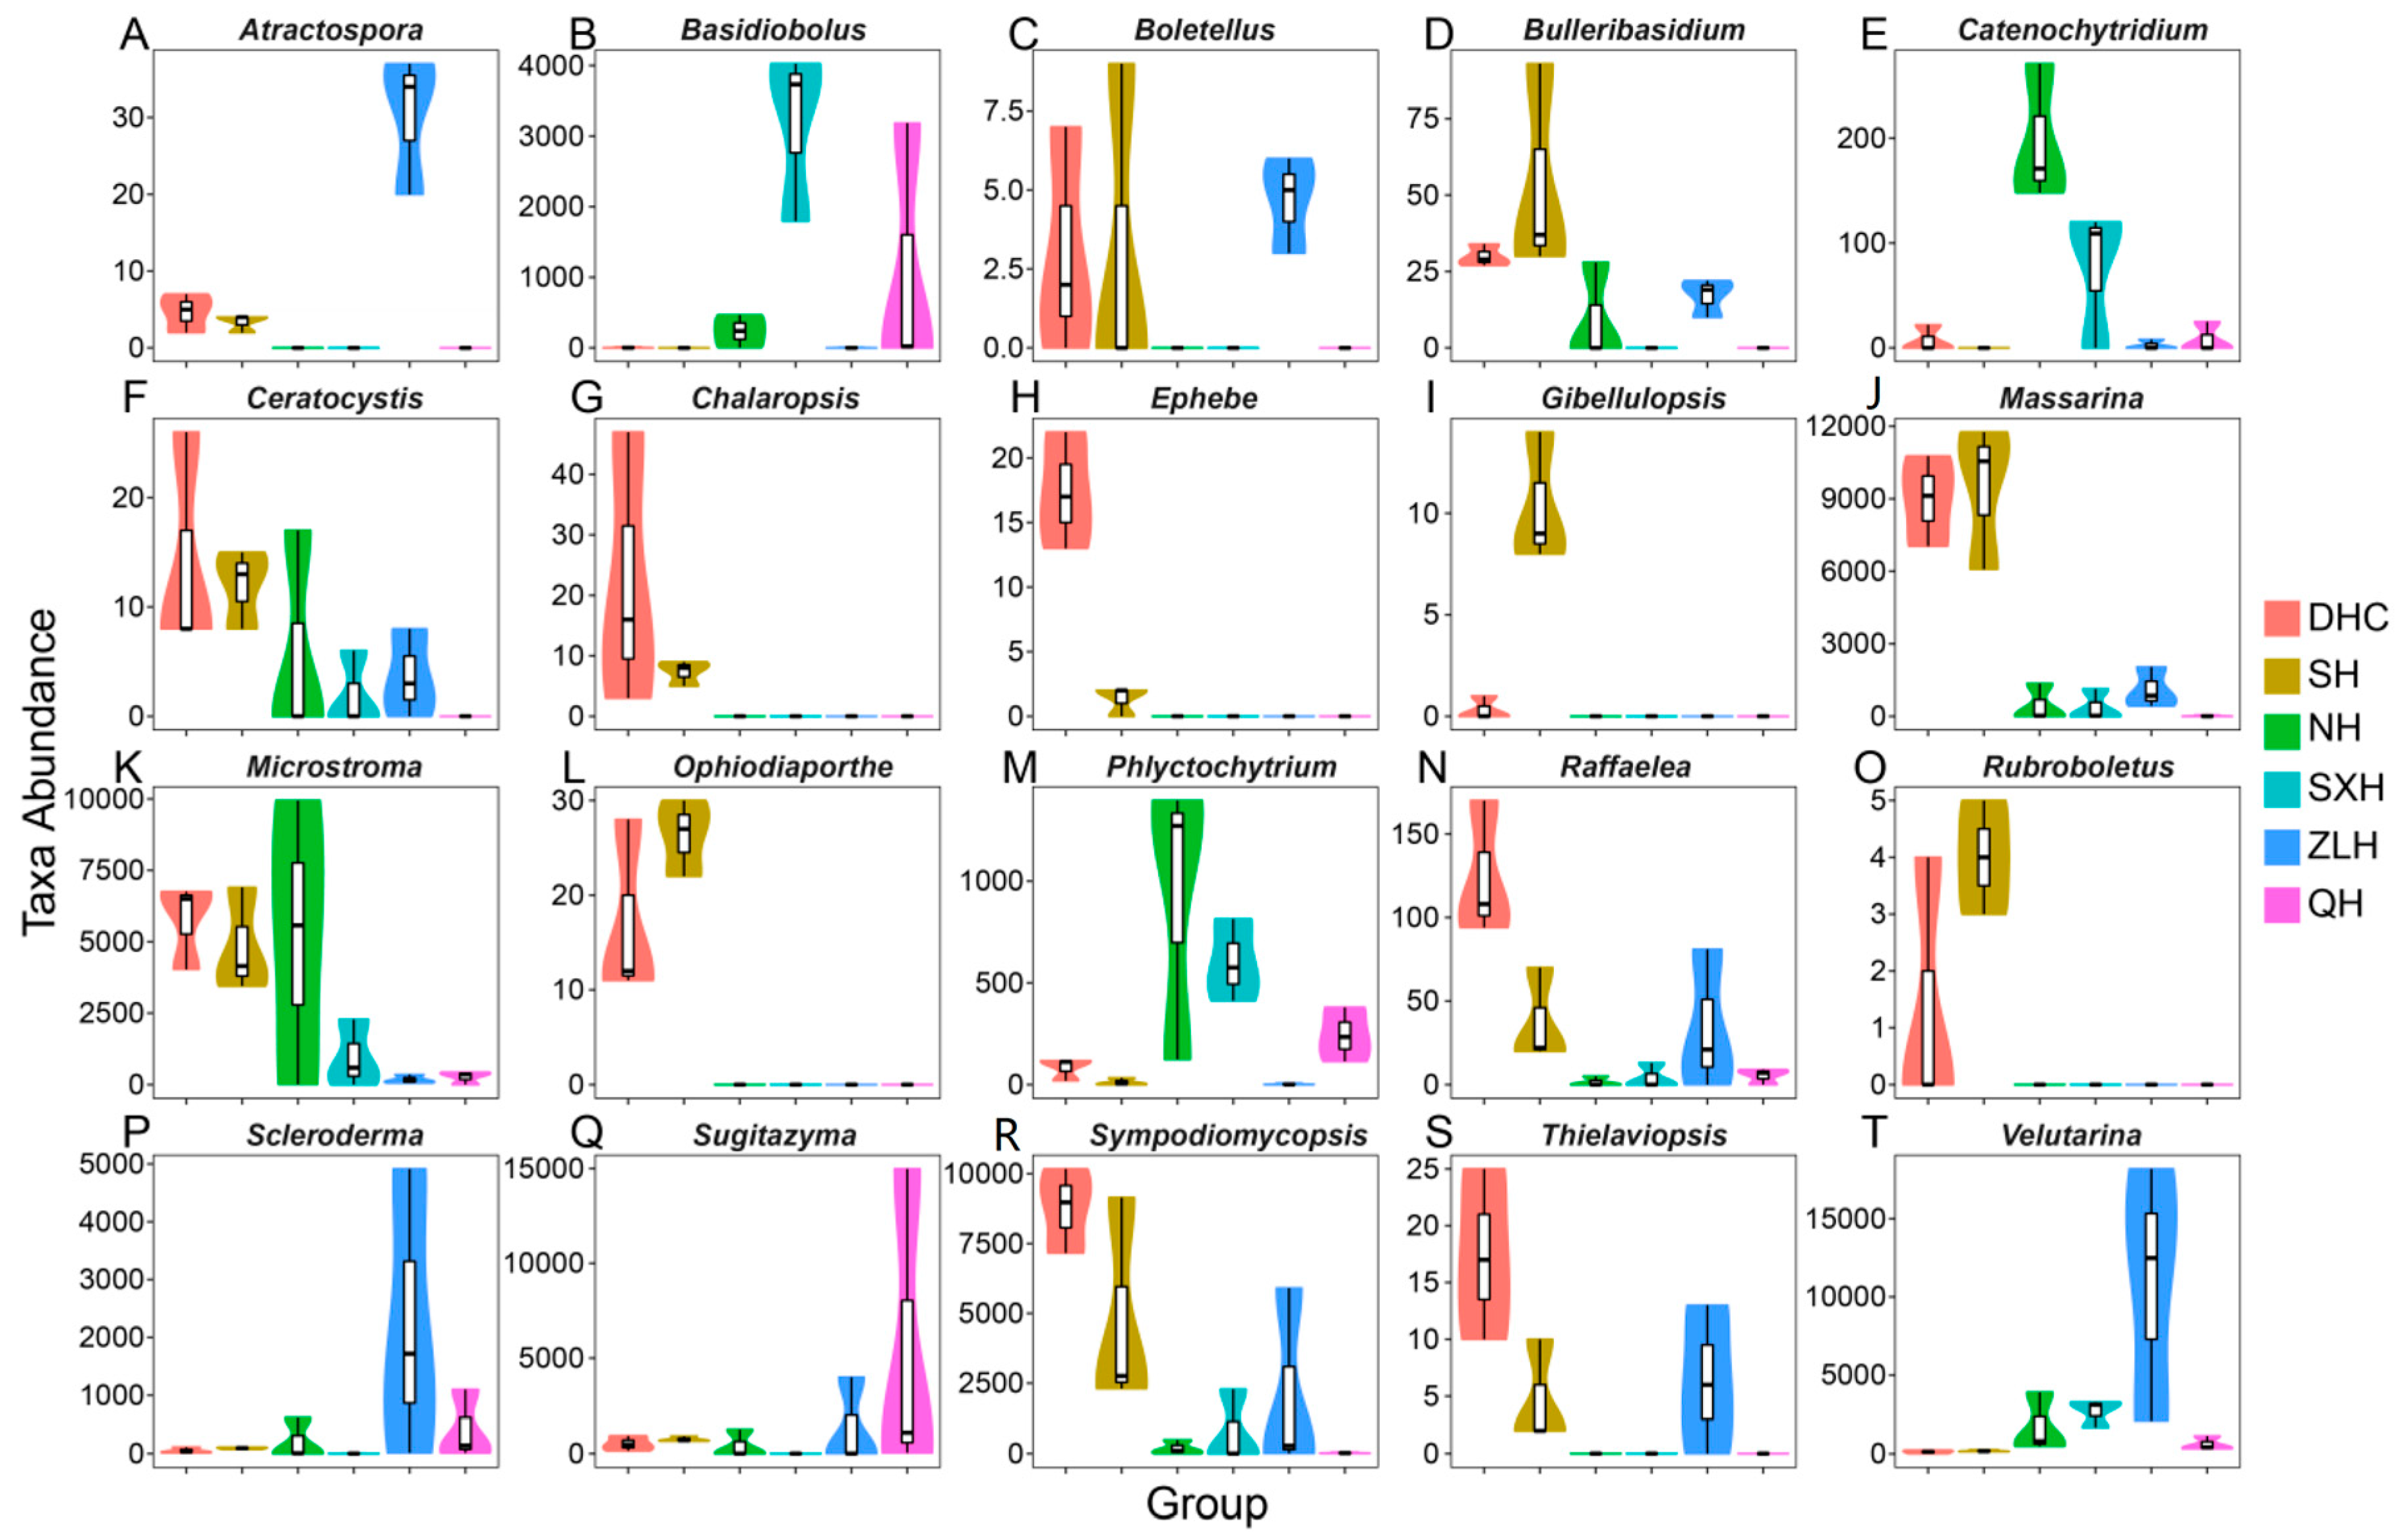
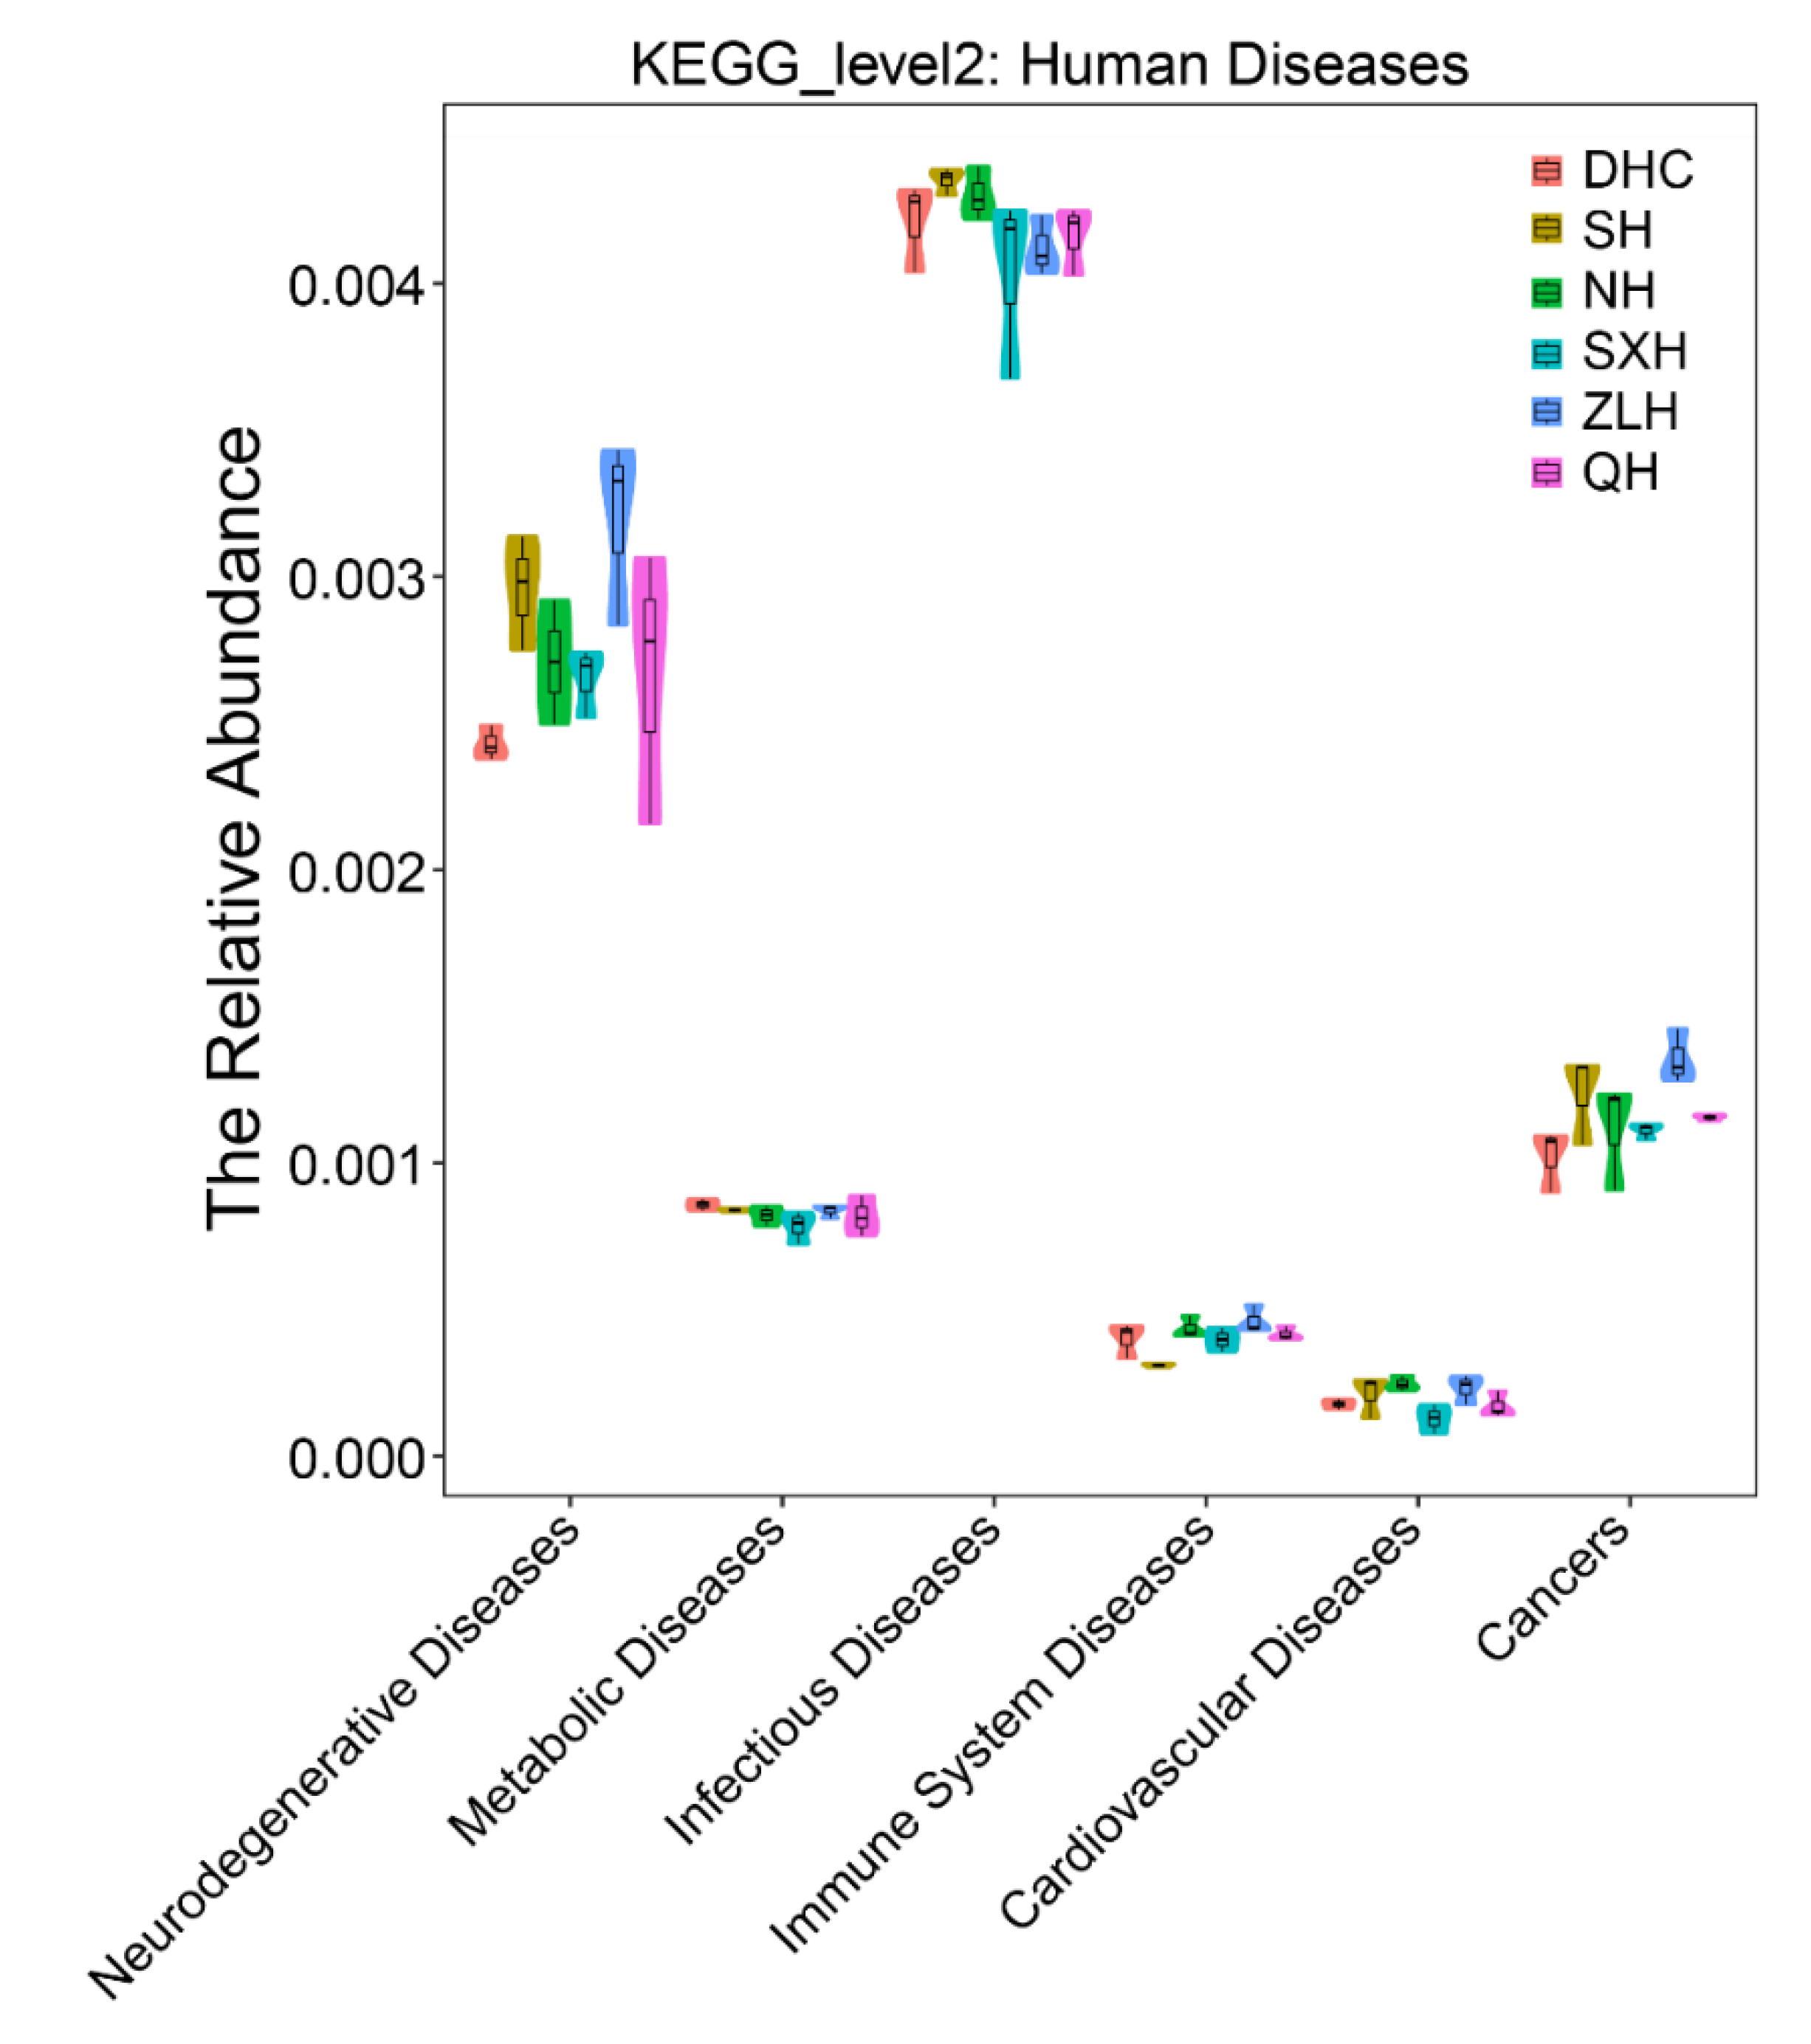
3.3. Taxa Abundance and KEGG Analysis

Several taxa derived from high-throughput sequencing data were analyzed to further investigate the fungal structure of different lakes. Atractospora, Scleroderma, and Velutarina were higher in ZLH compared with the same taxa in other lakes (Figure 5). DCH had the highest relative abundance of Chalaropsis, Ephebe and Raffaelea, Sympodiomycopsis, and Thielaviopsis. High relative abundances of Ceratocystis, Massarina, Ophiodiaporthe, and Sympodiomycopsis were observed in SH and DCH. NH had the highest relative abundance of Catenochytridium and Phlyctochytrium. Basidiobolus was highly abundant in SXH. NH had generally low relative abundance in most taxa.
KEGG provided interpreted sequences to present the relative abundance of the six lakes and their impact on different human diseases (Figure 6). All of the lakes were highly associated with infectious diseases. Degenerative diseases ranked as the second highest disease correlated with the six lakes, among which ZLH ranked the highest.

4. Discussion

The Poyang water system provides a habitat for numerous species and supports the economy and livelihoods of people residing in the Poyang Lake watershed [4]. However, the recent human destruction of the natural ecosystem has created unexpected consequences for human health and economic production [5,7,8]. Zooplankton are sensitive to changes in physicochemical factors [19] and fungi play a vital role in both purifying and toxifying the water [24,25]. Analyzing zooplankton and fungi diversity can improve our understanding of the factors governing water quality of the lakes and assess how human activity change the structure of zooplankton and fungus.
The biomass and density of zooplankton reflect the function and eutrophic state of the ecosystem. The biomass is positively correlated with biodiversity to a certain extent [34,35]. The total biomass and density of the zooplankton in the DHC, SH, NH, and QH lakes were higher than those in the ZLH and SXH lakes (Figure 2, Table 1). The low diversity index showed heavy pollution in ZLH, SXH, and QH. Natural lakes have a self-purification system and healthy zooplankton structure that polluted lakes lack, due to frequent water fluctuation (good fluidity) [36,37]. The high total biomass and density of zooplankton in DHC and SH may be explained by the strict protection of the waters by local governments and good natural fluidity (DHC and SH connect to the main lake when the water level reaches 17.3 m and NH connects to the main lake at a higher water level). In SXH, extensive aquaculture production degraded the water quality, produced a large amount of waste, and accumulated excessive amounts of nitrogen and phosphorus so that the habitat, niche spaces, and zooplankton diversity were reduced. A high degree of aquaculture and species input limitation imposed by the dam can contribute its low diversity of zooplankton [38,39]. Zooplankton is vital to supporting nutrition for fishes, so reduced amount and species of zooplankton will negatively impact the fish predation pressure and aquaculture economy can be impaired. ZLH is the only upstream reservoir with functions including water conservation, tourism, aquaculture, and flood storage, and it has been subjected to industrial emissions, mismanaged aquaculture practices, and tourism construction [40]. The overuse of chemical detergents and poor aquaculture practices killed zooplankton, reduced their food resources, polluted their habitat, and reduced the overall diversity of zooplankton of ZLH [39]. Interestingly, a contradiction of low diversity index and high total density and biomass of Cladocera was observed in QH, which may suggest the overgrowth of more tolerant zooplankton species and more simple structure of dominant species in this polluted and eutrophic water body [41], such as Bosmina longispina in Taihu Lake, Jiangsu Province, and Brachionus forficula in Yueliang Lake, Nanchang [42].
We further analyzed the association between the physicochemical factors and sub-lakes based on zooplankton distribution, indicating that the dispersal and growth of zooplankton can be explained by TP, TN, Chl-a, DO, Cond, pH, and WT. TP is strongly correlated with the biomass of algae (containing Chl-a), resulting in an increase of zooplankton production, while TN has a general effect on the production of aquatic organisms [28]. Therefore, the higher content of TN, TP, and Chl-a together indicates the eutrophication and acquaculture degree of SXH, and eutrophication has impacted the zooplankton assemblage. The samples taken from SXH verify the results of previous study, which showed that Copepoda and Cladocera did not grow well in a eutrophic state, while Rotifera had a higher rate of reproduction as TP and Chl-a increased [43]. A high Cond indicates high levels of metal and chemical pollution and challenges the growth of zooplankton, but the density of specific tolerant species can increase under extreme conditions [44]. Zooplankton in QH was positively correlated with pH and Cond; correspondingly, QH had a low density and biomass of zooplankton with the exception of Cladocera, which may suggest the bad effect of heavy industrial pollution in QH [45]. High Cond reflected high salt loads and the biodiversity of zooplankton decreased under high alkaline and salt conditions, with only a few dominant species prevailing. The high concentrations of chemical gradients from QH can pollute groundwater, the surrounding farmlands, and impact human health [9].
The analysis of zooplankton and physicochemical factors revealed that the water quality of DHC and SH was relatively normal, further indicating that DHC and SH varied from other sub-lakes. RDA image of zooplankton analysis and PLS-DA image of fungal sequencing indicated the differences between NH, ZLH, SXH, and QH. Ascomycota and Chytridiomycota are the most common aquatic fungi at the phylum level [46] and Basidiomycota play significant role in the carbon cycle by decomposing organics [47]. Certain species of Chytridiomycota cause chytridiomycosis, which is known to kill huge populations of amphibians [48]. A higher relative abundance of Basidiomycota in DHC, SH, and NH and lower relative abundance of Chytridiomycota in DHC and SH suggest that DHC and SH have healthier zooplankton structure than other lakes. DHC and SH were noted for their beneficial fungal structure and lower risk for spreading disease. At the genus level, Massarina belongs to the predominant phylum Ascomycota and plays a vital role in decomposing wood and providing energy [49]. Several species of Basidiobolus lead to cutaneous zygomycosis in humans [50]. Massarina relative abundance was highest in DHC and SH, and the relative abundance of Basidiobolus was highest in SXH, which indicate the lakes of frequent human activities have worse condition of zooplankton than that of DHC and SH. The carbon cycle in NH, SXH, QH and ZLH is weaker and SXH is associated with more health concerns due to greater amounts of pathogenic fungal genus. KEGG analysis indicated that ZLH was highly associated with neurodegenerative disease and cancers, but it is still a primary water supply for the surrounding population. Certain pathogenic fungi are tolerant to alkaline conditions and are predominant in water [51]. We believe that the high pH values of QH, SHX, and ZLH indicate higher concentrations of pathogenic species and an increased risk for disease in humans and aquatic species.

5. Conclusions

We analyzed the three taxa (Rotifera, Copepoda, Cladocera) of zooplankton, diversity of fungi, and relevant environmental factors, finding that human activities destroyed the natural hydrology of sub-lakes, reducing the diversity of zooplankton and fungi, increasing noxious environmental factors and pathogens, and worsening the water quality to potentially harm human life and economic production. We analyzed the detailed microbial structure of the sub-lakes of the Poyang Lake watershed to present the influence of anthropogenic factors on the sub-lakes, providing guidance for the management of the water quality to benefit people living on the Poyang Lake watershed. However, this study was limited by its short study period, making it difficult to separate natural variability from manmade changes, therefore, further studies should be conducted.

Author Contributions

H.Q. and T.C. designed the experiments; H.Q., L.C. and Q.L. made Data curation; H.Q., X.C. and T.C. analyzed the data and wrote the manuscript. All authors performed the experiments and discussed the results and commented on the final manuscript. All authors have read and agreed to the published version of the manuscript.

Funding

This work was supported by grants from the National Natural Science Foundation of China (31560133 to H.Q., 81503364 to T.C., and 31560264 to T.C.), the Excellent Youth Foundation of the Jiangxi Scientific Committee (20171BCB23028 to T.C.), the Science and Technology Plan of the Jiangxi Health Planning Committee (20175526 to T.C.), the Science and Technology Project of Jiangxi (20181BBG70028 to T.C., and 20181BCB24003 to T.C.).

Conflicts of Interest

The authors declare that they have no competing interests.

Appendix A

Table A1. Species list of zooplankton in six sampling sub-lakes.
Zooplankton SpeciesSub-LakesAbbreviate
DHCSHNHSXHZLHQH
Rotifera
Lepadella patella + Lpa
Lepadella ovalis + Lov
Trichotria tetractis + Tte
Brachionus calyciflorus++++ +Bca
Brachionus forficula++ + Bfo
Brachionus budapestiensis++ Bbu
Brachionus falcatus++ Bfa
Brachionus quadridentatus++++ Bca
Brachionus diversicornis++++ +Bdi
Platyias militaris + Pmi
Keratella ticinensis + Kti
Keratella cochlearis++ +Kco
Keratella valga++ Kva
Notholca labis+ Nla
Lecane ungulate++ Lun
Lecane luna + Llu
Lecane niothis + Lni
Monostyla lunaris+ Mlu
Monostyla bulla + Mbu
Monostyla crenaa+ Mcr
Asplanchna priodonta++++ Apr
Asplanchna brightwelli + Abr
Eothinia elongata+ Eel
Cephalodella gibba+ Cgi
Scaridium longicaudum + Slo
Trichocerca cylindrica+++ Tcy
Trichocerca capucina+ ++ Tca
Trichocerca longiseta++ Tlon
Trichocerca lophoessa + Tlop
Trichocerca rousseleti + Tro
Trichocerca elongata+++ Tel
Polyarthra trigla + Ptr
Polyarthra vulgaris + Pvu
Filinia longiseta + Flo
Cladocera
Leptodora Kindti +Lki
Sida crystallina++++ +Scr
Diaphanosoma leuchtenbergianum+ + +Dle
Diaphanosoma brachyurum+ + Dbr
Diaphanosoma sarsi+ Dsa
Diaphanosoma aspinosum++ + +Das
Bosmina longirostris++ Blo
Bosminopsis deitersi++ Bde
Daphnia cucullata + Dcu
Ceriodaphnia quadrangula + +Cqu
Alona guttata+ Agu
Pleuroxus laevis + Pla
Copepoda
Copepod nauplii++++++Cna
Sinocalanus dorrii++ + Sdo
Neutrodiaptomus incongruens+ Nin
Tropocyclops prasi+ Tpr
Microcyclops varicans+++ +Mva
Mesocyclops leuckarti++++ Mle
Neodiaptomus schmackeri+ Nsc

References

  1. Dawen, Z.; Qiegen, L.; Li, Z.; Donggen, W.; Linguang, L.; Yuwei, C.; Jiayou, Z.; Jutao, L. Occurrence and spatial distributions of microcystins in Poyang Lake, the largest freshwater lake in China. Ecotoxicology 2015, 24, 19–28. [Google Scholar]
  2. Wang, H.; Fu, Y.; Kang, S.; Li, Y.; Chen, W. Development of Ecological Fishery in Poyang Lake Area. Asian Agric. Res. 2013, 5, 39–44. [Google Scholar]
  3. Sun, J.B. Analysis of “three fishery” problems in Poyang Lake area. Acta Agric. Jiangxi 2012, 24, 201–203. [Google Scholar]
  4. Cui, L. Evaluation on functions of Poyang Lake ecosystem. Chin. J. Ecol. 2004, 23, 47–51. [Google Scholar]
  5. Cao, L.; Wang, W.; Yang, Y.; Yang, C.; Yuan, Z.; Xiong, S.; Diana, J. Environmental impact of aquaculture and countermeasures to aquaculture pollution in China. Environ. Sci. Pollut. Res. Int. 2007, 14, 452–462. [Google Scholar] [PubMed]
  6. Wang, M.; Zhou, W.; Hu, C. Status of nitrogen and phosphorus in waters of Lake Poyang Basin. Lake Sci. 2008, 20, 334–338. [Google Scholar]
  7. Liu, T.; Chen, M. Wetland Ecological Function Deterioration in Poyang Lake and Countermeasures. Chin. J. Ecol. 2001, 20, 74–77. [Google Scholar]
  8. Zhang, H.; Jiang, Y.; Ding, M.; Xie, Z. Level, source identification, and risk analysis of heavy metal in surface sediments from river-lake ecosystems in the Poyang Lake, China. Environ. Sci. Pollut. Res. Int. 2017, 24, 1–15. [Google Scholar] [CrossRef]
  9. Kim, H.T.; Kim, J.G. Uptake of Cadmium, Copper, Lead, and Zinc from Sediments by an Aquatic Macrophyte and by Terrestrial Arthropods in a Freshwater Wetland Ecosystem. Arch. Environ. Contam. Toxicol. 2016, 71, 1–12. [Google Scholar] [CrossRef]
  10. Xu, H.; Paerl, H.W.; Qin, B.; Zhu, G.; Hall, N.S.; Wu, Y. Determining critical nutrient thresholds needed to control harmful cyanobacterial blooms in eutrophic Lake Taihu, China. Environ. Sci. Technol. 2015, 49, 1051–1059. [Google Scholar] [CrossRef]
  11. Lin, Y.; Du, Y.; Yang, H. Analysis of Wetland Ecosystem Response of Poyang Lake with Water Level Evolution Base on TM Images. Appl. Mech. Mater. 2013, 295–298, 1935–1940. [Google Scholar] [CrossRef]
  12. Burns, C.W.; Galbraith, L.M. Relating planktonic microbial food web structure in lentic freshwater ecosystems to water quality and land use. J. Plankton Res. 2007, 29, 127–139. [Google Scholar] [CrossRef]
  13. Suda, H. Water quality and compositions of the phytoplankton and zooplankton before and after building construction in lake fukami-ike, Japan. Int. J. Geomate 2016, 10, 1983–1988. [Google Scholar] [CrossRef]
  14. Elser, J.J.; Foster, D.K.; Hecky, R.E. Effects of zooplankton on sedimentation in pelagic ecosystems: Theory and test in two lakes of the Canadian shield. Biogeochemistry 1995, 30, 143–170. [Google Scholar] [CrossRef]
  15. Gutkowska, A.; Paturej, E.; Bowszys, M. Nutrients excretion by zooplankton in two brackish water bodies. Int. Rev. Hydrobiol. 2018, 103, 15–25. [Google Scholar] [CrossRef]
  16. Xiong, W.; Ni, P.; Chen, Y.; Gao, Y.; Shan, B.; Zhan, A. Zooplankton community structure along a pollution gradient at fine geographical scales in river ecosystems: The importance of species sorting over dispersal. Mol. Ecol. 2017, 26, 4351–4360. [Google Scholar] [CrossRef]
  17. Walsh, J.J.; Lenes, J.M.; Darrow, B.; Parks, A.; Weisberg, R.H. Impacts of combined overfishing and oil spills on the plankton trophodynamics of the West Florida shelf over the last half century of 1965–2011: A two-dimensional simulation analysis of biotic state transitions, from a zooplankton- to a bacterioplankton. Cont. Shelf Res. 2016, 116, 54–73. [Google Scholar] [CrossRef]
  18. Egeren, S.J.V.; Dodson, S.I.; Torke, B.; Maxted, J.T. The relative significance of environmental and anthropogenic factors affecting zooplankton community structure in Southeast Wisconsin Till Plain lakes. Hydrobiologia 2011, 668, 137–146. [Google Scholar] [CrossRef]
  19. Khalifa, N.; El, K.; Cairo, A.; Khaled, E.; El-Damhogy, A.; Fishar, M.R.; Nasef, A.; Hegab, M.; El-Damhogy, K. Using zooplankton in some environmental biotic indices to assess water quality of Lake Nasser, Egypt. Int. J. Fish. Aquat. Stud. 2015, 2, 281–289. [Google Scholar]
  20. Ejsmont-Karabin, J.; Górniak, A.; Jekatierynczuk-Rudczyk, E.; Karpowicz, M.; Więcko, A. Long-term changes in the trophic state of Suwalki lakes—An analysis by means of indices based on abundance and composition of their rotifer fauna. Limnol. Rev. 2017, 16, 199–205. [Google Scholar] [CrossRef] [Green Version]
  21. Hawksworth, D.L. The magnitude of fungal diversity: The 1.5 million species estimate revisited. Mycol. Res. 2001, 105, 1422–1432. [Google Scholar] [CrossRef] [Green Version]
  22. Niquil, N.; Kagami, M.; Urabe, J.; Christaki, U.; Viscogliosi, E.; Simengando, T. Potential role of fungi in plankton food web functioning and stability: A simulation analysis based on Lake Biwa inverse model. Hydrobiologia 2011, 659, 65–79. [Google Scholar] [CrossRef]
  23. Kagami, M.; Miki, T.; Takimoto, G. Mycoloop: Chytrids in aquatic food webs. Front. Microbiol. 2014, 5, 166. [Google Scholar] [CrossRef] [PubMed]
  24. Kissi, M.; Mountadar, M.; Assobhei, O.; Gargiulo, E.; Palmieri, G.; Giardina, P.; Sannia, G. Roles of two white-rot basidiomycete fungi in decolorisation and detoxification of olive mill waste water. Appl. Microbiol. Biotechnol. 2001, 57, 221–226. [Google Scholar]
  25. Magwaza, N.M.; Nxumalo, E.N.; Mamba, B.B.; Msagati, T.A.M. The Occurrence and Diversity of Waterborne Fungi in African Aquatic Systems: Their Impact on Water Quality and Human Health. Int. J. Environ. Res. Public Health 2017, 14, 546. [Google Scholar] [CrossRef] [PubMed] [Green Version]
  26. Nakamura, A.; Matsuno, K.; Abe, Y.; Shimada, H.; Yamaguchi, A.J.Z.S. Length-weight Relationships and Chemical Composition of the Dominant Mesozooplankton Taxa/species in the Subarctic Pacific, with Special Reference to the Effect of Lipid Accumulation in Copepoda. Zool. Stud. 2017, 56, 1–15. [Google Scholar]
  27. Chen, F.; Shu, T.; Jeppesen, E.; Liu, Z.; Chen, Y. Restoration of a subtropical eutrophic shallow lake in China: Effects on nutrient concentrations and biological communities. Hydrobiologia 2013, 718, 59–71. [Google Scholar] [CrossRef]
  28. Trevisan, G.V.; Forsberg, B.R. Relationships among nitrogen and total phosphorus, algal biomass and zooplankton density in the central Amazonia lakes. Hydrobiologia 2007, 586, 357–365. [Google Scholar] [CrossRef]
  29. Edgar, R.C. Search and clustering orders of magnitude faster than BLAST. Bioinformatics 2010, 26, 2460–2461. [Google Scholar] [CrossRef] [Green Version]
  30. Lindahl, B.D.; Nilsson, R.H.; Tedersoo, L.; Abarenkov, K.; Carlsen, T.; Kjøller, R.; Kõljalg, U.; Pennanen, T.; Rosendahl, S.; Stenlid, J.; et al. Fungal community analysis by high-throughput sequencing of amplified markers—A user’s guide. New Phytol. 2013, 199, 288–299. [Google Scholar] [CrossRef] [Green Version]
  31. Quast, C.; Pruesse, E.; Yilmaz, P.; Gerken, J.; Schweer, T.; Yarza, P.; Peplies, J.; Glockner, F.O. The SILVA ribosomal RNA gene database project: Improved data processing and web-based tools. Nucleic Acids Res. 2013, 41, D590–D596. [Google Scholar] [CrossRef]
  32. Ren, L.; Zhang, Z.; Zeng, X.; Ma, Y.; Zeng, Y.; Zhou, C. Community Structure of Zooplankton and Water Quality Assessment of Jialing River in Nan Chong. Procedia Environ. Sci. 2011, 10, 1321–1326. [Google Scholar] [CrossRef] [Green Version]
  33. Legendre, P.; Legendre, L. Numerical Ecology; Elsevier Science BV: Amsterdam, The Netherlands, 2012. [Google Scholar] [CrossRef]
  34. De Laender, F.; Taub, F.B.; Janssen, C.R. Ecosystem functions and densities of contributing functional groups respond in a different way to chemical stress. Environ. Toxicol. Chem. 2011, 30, 2892–2898. [Google Scholar] [CrossRef] [PubMed]
  35. Weyhenmeyer, G.A.; Peter, H.; Willén, E. Shifts in phytoplankton species richness and biomass along a latitudinal gradient—Consequences for relationships between biodiversity and ecosystem functioning. Freshw. Biol. 2013, 58, 612–623. [Google Scholar] [CrossRef]
  36. Krzyk, M.; Drev, D.; Kolbl, S.; Panjan, J. Self-purification processes of Lake Cerknica as a combination of wetland and SBR reactor. Environ. Sci. Pollut. Res. 2015, 22, 1–9. [Google Scholar] [CrossRef] [PubMed]
  37. Sanyal, P.; Bhattacharya, N.; Chakraborty, S.K. Biomonitoring of Four Contrasting Wetlands of Kolkata, West Bengal Based on Zooplankton Ecodynamics and Biotic Indices. J. Environ. Prot. 2015, 6, 683–699. [Google Scholar] [CrossRef] [Green Version]
  38. Olubode, O.S.; Awodoyin, R.O.; Ogunyemi, S. Floral diversity in the wetlands of Apete River, Eleyele Lake and Oba Dam in Ibadan, Nigeria: Its implication for biodiversity erosion. West Afr. J. Appl. Ecol. 2011, 18, 109–119. [Google Scholar] [CrossRef] [Green Version]
  39. Jacob, A.P.; Culver, D.A.; Lanno, R.P.; Voigt, A. Ecological impacts of fluridone and copper sulphate in catfish aquaculture ponds. Environ. Toxicol. Chem. 2016, 35, 1183–1194. [Google Scholar] [CrossRef]
  40. Liu, H.L.; Liao, B. The Major Eco-environmental Problems and its Protection Countermeasures in Zhelin Lake. Jiangxi Sci. 2013, 31, 48–128. [Google Scholar]
  41. Ma, Y.; Wang, Y. Analysis of the lakes plankton miniaturization. J. Aquac. 2012, 33, 4–7. [Google Scholar]
  42. Cheng, L.; Yao, S.; Xue, B.; Li, L.; Liu, J. Long-term change of the assemblages and abundance of cladocerans in different ecotypes of Lake Taihu. J. Lake Sci. 2019, 31, 1670–1684. [Google Scholar]
  43. Cottenie, K.; Meester, L.D. Connectivity and cladoceran species richness in a metacommunity of shallow lakes. Freshw. Biol. 2003, 48, 823–832. [Google Scholar] [CrossRef] [Green Version]
  44. Aykol, A.; Budakoglu, M.; Kumral, M.; Gultekin, A.H.; Turhan, M.; Esenli, V.; Yavuz, F.; Orgun, Y. Heavy metal pollution and acid drainage from the abandoned Balya Pb-Zn sulfide Mine, NW Anatolia, Turkey. Environ. Geol. 2003, 45, 198–208. [Google Scholar] [CrossRef]
  45. Chen, G.; Dalton, C.; Taylor, D. Cladocera as indicators of trophic state in Irish lakes. J. Paleolimnol. 2010, 44, 465–481. [Google Scholar] [CrossRef]
  46. Shearer, C.A.; Descals, E.; Kohlmeyer, B.; Kohlmeyer, J.; Marvanová, L.; Padgett, D.; Porter, D.; Raja, H.A.; Schmit, J.P.; Thorton, H.A. Fungal biodiversity in aquatic habitats. Biodivers. Conserv. 2007, 16, 49–67. [Google Scholar] [CrossRef]
  47. Hibbett, D.S.; Thorn, R.G. Basidiomycota: Homobasidiomycetes. In Systematics and Evolution; McLaughlin, D.J., McLaughlin, E.G., Lemke, P.A., Eds.; Springer: Berlin/Heidelberg, Germany, 2001; pp. 121–168. [Google Scholar] [CrossRef]
  48. Grogan, L.F.; Mulvenna, J.; Gummer, J.P.A.; Scheele, B.C.; Berger, L.; Cashins, S.D.; McFadden, M.S.; Harlow, P.; Hunter, D.A.; Trengove, R.D.; et al. Survival, gene and metabolite responses of Litoria verreauxii alpina frogs to fungal disease chytridiomycosis. Sci. Data 2018, 5, 180033. [Google Scholar] [CrossRef]
  49. Goh, T.K.; Hyde, K.D. Biodiversity of freshwater fungi. J. Ind. Microbiol. 1996, 17, 328–345. [Google Scholar] [CrossRef]
  50. Yangco, B.G.; Nettlow, A.; Okafor, J.I.; Park, J.; Te Strake, D. Comparative antigenic studies of species of Basidiobolus and other medically important fungi. J. Clin. Microbiol. 1986, 23, 679–682. [Google Scholar] [CrossRef] [Green Version]
  51. Pietryczuk, A.; Cudowski, A.; Hauschild, T.; Świsłocka, M.; Więcko, A.; Karpowicz, M. Abundance and Species Diversity of Fungi in Rivers with Various Contaminations. Curr. Microbiol. 2017, 75, 1–9. [Google Scholar] [CrossRef] [Green Version]
Figure 1. Map of sampling sites. Six sampling sub-lakes (DHC, SH, NH, SXH, ZLH and QH) of Poyang Lake were marked red.
Diversity 12 00296 g001
Figure 2. Biomass and density of zooplankton in six sub-lakes. Density (ind./L) of total species (A), (B) Rotifera, (C) Cladocera, (D) Copepoda were calculated and biomass (mg/L) of total species (E), Rotifera (F), Cladocera (G), Copepoda (H) were calculated. On X- axis, DHC, SH and NH were sub-lakes connected to Poyang Lakes, SXH was closed sub-lake, ZLH was tourism type reservoir and QH was artificial urban lake. The significant differences (* p < 0.05, ** p < 0.01, *** p < 0.001) have been presented in group comparisons.
Diversity 12 00296 g002
Figure 3. The Redundancy and metric multidimensional scaling ordination (NMDS) analysis of strength and relationship of physicochemical factors and samples from six lakes based on zooplankton distribution. (A) NMDS presented variance by the distances between samples. (B) RDA showed the relationship of zooplankton distribution and physicochemical factors. The full name of zooplankton species in this panel were presented in Table A1. (C) RDA showed the relationship of samples and physicochemical factors. The physicochemical factors: pH, water depth (WT), total nitrogen (TN), total phosphorus (TP), dissolved oxygen (DO), conductivity (Cond), water temperature (WT), turbidity (Turb), chlorophyll a (Chl-a).
Diversity 12 00296 g003
Figure 4. Fungal composition analysis using high-throughput sequencing. (A) Observed species of water samples of DHC, SH, NH, SXH ZLH and QH. (B) Partial least squares discriminant analysis (PLS-DA) presenting the sample distribution. Composition and relative abundance of the fungal communities in water samples of the six lakes in phylum (C) and genus (D) based on 18S ribosomal RNA.
Diversity 12 00296 g004
Figure 5. Fungal relative abundance of genera. Twenty genera were selected for their significant differences among DHC, SH, NH, SXH ZLH and QH. Relative abundance of Atractospora (A), Basidiobolus (B), Boletellus (C), Bulleribasidium (D), Catenochytridium (E), Ceratocystis (F), Chalaropsis (G), Ephebe (H), Gibellulopsis (I), Massarina (J), Microstroma (K), Ophiodiaporthe (L), Phlyctochytrium (M), Raffaelea (N), Rubroboletus (O), Scleroderma (P), Sugitazyma (Q), Sympodiomycopsis (R), Thielaviopsis (S), Velutarina (T) were shown.
Diversity 12 00296 g005
Figure 6. Disease prediction of KEGG analysis. Prediction of diseases caused by fungus from DHC, SH, NH, SXH ZLH and QH based on KEGG database.
Diversity 12 00296 g006
Table 1. Study site. Code, number of sites, sampling periods and human interference in the six studied sub-lakes (DHC, SH, NH, SXH ZLH and QH).
Studied Sub-LakesCodeMax Water Depth (m)Trophic StatusWater Renewal TimeLake Area (km2)Human Interference
Dahuchi LakeDHC8.5MesotrophicationJune, July30Nature reserve
Shahu LakeSH8MesotrophicationJune, July14Nature reserve
Nanhu LakeNH6MesotrophicationJune, July7Natural fishing
Sixiahu LakeSXH5EutrophicationJuly8Aquaculture
Zhelinhu ReservoirZLH55OligotrophicationJuly308Eco-tourism, hydroelectric power and irrigation
Qianhu LakeQH3.5EutrophicationWhole year1.5Urban sewage discharge
Table 2. Biomass and density of zooplankton. Biomass and density of total zooplankton, Cladocera, Copepoda and Rotifera are calculated in DHC, SH, NH, SXH ZLH and QH. Mean ± SE.
Sub-LakesDensity
(ind./L)
Rotifera
(ind./L)
Cladocera
(ind./L)
Copepoda
(ind./L)
Biomass
(mg/L)
Rotifera
(mg/L)
Cladocera
(mg/L)
Copepoda
(mg/L)
DHC394.44 ± 98.7376.13 ± 44.0198.89 ± 16.71219.42 ± 46.780.761 ± 0.2610.149 ± 0.0880.265 ± 0.0540.346 ± 0.120
SH241.82 ± 47.0374.71 ± 27.5225.64 ± 6.27141.47 ± 25.180.500 ± 0.0850.111 ± 0.0260.042 ± 0.0120.347 ± 0.072
NH314.67 ± 57.25126.92 ± 56.3947.47 ± 38.27140.27 ± 75.490.540 ± 0.0600.222 ± 0.0880.010 ± 0.0100.308 ± 0.138
SXH60.00 ± 1.3952.80 ± 2.812.13 ± 2.135.07 ± 2.370.078 ± 0.0160.066 ± 0.0150.002 ± 0.0020.010 ± 0.006
ZLH5.03 ± 1.671.77 ± 0.330.13 ± 0.133.13 ± 1.440.010 ± 0.0050.0004 ± 0.0010.0004 ± 0.00040.009 ± 0.004
QH334.40 ± 146.1318.67 ± 18.67290.13 ± 154.9725.60 ± 16.340.363 ± 0.1910.001 ± 0.0020.299 ± 0.1960.063 ± 0.043
Table 3. Species richness and diversity index of zooplankton in six lakes. Species richness of Cladocera, Copepoda and Rotifera were count in DHC, SH, NH, SXH ZLH and QH. The diversity index including Margalef richness (D), Shannon–Wiener index (H’) and Pielou’s evenness index (J’) were calculated with total number of zooplankton and number of zooplankton species. Mean ± SE.
Sub-LakesSpecies RichnessDiversity Index
RotiferaCladoceraCopepodaDH’J’
DHC20972.57 ± 0.191.11 ± 0.210.36 ± 0.07
SH26642.65 ± 0.731.07 ± 0.160.36 ± 0.03
NH7330.83 ± 0.090.94 ± 0.070.46 ± 0.04
SXH6220.94 ± 0.090.84 ± 0.020.43 ± 0.03
ZLH5130.94 ± 0.230.75 ± 0.190.49 ± 0.07
QH2520.50 ± 0.070.68 ± 0.140.42 ± 0.08
Total34127---
Table 4. Physicochemical parameters in the six studied sub-lakes. Total nitrogen (TN), total phosphorus (TP), chlorophyll a (Chl-a), water temperature (WT), water depth (WD), turbidity (Turb), pH, dissolved oxygen (DO), conductivity (Cond) of six sub-lakes were detected and calculated. Mean ± SE.
Sub-LakesTN (mg/L)TP (mg/L)Chlorophyll-a (μg/L)Water Temperature (°C)Water Depth (cm)Turbidity (NTU)pHDissolved Oxygen (mg/L)Conductivity (uS/cm)
DHC2.18 ± 0.400.28 ± 0.0519.34 ± 3.8828.20 ± 0.1256.67 ± 3.33206.37 ± 64.787.53 ± 0.063.67 ± 0.5259.47 ± 1.60
SH1.56 ± 0.060.20 ± 0.0322.49 ± 4.0929.07 ± 0.0976.67 ± 12.0243.03 ± 20.527.41 ± 0.103.46 ± 0.6276.40 ± 6.07
NH2.75 ± 0.620.38 ± 0.0991.14 ± 33.3630.77 ± 0.7131.67 ± 9.2875.30 ± 14.577.89 ± 0.336.00 ± 0.83140.93 ± 14.12
SXH2.64 ± 0.120.45 ± 0.05107.92 ± 6.2329.77 ± 0.0948.33 ± 13.0269.57 ± 12.868.60 ± 0.046.04 ± 0.09160.83 ± 0.49
ZLH1.28 ± 0.060.06 ± 0.011.12 ± 0.0129.53 ± 2.07233.33 ± 66.671.13 ± 0.508.00 ± 0.145.25 ± 0.0556.45 ± 26.60
QH3.31 ± 0.240.26 ± 0.0259.42 ± 5.7835.73 ± 0.0920.00 ± 5.7760.30 ± 6.618.81 ± 0.187.50 ± 0.23232.67 ± 15.77

