Article

Landscape-Level Effects of Forest on Pollinators and Fruit Set of Guava (Psidium guajava L.) in Orchards across Southern Thailand

1
Center for Macroecology, Evolution and Climate, GLOBE Institute, University of Copenhagen, 2100 Copenhagen Ø, Denmark
2
Center for Integrative Conservation, Xishuangbanna Tropical Botanical Garden, Chinese Academy of Sciences, Menglun, Mengla 666303, China
3
Department of Biology, Prince of Songkla University, Hat-Yai, Songkhla 90112, Thailand
4
Centre for Ecology and Conservation, College of Life and Environmental Sciences, University of Exeter, Cornwall Campus, Penryn TR10 9FE, UK
5
Department of Food and Resource Economics & Center for Macroecology, Evolution and Climate, University of Copenhagen, Rolighedsvej 23, 1958 Copenhagen, Denmark
*
Authors to whom correspondence should be addressed.
Diversity 2020, 12(6), 259; https://doi.org/10.3390/d12060259
Submission received: 29 May 2020 / Revised: 22 June 2020 / Accepted: 23 June 2020 / Published: 25 June 2020
(This article belongs to the Special Issue Land-Use and Climate Impacts on Plant-Pollinator Interactions)

Abstract

:
Pollination by wild pollinators is a key ecosystem service threatened by anthropogenic-induced land-use change. The proximity to natural habitat has previously been shown to positively affect pollinator communities and improve crop yield and quality but empirical evidence is limited from most parts of the World. Here, across six farms in Southern Thailand, we investigated the significance of landscape-level effects of natural habitat (proportion of and distance to evergreen forest) on both visitation rate and richness of pollinators as well as fruit set of guava (Psidium guajava L.), a local economically-important crop in the tropics. Overall, the most abundant pollinator was the Asian honey bee Apis cerana (39% of all visits) and different species of stingless bees (37%). We found that pollinator richness was unrelated to the proportion and distance to evergreen forest, however, the proportion of forest within a 1, 5 and 10 km radius had a significant positive impact on visitation rate of wild pollinators. Still, neither the various forest parameters nor pollinator visitation rate showed a significant impact on fruit set of guava, perhaps because guava self-pollinates. This illustrates that landscape-level degradation of natural habitat may negatively impact pollinator communities without diminishing the crop yield of the farmers.

Graphical Abstract

1. Introduction

Flowering plants rely on successful pollination for sexual reproduction. Although many plants may be able to self-pollinate or use abiotic agents such as wind to transport their pollen, the majority of plants use animal pollinators as vectors to transport pollen between plant individuals [1,2]. This makes plant-pollinator interactions one of the most important ecological functions for sustaining our ecosystems [3]. Notably, animal pollination plays a crucial role in warm and humid tropical ecosystems where an estimated average of 94% of all flowering plant species are thought to be animal pollinated [1,2,4].
A large variety of crops benefit from being pollinated by animals; thus, pollination is also a key ecosystem service that benefits us humans [5,6]. Efficient pollination is known to contribute significantly to both yield and quality in the production of close to 75% of the most important food crops worldwide [5,7,8]. As pollinator contribution to yield differs greatly between plant species and we consume heavily certain crops that are not pollinator-dependent, this corresponds to around 5–8% of the global crop production [5]. As for wild plants, crop plants grown in tropical areas are more dependent on animal pollination than crop plants used in temperate regions [8,9].
Globally, there is an increasing concern that the ecosystem services provided by wild pollinators are threatened by anthropogenic-induced global change [3,8,10]. Pollinator extinctions and declines have been observed in both Europe and North America [11,12,13], whereas we are lacking solid data for wild pollinators in most other parts of the World, such as tropical South America, Africa and Asia [5,7,11,13]. Some of the most important anthropogenic-induced drivers of change in pollinator communities are climate and land-use change, including deforestation and conversion to agriculture [5,10]. Land-use change from natural habitat to agricultural land has increased by 25% since the 1960s and most of this expansion has happened in the developing world, such as the tropical forests of South-east Asia [10,14]. Therefore, it is crucial to better understand how landscape-level effects impact pollinators and their services [10,15,16].
The proximity to natural habitat has been shown to positively affect pollinator communities and improve crop yield or quality [8,15,17,18,19,20,21,22]. In other words, farmers growing pollinator-dependent crops close to natural habitat have been observed to have a greater crop production than farmers far from natural habitat. Land-use changes and habitat degradation thus seem to not only harm nature but also farm productivity. Managed honey bees are utilized worldwide to meet the need of pollination in large orchards or degraded landscapes. The most frequently-used species are the European honey bee Apis mellifera L. and the Asian honey bee Apis cerana L. both from the family Apidae [7,23,24]. Although managed honey bees benefit crop yield, wild bee species often pollinate crops more efficiently and improve cross-pollination more so than by managed honey bees [23]. Thus, we cannot simply substitute wild pollinators for managed honey bees. Furthermore, land-use changes will most likely have a negative effect on ecological resilience of pollinator communities underlining the need to better understand the impact of land-use change on wild pollinators [25].
The guava tree (Psidium guajava L.) belonging to the Myrtaceae family is thought to be native to tropical Mexico and Central America [26,27,28] but today it is widespread and locally an economically-important crop produced in many tropical and subtropical landscapes around the world [26,29]. Guava is considered part of the so-called “minor tropical fruit” production together with fruits such as mango and mangosteen. Minor tropical fruits are mostly grown in smaller households and traded regionally and in smaller volumes [29,30] but the production and trade are gaining more importance globally, as many of the minor fruits are recognized as a contribution to a healthier diet [29]. In Thailand, for instance, besides being important for the economy of local households, it has been estimated that minor fruits account for almost 7 per cent of agricultural earnings [29]. The guava is an important minor tropical fruits in the food industry, especially in the production of juice, fruit bars or other dehydrated food products [31].
In tropical areas, production of guava fruits can be induced year around by pruning the branches, making guava trees suitable for continuous fruit production and, thus, an excellent crop to conduct pollination experiments and to examine land-use impacts on fruit production [26]. Although a few pollination experiments have been conducted on guava, it still remains uncertain whether guava is mainly cross-pollinated by insects or self-pollinated [26,27,31,32]. Furthermore, despite its importance, we know little about how land-use impact the pollination and fruit set of guava.
Therefore, in this study we aim to test the effect of natural forest in the surrounding landscape on pollinator communities and the pollination of guava in orchards across Southern Thailand. To examine this, we estimated pollinator richness and visitation rate and performed pollination experiments (open vs. closed pollination treatment) in six guava orchards surrounded by different amounts of natural forest. We also measured the morphology of guava flowers and conducted pollination experiments to describe the overall dependency of guava on pollinators. We then tested the following hypotheses—(1) pollinator richness and visitation rate increase close to evergreen forest and with a larger proportion of evergreen forest in the surrounding landscape and (2) fruit set of guava trees increases on farms with a higher richness and visitation rate of pollinators and a larger proportion of (and/or closer distance to) evergreen forest in the surrounding landscape.

2. Materials and Methods

2.1. Study Site and Species (Psidium Guajava)

Guava production is common in Southern Thailand for both private and commercial purposes [33]. Here, we focus on plantations growing guava as a monoculture for commercial sale. All guava trees studied were of the local variety “Kimju guava” [34]. The study took place in Southern Thailand from November 2019 until March 2020. Six guava plantations with varying degrees of surrounding evergreen forest were chosen. The plantations were located in the provinces Phattalung and Songkhla (6°54′ to 7°52′ N and 99°53′ to 100°36′ E; Table 1). In these provinces, it takes between four and five months from flowering to harvest of a ripe guava.
The reference land-use map was obtained from the Land Development Department of Thailand (LDD) [35]. The LDD provided the shape file data which has scale of 1:25,000 digitized from satellite images resolution of 2.5 m. Evergreen forest is defined as “areas dominated by trees generally 5–40 m tall and 20% of total vegetation cover. More than 75% of the tree species maintain their leaves all year. Canopy is never without green foliage.” The evergreen forest fraction was calculated within a 1, 5 and 10 km radius for each site using ARCGIS 10.3.
The studied orchards ranged in size from 0.4 ha to 2.8 ha all with guava trees older than two years. All study sites were chosen based on having similar management practices such as being monocultures, using pruning to initiate flowering and using limited amount of pesticides. In the Phattalung and Songkhla provinces, we were unable to locate more than six farms fulfilling these criteria.

2.2. Floral Traits and Pollination Experiments

To characterize guava flowers, we observed—number of flowers in an inflorescence, number of petals and color of stigma. We also measured the floral corolla width and the length of anthers using a digital caliper. To characterize the floral reward, we counted the number of anthers per flower and used micropipettes to investigate whether the guava flower produced nectar (observed from 7.00 to 11.00 AM). To gain knowledge of the reproductive system of guava, we conducted a series of pollination experiments—(1) open pollination (OP); flowers were left open allowing unhindered animal visitation (control treatment), (2) wind-pollination (WP); mature buds were bagged before opening with a coarse-meshed gauze (0.8 mm), allowing wind carried pollen through but otherwise left untouched, (3) cross-pollination (CP); mature buds with cracked calyx were bagged before opening with a spunbond nonwoven bag (which is a highly effective barrier to pollen grains) and were hand-pollinated the following morning with pollen from flowers from a different tree, (4) self-pollination within the same tree (SP); mature buds with cracked calyx were bagged before opening with a spunbond nonwoven bag and were hand-pollinated the following morning with pollen from a different flower on the same tree, (5) self-pollination within the same flower (SF); mature buds with cracked calyx were bagged before opening with a spunbond nonwoven bag and the following morning each flower were hand-pollinated with pollen from its own anthers (i.e., within the same flower). Hand-pollination was done by using a cotton bud to transfer pollen grains to the stigma and using anthers dapped directly onto the stigma to ensure sufficient pollen deposit. This was done between 7 and 9 AM. After applying one of the four treatments, excluding the control treatment (OP), flowers were bagged again and bags were left on for a week to ensure the stigma was no longer receptive when bags were removed. The initial fruit set was counted three weeks after flowering, when fruits were approximately 2 cm in diameter. Fruit set was calculated as the proportion of flowers developing into an initial fruit for each treatment and each tree. All pollination experiments were conducted at only one study site (Site 6, Table 1). Each treatment included five mature buds per tree in ten healthy trees located approximately ten meters from the edge (i.e., 50 flowers per treatment). Although some trees were used for more than one treatment, due to a lack of suitable trees with a sufficient amount of mature buds at the study site, we were unable to conduct all treatments at the same trees as it ideally should have been [18,36]. This resulted in some treatments being paired on the same trees, while other treatments were conducted on other trees. We thus did not perform any statistical analysis to examine whether pollinations experiments differed in fruit set but use the treatments to qualitatively assess the ability of guava to produce fruits under different pollination scenarios.

2.3. Pollinator Visitation and Richness

On each study site, we estimated pollinator visitation rate and species richness shortly after anthesis from 7.30 to 9.00 AM. For all sites, visitation rate and richness measurements were conducted within one day. At each site, we chose ten healthy trees located approximately ten meters from the edge of the orchards and with a minimum of one flower. Pollinator visitation was monitored for 15 min per tree (resulting in 150 min of visitation per study site) followed by a 5 min observation period on the same tree to estimate pollinator richness (resulting in 50 min of richness per study site). In both visitation and richness observations, the number of individuals visiting the flowers were noted together with the number of visits.
For the visitation rate, we did not catch the visiting animals but registered the visiting species. When it was not possible to identify the visiting animal to species-level, we instead registered the taxonomic group, that is, whether it was a bee, stingless bee, carpenter bee, wasp, fly, beetle or ant. One or two flowers were observed at each tree and a registration of visits was made every time a visiting animal touched the reproductive parts of an observed flower. Additionally, we recorded every time a new individual touch the reproductive parts of the flowers, thus we estimated both the total number of pollinator individuals and total number of pollinator visits observed within 15 min.
Average visitation rate of all pollinators on each study site was calculated as average number of visits per flower per tree, then averaged across all ten trees yielding one number per site (visits/flower/15 min). Average visitation rate was also calculated for different sub-groups for each study site—Wild pollinators (all pollinators without the domesticated honey bee A. cerana); All bee species; Wild bee species (all bee species without A. cerana). Many farmers set up empty boxes within or close by the study fields as nesting spot for A. cerana. Thus, A. cerana is often semi-managed and not dependent on forest as nesting area, which is why we exclude A. cerana from the ‘wild pollinator’ and ‘wild bee’ subgroups.
For the species richness estimation, species were either identified in the field or collected and identified by a taxonomist to the lowest possible taxonomic level. The calculations on estimated richness were based on the number of individuals observed during visitation (15 min) and individuals caught or observed during the 5 min of richness estimation. Individuals were caught in the field using an insect net or using a clear plastic bag gently placed over the insect. The insects were quickly transferred to a microtube containing 99% ethanol and pinned shortly after returning from the field. A list of all species is found in Table A1, Appendix A.

2.4. Pollinator Exclusion Experiment

At each study site, ten healthy trees approximately ten meters from the edge of the orchard were chosen in the same area as trees used for monitoring visitation rate and pollinator richness. On each tree we chose ten mature flower buds randomly and subjected to one of two treatments—pollinator exclusion (covered in a 0.8 mm coarse-meshed gauze allowing the flower to be pollinated by wind but not by pollinators) and open pollination (control treatment), allowing us to investigate the difference in fruit set with and without pollinators. Bags were left on for 5–10 days to ensure the stigma was no longer receptive. The initial fruit set was counted three weeks after flowering when initial fruits were approximately 2 cm in diameter. Fruit set of each treatment was calculated as the proportion of flowers developing into an initial fruit for each tree. The additional fruit set with pollinators access was calculated as the difference in fruit set between the two treatments (bagged and open) for each tree. This method controls for variations between plants (which could be caused by difference in water supply, microclimate, management history and soil chemistry) presenting only the difference of fruit set with and without pollinators [17]. For each study site, an average of the additional fruit set with pollinators was calculated across the ten trees and used for later analyses. We note that the experiments without pollinators in a few cases resulted in higher fruit set than when pollinators had access to the flowers. We in these cases converted the differences in fruit set to zero (and not negative values), as we doubt pollinators have a negative influence on fruit set but that these negative values were caused by stochasticity. However, in the below regression analyses we also conducted the analyses using negative values, qualitatively obtaining the same results (not shown).

2.5. Statistical Analyses

For each pollination experiment (OP, WP, CP, SP and SF), we calculated the mean fruit set. Since some treatments were paired and others were not (see Section 2.3), no formal statistical test were performed to examine whether the treatments differed in mean fruit set.
To test the effect of the different forest parameters on pollinator visitation rate, linear regressions were made between all forest parameters (proportion of evergreen forest within 1, 5 and 10 km radius as well as distance to nearest forest patch) and the different visitation rates (all pollinators, wild pollinators, all bee species, wild bee species). The estimated pollinator richness at each study site was calculated using the vegan package version 2.5–6 in R [37] and also regressed against all forest parameters. Finally, we regressed the average additional fruit set with pollinators against the forest parameters. Since data is an average of proportions, we may assume the six averages follow a normal distribution following the central limit theorem (CLT) [38]. To test if the residuals were normally distributed, a QQ plot for the residuals were performed for each regression using the stats package in R [39]. For all regressions, we report the R2 values and the significance level of the regressions (Table 2). Regressions between different visitation rates and the proportion of evergreen forest within the three radiuses were plotted with the corresponding confidence interval using ggplot2 in R [40]. All analyses were conducted using R 3.6.3 [39].

3. Results

3.1. Floral Morphology

Guava trees have 1–3 flowers in each inflorescence (Figure 1). Floral corolla width was measured to be 47.63 ± 4.17 mm (mean ± SD; n = 10) and consist of 5–6 white and scentless petals. Flowers are hermaphrodite and contain one light-green stigma and an estimated 621.50 ± 62.06 (mean ± SD; n = 10) anthers with an average max length of 15.33 ± 1.56 mm (mean ± SD; n = 7). Flowers have little or no nectar (no nectar was detected in the field in this study) but we observed large amounts of pollen on each anther.

3.2. Pollination Experiments

P. guajava set fruit in all pollinator experiments. Initial fruit set ranged from 69% in open pollination (OP), 70% in pollination by wind alone (WP), 76% in cross pollination (CP) to 78% and 96% in self-pollination within same flower (SF) and same tree (SP), respectably (Figure 2).

3.3. Pollinator Visitation Rate and Richness in Relation to Forest

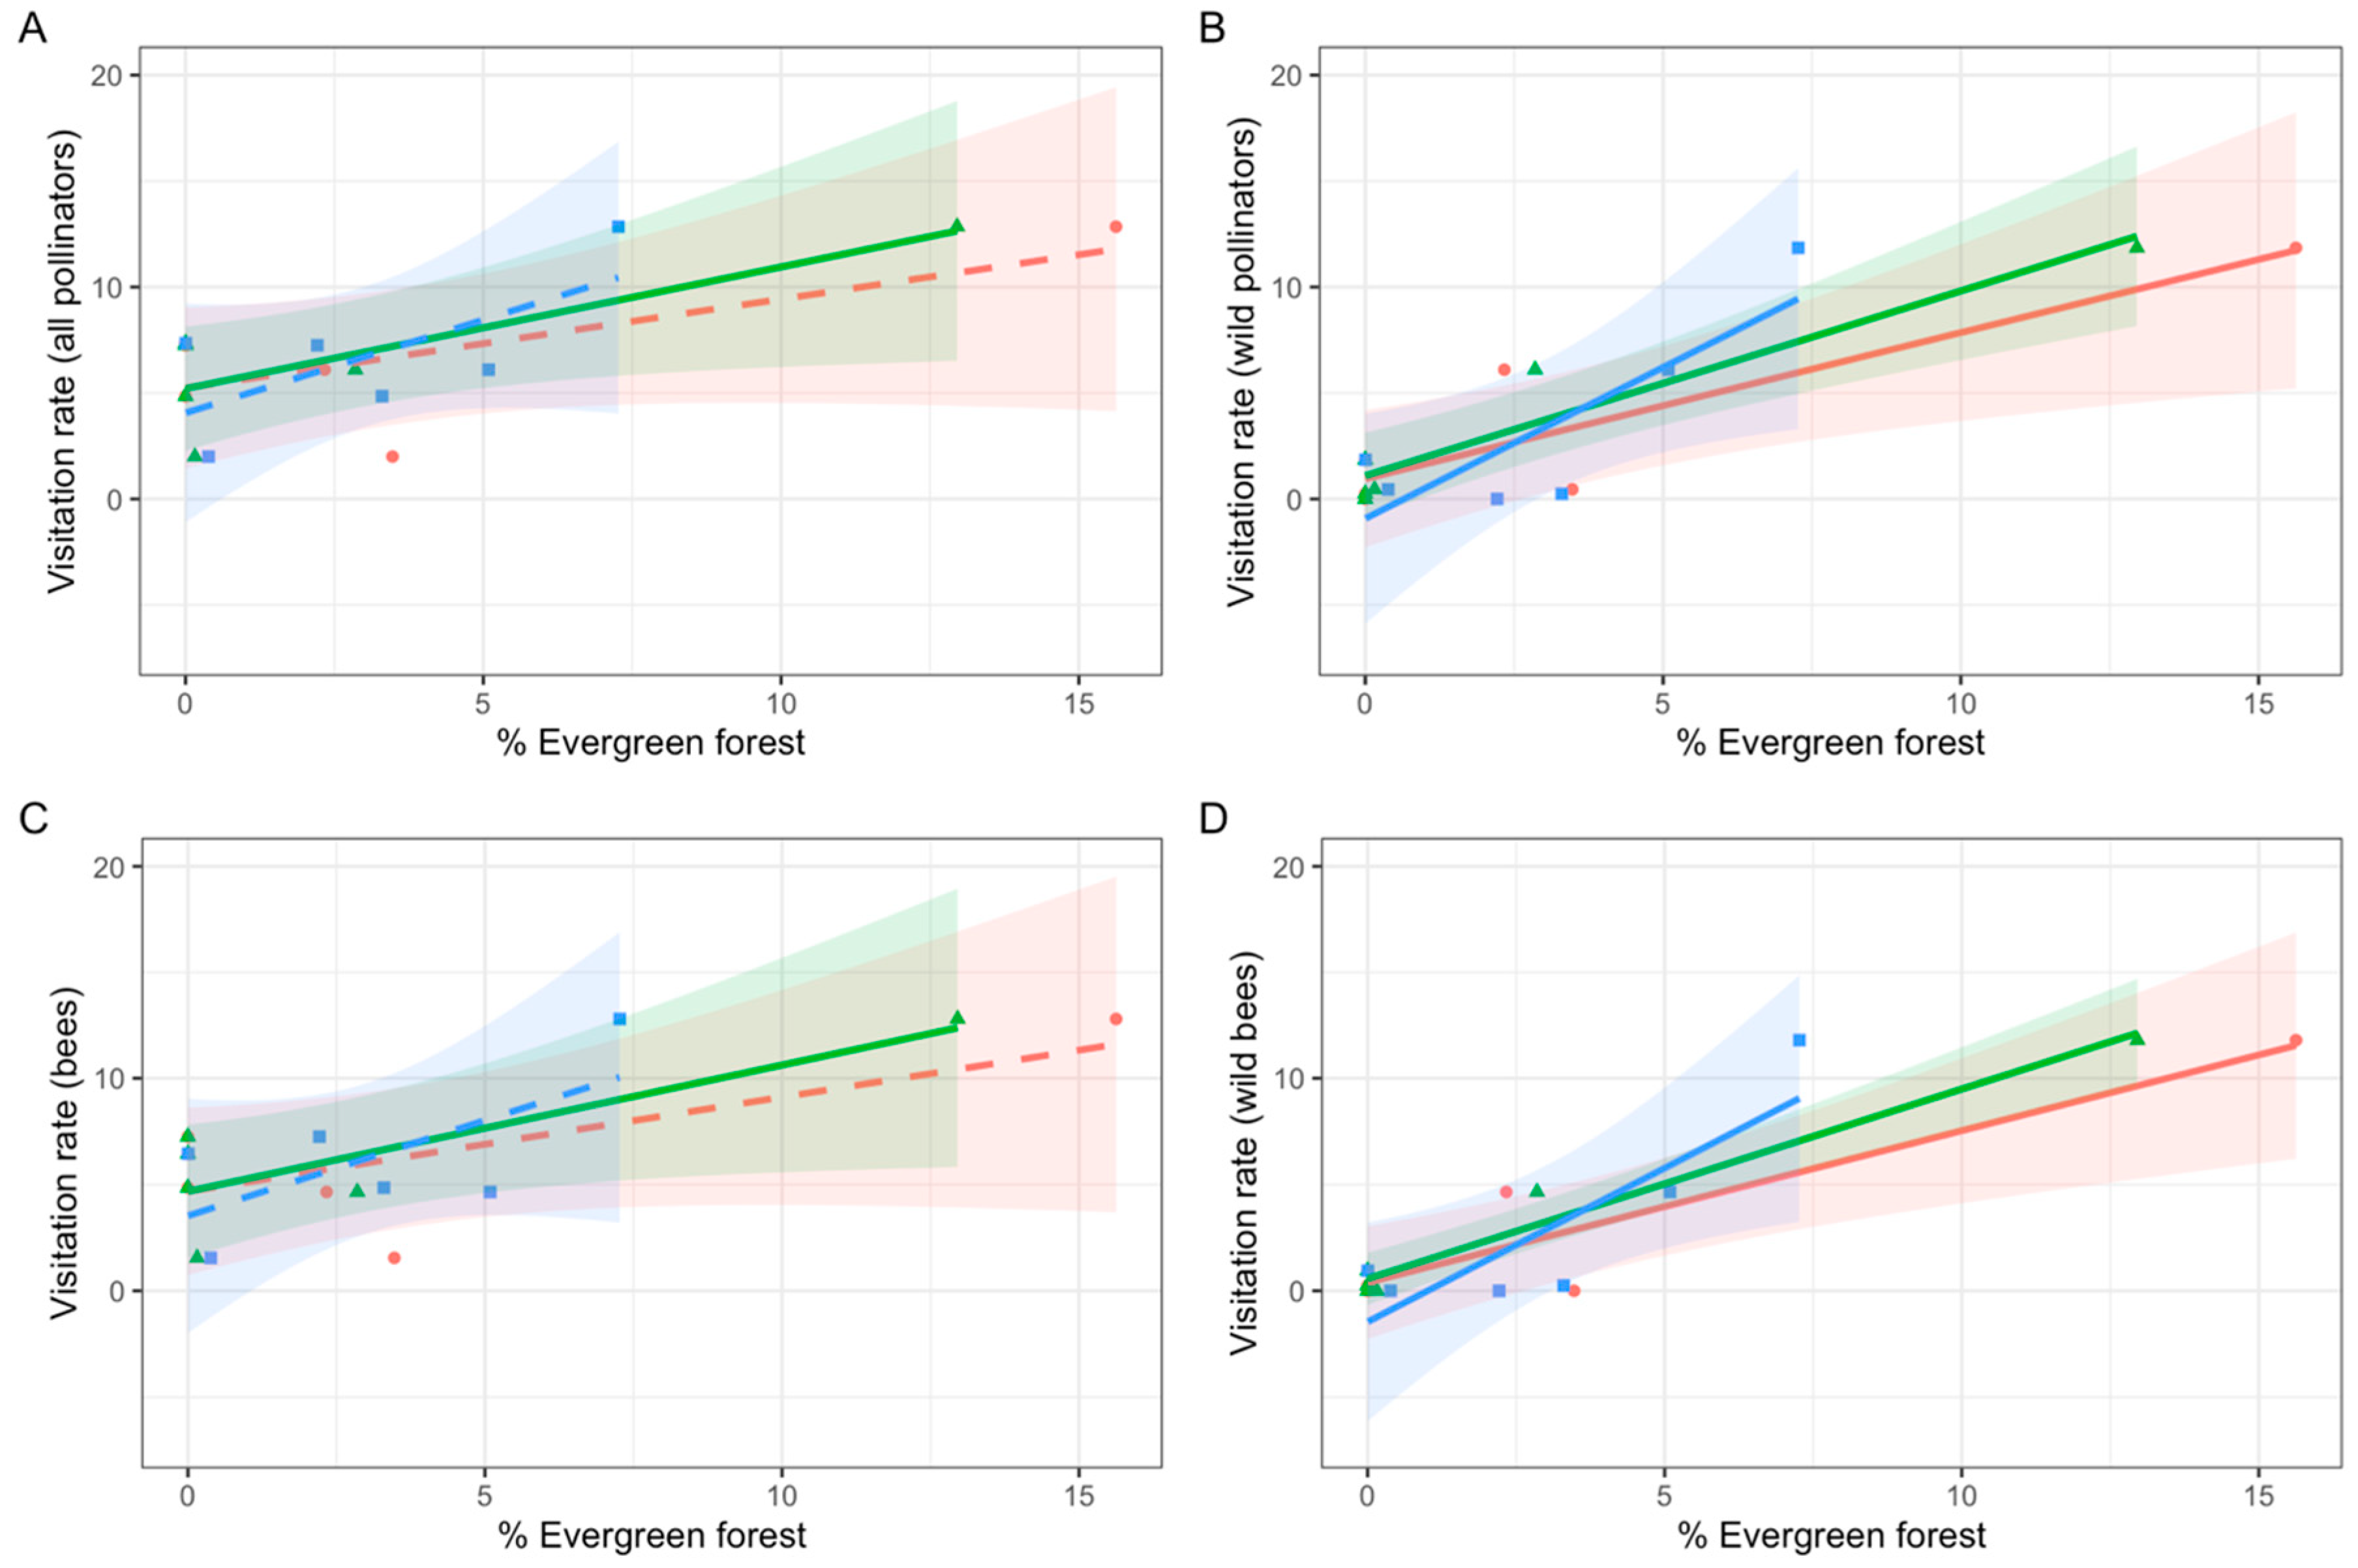
In total, 26 pollinating species and 498 individuals were observed visiting guava flowers within the total observation time of 1200 min for all sites (pooling visitation and richness periods). Bees were the dominant taxonomic group representing 89% of the observed individuals, 39% being A. cerana and 37% various species of stingless bees. Carpenter bees constituted 4%, other bee species 5%, flies 8%, beetles 2% and ants 1% of all observed individuals. One wasp was observed touching a flower during the entire time period. A complete species list can be viewed in Table A1, Appendix A. The average visitation rate of pollinators was closely related to the proportion of evergreen forest in the surrounding landscape within a 1, 5 and 10 km radius (Table 2, Figure 3). The visitation rate of wild pollinators and wild bees had the strongest association to forest (72% < R2 < 97%), whereas all pollinators and all bees including managed honey bees were less strongly associated to forest (34% < R2 < 68%). Pollinator richness was not associated to the proportion of evergreen forest (Table 2). Distance to forest showed no significant impact on either visitation rate or richness of pollinators (Table 2).

3.4. Fruit Set in Relation to Pollinators and Forest

An average of the additional fruit set of guava with pollinators were calculated for each study site. This additional fruit set with pollinators ranged from 0% to 12% and had a mean ± SD of 4.67 ± 4.50%. Landscape effects had no significant impact on additional fruit set with pollinators (p > 0.05). Likewise, pollinator visitation rates and richness were not associated to fruit set (p > 0.05; Table 2).

4. Discussion

In guava orchards in Southern Thailand, we found a significant correlation between the proportion of evergreen forest in the surrounding landscape and the visitation rate of insect pollinators on guava flowers (Table 2; Figure 3). On the other hand and contrary to similar studies on other crops, the proximity of forest showed no significant relationship with visitation rate within the guava orchards [8,17,18,22]. Moreover, neither pollinator richness nor fruit set were associated to the distance to forest nor the amount of forest in the surrounding landscape. These results indicate that although deforestation negatively impact pollinator communities, this does not necessarily cause a lower fruit set of crops on farmland embedded within degraded landscapes.
The reason for this lack of effect of deforestation on guava fruit set is underscored by the finding that additional fruit set of guava due to pollinators (i.e., open vs. closed pollination) showed no relationship with either visitation rate or with richness of pollinators. Results also showed that wind pollination and self-pollination of guava flowers seem to have a greater influence on fruit set than originally anticipated (Figure 2). It has been unclear from previous studies if guava is mainly pollinated by insects or self-pollinating but self-pollination within the same flower was believed to be uncommon due to the stigma being higher than the central anthers [26,32,34,41]. Our results show that self-pollination may be the most common pollination strategy in guava, more so than previously thought, which may be the reason fruit set was not related to landscape-level amount of forest and insect visitation. Moreover, fruit set is not only dependent on pollinators, other factors such as local management and seasonality (wet or dry season) might also have a large impact on fruit set [42]. Some local farmers were reporting that insufficient or excess water supply may cause fruit abortion of guava [43], which may have obscured any potential effect of the amount of forest in the surrounding landscape on pollination of guava.
The landscape-level effects of forest had stronger associations with visitation rates of wild pollinators and wild bees (both without A. cerana) than visitation rates including A. cerana (Table 2). This could be due to the fact that many farms provided nesting-boxes in or close by the orchard to attract A. cerana, diminishing the relevance of forest fragments as nesting areas. Pollination of wild bee species has proved to increase both yield and quality in different crops, making wild bees just as or even more important, than managed bees such as A. cerana [23]. Moreover, dependence on a single species for pollination can prove to be risky, if this species is declining due to parasites, pathogens or other factors [23,44]. For instance, large fluctuations in the abundance of the managed honey bee A. mellifera has been observed on coffee farms in Costa Rica [18] and in America a major threat is the colony collapse disorder (CCD), a still unsolved mystery of empty beehives [45]. Thus, pollination solely depending on pollinators from managed beehives might be less resilient to external factors such as disease [44]. Therefore, long-term it would be preferable to rely on a diverse fauna of wild pollinators with high redundancy of pollination services, making it important to sustain the forest left in southern Thailand.
The proportion of evergreen forest sites was, in general, relatively low for all study sites (<16%). Instead the sites were surrounded by high proportions of other agricultural areas or, mostly, rubber plantations that accounted for 37 to 95% of the surrounding landscape. Natural habitat such as forest is known to have a positive impact on pollination visitation rate, mainly because many bee species make nests in forest areas [17,18,20,21,22]. Most frequent pollinating species in this study were bees (89%) and, specifically, 37% of all visiting pollinators were stingless bees (Figure 1). Tropical forest can act as a reservoir for stingless bees for pollinating crops, given that the orchard is within the bee’s forage range [21]. The forage range of stingless bees are believed to be closely related to their body size, ranging between 500 and 2000 m [21]. Only three out of six study sites were this close to evergreen forest and stingless bees were observed in all of them (Table 1, Table A1 Appendix A). In the three study sites further away from evergreen forest (5475 to 8675 m), no stingless bees were observed, only visits from A. cerana and two species of large carpenter bees—Xylocopa (Mesotrichia) latipes cf. (Drury, 1773) and Xylocopa (Koptortosoma) aestuans (Latreille, 1802) both member of the family Apidae. Members of the Xylocopa genus have been known to forage over greater distances allowing them to search for resources far away from their nesting area [46]. At the guava orchards, Xylocopa bees were observed to forage by making short visits to individual flowers and visiting numerous flowers in one feeding bout, whereas stingless bees often visited only one or few flowers within the same guava plants. It is therefore likely that Xylocopa bees are more effective pollinators of guava flowers than are stingless bees, which may also partly explain why overall pollinator visitation rates and landscape characteristics do not predict fruit set in our study [43].
We note that the proportion of forest and visitation rate showed a significant positive relationship not only at short distance but even at a 5 and 10 km radius from the study site, that is, much further distances than most bees and other insect pollinators are travelling to forage. This may indicate that larger patches of forest fragments even beyond the forage range of pollinators is indirectly beneficial for sustaining pollinator abundances. It is well established that habitat loss and fragmentation are some of the main drivers of the ongoing global pollinator decline, having a negative effect on species richness and abundance, with larger suitable habitat being important for sustaining pollinator robustness [15,47]. Areas with intermediate levels of disturbance, such as tree gardens, plantations, smaller forest fragments and undeveloped urban areas in the tropics might be able to function as micro-habitats and support pollinating species [15,47,48]. A theory might be that larger forest fragments work as a ‘source’ and support the abundance of a species in areas closer to the guava fields.
Taken together, the findings in this study underlines the importance of natural habitat to sustain pollinator communities but illustrates that crop fruit set does not necessarily diminish on farmland surrounded by little natural habitat. We note that all our study sites were in fairly degraded landscapes (<16% forest cover). As for biodiversity in general [49,50], it is possible that native pollinator richness and their services would have been higher in landscapes with higher cover of natural habitat. Future studies should thus aim at including farms embedded within more pristine landscapes. Landscape degradation continues to occur at an alarming rate, especially in many tropical regions, making it crucial that we invest in understating its impact on plants, pollinators and their interactions. Thus, more research is needed to better understand pollinator-crop relationships and the importance of natural habitat to sustain pollinator services and crop production in the future.

Supplementary Files

Supplementary File 1

Author Contributions

Conceptualization, K.H., T.S., S.B., B.I.S., N.S. and B.D.; Data curation, K.H. and T.S.; Formal analysis, K.H. and T.S.; Funding acquisition, K.H.; Investigation, K.H. and T.S.; Methodology, K.H., T.S., N.S. and B.D.; Project administration, K.H., T.S., S.B., N.S. and B.D.; Resources, K.H., S.B. and B.D.; Supervision, T.S., S.B., N.S. and B.D.; Visualization, K.H.; Writing—Original draft, K.H.; Writing—Review & editing, T.S., S.B., B.I.S., N.S. and B.D. All authors have read and agreed to the published version of the manuscript.

Funding

The fieldwork in this project was funded by; SCIENCE grants: Henrik Tofte Jacobsen′s Grant, 15000 DKK, William Demant Fonden, 8500 DKK and Knud Højgaards Fond, 13000 DKK. B.I.S was supported by a Royal Commission for the Exhibition of 1851 Research Fellowship.

Acknowledgments

We thank all the guava farmers in Songkhla and Phattalung that allowed us to conduct fieldwork in their orchards. We are grateful for the help and assistance with identifying my bee specimens provided by Natapot Warrit and his student from the bee lab at the Chulalongkorn University, Bangkok. This project could not have been done without the hard work, dedication and translation provided by field assistant Piyaporn Suksai. A big thanks go to her and her family for their help and for providing accommodation during fieldwork in Phattalung. Also thanks to Helle Sørensen for statistical advice.

Conflicts of Interest

The authors declare no conflict of interest. The funders had no role in the design of the study; in the collection, analyses or interpretation of data; in the writing of the manuscript or in the decision to publish the results.

Appendix A

Table A1. Complete list of all species observed in the six guava orchards. Identified down to lowest possible taxonomic level.
SpeciesIndividuals Observed (Total)Study Sites
Bees (Anthophila)Anthophila sp. 134
Nomia (Acunomia) strigata♀54
Braunsapis cupulifera cf. 74
Ceratina (ceratinidia) nigrolateralis♀104
ApisApis cerana1961, 2, 3, 5, 6
Apis dorcata11
Apis florana21
Carpenter beess (Xylocopa)Xylocopa (Koptortosoma) aestuans♀142, 3, 4
Xylocopa (Mesotrichia) latipes cf. 43
Geniotrigona thoracica141
Stingless bees(Meliponines) Heterotrigona itama1451, 4
Tetragonula (laeviceps gr.)321, 2, 4
Tetragonula (pagdeni gr.)11
Tetragonula sp. 64
Meliponines sp.11
Wasps (Vespidae)Vespa Affinis11
Beetles (Coleoptera)Coleoptera sp. 125
Coleoptera sp. 275
Coleoptera sp. 315
Flies (Diptera)Diptera sp. 1194
Diptera sp. 224
Diptera sp. 334
Diptera sp. 4152
Ants (Formicidae)Formicidae sp. 145
Formicidae sp. 224
Formicidae sp. 315

References

  1. Rech, A.R.; Dalsgaard, B.; Sandel, B.; Sonne, J.; Svenning, J.C.; Holmes, N.; Ollerton, J. The macroecology of animal versus wind pollination: Ecological factors are more important than historical climate stability. Plant Ecol. Divers. 2016, 9, 253–262. [Google Scholar] [CrossRef]
  2. Ollerton, J.; Winfree, R.; Tarrant, S. How many flowering plants are pollinated by animals? Oikos 2011, 120, 321–326. [Google Scholar] [CrossRef]
  3. Ollerton, J. Pollinator diversity: Distribution, ecological function, and conservation. Annu. Rev. Ecol. Evol. Syst. 2017, 48, 353–376. [Google Scholar] [CrossRef] [Green Version]
  4. Bawa, K. Plant-pollinator interactions in tropical rain forests. Annu. Rev. Ecol. Evol. 1990, 21, 399–422. [Google Scholar] [CrossRef]
  5. Potts, S.G.; Imperatriz-Fonseca, V.; Ngo, H.; Biesmeijer, J.C.; Breeze, T.; Dicks, L.; Garibaldi, L.; Settele, J.; Vanbergen, A.J.; Aizen, M.A.; et al. Summary for Policymakers of the Assessment Report of the Intergovernmental Science-Policy Platform on Biodiversity and Ecosystem Services (IPBES) on Pollinators, Pollination and Food Production; Secretariat of the Intergovernmental Science-Policy Platform on Biodiversity and Ecosystem Services: Bonn, Germany, 2016; ISBN 978-92-807-3568-0. [Google Scholar]
  6. Daily, G.C. Nature’s Services; Island Press: Washington, DC, USA, 1997; Volume 3. [Google Scholar]
  7. Allen-Wardell, G.; Bernhardt, P.; Bitner, R.; Burquez, A.; Buchmann, S.; Cane, J.; Cox, P.A.; Dalton, V.; Feinsinger, P.; Ingram, M.; et al. The potential consequences of pollinator declines on the conservation of biodiversity and stability of food crop yields. Conserv. Biol. 1998, 12, 8–17. [Google Scholar] [CrossRef]
  8. Klein, A.M.; Vaissière, B.E.; Cane, J.H.; Steffan-Dewenter, I.; Cunningham, S.A.; Kremen, C.; Tscharntke, T. Importance of pollinators in changing landscapes for world crops. Proc. R. Soc. B Biol. Sci. 2007, 274, 303–313. [Google Scholar] [CrossRef] [PubMed] [Green Version]
  9. Roubik, D.W. Pollination of Cultivated Plants in the Tropics; Food and Agriculture Organization of the United Nations (FAO): Rome, Italy, 1995; ISBN 9251036594. [Google Scholar]
  10. Dalsgaard, B. Land-Use and climate impacts on plant–pollinator interactions and pollination services. Diversity 2020, 12, 168. [Google Scholar] [CrossRef]
  11. Biesmeijer, J.C.; Roberts, S.P.M.; Reemer, M.; Ohlemüller, R.; Edwards, M.; Peeters, T.; Schaffers, A.P.; Potts, S.G.; Kleukers, R.; Thomas, C.D.; et al. Parallel declines in pollinators and insect-pollinated plants in Britain and the Netherlands. Science 2006, 313, 351–354. [Google Scholar] [CrossRef]
  12. Ollerton, J.; Erenler, H.; Edwards, M.; Crockett, R. Extinctions of aculeate pollinators in Britain and the role of large-scale agricultural changes. Science 2014, 346, 1360–1362. [Google Scholar] [CrossRef] [Green Version]
  13. Hallmann, C.A.; Sorg, M.; Jongejans, E.; Siepel, H.; Hofland, N.; Schwan, H.; Stenmans, W.; Müller, A.; Sumser, H.; Hörren, T.; et al. More than 75 percent decline over 27 years in total flying insect biomass in protected areas. PLoS ONE 2017, 12, e0185809. [Google Scholar] [CrossRef] [Green Version]
  14. Laurance, W.F. Forest destruction in tropical Asia. Curr. Sci. 2007, 93, 1544–1550. [Google Scholar]
  15. Sritongchuay, T.; Hughes, A.C.; Memmott, J.; Bumrungsri, S. Forest proximity and lowland mosaic increase robustness of tropical pollination networks in mixed fruit orchards. Landsc. Urban Plan. 2019, 192, 103646. [Google Scholar] [CrossRef]
  16. Büchert Lindberg, A.; Mogens Olesen, J. The fragility of extreme specialization: Passiflora mixta and its pollinating hummingbird Ensifera ensifera. J. Trop. Ecol. 2001, 17, 323–329. [Google Scholar] [CrossRef]
  17. Ricketts, T.H.; Daily, G.C.; Ehrlich, P.R.; Michener, C.D. Economic value of tropical forest to coffee production. Proc. Natl. Acad. Sci. USA 2004, 101, 12579–12582. [Google Scholar] [CrossRef] [PubMed] [Green Version]
  18. Ricketts, T.H. Tropical forest fragments enhance pollinator activity in nearby coffee crops. Conserv. Biol. 2004, 18, 1262–1271. [Google Scholar] [CrossRef]
  19. Rathcke, B.J.; Jules, E.S. Habitat fragmentation and plant pollinator interactions. Curr. Sci. 1993, 65, 273–277. [Google Scholar]
  20. Garibaldi, L.A.; Steffan-Dewenter, I.; Kremen, C.; Morales, J.M.; Bommarco, R.; Cunningham, S.A.; Carvalheiro, L.G.; Chacoff, N.P.; Dudenhöffer, J.H.; Greenleaf, S.S.; et al. Stability of pollination services decreases with isolation from natural areas despite honey bee visits. Ecology 2011, 14, 1062–1072. [Google Scholar] [CrossRef]
  21. Blanche, K.R.; Ludwig, J.A.; Cunningham, S.A. Proximity to rainforest enhances pollination and fruit set in orchards. J. Appl. Ecol. 2006, 43, 1182–1187. [Google Scholar] [CrossRef]
  22. Ricketts, T.H.; Regetz, J.; Steffan-Dewenter, I.; Cunningham, S.A.; Kremen, C.; Bogdanski, A.; Gemmill-Herren, B.; Greenleaf, S.S.; Klein, A.M.; Mayfield, M.M.; et al. Landscape effects on crop pollination services: Are there general patterns? Ecol. Lett. 2008, 11, 499–515. [Google Scholar] [CrossRef]
  23. Garibaldi, L.A.; Steffan-Dewenter, I.; Winfree, R.; Aizen, M.A.; Bommarco, R.; Cunningham, S.A.; Kremen, C.; Carvalheiro, L.G.; Harder, L.D.; Afik, O.; et al. Wild pollinators enhance fruit set of crops regardless of honey bee abundance. Science 2013, 340, 1608–1611. [Google Scholar] [CrossRef]
  24. Aizen, M.A.; Garibaldi, L.A.; Cunningham, S.A.; Klein, A.M. How much does agriculture depend on pollinators? Lessons from long-term trends in crop production. Ann. Bot. 2009, 103, 1579–1588. [Google Scholar] [CrossRef] [PubMed]
  25. Tylianakis, J.M.; Didham, R.K.; Bascompte, J.; Wardle, D.A. Global change and species interactions in terrestrial ecosystems. Ecol. Lett. 2008, 11, 1351–1363. [Google Scholar] [CrossRef] [PubMed]
  26. Pommer, C.V.; Murakami, K.R.N. Breeding guava (Psidium guajava L.). In Breeding Plantation Tree Crops: Tropical Species; Jain, S.M., Priyadarshan, P.M., Eds.; Springer: New York, NY, USA, 2009; pp. 83–120. ISBN 9780387712017. [Google Scholar]
  27. Salazar, D.M.; Melgarejo, P.; Martínez, R.; Martínez, J.J.; Hernández, F.; Burguera, M. Phenological stages of the guava tree (Psidium guajava L.). Sci. Hortic. 2006, 108, 157–161. [Google Scholar] [CrossRef]
  28. Morton, J.F.; Dowling, C.F. Fruits of Warm Climates, Pomegranate; JF Morton: Miami, FL, USA, 1987; ISBN 0-9610184-1-0. [Google Scholar]
  29. Altendorf, S. Minor Tropical Fruits: Mainstreaming a Niche Market; Food and Agriculture Organization of the United Nations (FAO): Rome, Italy, 2018; Available online: http://www.fao.org/fileadmin/templates/est/COMM_MARKETS_MONITORING/Tropical_Fruits/Documents/Minor_Tropical_Fruits_FoodOutlook_1_2018.pdf (accessed on 13 May 2020).
  30. Food and Agriculture Organization of the United Nations (FAO). Food Outlook: Biannual Report on Global Food Markets; Global Information and Early Warning System on Food and Agriculture: Rome, Italy, 2017; Available online: http://www.fao.org/3/a-i7343e.pdf (accessed on 13 May 2020).
  31. Kadam, D.M.; Kaushik, P.; Kumar, R. Evaluation of guava products quality. Int. J. Food Sci. Nutr. Eng. 2012, 2012, 7–11. [Google Scholar] [CrossRef]
  32. Singh, R.; Sehgal, O. Studies on the blossom-biology of Psidium guajava L. (Guava) II. pollen studies, stigmatal receptivity, pollination and fruit-set. Indian J. Hortic. 1968, 25, 52–59. [Google Scholar]
  33. Thanarut, C.; Ko, J.-C. Guava, wax apple, sugar apple and pineapple productions in Thailand. Acta Hortic. 2017, 1166, 7–14. [Google Scholar] [CrossRef]
  34. Mitra, S.K.; Thingreingam Irenaeus, K.S. Guava cultivars of the world. Acta Hortic. 2018, 1205, 905–910. [Google Scholar] [CrossRef]
  35. Land Development Department. GIS Data on Land Use Resources. Available online: http://www.ldd.go.th/www/lek_web/web.jsp?id=18907 (accessed on 29 May 2020).
  36. Klein, A.-M.; Steffan-Dewenter, I.; Tscharntke, T. Bee pollination and fruit set of coffea arabica and C. canephora (Rubiaceae). Am. J. Bot. 2003, 90, 153–157. [Google Scholar] [CrossRef] [Green Version]
  37. Oksanen, J.; Blanchet, F.G.; Friendly, M.; Kindt, R.; Legendre, P.; McGlinn, D.; Minchin, P.R.; O’Hara, R.B.; Simpson, G.L.; Solymos, P.; et al. Package ‘vegan’Community Ecology Package. R Package Version 2.5-6. 2019. Available online: https://cran.r-project.org/web/packages/vegan/vegan.pdf (accessed on 12 May 2020).
  38. Ekstrøm, C.T.; Sørensen, H. Introduction to Statistical Data Analysis for the Life Sciences; CRC Press: Boca Raton, FL, USA, 2014; ISBN 9781439894866. [Google Scholar]
  39. R Core Team. R: A language and environment for Statistical Computing; R Foundation for Statistical Computing: Vienna, Austria, 2020. [Google Scholar]
  40. Hadley, W. Ggplot2: Elegant Graphics for Data Analysis; Springer: Houston, TA, USA, 2016. [Google Scholar]
  41. Alves, J.E.; Freitas, B.M. Foraging behavior and pollination efficiency of five bee species on guava (Psidiumguajava L.) flowers. Rev. Ciência Agronômica 2008, 37, 216. [Google Scholar]
  42. Tangtorwongsakul, P.; Warrit, N.; Gale, G.A. Effects of landscape cover and local habitat characteristics on visiting bees in tropical orchards. Agric. For. Entomol. 2018, 20, 28–40. [Google Scholar] [CrossRef]
  43. Hansen, K.; University of Copenhagen, Copenhagen, Denmark. Personal Communication, 2020.
  44. Winfree, R.; Williams, N.M.; Dushoff, J.; Kremen, C. Native bees provide insurance against ongoing honey bee losses. Ecol. Lett. 2007, 10, 1105–1113. [Google Scholar] [CrossRef] [PubMed]
  45. Stokstad, E. The case of the empty hives. Science 2007, 316, 970–972. [Google Scholar] [CrossRef] [PubMed]
  46. Zurbuchen, A.; Landert, L.; Klaiber, J.; Müller, A.; Hein, S.; Dorn, S. Maximum foraging ranges in solitary bees: Only few individuals have the capability to cover long foraging distances. Biol. Conserv. 2010, 143, 669–676. [Google Scholar] [CrossRef]
  47. Potts, S.G.; Biesmeijer, J.C.; Kremen, C.; Neumann, P.; Schweiger, O.; Kunin, W.E. Global pollinator declines: Trends, impacts and drivers. Trends Ecol. Evol. 2010, 25, 345–353. [Google Scholar] [CrossRef]
  48. Nascimento, V.T.; Agostini, K.; Souza, C.S.; Maruyama, P.K. Tropical urban areas support highly diverse plant-pollinator interactions: An assessment from Brazil. Landsc. Urban Plan. 2020, 198, 103801. [Google Scholar] [CrossRef]
  49. Mariana Morais, V.; Cristina, B.; Leandro Reverberi, T.; Érica, H.; Pedro Ferreira, D.; Wesley Rodrigues, S.; Paulo Roberto, G.; Jean Paul, M. Predicting the non-linear collapse of plant–frugivore networks due to habitat loss. Ecography 2019, 42, 1765–1776. [Google Scholar] [CrossRef] [Green Version]
  50. Melo, I.; Ochoa-Quintero, J.M.; Oliveira Roque, F.; Dalsgaard, B. A review of threshold responses of birds to landscape changes across the world. J. Field Ornithol. 2018, 89, 303–314. [Google Scholar] [CrossRef]
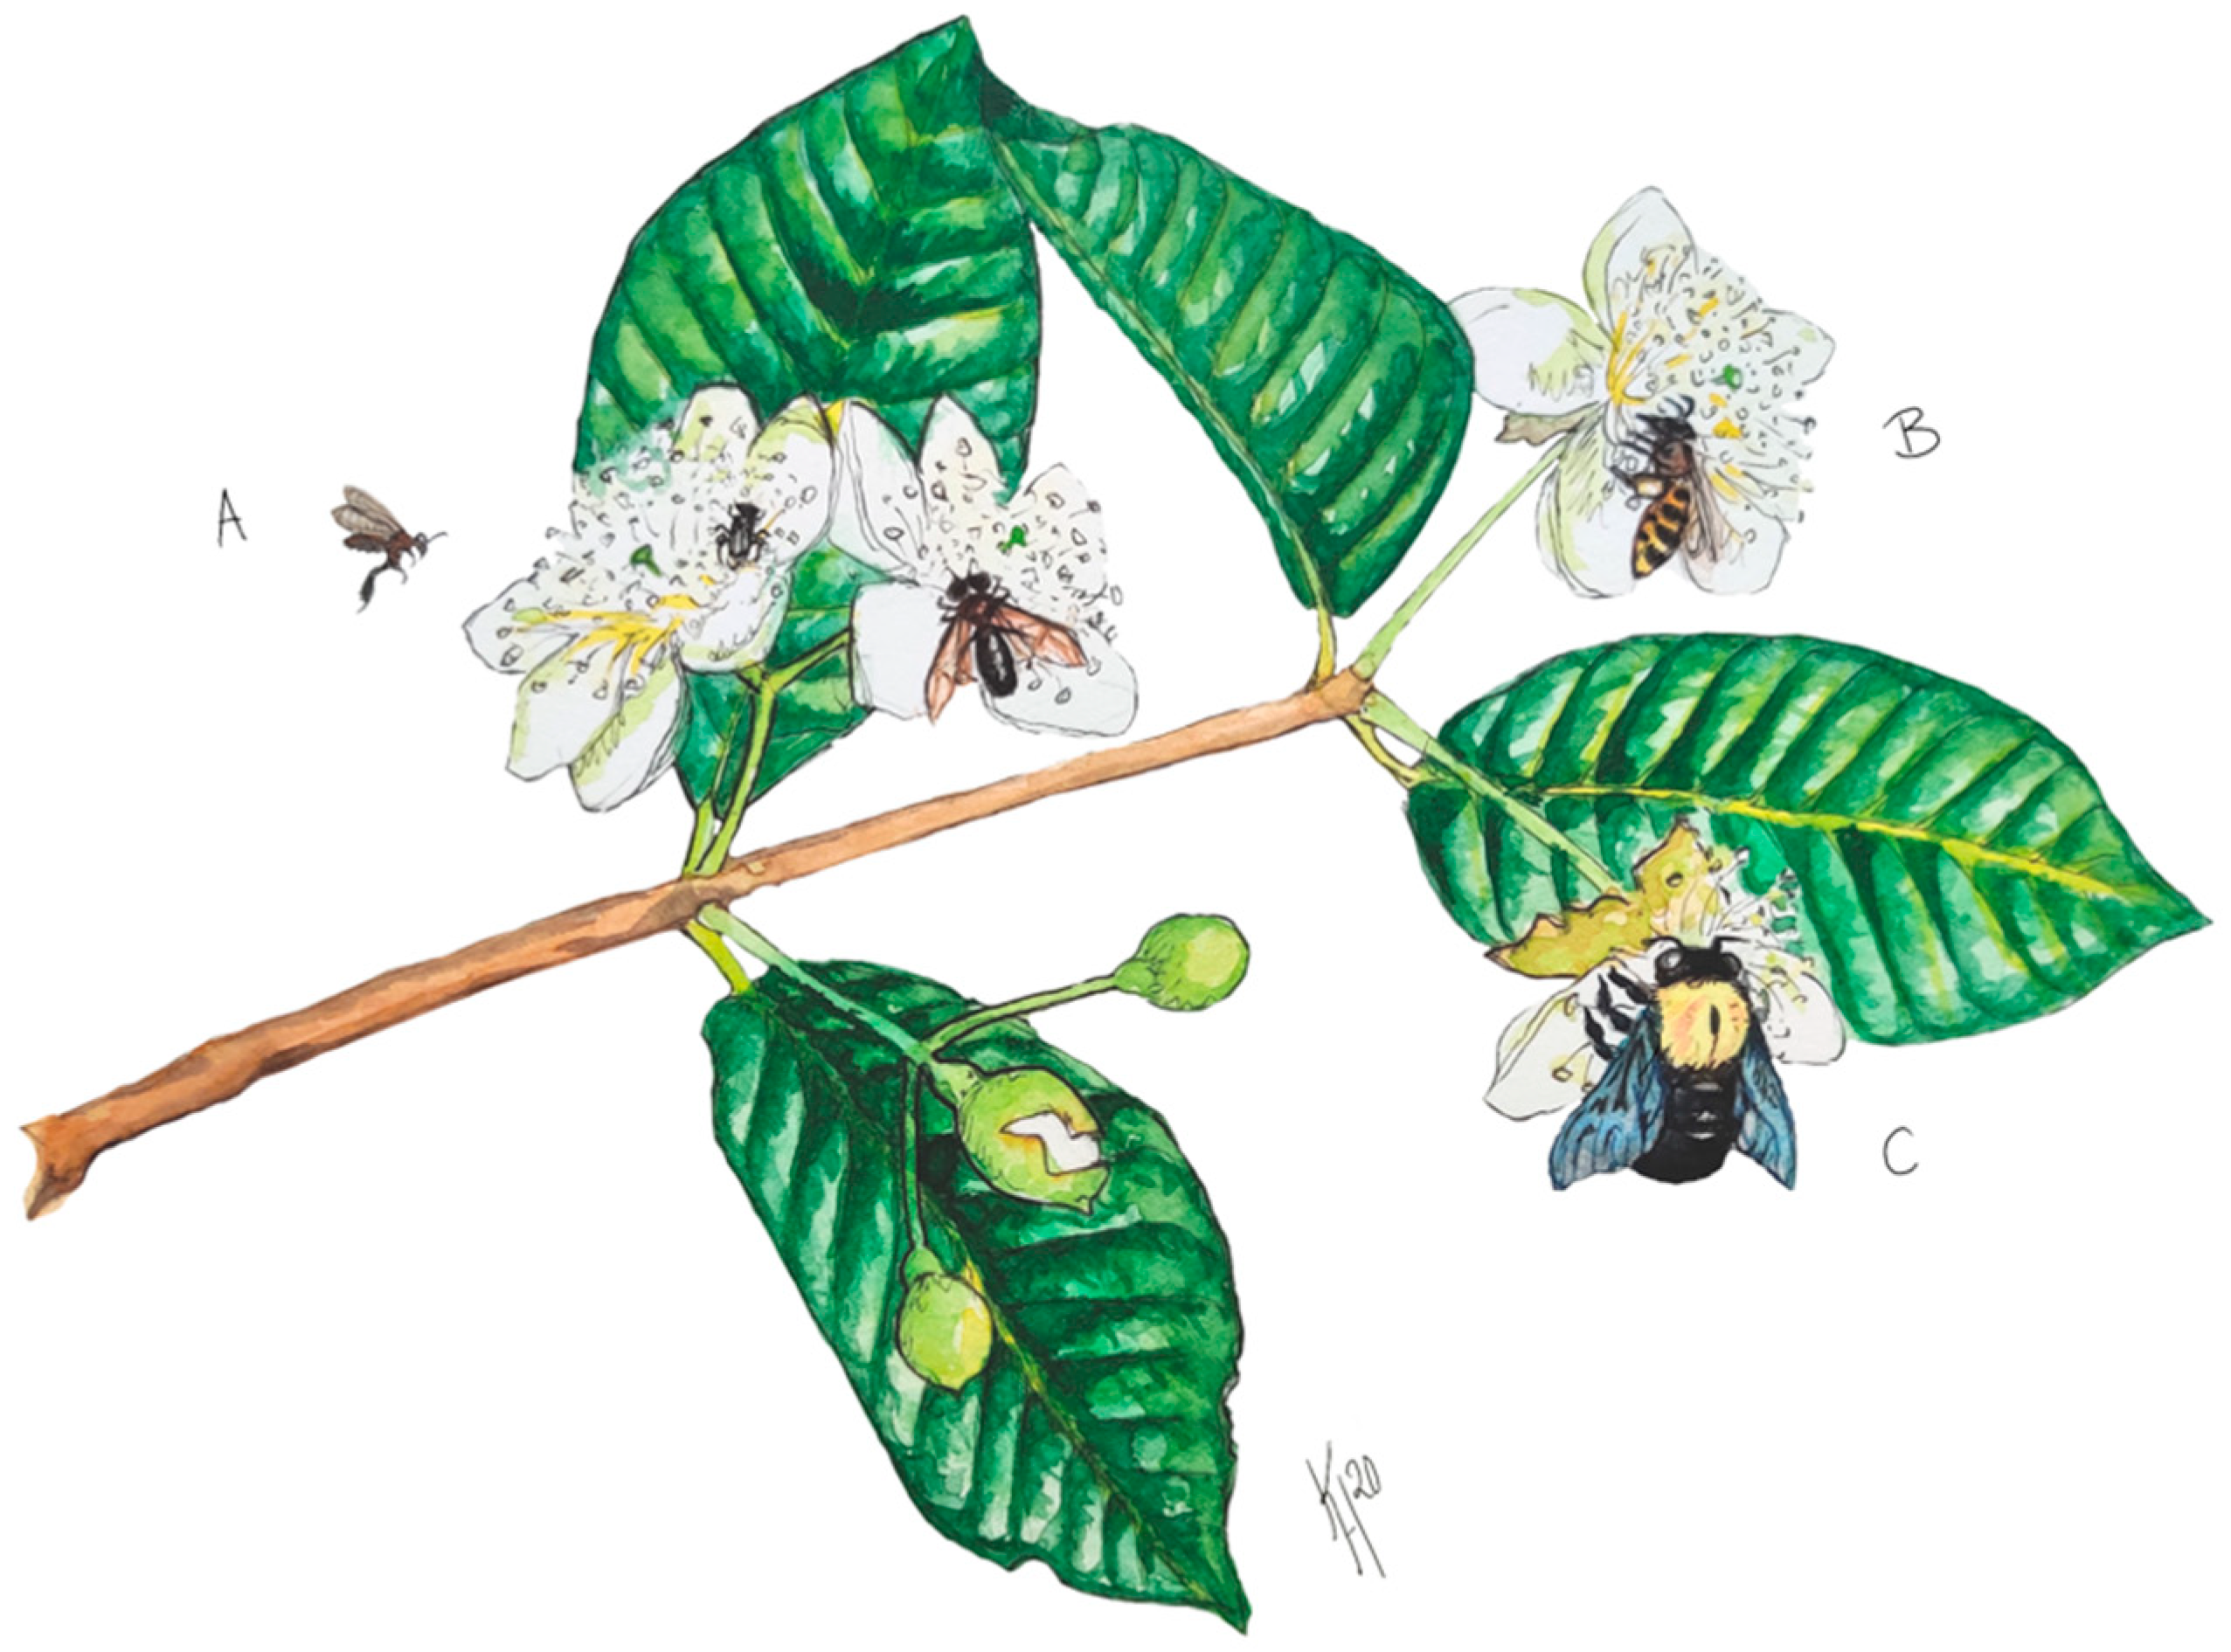
Figure 1. Illustration of guava flowers at different stages (bud, cracked bud and open flower) and the most important pollinators: (A) Three species of stingless bee, from left; Heterogona itama, Tetragonula laeviceps and Geniotrigona thoracica. (B) Asian honey bee Apis cerana. (C) Carpenter bee Xylocopa (Koptortosoma) aestuans.
Diversity 12 00259 g001
Figure 2. Initial fruit set (% fruit set 3 weeks after blooming) of Psidium guajava L. of five pollination treatments. The treatments were conducted on ten trees on one farm (Farm 6, see Table 1), showing the average fruit set of five flower buds pr. tree (a total of 50 flower buds pr. treatment). OP, Open pollination (n = 20 trees); WP, Wind pollination (n = 10); CP, Cross pollination between plants (n = 10); SP, Self-pollination within same tree (n = 10); SF, Self-pollination within same flower (n = 10).
Diversity 12 00259 g002
Figure 3. Visitation rate (visits/flower/15 min) in relation to the percentage of evergreen forest within a 1, 5 and 10 km radius from each study site: red circle = 1 km, green triangle = 5 km and blue square = 10 km and for four measures of visitation rate: (A) Visitation rate of all pollinators, (B) Visitation rate of wild pollinators, (C) Visitation rate of bees and (D) Visitation rate of wild bees. All regressions are printed with 95% corresponding confidence intervals. Solid lines indicate significant associations (p < 0.05), whereas dashed lines indicated non-significant relationships (p > 0.05). For statistics, see Table 2.
Diversity 12 00259 g003
Table 1. Study site overview. General information about study sites (location, size, number and age of guava tress) and forest parameters (Distance to closest evergreen forest patch and % evergreen forest within a radius of 1, 5 and 10 km from the study site).
Study Sites InformationEvergreen Forest Parameters
SiteLatitudeLongitudeSize (ha)No. TreesAge Trees
(Years)
Distance (m)1 km (%)5 km (%)10 km (%)
16.989000100.6166111.615004–5 37115.6312.967.27
27.035883100.2802832.810002–4 7520.000.000.00
37.048433100.4491332.38395 5475003.30
46.908079100.5023390.450027702.332.855.09
57.555000100.1304331.6998386763.470.160.39
67.87381799.8857330.52163.57070002.21
Table 2. Linear regression models of pollinator visitation rates (VR) (visits/flower/15 min), richness and additional fruit set with pollinators as a function of four measures of evergreen forest effect: % of evergreen forest in the surrounding landscape within different distances to the study site (1, 5 and 10 km) and the distance to nearest forest patch from each study site (in meter). For each model, we also report the coefficient of determination (R2) and the regression coefficients with standard error. NS p > 0.05, * p < 0.05, ** p < 0.01.
DependentIndependentR2Regression Coefficients
Visitation rateForest
All1000 m (%)0.510.42 (0.21) NS
5000 m (%)0.680.57 (0.20) *
10,000 m (%)0.470.88 (0.47) NS
Distance (m)0.48−6.7·10−4 (3.5·10−4) NS
Wild pollinators1000 m (%)0.790.69 (0.18) *
5000 m (%)0.910.87 (0.14) **
10,000 m (%)0.721.43 (0.45) *
Distance (m)0.53−9.4·10−4 (4.4·10−4) NS
All bees 1000 m (%)0.520.44 (0.21) NS
5000 m (%)0.670.59 (0.21) *
10,000 m (%)0.450.90 (0.50) NS
Distance (m)0.34−6.0·10−4 (4.2·10−4) NS
Wild bees1000 m (%)0.860.71 (0.14) **
5000 m (%)0.970.90 (0.08) **
10,000 m (%)0.741.45 (0.42) *
Distance (m)0.45−8.6·10−4 (4.7·10−4) NS
Estimated richness1000 m (%)0.270.35 (0.29) NS
5000 m (%)0.310.44 (0.33) NS
10,000 m (%)0.370.88 (0.58) NS
Distance (m)0.34−6.5·10−4 (4.5·10−4) NS
Additional initial fruit set1000 m (%)0.39−0.005 (0.003) NS
5000 m (%)0.24−0.004 (0.004) NS
10,000 m (%)0.20−0.007 (0.007) NS
Distance (m)0.35−4.4·10−5 (5.7·10−6) NS
Additional initial fruit setVR and Richness
VR All0.0001−0.0001 (0.006) NS
VR Wild pollinators0.1141−0.0032 (0.004) NS
VR All bees0.0069−0.0010 (0.006) NS
VR Wild bees0.1589−0.0038 (0.004) NS
Richness 0.0765−0.0031 (0.005) NS