Abstract
Ecuador belongs to the group of 17 megadiverse countries on the planet, and the Ecuadorian national system of protected areas covers around 20% of the country’s territory. Despite some initiatives for protected areas management effectiveness evaluation, the information on this matter is scarce and a general overview is missing. In this context, this study aims at investigating problems faced by National Parks in Ecuador and developing a base level management effectiveness evaluation for possible comparative assessments in the future. Focusing on all 12 legally established National Parks, this study used the Management Effectiveness Tracking Tool (METT), an internationally consecrated methodology based on a scorecard questionnaire that includes six elements of management cycle: context, planning, inputs, processes, outputs and outcomes. The questionnaire was applied to Ecuadorian National Parks management teams through face-to-face interviews. The resulted overall management effectiveness indices are between 40.6% and 99.0%. The general condition of biodiversity value was considered as good in line with the legal status and National Parks design but topics related to budget allocation, tourism arrangements, communities and indigenous people received lower scores. The low enforcement emphasis is not necessarily the best way to improve management effectiveness; the identified issues should be addressed by including communities and indigenous people in the decision making and benefits sharing as well as strategic allocation of budgetary resources, with proper adaptation to Natural Parks’ specific conditions.
1. Introduction
It has been widely recognized that protected area (PA) establishment and management constitute the backbone of biodiversity conservation [1]. Consequently, increasing efforts and resources have been invested in establishing PAs, the most widely implemented conservation action [2]. Only in the last decade, the nationally designated PAs total surface has increased from 12% [1] to 15.2% of the global terrestrial surface while 7.4% of marine ecosystems are also designated as PAs [3]. However, PA establishment is not sufficient for addressing the complex direct and indirect anthropogenic threats to biodiversity [4]. PAs need to be effectively managed for achieving the intended biodiversity conservation objectives, it thus being recognized that management effectiveness evaluation (MEE) is essential [5].
Understood as the assessment of how well a PA is being managed—primarily the extent to which it is protecting values and achieving goals and objectives [6]—MEE has been a continuous preoccupation for both scientists and practitioners. Many countries and international organizations have made significant efforts to develop and apply management evaluation methodologies for assessing the effectiveness of PAs, sites and systems [1]. Most of these methodologies relate to the framework for MEE developed by the International Union for Conservation of Nature (IUCN) World Commission on Protected Areas (IUCN-WCPA) [6,7]. The IUCN-WCPA framework groups indicators according to six elements in the management cycle: context, planning, inputs, processes, outputs and outcomes [5]. Some of these methodologies were designed to serve MEE for certain PA categories, for instance, World Heritage sites [8] or marine PAs [9]. There are two methodologies that have been widely recognized and used at an international level [10]: Rapid Assessment and Prioritization of Protected Area Management (RAPPAM) developed by the World Wide Fund for Nature (WWF) [11] and the Management Effectiveness Tracking Tool (METT) developed by Word Bank (WB) and WWF [12]. Although focusing the same key elements of the management cycle, there are differences between the two methods, RAPPAM being aimed primarily at prioritization and resource allocation, while METT is aimed at donor/treasure evaluation [10].
Ecuador belongs to the group of 17 megadiverse countries on the planet, which together contain more than two thirds of all the world’s biodiversity. Ecuador is the smallest in surface in this group, but the country hosts 46 different ecosystems [13], 18% of all species of birds and orchids, 10% of amphibians and 8% of mammals [14]. The impressive biodiversity of Ecuador is due to the location of the country in the tropical zone, the presence of the Andes Mountains and the confluence of marine currents on the coasts. Ecuador started early in biodiversity conservation, specifically in 1936, when Galapagos was declared a PA [15]. Only 30 years later the State proposed the creation of another PA, which corresponds to what is currently the Pululahua Geo-botanical Reserve [15]. For a long period after that, the lack of a proper normative and institutional framework (between 1960 and 1975 the PAs institutional responsibility balanced between the Ministry of Agriculture and the Ministry of Production) determined a low dynamism in the matter of biodiversity conservation. In the 1970s, the Government promoted the establishment of PAs by adopting the Strategy for the conservation of outstanding wild areas of Ecuador [15]. This strategy boosted the processes aimed at consolidating the Ecuadorian national system of protected areas (NSPA) and triggered the establishment of most of the National Parks (NPs). The strategy also established the bases for the promulgation of the Forest and conservation of natural areas and wildlife law in 1981, which, with some amendments, continues to date [15].
Presently, the Ecuadorian NSPA covers around 20% of the country’s territory including a total of 59 PAs [16]: 12 NPs, 5 biological reserves, 1 geo-botanical reserve, 9 ecological reserves, 5 marine reserves, 6 national recreation areas, 10 wildlife refuges, 5 flora and fauna production reserves, 2 ecological areas of conservation, 1 autonomous protected area, 2 community protected areas and 1 private protected area. Biological reserves are the types of PAs with the highest level of restrictions, followed by NPs. In NPs, the level of restriction is also high, the main activities being related with research, environmental monitoring, making the development of tourism feasible as support activity for natural resources conservation. NSPA covers all four geographical regions and all provinces in the country, it extends from 0 to 6700 m above sea level and covers 79% of the plant formations in Ecuadorian territory [16,17]. Protecting valuable forest ecosystems is essential for NSPA: different forest types cover 55% of the country’s territory [17], and there are approximately 10.7 million hectares of diverse forest types including tropical rainforest, dry forest and montane forest.
The Ministry of Environment (ME) is the Ecuadorian state entity responsible for the administration of NSPA through a department destined to manage biodiversity and PAs, having decentralized branches in 10 regions and local administration for each PA [18]. In terms of designing and implementing different PA management evaluation methodologies, Ecuador was among the first countries to design such nationally applicable tools. In 1999, the Ecuadorian Institute of Forest, Natural Areas and Wildlife (Instituto Ecuatoriano Florestal y de Areas Naturales y Vida Silvestre) elaborated the Ecuador MEE—Indicadores para el Monitoreo y Evaluación del Manejo de las Áreas Naturales [19]. The objective of this tool was to evaluate the management of Ecuador NSPA, according to the objectives and planned actions included in 1976 and 1989 country’s conservation strategies [8,19]. Themes, variables and parameters were adjusted to suit the country’s conditions, and indicators were grouped in three major areas: required resources, outcomes achieved in the administration and compliance of objectives, which allowed for the introduction of efficiency and efficacy concepts. The methodology was applied in 1999 in 24 PAs in Ecuador. There was no continuation, although Valarezo et al. [19] recommended follow-up processes to involve all interest groups and further improvements of the methodology for establishing ways to verify information through automatic systems and other available tools such as Geographic Information Systems. It is worth mentioning that the Galapagos National Park Service also designed a PA management evaluation methodology that have been locally used between 1996 and 2004 [20]. There are also other PA management effectiveness surveys in Ecuador since the first implementation of Ecuador MEE in 1999 (Table 1).

Table 1.
Management effectiveness assessments for National Parks (NPs) in Ecuador [21,22,23,24].
The Global Database on PA management evaluation provides information about a total number of 62 assessments implemented until today only 10 of them using METT of which only 3 were implemented in NPs: Cayambe Coca NP in 2005 and 2009, Machalilla NP in 2009 (Table 1). Recently, RAPPAM was used for 36 PAs in south Ecuador, two of them being NPs (Podocarpus and Yacuri); the study results suggest that management effectiveness score is higher when resources are available, regardless of whether these funds come from public or private sources [23].
Despite all the initiatives described above, the information on PA management effectiveness in Ecuador is still scarce and a general overview is missing. Consequently, this study intends to fill this information gap for Ecuadorian NPs. In 2018, using METT developed by WWF and WB, we carried out a survey for all 12 established NPs in Ecuador aimed at developing a base level evaluation for possible comparative evaluations in the future. The objective of the study is to identify problems faced by Ecuador’s NPs system. The results are discussed in national and international contexts, and some conclusive recommendation are formulated. Since the NPs have different objectives and contexts, this study looks to the general trends instead of detailed comparisons among them.
2. Materials and Methods
2.1. Management Effectiveness Tracking Tool
Different sources [10,12] recommend METT as the best toll for tracking progress over time in individual PA or in groups; therefore, it is the most appropriate methodology for fulfilling our aim—developing a base level evaluation for possible comparative evaluations in the future. METT is a rapid assessment based on a scorecard questionnaire that includes all six elements of management cycle identified in the IUCN-WCPA framework, but has a special emphasis on context, planning, inputs and processes [10]. METT was developed to monitor management progress of PAs over time [12] and to promote accountability and transparency [25]. It has been a useful instrument for building a baseline on management effectiveness, for tracking progress over time, for providing critical information about portfolio-wide issues that need to be addressed as a priority and for putting in place a simple monitoring system in sites that do not afford to develop a more detailed monitoring system [26]. METT has been applied extensively [10] as it has been used by the WB, WWF and the Global Environment Facility (GEF) as a mandatory monitoring tool in areas where they have been involved. The Global Database on PA management evaluation provides information regarding a total number of 3184 evaluations using METT [24], all over the world, with numerous Pas having multiple assessments. Initially, the assessments were implemented by Non-Governmental Organizations (NGO), but, in the last decade, increasingly, the assessments have been implemented by local PAs agencies and authorities [25] as a consequence of increasing authority preoccupation but also reflecting the requirements for countries to report to the Convention on Biological Diversity (CBD) on Aichi Target 11 [27,28]. There are also numerous scientific studies that used METT; many of them have a regional or country focus like the ones for China [29], Bhutan [30], Iran [31], the Amazon basin [32], the KwaZulu-Natal region [33], the Carpathian region [34] or Mongolia [35]. There are also scientific studies, based on METT assessments with a global cover: the METT study by Dudley et al. [36], one of the largest single-methodology study, considering 330 sites, revealed that the strongest correlation exists between biodiversity conditions and the following: law enforcement, control of access, resource management, monitoring and evaluation, maintenance of equipment, budget management and the existence of annual work plans. Based on the data collected using METT, many other studies evaluated the way that PA management effectiveness has changed since the METT methodology was first used, concluding that: (i) the assessments provide important data for investigating the overall effectiveness of PAs, including the potential impacts of PAs management interventions on biodiversity outcomes [37]; (ii) the scores for overall METT assessment increased as a consequence of better decision-making arrangements, design and planning for PA management [38]; (iii) despite the development of new assessment needs, especially related to conservation effectiveness [39] or social impact assessment [40], the management-related assessment should continue [41,42], especially to identify changes in time. There are also recognized constraints and weaknesses of METT: it should not be regarded as the sole basis for adaptive management, and should certainly not replace more thorough assessment methods for the purposes of adaptive management [26]; evaluation of outcomes is not detailed [10]; METT relies largely on multiple-choice questions and thus on the opinion of whoever fills in the form; there is also a clear risk of managers providing an overly optimistic picture of the strengths of management [36].
2.2. Study Area
This study includes all 12 NPs in Ecuador’s NSPA (Figure 1). Basic information about the studied PAs are in Table 2.
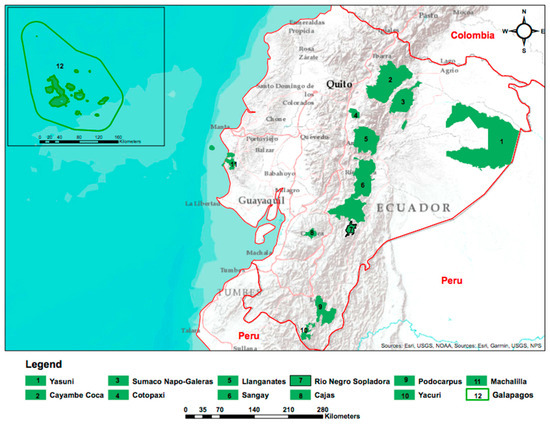
Figure 1.
Locations of the National Parks included in the study.
Table 2.
Background information of the National Parks in Ecuador [16].
The studied NPs were established through resolutions and ministerial agreements between 1959 and 2018 and all of them are managed by ME through management teams (equipo administrativo) (MTs) subordinated to jurisdictional ME Provincial Directorates (Direcciones Provinciales), except for El Cajas NP managed by the Cuenca municipality [43]. National Patrimony Units of the Provincial Directorates are in charge, among others, with the elaboration and monitoring of NP management plans, while the officials who make up the MTs are the ones who respond, in the first instance, about NP management. Currently, MTs are generally made up of an NP manager and park rangers [43]. Volunteers are enlisted to serve as guides and interpreters. Typical management practices include routine patrols, educational/tourist guiding and research [43].
2.3. Data Collection and Analysis
To accomplish the objective of the study, a survey was implemented using a questionnaire based on the framework of METT methodology developed by WB and WWF [12,44]. The questionnaire is structured in two sections: a basic information section and a scorecard section. The first section accounted general information about the NP: location, size, date of formal establishment, management entity, staff, annual budget, main management objectives, main threats, main management activities and data about the persons that were involved in filling the questionnaire—the assessors. The second section contains 30 questions classified into six elements of evaluation: context (2 questions), planning (3), inputs (8), processes (12), outputs (2), and outcomes (3) (Table A1). Every question refers to one topic (Table A1), and the assessors were asked to assign a simple score ranging from 0 (poor) to 3 (excellent) using the four alternative answers provided for each question to help assessors choose the appropriate score. In addition, the questionnaire includes 6 supplementary questions elaborated on key themes focusing on the topics of management plan (3 questions), impact on communities (2) and the condition of main park values (1). The additional questions were designed to provide additional information and points (0 or 1). The current system assumes that all the questions covered issues of equal weight. The total scores on the second section of the questionnaire ranged from 0 to 96.
The survey was implemented by making visits to all 12 targeted NPs, during spring and summer of 2018. The questionnaires were filled through face-to-face discussions (interviews) held with an area manager, accompanied by 2–5 other members of MT, the scores for each topic being awarded after reaching consensus between the assessors and participant MT members. This approach is recommended in order to limit the subjectivity of the assessment [34]. The interviews duration was about two hours and they were conducted in Spanish. A special case was RíoNegro Sopladora NP: the park was established legally in early 2018 based on the high biodiversity of the area [45] and the MT was under organization. The only assessor was the future park manager. The personnel involved in managing the park, the administrative office and pretty much everything besides the limits, area and objectives were unknown. Although the METT results for Río Negro Sopladora NP are presented in this study, this PA is not considered in the analysis.
Data have been centralized using Microsoft Excel for Mac version 15.31 and analyzed using Statistica ver. 7 software. Scores for elements of evaluation are sums of scores for respective topics and the overall management effectiveness score is the sum of the elements of evaluation scores. Indices for elements of evaluation and overall effectiveness evaluation have also been calculated as percentages of the obtained scores in the total possible scores for elements of evaluation and overall management effectiveness, respectively. Regression analysis has been used for: i) assessing dependence relationship between the scores in the second section of the questionnaire and other elements assessed in the first section of the questionnaire: park size, number of permanent staff, time since establishment and allocated budget and ii) assessing the dependence relationship between elements of evaluation. The Spearman correlation has been used for testing the relation between the different topics on one side and overall management effectiveness, condition of values, local communities and indigenous people on the other side.
3. Results and Discussions
3.1. Overall Management Effectiveness
Analysis of the total scores and percent indices from the METT questionnaires gives an indication of overall effectiveness. Excepting Río Negro Sopladora NP, the percent management effectiveness indices were within the range 40.6–99.0%, with Sangay NP having the lowest value and Galapagos NP the highest (Table 3). Those indices must be treated with some caution–the management effectiveness overall indices resulted from many strengths and weaknesses of management. As indicated in other studies describing or using METT [7,10,12,36,38], a high overall effectiveness index is not necessarily an indicator of the fact that there are no real issues, while a low overall effectiveness is not necessarily an indicator that there are no management strengths for a PA or a PAs system.
Table 3.
Indices for evaluation elements and overall management effectiveness.
Ecuadorian NPs show higher indices for management effectiveness (the aggregate management effectiveness indices found for Ecuador NPs is 63.0%) when compared with other studies using the same methodology: the average values recorded in 2006 varied between 53.1% for European and Middle East PAs and 39.9% for Latin America and Caribbean Region PAs [36], Ecuador PAs not being included in the study. Geldmann et al. [38] found average global indices of 54.7% increasing from 46.1% at the first MEE—the results of the METT assessment in 722 PAs around the world (none of them in Ecuador). When comparing with other METT surveys for the studied NPs, it can be observed that Cayambe Coca NP has recorded a significant increase in overall management effectiveness from 48.3% in 2005 to 61.5% in this study while Machalilla NP has recorded a stagnant evolution [46]. The most recent management effectiveness assessment for Ecuador also included two NPs: Podocarpus and Yacuri [42]. Although the methodology was slightly different (RAPPAM), the results are consistent, to some extent, with the results of the present study: the RAPPAM indices for Podocarpus NP were 55.3% (66.7% in this study), while, for Yacuri, they were 72.2% (76.0% in this study).
3.2. Evaluation Element Indices
In Figure 2, there are the average indices for the six evaluation elements for the investigated PAs, excepting Río Negro Sopladora NP. The assessors were in general agreement with the fact that legal status and PA regulations are well addressed; thus, the high scores for context. The answers relative to PA design, objectives and management planning (planning evaluation element) were also ranked high, with the notable exception of Sangay NP assessed with 41.7%. Except for Río Negro Sopladora NP, all other NPs have elaborated management plans which, in the majority of cases, are being implemented. This is a positive aspect of the Ecuadorian NPs network, having in mind that the ultimate success of any natural system will depend on science-based management plans [47], as most of the Ecuadorian NPs have [42,45].
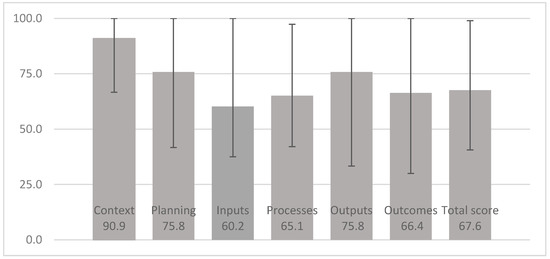
Figure 2.
Average evaluation element indices (%) for Ecuadorian National Parks—error bars based on extreme values.
The lowest scores were recorded for inputs: aspects related to human, financial and material resources, for all investigated PAs except for Galapagos NP, assessed with 100%. Galapagos NP has historically benefited from more resources as it is considered the country’s flagship NP. In assessors’ perception, other NPs, such as Sangay (inputs 37.5%), Machalilla (inputs 45.8%) or Cotopaxi (inputs 50.0%) have far less resources when comparing with Galapagos NP. The processes-related questions refer mainly to resource management, research, monitoring and evaluation and the relationships with indigenous people and local communities. The same Sangay NP and Machalilla NP were assessed with the lowest indices: 42.1% and 66.7%, respectively, but the assessments were more consistent along the investigated NPs. A better organization of the monitoring and evaluation systems in NP management might be a solution for some of the process-related issues: systems of indicators for long-term monitoring and evaluation could provide detailed biodiversity data and other quantitative data needed for assessment should be considered [48]. Moreover, underfunding of protected areas appears to be a systemic problem in many countries [11]. Funding shortages and inefficient management of funds directly influence the management effectiveness of PAs [29,30].
For outputs element, the assessment recorded rather different indices, varying from 33.3% for Sangay NP to 100.0% for Galapagos NP. The outcomes element indices, including assessment referring to condition of values, protection systems and economic benefit, also have limited consistency along the investigated NPs: it varies from 30.0% for Sangay NP to 100.0% for Galapagos NP (Table 3). However, it is important to highlight that the METT assessment is primarily a tool for capturing processes and inputs, rather than outcomes [41].
From a strategic management perspective, it is important to understand the relationships between planning, context and inputs on one side and management processes, outputs and outcomes on the other side. The performed regression analysis indicates that there are positive significant (p < 0.05) correlations between almost all considered variables. The only correlation that is significant for p < 0.001 is between process and inputs indicating that increasing resources is a viable solution for better process efficiency. The only pair of variables that are not significantly correlated are outputs and planning (Table 4): this may be an indication of the fact that, although plans are done properly, they cannot influence outputs without enough resources.
Table 4.
Statistics of regression between evaluation element indices (N = 11).
3.3. Management Strengths and Weaknesses
The average scores for questions in the questionnaire reveal that topics such as legal establishment, PA objectives, regular workplans and PA design are perceived as being well addressed. In general, laws and regulations that are designed and adopted at national level are easily implemented based on specific operative regulations. However, the scores for law enforcement are lower than those for legal status, and PA regulations; this being a potential indicator that there is the need to improve the ability to implement the relevant laws and regulations. Because the aims of a PA are referring to its territory, the power to implement laws and regulations should be entrusted to the PA management teams [29].
Notably, one of the highest average scores was recorded for condition of values (Question—What is the condition of the important values of the PA as compared to when it was first designated?). However, biological outcomes have only one question in the METT and this is unlikely to capture the complexity of assessing ecological condition in a PA [38].
There are also some aspects such as visiting fees, relationships with the indigenous population, local communities, budget, commercial tourism operators and research that are perceived as being less well addressed. The average scores for all questions can be seen in Figure 3, while the highest and lowest scores, including the standard deviation, are shown in Table 5. The fact that for some aspects the average scores are rather low (Table 5, Figure 3) does not mean that all NPs in Ecuador are performing badly. The standard deviation values (Table 5) show that the most consistently ineffective tropics are the current budget and the research. The very god situation of Galapagos NP is significantly influencing the standard deviation. For example, for the fees aspect, the Galapagos NP score is 3, while for the rest of the Parks scores are 0 or 1 (more or less the same for topics like local communities, current budget and security of budget). This can be explained by the fact that, at the moment of the assessment, visiting fees were only enforced for Galapagos NP, being cancelled through a political decision, for all other NPs, by an official Government Resolution, probably for encouraging visitation. The most consistently successful topics of management across all sites are related to legal status, PA objectives and regulations, regular workplan, education and awareness and conditions of values.
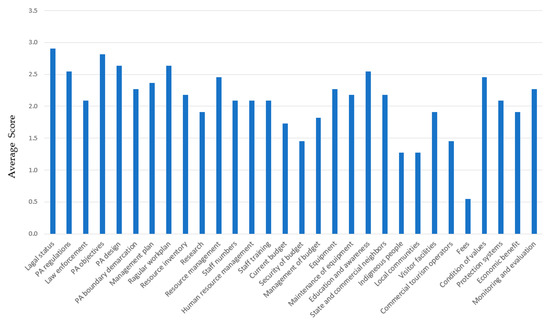
Figure 3.
Average scores per questions.
Table 5.
Extreme scoring topics for Ecuadorian National Parks.
Based on the results of the METT assessment, one important issue for Ecuadorian NPs is the management of the relationships with local communities and indigenous people (Table 5). Therefore, mechanisms for including local communities and indigenous people in the decision making as well as in benefit sharing should be implemented. These mechanisms may include ecological compensation mechanisms, subsidized loans for poverty alleviation and encouragement for economic development in the surrounding communities. Many studies have indicated that management plans and management activities have been carried out successfully in many PAs because of the participation of local communities [49,50,51]. Another example, which is rather specific to Ecuadorian conditions, includes helping local citizens and native people to continue the traditional use of resources [52], without external implication, by improving the society sense of ecological education and investment in environmental protection. Irrespective of this, the solutions should be adapted to specific conditions of every NP and every community or indigenous people group.
The results of this study are consistent with the 2007 and 2015 world studies [34,36] in topics such as legal status, PA design and condition of values (among the highest scoring topics) or budget related topics, indigenous people and local communities (among the lowest scoring topics). The METT global surveys in 2006 [36] found out that the highest average scores were recorded for legal status, PA demarcation, while the lowest scores were recorded for education and awareness budget-related topics and relationships with indigenous people and local communities. Notably, the 2015 study [38] accounts for significant increases in scores over the years (between the first and the last assessment for each PA) in topics such as legal status and management plan while the change in terms of condition of values is minimal.
3.4. Influencing Factors
The analysis of the regression between overall management effectiveness indices and park areas, time since formal establishment, staff and allocated budget can be seen in Table 6. For the budget, data were available for only eight of the investigated NPs. Overall management effectiveness and the NP areas are not correlated (Table 6), this result confirming similar analysis done in 36 PAs in southern Ecuador, including Podocarpus and Yacuri NPs [43].
Table 6.
Statistics of regression between overall management effectiveness indices and NP surface, NP time since establishment, NP staff number and NP budget.
Time since formal establishment appears to have little apparent correlation with overall management effectiveness (R2 = 0.042, p = 0.547). Other studies revealed a strong correlation between overall management effectiveness and the time since formal establishment: analysis done for PAs in 31 municipalities and provinces in China [29], or the global analysis done in 2015 [38]. However, there are also studies that indicate a weak correlation between overall effectiveness and PA time of formal establishment: in Ecuador [42] or in Iran [31].
The results indicate that staff numbers are linked with overall management effectiveness (R2 = 0.474, p = 0.019). The correlation is logical, more dedicated persons within NP management teams being able to better implement the management measures. The linkage between staff and management effectiveness was found by other studies, too: China [29], the global WWF analysis in 2006 [38].
The results did not reveal a correlation between the allocated budgets and the overall management effectiveness. Notably, budget-related data given by the assessors may not be accurate because MTs do not keep separate account for the specific park activity expenditures, these expenditures being included in the general financial accounting of the jurisdictional ME Provincial Directorates, together with other kinds of expenditures [29]. Moreover, only eight NP budget figures were available, this being a small sample for a regression. Other studies [29] have identified a direct correlation between public allocation and the management effectiveness. The size and accessibility of the NPs may also influence the correlation between budgets and management effectiveness, larger protected areas having a proportionately smaller edge to pressures and through their remote location often result in relatively intact biodiversity values [53], making them attractive for further conservation investment [38]. One observation related to NPs in Ecuador is the fact that some of them are benefiting from large budgets (for example, assessors for Galapagos NP indicated USD 3 million) while there are small allocations for others (USD 35,000 for Yacuri NP or USD 45,999 for Cotopaxi NP). The strategic allocation of resources is the envisaged solution: to spend money on the areas that have the highest conservation priority and to focus on the issues most critical to protecting biodiversity [30,33].
As indicated in Section 3.3., the lowest scoring topics, excepting the already discussed topic of fees, are the relationships with local communities and indigenous people. Therefore, Spearman Rank Order correlation coefficients were calculated to measure the relationship between the assessment scores for these two topics and all other 28 topics. Moreover, the coefficients were calculated to assess the most important factors influencing the overall management effectiveness and the condition of values. Table 7 includes the most significantly correlated topics. Although a correction to significance level was not performed, the results indicate clear patterns. Current budget and management of budget have the strongest correlations with the relationships with local communities and indigenous people (Table 7). PA boundary and budget topics (current budget, security and management of budget) have the strongest correlation with management effectiveness. Moreover, resource inventory, monitoring&evaluation and research are very important for achieving the desired management effectiveness. Condition of values, reporting the management status of protection targets has the strongest correlation with PA boundary, PA regulations, and monitoring&evaluation. It is also closely connected with budget topics and resource inventory. These results are in line with studies done in other countries which also found resource management and availability as being very important for both the condition of values and the coordination with local communities [29,30,35,42]. In the case Ecuador NPs, the results of the analysis indicate that budget availability, continuity and management as well as an improved process of resource inventory and monitoring may lead to better planning and implementing an effective management. Notably, in Ecuador’s case, these results are not indicating that law enforcement or management planning are critical for neither overall management activities nor conservation of values as indicated by studies done on a local [34,35] or global scale [36,38]. This may be explained by the fact that all analyzed NPs in Ecuador have already scientifically based management plans, even if they are not properly implemented in all cases. One significant outcome of the study was the fact that law enforcement is not influencing overall management effectiveness. Therefore, the low enforcement emphasis may not be the way to improve the management effectiveness and especially the condition of values and relationships with communities, as it is envisaged in some of the programmatic official documents [14,17]. The relationships with local communities and indigenous people, already identified as sensible issues in NPs in Ecuador [52], can be better addressed by allocating and proper use of budgets.
Table 7.
Spearman Rank Order Correlation coefficients for the topics influencing overall management effectiveness, condition of values, local communities and indigenous people.
4. Conclusions
Ecuador has proved to be seriously concerned for biodiversity conservation by developing a solid legal base for establishing PAs and manifesting continuous interest for properly managing the system of PAs. This research provides a baseline for evaluating the management effectiveness of the Ecuadorian NP network.
The results of the study are encouraging: the general condition of biodiversity values have been assessed with high scores in the METT questionnaire, in line with the legal status and NPs design. Moreover, many of the Ecuadorian NPs have been assessed with high scores for the overall management effectiveness when compared with the results obtains in other regions of the world [36,38]. In a broader perspective, METT assessment for Ecuadorian NPs delivers results that are in line with other similar assessments done in the country [21,42] the region [36] or in other countries [29,30,32,34]. However, some notable particularities related to the relevance of law enforcement efforts (although perceived as not very good) for managing relationships with communities and preserving conservation values can be noticed. NPs are benefiting from the elaboration of specific management plans, thus supporting a proper biodiversity conservation objectives formulation. All these positive aspects are reflected in the present MEE results. However, budget allocation, tourism arrangements, communities and indigenous people received the lowest scores, these issues being the weak links in the management of NPs. Staff numbers are closely linked with the ability to manage Pas, and seemingly there is a significant variation in the budgets although the availability of budget data is limited. For some of the NPs, a rather low level of management effectiveness represents a warning and a challenge for government and NP managers.
Based on the results of this METT assessment, some important recommendations can be made for Ecuadorian NPs decision makers. The low enforcement emphasis is not necessarily the best way to improve management effectiveness. The important issue of the relationships with local communities and indigenous people should be addressed through mechanisms for including them in the decision making as well as in benefit sharing: ecological compensation mechanisms, subsidized loans for poverty alleviation and encouragement for economic development in the surrounding communities and, especially for Ecuadorian condition, helping local citizens and native people to continue the traditional use of resources, without external implication, by improving the society sense of ecological education and investment in environmental protection. Moreover, in the context of indicated budget scarcity, strategic allocation of budgetary resources—according to the highest conservation priority—can be a valid solution. The visitation fee collection should be reassessed as it can be used as a supplementary source. Irrespective of this, the solutions should be adapted to every NP-specific condition and, crucially, for every community or indigenous people group.
There are recognized concerns about the limitations of the METT [37], but despite these limitations, the wide use of the methodology, as well as many of the findings of this study, suggest that METT analysis can deliver a useful assessment of NP management. In addition, results from an independently implemented reassessment of PAs, undertaken at two-to-three-year intervals, would act as guidance for what specific intervention areas should be targeted in order to improve the overall management effectiveness. In any case, to be truly effective, the results of these assessments should be balanced with a real on the ground understanding of the conservation status of species and habitats and how it is affected by the improved management effectiveness.
Author Contributions
Conceptualization, C.N. and B.P.; Data curation, C.N. and A.-F.H.; Investigation, C.N. and I.D.G.; Methodology, C.N. and B.P.; Supervision, B.P.; Writing—original draft, C.N., I.D.G. and B.P.; Writing—review and editing, A.-F.H. and B.P. All authors have read and agreed to the published version of the manuscript.
Funding
The study was funded by Transilvania University of Brasov through a doctoral scholarship
Acknowledgments
The authors are appreciative of those who helped in the field, especially to Natural Parks management teams’ members. The authors would also like to make a special mention for Alex Gavilanes Montoya, Danny Castillo Vizuete and Santiago Silva Lachard for their valuable support at various periods during the field work.
Conflicts of Interest
The authors declare no conflict of interest.
Appendix A
Table A1.
Management Effectiveness Tracking Tool (METT) questions with management cycle elements of evaluation and possible score (adapted after Stolton et al. [12]).
Table A1.
Management Effectiveness Tracking Tool (METT) questions with management cycle elements of evaluation and possible score (adapted after Stolton et al. [12]).
| Question (Element of Evaluation/Maximum Possible Score) | Notes |
|---|---|
| 1. Legal status: Does the protected area have legal status? | 0 = The protected area is not gazetted 1 = There is agreement that the protected area should be gazetted 2 = The protected area is in the process of being gazetted. 3 = The protected area has been formally gazetted/covenanted |
| (Context/3) | |
| 2 Protected area regulations Are appropriate regulations in place to control land use and activities? | 0 = There are no regulations 1 = Regulations with major weaknesses 2 = Regulations with some weaknesses or gaps 3 = Regulations provide an excellent basis for management |
| (Context/3) | |
| 3 Law enforcement: Can staff enforce protected area rules well enough? | 0 = No effective capacity/resources 1 = There are major deficiencies in staff capacity/resources 2 = The staff have acceptable capacity/resources 3 = The staff have excellent capacity/resources |
| (Input/3) | |
| 4 Protected area objectives: Is management undertaken according to agreed objectives? | 0 = No firm objectives have been agreed for the protected area 1 = Objectives exist, but not managed according to these 2 = Objectives exist, but is only partially managed according to these 3 = Objectives exist, and is managed to meet these |
| (Planning/3) | |
| 5 Protected area design: Is the protected area the right size and shape to protect species, habitats, ecological processes and water catchments of key conservation concern? | 0 = Inadequacies in protected area design mean achieving the major objectives of the protected area is very difficult 1 = Inadequacies in protected area design mean that achievement of major objectives is difficult but some mitigating actions are being taken 2 = Protected area design is not significantly constraining achievement of objectives, but could be improved 3 = Protected area design helps achievement of objectives; it is appropriate for species and habitat conservation |
| (Planning/3) | |
| 6 Protected area boundary demarcation: Is the boundary known and demarcated? | 0 = The boundary of the protected area is not known 1 = The boundary of the protected area is known by the management authority but is not known by local residents 2 = The boundary of the protected area is known but is not demarcated 3 = The boundary of the protected area is known and is appropriately demarcated |
| (Process/3) | |
| 7 Management plan: Is there a management plan and is it being implemented? | 0 = There is no management plan 1 = Management plan is not being implemented 2 = Management plans is partially implemented 3 = A management plan exists and is being implemented Additional points (0/1): The planning process allows adequate opportunity for key stakeholders to influence the management plan There is an established schedule and process for periodic review and updating of the management plan The results of monitoring, research and evaluation are routinely incorporated into planning |
| (Planning/6) | |
| 8 Regular work plan: Is there a regular work plan and is it being implemented? | 0 = No regular work plan exists 1 = Exists but few of the activities are implemented 2 = Exists and many activities are implemented 3 = Exists and all activities are implemented |
| (Output/3) | |
| 9 Resource inventory: Do you have enough information to manage the area? | 0 = There is little or no information available on the critical habitats, species and cultural values of the protected area 1 = Information is not sufficient to support planning and decision making 2 = Information is sufficient for most key areas 3 = Information is sufficient to support all areas |
| (Input/3) | |
| 10 Research: Is there a programme of management-orientated survey and research work? | 0 = There is no survey or research work taking place 1 = There is a small amount of survey and research work 2 = There is considerable survey and research work 3 = There is a comprehensive, integrated research programme |
| (Process/3) | |
| 11 Resource management: Is active resource management being undertaken? | 0 = Active resource management is not being undertaken 1= Very few of the requirements for active management are being implemented 2 = Many of the requirements for active management are being implemented 3 = Requirements are being substantially or fully implemented |
| (Process/3) | |
| 12 Staff numbers: Are there enough people employed to manage the protected area? | 0 = There are no staff 1 = Staff numbers are inadequate 2 = Staff numbers are below optimum 3 = Staff numbers are adequate |
| (Input/3) | |
| 13 Human resources management: Are the human resources well managed? | 0 = Problems with personnel management constrain the achievement of major management objectives 1 = Problems with personnel management partially constrain the achievement of major management objectives 2 = Personnel management is adequate to the achievement of major management objectives but could be improved 3 = Personnel management is excellent and aids the achievement major management objectives |
| (Process/3) | |
| 14 Staff training: Are staff adequately trained to fulfill management objectives? | 0 = Staff lack the skills needed for protected area management 1 = Staff training and skills are low relative to the needs 2 = Staff training and skills are adequate, but could be further improved to fully achieve the objectives of management 3 = Staff training and skills are aligned with the management needs |
| (Input/3) | |
| 15 Current budget: Is the current budget sufficient? | 0 = There is no budget 1 = The available budget is inadequate for basic management needs 2 = The available budget is acceptable but could be further improved 3 =The available budget is sufficient |
| (Input/3) | |
| 16 Security of budget: Is the budget secure? | 0 = Wholly reliant on outside or highly variable funding 1 = There is very little secure budget 2 = There is a reasonably secure core budget 3 = There is a secure budget |
| (Input/3) | |
| 17 Management of budget: Is the budget managed to meet critical management needs? | 0 = Budget management is very poor and significantly undermines effectiveness 1 = Budget management is poor and constrains effectiveness 2 = Budget management is adequate but could be improved 3 =Budget management is excellent and meets management needs |
| (Process/3) | |
| 18 Equipment: Is equipment sufficient for management needs? | 0 = There are little or no equipment and facilities 1 = There are some equipment and facilities but these are inadequate 2 = There are equipment and facilities, but still some gaps 3 = There are adequate equipment and facilities |
| (Input/3) | |
| 19 Maintenance of equipment: Is equipment adequately maintained? | 0 = There is little or no maintenance of equipment and facilities 1 = There is some ad hoc maintenance of equipment and facilities 2 = There is basic maintenance of equipment and facilities 3 = Equipment and facilities are well maintained |
| (Process/3) | |
| 20 Education and awareness: Is there a planned education programme linked to the objectives and needs? | 0 = There is no education and awareness programme 1 = There is a limited and ad hoc education and awareness programme 2 = There is an education and awareness programme but it only partly meets needs 3 =There is an appropriate and implemented education and awareness programme |
| (Process/3) | |
| 21 State and comm. neighbors: Is there co-operation with adjacent land and water users? | 0 = There is no contact between managers and neighbouring official 1 = Contact between managers and neighbouring official but little or no cooperation 2 = Contact between managers and neighbouring official but only some co-operation 3 = There is regular contact between managers and neighbouring official |
| (Process/3) | |
| 22 Indigenous people: Do indigenous and traditional peoples resident or regularly using the protected area have input to management decisions? | 0 = Indigenous and traditional peoples have no input into decisions 1 = Indigenous and traditional peoples have some input into discussions 2 = Indigenous and traditional peoples directly contribute to some decisions 3 = Indigenous and traditional peoples directly participate in all relevant decisions |
| (Process/3) | |
| 23 Local communities: Do local communities resident or near the protected area have input to management decisions? | 0 = Local communities have no input into decisions 1 = Local communities have some input into discussions 2 = Local communities directly contribute to some relevant decisions 3 = Local communities directly participate in all relevant decisions Additional points (0/1): There is open communication and trust between local and/or indigenous people, stakeholders and protected area managers Programmes to enhance community welfare, while conserving protected area resources, are being implemented |
| (Process/5) | |
| 24 Visitor facilities: Are visitor facilities adequate? | 0 = There are no visitor facilities and services despite an identified need 1 = Visitor facilities and services are inappropriate for current levels of visitation 2 = Visitor facilities are adequate for current levels of visitation but could be improved 3 = Visitor facilities and services are excellent for current levels of visitation |
| (Outputs/3) | |
| 25 Commercial tourism operators: Do commercial tour operators contribute to protected area management? | 0 = There is little or no contact between managers and tourism operators 1 = There is contact between managers and tourism operators but this is largely confined to administrative or regulatory matters 2 = There is limited co-operation between managers and tourism operators to enhance visitor experiences and maintain protected area values 3 = There is good co-operation between managers and tourism operators to enhance visitor experiences, and maintain protected area values |
| (Process/3) | |
| 26 Fees: If fees (i.e., entry fees or fines) are applied, do they help protected area management? | 0 = Although fees are theoretically applied, they are not collected 1 = Fees are collected, but make no contribution to the protected area 2 = Fees are collected, and make some contribution to the protected area 3 = Fees are collected and make a substantial contribution to the protected area |
| (Inputs/3) | |
| 27 Condition of values: What is the condition of the important values of the protected area as compared to when it was first designated? | 0 = Many important biodiversity, ecological or cultural values are being severely degraded 1 = Some biodiversity, ecological or cultural values are being severely degraded 2 = Some biodiversity, ecological and cultural values are being partially degraded but the most important values have not been significantly impacted 3 = Biodiversity, ecological and cultural values are predominantly intact Additional point (0/1): Specific programmes are being implemented to restaurate the degraded sites for the protected area |
| (Outcome/4) | |
| 28 Protection systems: Are systems in place to control access/resource use in the protected area? | 0 = Protection systems are ineffective in controlling access or use of the reserve in accordance with objectives 1 = Protection systems only partially effective in controlling access or use of the PA 2 = Protection systems moderately effective in controlling access or use of the PA 3 = Protection systems are largely or wholly effective in controlling access or use of the reserve |
| (Output/3) | |
| 29 Economic benefit: Is the protected area providing economic benefits to local communities, e.g., income, employment, payment for environmental services? | 0 = The protected area does not deliver economic benefits to local communities 1 = Potential economic benefits are recognized. Plans are being developed 2 = There is some flow of economic benefits to local communities 3 = There is a major flow of economic benefits to local communities |
| (Outcome/3) | |
| 30 Monitoring and evaluation: Are management activities monitored against performance? | 0 = There is no monitoring and evaluation 1 = There is some ad hoc monitoring and evaluation, but no overall strategy 2 = There is an agreed and implemented monitoring and evaluation system but results do not feed back into management 3 = A good monitoring and evaluation system exists, and is well implemented |
| (Process/3) |
References
- Leverington, F.; Lemos Costa, K.; Pavese, H.; Lisle, A.; Hockins, M. A global analysis of Protected Area Management Effectiveness. J. Environ. Manag. 2010, 46, 685–698. [Google Scholar] [CrossRef] [PubMed]
- Gillingham, P.K.; Bradbury, R.B.; Roy, D.B.; Anderson, B.J.; Baxter, J.M.; Bourn, N.A.D.; Crick, H.Q.P.; Findon, R.A.; Fox, R.; Franco, A.; et al. The effectiveness of protected areas in the conservation of species with changing geographical ranges. Biol. J. Linn. Soc. 2015, 115, 707–717. [Google Scholar] [CrossRef]
- UNEP-WCMC; IUCN; NGS. Protected Planet Live Report; UNEP-WCMC: Cambridge, UK; IUCN: Gland, Switzerland; NGS: Washington, DC, USA, 2019; Available online: https://livereport.protectedplanet.net/ (accessed on 20 April 2020).
- Hickcox, R.P.; Jara, M.; Deacon, L.A.K.; Harvey, L.P.; Pincheira-Donoso, D. Global terrestrial distribution of penguins (Spheniscidae) and their conservation by protected areas. Biodivers. Conserv. 2019, 28, 2861–2876. [Google Scholar] [CrossRef]
- Leverington, F.; Costa, K.L.; Courrau, J.; Pavese, H.; Nolte, C.; Marr, M.; Coad, L.; Burgess, N.; Bomhard, B.; Hockings, M. Management Effectiveness Evaluation in Protected Areas—A Global Study, 2nd ed.; UN WCMC: Cambridge, UK, 2010. [Google Scholar]
- Hockings, M.; Stolton, S.; Leverington, F.; Dudley, N.; Courrau, J. Evaluating Effectiveness—A Framework for Assessing Management Effectiveness of Protected Areas, 2nd ed.; IUCN: Gland, Switzerland; Geneva, Switzerland, 2006. [Google Scholar]
- Hockings, M.; Stolton, S.; Dudley, N. Evaluating Effectiveness: A Framework for Assessing the Management of Protected Areas; Best Practice Protected Area Guidelines Series No. 6; IUCN: Gland, Switzerland; Cambridge, UK, 2000. [Google Scholar]
- Hockings, M.; Stolton, S.; Courrau, J.; Dudley, N.; Parrish, J.; James, R.; Mathur, V.; Makombo, J. The World Heritage Management Effectiveness Workbook; UNESCO, IUCN, University of Queensland, The Nature Conservancy: Brisbane, Australia, 2007. [Google Scholar]
- Pomeroy, R.; Parks, J.; Watson, L. How Is Your MPA doing? A Guidebook of Natural and Social Indicators for Evaluating Marine Protected Area Management Effectiveness; IUCN, WWF: Gland, Switzerland; The US National Oceanic and Atmospheric Administration (NOAA): Cambridge, UK, 2004. [Google Scholar]
- Leverington, F.; Hockings, M.; Pavese, H.; Costa, K.L.; Courrau, J. Management Effectiveness Evaluation in Protected Areas—A Global Study. Overview of Approaches and Methodologies; Supplementary Report no. 1; The University of Queensland, Gatton, TNC, WWF, IUCN-WCPA: Sidney, Australia, 2008. [Google Scholar]
- Ervin, J. Rapid Assessment and Prioritization of Protected Area Management (RAPPAM) Methodology; WWF: Gland, Switzerland; Geneva, Switzerland, 2003. [Google Scholar]
- Stolton, S.; Hockings, M.; Dudley, N.; MacKinnon, K.; Whitten, T.; Leverington, F. Reporting Progress in Protected Areas A Site-Level Management Effectiveness Tracking Tool, 2nd ed.; World Bank/WWF Forest Alliance published by WWF: Gland, Switzerland; Geneva, Switzerland, 2007. [Google Scholar]
- ME. Ponencias del Ministerio del Ambiente Para el Fortalecimiento y Consolidación del Sistema Nacional de Áreas Protegidas; Resumen del Primer Congreso Nacional de Áreas Protegidas: Quito, Ecuador, 2004. [Google Scholar]
- ME. Valoración Económica del Aporte del Sistema Nacional de Áreas Protegidas: Turismo e Hidroelectricidad; Ministerio del Ambiente: Quito, Ecuador, 2015.
- ME. Plan Estratégico del Sistema Nacional de Áreas Protegidas del Ecuador 2007–2016; Ministerio del Ambiente: Quit, Ecuador, 2007.
- ME. Obtenido de Parks National System. Available online: http://areasprotegidas.ambiente.gob.ec/en/info-snap (accessed on 8 March 2020).
- ME. Proyecto de Sostenibilidad Financiera para el Sistema Nacional de Áreas Protegidas. Una visión a su historia; Ministerio del Ambiente: Quito, Ecuador, 2016.
- UN-REDD. National Programme Document–Ecuador. UN-REDD Programme. Sixth Policy Board Meeting. Da Lat, Vietnam. 2011. Available online: https://wedocs.unep.org/bitstream/handle/20.500.11822/9457/-UN-REDD_National_Programme_Document_Ecuador-2011EN_Ecuador_NPD_2011.pdf.pdf? (accessed on 22 March 2011).
- Valarezo, V.; Andrade, R.; Díaz, R.; Celleri, Y.; Gómez, J. Informe Sobre la Evaluación de la Eficiencia de Manejo del Sistema Nacional de Áreas Naturales Protegidas del Ecuador. Instituto Ecuatoriano Forestal y de Áreas Naturales y Vida Silvestre; Dirección Nacional de Áreas Naturales y Vida Silvestre/Proyecto de Protección de la Biodiversidad; Unidad Técnica de Planificación para Áreas Naturales Protegidas: Quito, Ecuador, 1999. [Google Scholar]
- Velásquez, M.; Guerrero, P.; Villegas, T. Parque Nacional Galápagos. Evaluación de la Efectividad del Manejo (1996–2004); Ministerio del Ambiente: Parque Nacional Galápagos, Ecuador, 2004. [Google Scholar]
- ME. Evaluación de la Efectividad de manejo del Parque Nacional Machalilla. Quito, Ecuador. 2007. Available online: http://www.ambiente.gob.ec/wp-content/uploads/downloads/2012/07/ Parque-Nacional-Machalilla.pdf (accessed on 14 March 2020).
- ME. Evaluación de la Efectividad de Manejo de la Reserva Ecológica Cotacachi Cayapas. Quito, Ecuador. 2007. Available online: http://www.ambiente.gob.ec/wp-content/uploads/ downloads/2012/07/Reserva-Ecologica-Cotacachi-Cayas.pdf (accessed on 31 March 2020).
- Ganzenmüller, A.; Cuesta-Camacho, F.; Riofrío, M.G.; Baquero, F.; Gonzalez, C. Caracterizacion Ecosistemica y Evaluación de Efectividad Demanejodelos Bosques Protectores y Bloques del Patrimonio Forestal Ubicados en el Sector Ecuatoriano del Corredor de Conservacio n Choco-Manabí; Ministerio del Ambiente del Ecuador, EcoCiencia y Conservacio n Internacional: Quito, Ecuador, 2010. [Google Scholar]
- GD–PAME. Global Database on Protected Areas Management Evaluation. 2020. Available online: https://pame.protectedplanet.net (accessed on 4 March 2020).
- Stoll-Kleeman, S. Evaluation of Management Effectiveness in Protected Areas: Methodologies and Results. Basic Appl. Ecol. 2010, 11, 377–382. [Google Scholar] [CrossRef]
- MacKinnon, K.; Higgins-Zogib, L. World Bank/WWF Alliance Tracking Tool: Reporting conservation progress at protected area sites. In Evaluating Effectiveness: A Framework for Assessing the Management of Protected Areas, 2nd ed.; Hockings, M., Stolton, S., Dudley, N., Leverington, F., Courrau, J., Eds.; IUCN Best Practice Protected Area Guidelines Series; IUCN: Gland, Switzerland; Cambridge, UK, 2006. [Google Scholar]
- CBD. Strategic Plan for Biodiversity 2011–2020-COP 10, Decision X/2; Convention on Biological Diversity: Montreal, QC, Canada, 2010; Available online: https://www.cbd.int/decision/cop/?id=12268 (accessed on 15 January 2010).
- Moreaux, C.; Zafra-Calvo, N.; Vansteelant, N.G.; Wicander, S.; Burgess, N.D. Can existing assessment tools be used to track equity in protected areas management under Aichi Target 11? Biol. Conserv. 2018, 224, 242–247. [Google Scholar] [CrossRef]
- Quan, J.; Ouyang, Z.; Xu, W.; Miao, H. Assessment of the effectiveness of nature reserve management in China. Biodivers. Conserv. 2011, 20, 779–792. [Google Scholar] [CrossRef]
- Lham, D.; Wangchuk, S.; Stolton, S.; Dudley, N. Assessing the effectiveness of a protected area network: A case study of Bhutan. Oryx 2019, 53, 63–70. [Google Scholar] [CrossRef]
- Kolahi, M.; Sakai, T.; Moriya, K.; Makhdoum, M.F.; Koyama, L. Assessment of the effectiveness of protected areas management in Iran: Case study in Khojir National Park. Environ. Manag. 2013, 52, 514–530. [Google Scholar] [CrossRef]
- Nolte, C.; Agrawal, A. Linking management effectiveness indicators to observed effects of protected areas on fire occurrence in the Amazon rainforest. Conserv. Biol. 2013, 27, 155–165. [Google Scholar] [CrossRef]
- Goodman, P.S. Assessing management effectiveness and setting priorities in protected areas in KwaZulu-Natal. BioScience 2003, 53, 843–850. [Google Scholar] [CrossRef]
- Papp, C.R. Tracking management effectiveness: Experiences from two Carpathian Biosphere Reserves. In Biosphere Reserves in the Mountains of the World; Austrian MAB Committee, Ed.; Austrian Academy of Sciences Press: Vienna, Austria, 2011. [Google Scholar]
- Namsrai, O.; Ochir, A.; Baast, O.; van Genderen, J.L.; Muhar, A.; Erdeni, S.; Wang, J.; Davaasuren, D.; Chonokhuu, S. Evaluating the management effectiveness of protected areas in Mongolia using the management effectiveness tracking tool. Environ. Manag. 2019, 63, 249–259. [Google Scholar] [CrossRef] [PubMed]
- Dudley, N.; Belokurov, A.; Higgins-Zogib, L.; Hockings, M.; Stolton, S.; Burgess, N. Tracking Progress in Managing Protected Areas around the World. An Analysis of Two Applications of the Management Effectiveness Tracking Tool Developed by WWF and the World Bank; WWF International: Gland, Switzerland, 2007. [Google Scholar]
- Coad, L.; Leverington, F.; Knights, K.; Geldmann, A.E.; Eassom, A.; Kapos, V.; Kingston, N.; de Lima, M.; Zamora, C.; Cuardros, I.; et al. Measuring impact of protected areas management interventions: Current and future use of the Global Database of Protected Area Management Effectiveness. Phil. Trans. R. Soc. B 2015, 370, 20140281. [Google Scholar] [CrossRef] [PubMed]
- Geldmann, J.; Coad, L.; Barnes, M.; Craigie, I.D.; Hockings, M.; Knights, K.; Leverington, F.; Cuadros, I.C.; Zamiora, C.; Woodley, S.; et al. Changes in protected areas management effectiveness over time: A global analysis. Biol. Conserv. 2015, 191, 692–699. [Google Scholar] [CrossRef]
- Woon, H.L.; Abdullah, A.A. Framework to develop a consolidated index model to evaluate the conservation effectiveness of protected areas. Ecol. Indic. 2019, 102, 131–144. [Google Scholar]
- Jones, N.; McGinlay, J.; Dimitrakopoulos, P.G. Improving social impact assessment of protected areas: A review of the literature and directions for future research. Environ. Impact Assess. Rev. 2017, 64, 1–7. [Google Scholar] [CrossRef]
- Mascia, M.B.; Pailler, S.; Thieme, M.L.; Rowe, A.; Bottrill, M.C.; Danielsen, F.; Geldman, J.; Naidoo, R.; Pullin, A.S.; Burgess, N.D. Commonalities and complementarities among approaches to conservation monitoring and evaluation. Biol. Conserv. 2014, 169, 258–267. [Google Scholar] [CrossRef]
- López-Rodríguez, F.; Rosado, D. Management effectiveness evaluation in protected areas of southern Ecuador. J. Environ. Manag. 2017, 190, 45–52. [Google Scholar] [CrossRef]
- Zarate, K.C. Manual Para la Gestión Operativa de las Áreas Protegidas de Ecuador; Ministerio del Ambiente: Quito, Ecuador, 2013; Available online: https://www.ambiente.gob.ec/wp-content/uploads/downloads/2014/02/04-Manual-para-la-Gestión-Operativa-de-las-Áreas-Protegidas-de-Ecuador.pdf (accessed on 2 April 2020).
- Stolton, S.; Dudley, N. METT Handbook: A Guide to Using the Management Effectiveness Tracking Tool (METT); WWF UK: Woking, UK, 2016. [Google Scholar]
- Frenkel, C.; Rodas, L.F. Río Negro-Sopladora: El Descubrimiento de un Tesoro Natural; Naturaleza & Cultura Internacional, Ed.; Cuenca: Castille, Spain, 2017. [Google Scholar]
- CEPF. METT Assessment Information. WWW Document. 2020. Available online: https://www.google.com/url?sa=t&rct=j&q=&esrc=s&source=web&cd=2&cad=rja&uact=8&ved=2ahUKEwjkyavzqJjpAhXysosKHVOQDggQFjABegQIBhAB&url=https%3A%2F%2Fwww.cepf.net%2Fsites%2Fdefault%2Ffiles%2Fglobal-database-pa-management-effectiveness-user-manual.pdf&usg=AOvVaw0wodgHrN897TCL8wINJL3y (accessed on 13 May 2020).
- Margules, C.R.; Pressey, R.l. Systematic conservation planning. Nature 2000, 40, 243–253. [Google Scholar] [CrossRef]
- Vellak, A.; Tuvi, E.L.; Reier, U.; Kalamees, R.; Roosaluste, E.; Zobel, M.; Partel, M. Past and present effectiveness of protected areas for conservation of naturally and anthropogenically rare plant species. Conserv. Biol. 2009, 23, 750–757. [Google Scholar] [CrossRef]
- Wei, F.; Wang, S.; Fu, B.; Zhang, L.; Fu, C.; Kanga, E. Balancing community livelihoods and biodiversity conservation of protected areas in East Africa. Curr. Opin. Environ. Sustain. 2018, 33, 26–33. [Google Scholar] [CrossRef]
- Schwartzman, S.; Moreira, A.; Nepstad, D. Rethinking tropical forest conservation: Perils in parks. Conserv. Biol. 2000, 14, 1351–1357. [Google Scholar] [CrossRef]
- Hayes, T.M. Parks, people, and forest protection: An institutional assessment of the effectiveness of protected areas. World Dev. 2006, 34, 2064–2075. [Google Scholar] [CrossRef]
- ME. Gender and Interculturality in Biodiversity Management: A Case Study of the Experience of Ecuador in the Construction of Its 2015–2030 National Biodiversity Strategy; Ministerio del Ambiente: Quito, Ecuador, 2016. [Google Scholar]
- Mittermeier, R.A.; Mittermeier, C.G.; Brooks, T.M.; Pilgrim, J.D.; Konstant, W.R.; da Fonseca, G.A.B.; Kormos, C. Wilderness and biodiversity conservation. Proc. Natl. Acad. Sci. USA 2003, 100, 10309–10313. [Google Scholar] [CrossRef] [PubMed]
Publisher’s Note: MDPI stays neutral with regard to jurisdictional claims in published maps and institutional affiliations. |
© 2020 by the authors. Licensee MDPI, Basel, Switzerland. This article is an open access article distributed under the terms and conditions of the Creative Commons Attribution (CC BY) license (http://creativecommons.org/licenses/by/4.0/).