Article

Genetic Diversity and Population Structure of the Spring Orchid Cymbidium goeringii in Korean Distant Islands

1
Department of Biological Sciences, Kongju National University, 56 Gongjudaehak-ro, Gongju 32588, Korea
2
Institute of Biotechnology, Wizbiosolutions Inc., A-1501 Woolim Lions Valley 2, 14 Sagimakgol-ro 45 Beon-gil, Jungwon-gu, Seongnam 13209, Korea
*
Authors to whom correspondence should be addressed.
Diversity 2020, 12(12), 486; https://doi.org/10.3390/d12120486
Submission received: 30 October 2020 / Revised: 11 December 2020 / Accepted: 14 December 2020 / Published: 18 December 2020

Abstract

:
The spring orchid (Cymbidium goeringii), found in northeast Asia, is one of the most popular and horticulturally important species of the orchid family. This study analyzed the genetic diversity and population structure of the spring orchid populations in the small islands and mainland South Korea using 11 microsatellite markers. The genetic diversities of spring orchid populations in the distant islands (Heuksan Island and Ulleung Island) were slightly lower than that of the mainland population (Yeonggwang-gun). The population structure in the mainland was genetically separated from the populations in the islands. The population of Ulleung Island, located in the eastern part of the Korean peninsula, was genetically closer to the populations from China and Japan than to the populations from Yeonggwang-gun and Heuksan Island, which are geographically close to China. These results imply that the populations of spring orchids distributed in Yeonggwang-gun and Heuksan Island appear not to be influenced by the yellow dust winds. As the first population genetic study of spring orchids distributed in small distant islands, our study will be useful for understanding the genetic diversity and population structure of isolated C. goeringii populations.

1. Introduction

The genus Cymbidium (Orchidaceae) of the family Orchidaceae comprises about 70 species with a high taxonomic and morphological diversity and is frequently found in many Asian countries and Australia [1,2,3]. The Cymbidium species usually prefer slightly cool growing conditions, but they are also found in tropic and sub-tropic areas. Cymbidium goeringii Lindley, commonly known as the spring orchid, is frequently distributed in the East Asian countries, such as China, Korea, and Japan. C. goeringii propagates both sexually and asexually. Its cultivars are mostly vegetatively propagated, whereas wild individuals are propagated by sexual reproduction, predominantly via self-pollination [4]. It is one of the most popular and horticulturally important species in the genus Cymbidium, because of its many varieties and characteristic color and shape phenotypes of leaves and flowers. Moreover, spring orchids with attractive phenotypes are collected from field and traded commercially. Hence, it is necessary to develop a conservation plan to protect this species from being over-collected.
Microsatellite markers are frequently used as popular genetic markers in forensic biology and population genetics because the cost of development is low and the functional diversity of the population can be usefully analyzed through the representation of transcribed genes [5]. Among the several genetic markers, plant molecular markers called simple sequence repeats (SSR) have been most frequently applied in phylogenetic analysis and classification of Cymbidium species [6,7,8,9,10,11,12]. Microsatellites can provide information about genetic diversity, inbreeding probability, genetic differentiation, and population structure of C. goeringii [8,11,12]. Hyun et al. (2012) developed 21 polymorphic microsatellites from SSR-enriched genomic libraries of C. goeringii and applied them in the analysis of four populations (East Korea, West Korea, China, and Japan) [8]. Lee et al. (2020) determined the sequences of 13 microsatellites for molecular authentication of ten commercially high-priced cultivars of Korean C. goeringii with characteristic flower phenotypes [12].
In spring, yellow dust wind (also called yellow sand wind), which is one of the main types of westerly current, blows strongly from China to Korea. It was proposed that yellow dust contains pollutants of heavy metals, viruses, bacteria, and fungi [13]. Yellow dust rises in the air from the deserts of China or Mongolia and is carried by westerlies, thus influencing the west coastal area more than the east coastal area in Korea. When wild C. goeringii varieties with rare phenotypes are found in the west coastal area of Korea, orchid cultivators or collectors tend to believe that they originated from Chinese seeds by the yellow dust wind. Very tiny C. goeringii seeds with a length of about 1.2–1.8 mm could easily be blown from burst pods by the wind during spring. However, no study has yet proposed any evidence about the settlement of C. goeringii seeds blown from China.
Few studies have been performed on the population genetic diversity of C. goeringii in small islands far from the mainland. In the present study, we investigated the genetic diversity and population structure of C. goeringii populations collected from small islands far from the mainland via analyses of 11 microsatellite loci. In particular, to estimate the effect of yellow dust on the C. goeringii populations in Korea, Ulleung-Island and Heuksan-Island, respectively located to the east and west of Korea, were selected as the survey sites. We also compared the genetic structure and origin of C. goeringii distributed in Korea, China, and Japan.

2. Materials and Methods

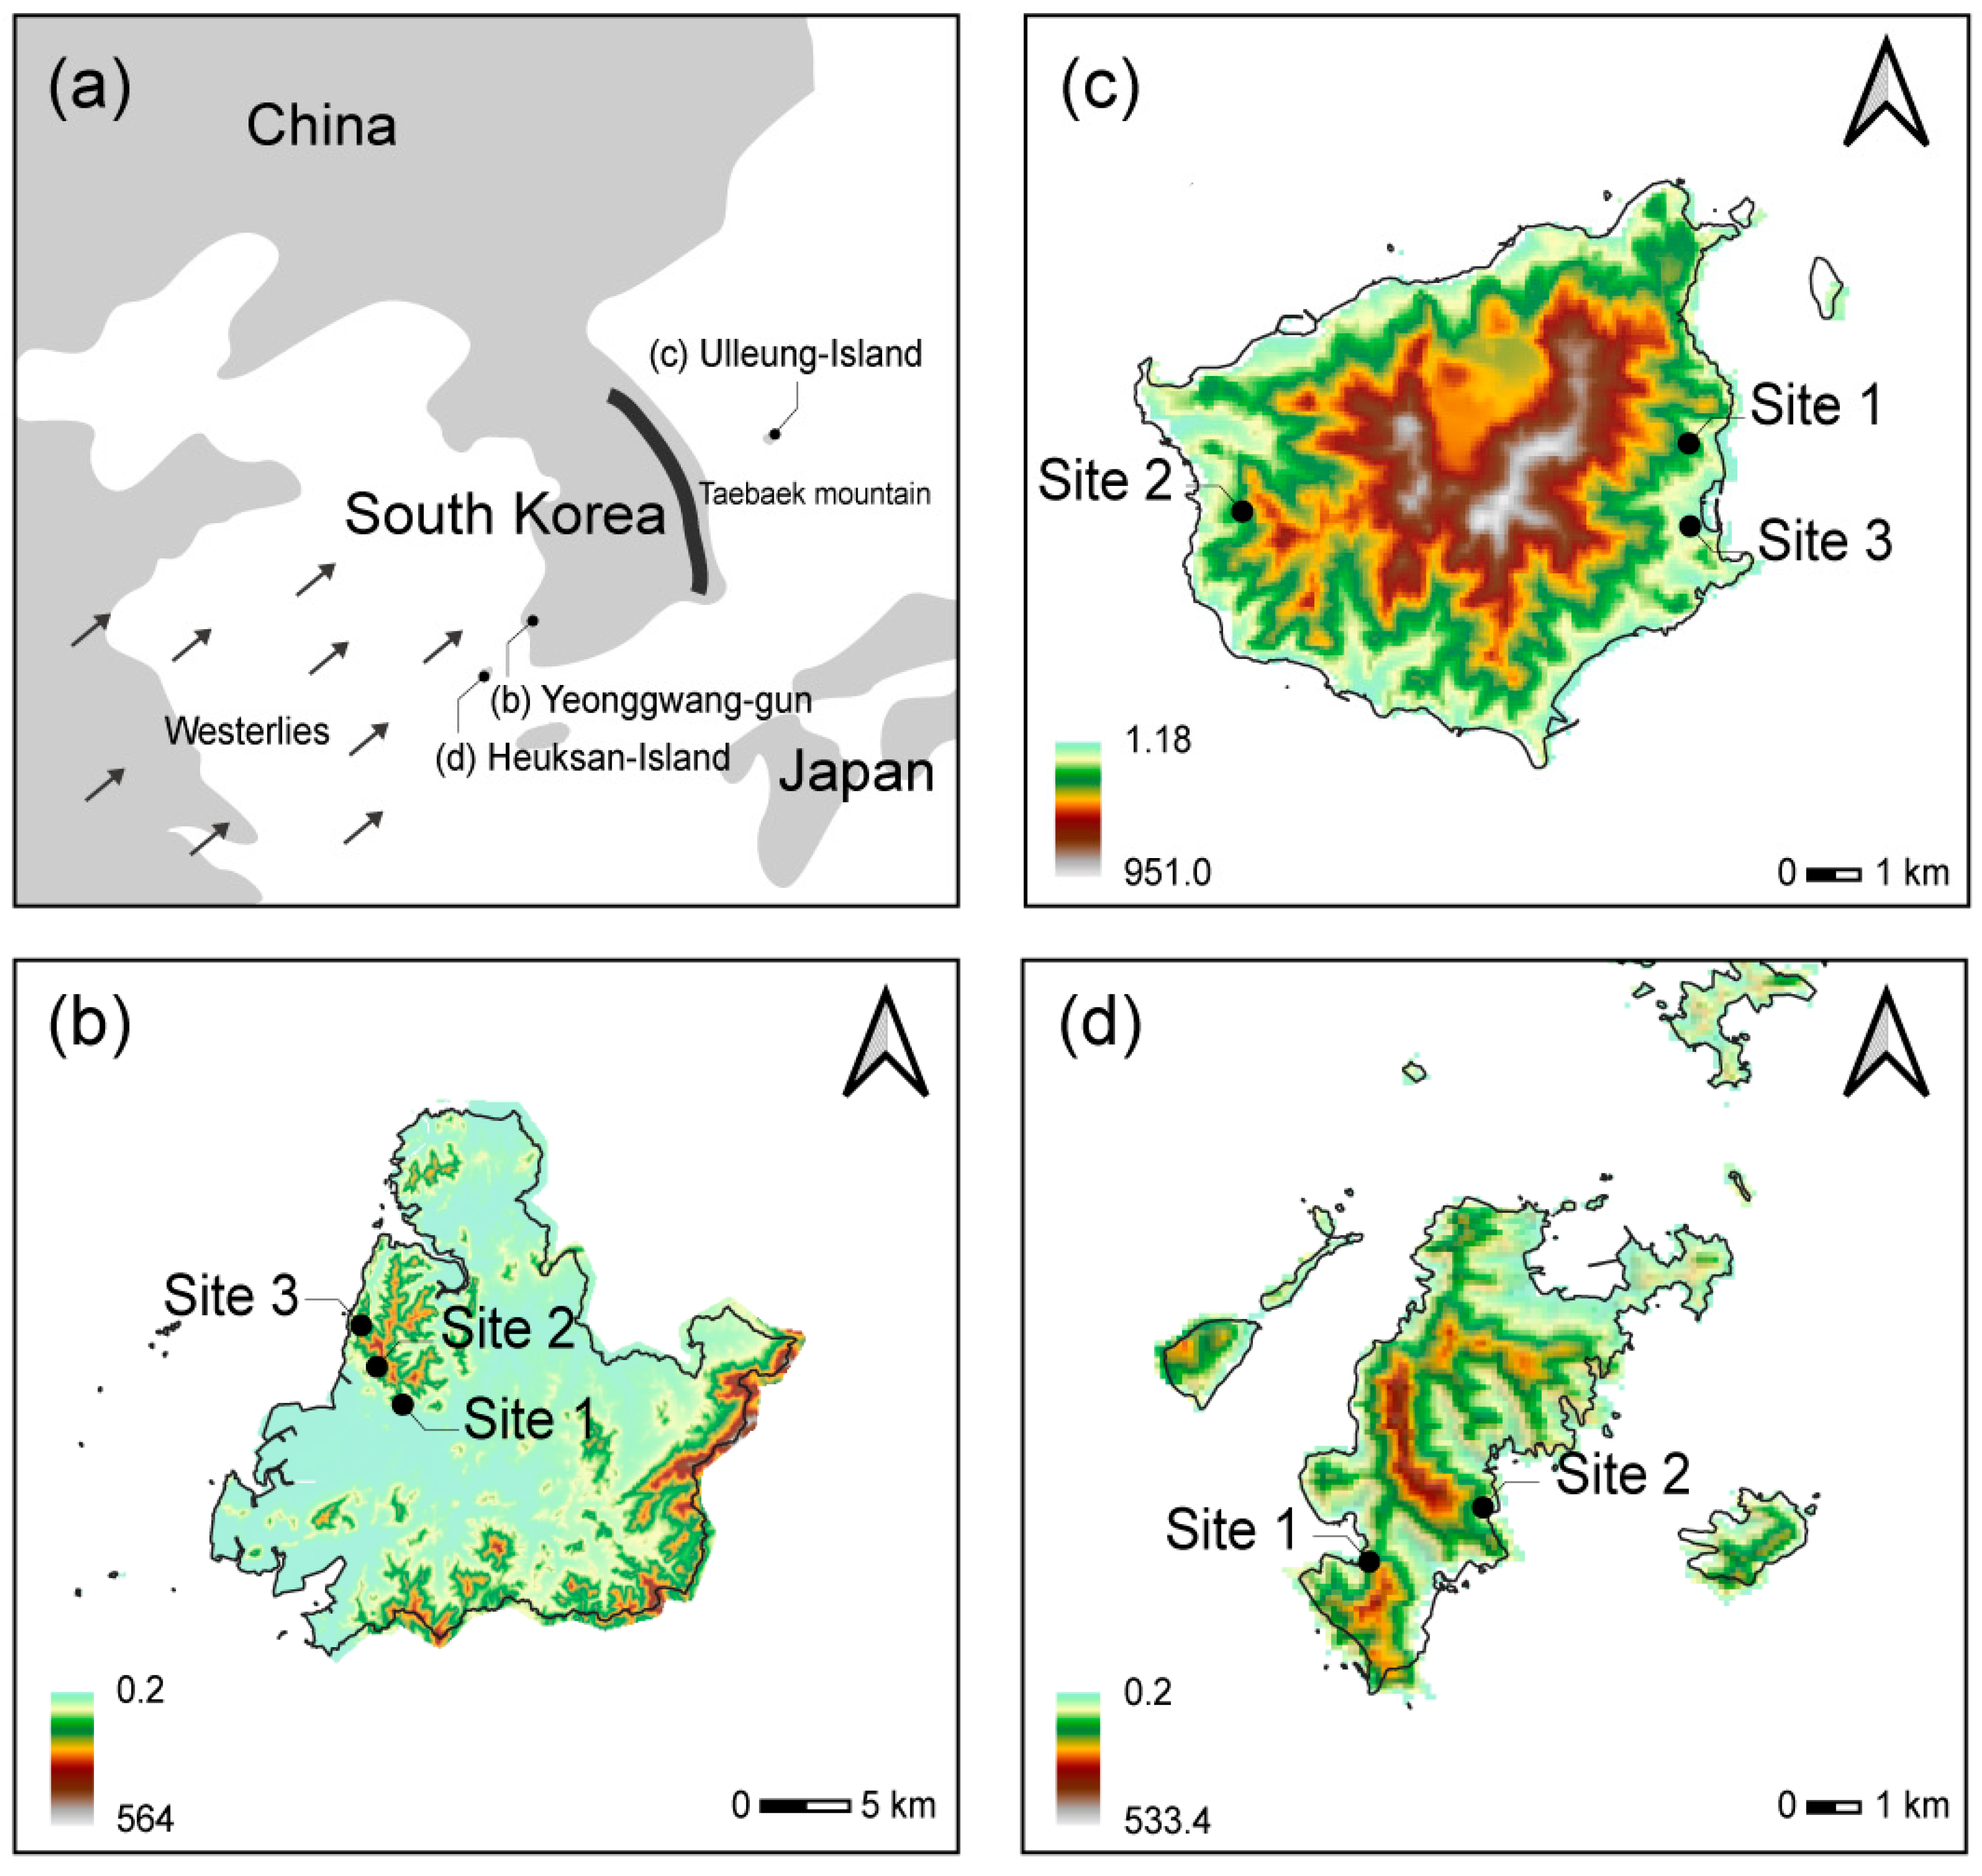
2.1. Field Investigation

A total of 268 leaf and root samples were collected and analyzed to compare their genetic diversity and confirm their genetic structure. Of these 268 samples, 104 samples were collected from three sites in Yeonggwang-gun (YG) in mainland South Korea, between March 2018 and July 2020, 68 samples were collected from three sites in Ulleung Island (UL) during April 2019, and 96 samples were obtained from two sites in Heuksan Island (HS) during February 2019 (Figure 1). HS in the West Sea and UL in the East Sea are about 100 and 130 km away from the mainland, respectively. The spring orchid samples were transferred to a laboratory and immediately stored at −30 ℃.

2.2. DNA Purification and Microsatellite Genotyping

The collected leaf or root plant tissues were ground into a fine powder under liquid nitrogen using a mortar and pestle or disrupted using a TissueLyser II (Qiagen, Hilden, Germany). Genomic DNA was extracted from the leaf and root powder using a DNeasy plant DNA isolation kit, following the manufacturer’s protocol (Qiagen). The concentration and quality of the obtained DNA were determined using NanoDrop 2000 (Thermo Fisher Scientific, Wilmington, NC, USA). Eleven microsatellites (CG415, CG649, CG709, CG722, CG1023, CG1028, CG1085, CG1210, CG1281, CG1320, and CG1400) were coamplified using the primer mixtures reported by Hyun et al. (2012) and Lee et al. (2020) [8,12]. Multiplex PCRs were performed using the method described in Hyun et al. (2012) [8]. The reaction mixture for PCR had a total volume of 10 µL, including 30 ng of genomic DNA, 1 µL of primer mixture with variable concentrations of primer pairs, and 5 µL of 2X PCR Master solution of the MultiMAX PCR kit (Intron Bio, Sungnam, Korea). Amplification was performed using 35 cycles of 20 s at 95 °C, 1 min at 58 °C, and 1 min at 72 °C using the SimpliAmp Thermal Cycler (Applied Biosystems, Foster City, CA, USA). We visualized the amplicons using the Seq-Studio Genetic Analyzer (Thermo Fisher-Applied Biosystems, Foster City, CA, USA), and evaluated the dataset for genotype errors and the presence of null alleles using GeneMapper version 6.1 (Thermo Fisher-Applied Biosystems).

2.3. Determination of Genetic Diversity and Genetic Distance

The genetic diversity and genetic distance were determined from the genotype dataset. Deviations from the Hardy–Weinberg equilibrium (HWE) and linkage disequilibrium (LD) of 11 microsatellite loci in 268 spring orchid samples were assessed using GENEPOP version 4.7 [14]. Null alleles were not present in our dataset. In all three groups (YG, UL, and HS), the loci with significant deviations from the HWE and the loci with evidence of linkage equilibrium with all loci were excluded from the analyses. We used Excel with the add-in GenAlEx version 6.5 [15] and Arlequin version 3.5 [16] to calculate the genetic diversity, diversity indices, and genetic distance of the samples. The calculated genetic diversity attributes and indices were as follows: mean number of alleles (NA), effective number of alleles (NE), observed (HO) and expected (HE) heterozygosities, Shannon’s information index (I), molecular diversity (h), and inbreeding coefficient relative to the subpopulation (FIS) of all populations.
Microsatellite genotypes of Henan samples from China (15 samples, CH) and Gunma samples from Japan (eight samples, JP) were obtained from previous data reported in Hyun et al. (2012) [8], to compare the genetic distance and population structure among the five populations (YG, UL, HS, CH, and JP). The number of multilocus genotypes showed that 11 loci are sufficient for distinguishing 291 samples, including Chinese and Japanese samples (Figure 2). The unweighted pair group method with arithmetic mean (UPGMA) was used to construct a dendrogram with genetic distances, which were obtained by GenAlEx version 6.5 using the Past 3 software [17]. The population differentiation (FST) and significant FST p-value were analyzed in all populations to compare the genetic distance among populations using Arlequin version 3.5.

2.4. Determination of Population Structure

STRUCTURE version 2.3.4. [18] with an admixture model was used to perform Bayesian clustering. This analysis allowed us to infer whether the ancestors in a population (K) have passed a portion of their genetic material to an individual (i). Each analysis consisted of 100,000 simulations after burn-in of 100,000 simulations. The ΔK method [19] in STRUCTURE Harvester [20] was used to identify the most likely K value. The range of 1 to 11 possible clusters with three independent runs each were used in STRUCTURE Harvester. Discriminant analysis of the principal components (DAPC) [21] was used to represent the identified population clusters using the “adegenet” package in R [22] to obtain the highest amount of variation. This analysis uses a discriminant function that represents a linear combination of correlated alleles in a linear discriminant analysis (LDA), through principal components (PCs) generated after reducing the dimension of genetic variation using principal component analysis [23]. We used this analysis to determine how each population of the spring orchid from the ten sampling sites were distinguishable among each other.

3. Results

3.1. Comparison of Genetic Diversity among Spring Orchids from Three Regions

NA across all 11 loci and all 268 samples was 6.318 (ranging from 3.636 to 9.818; UL1 to YG2), overall NE was 3.143 (ranging from 2.400 to 3.594; UL1 to YG2), overall HO was 0.537 (ranging from 0.389 to 0.641; UL2 to YG1), overall HE was 0.625 (ranging from 0.542 to 0.689; UL1 to YG2), overall I was 1.282 (ranging from 0.957 to 1.550; UL1 to YG2), overall FIS was 0.140 (ranging from −0.060 to 0.362; UL1 to UL2), and overall h was 0.639 (ranging from 0.560 to 0.711; UL3 to YG1).
To compare genetic diversity among groups, we compared the overall values of I, FIS, and h of each site with the overall values of I, FIS, and h of all samples. Compared to the overall I across all loci and samples, the overall I in YG (1.459) was higher, whereas the overall I in UL (1.163) and HS (1.195) were lower. Compared to the overall FIS across all loci and samples, the overall FIS in YG (0.086) was lower, whereas the overall FIS in UL (0.190) and HS (0.148) was higher than the overall FIS across all loci and samples. Compared to the overall h across all loci and samples, the overall h in YG (0.687) was higher, whereas the overall h in UL (0.619) and HS (0.596) was higher than the overall h across all loci and samples (Table 1).

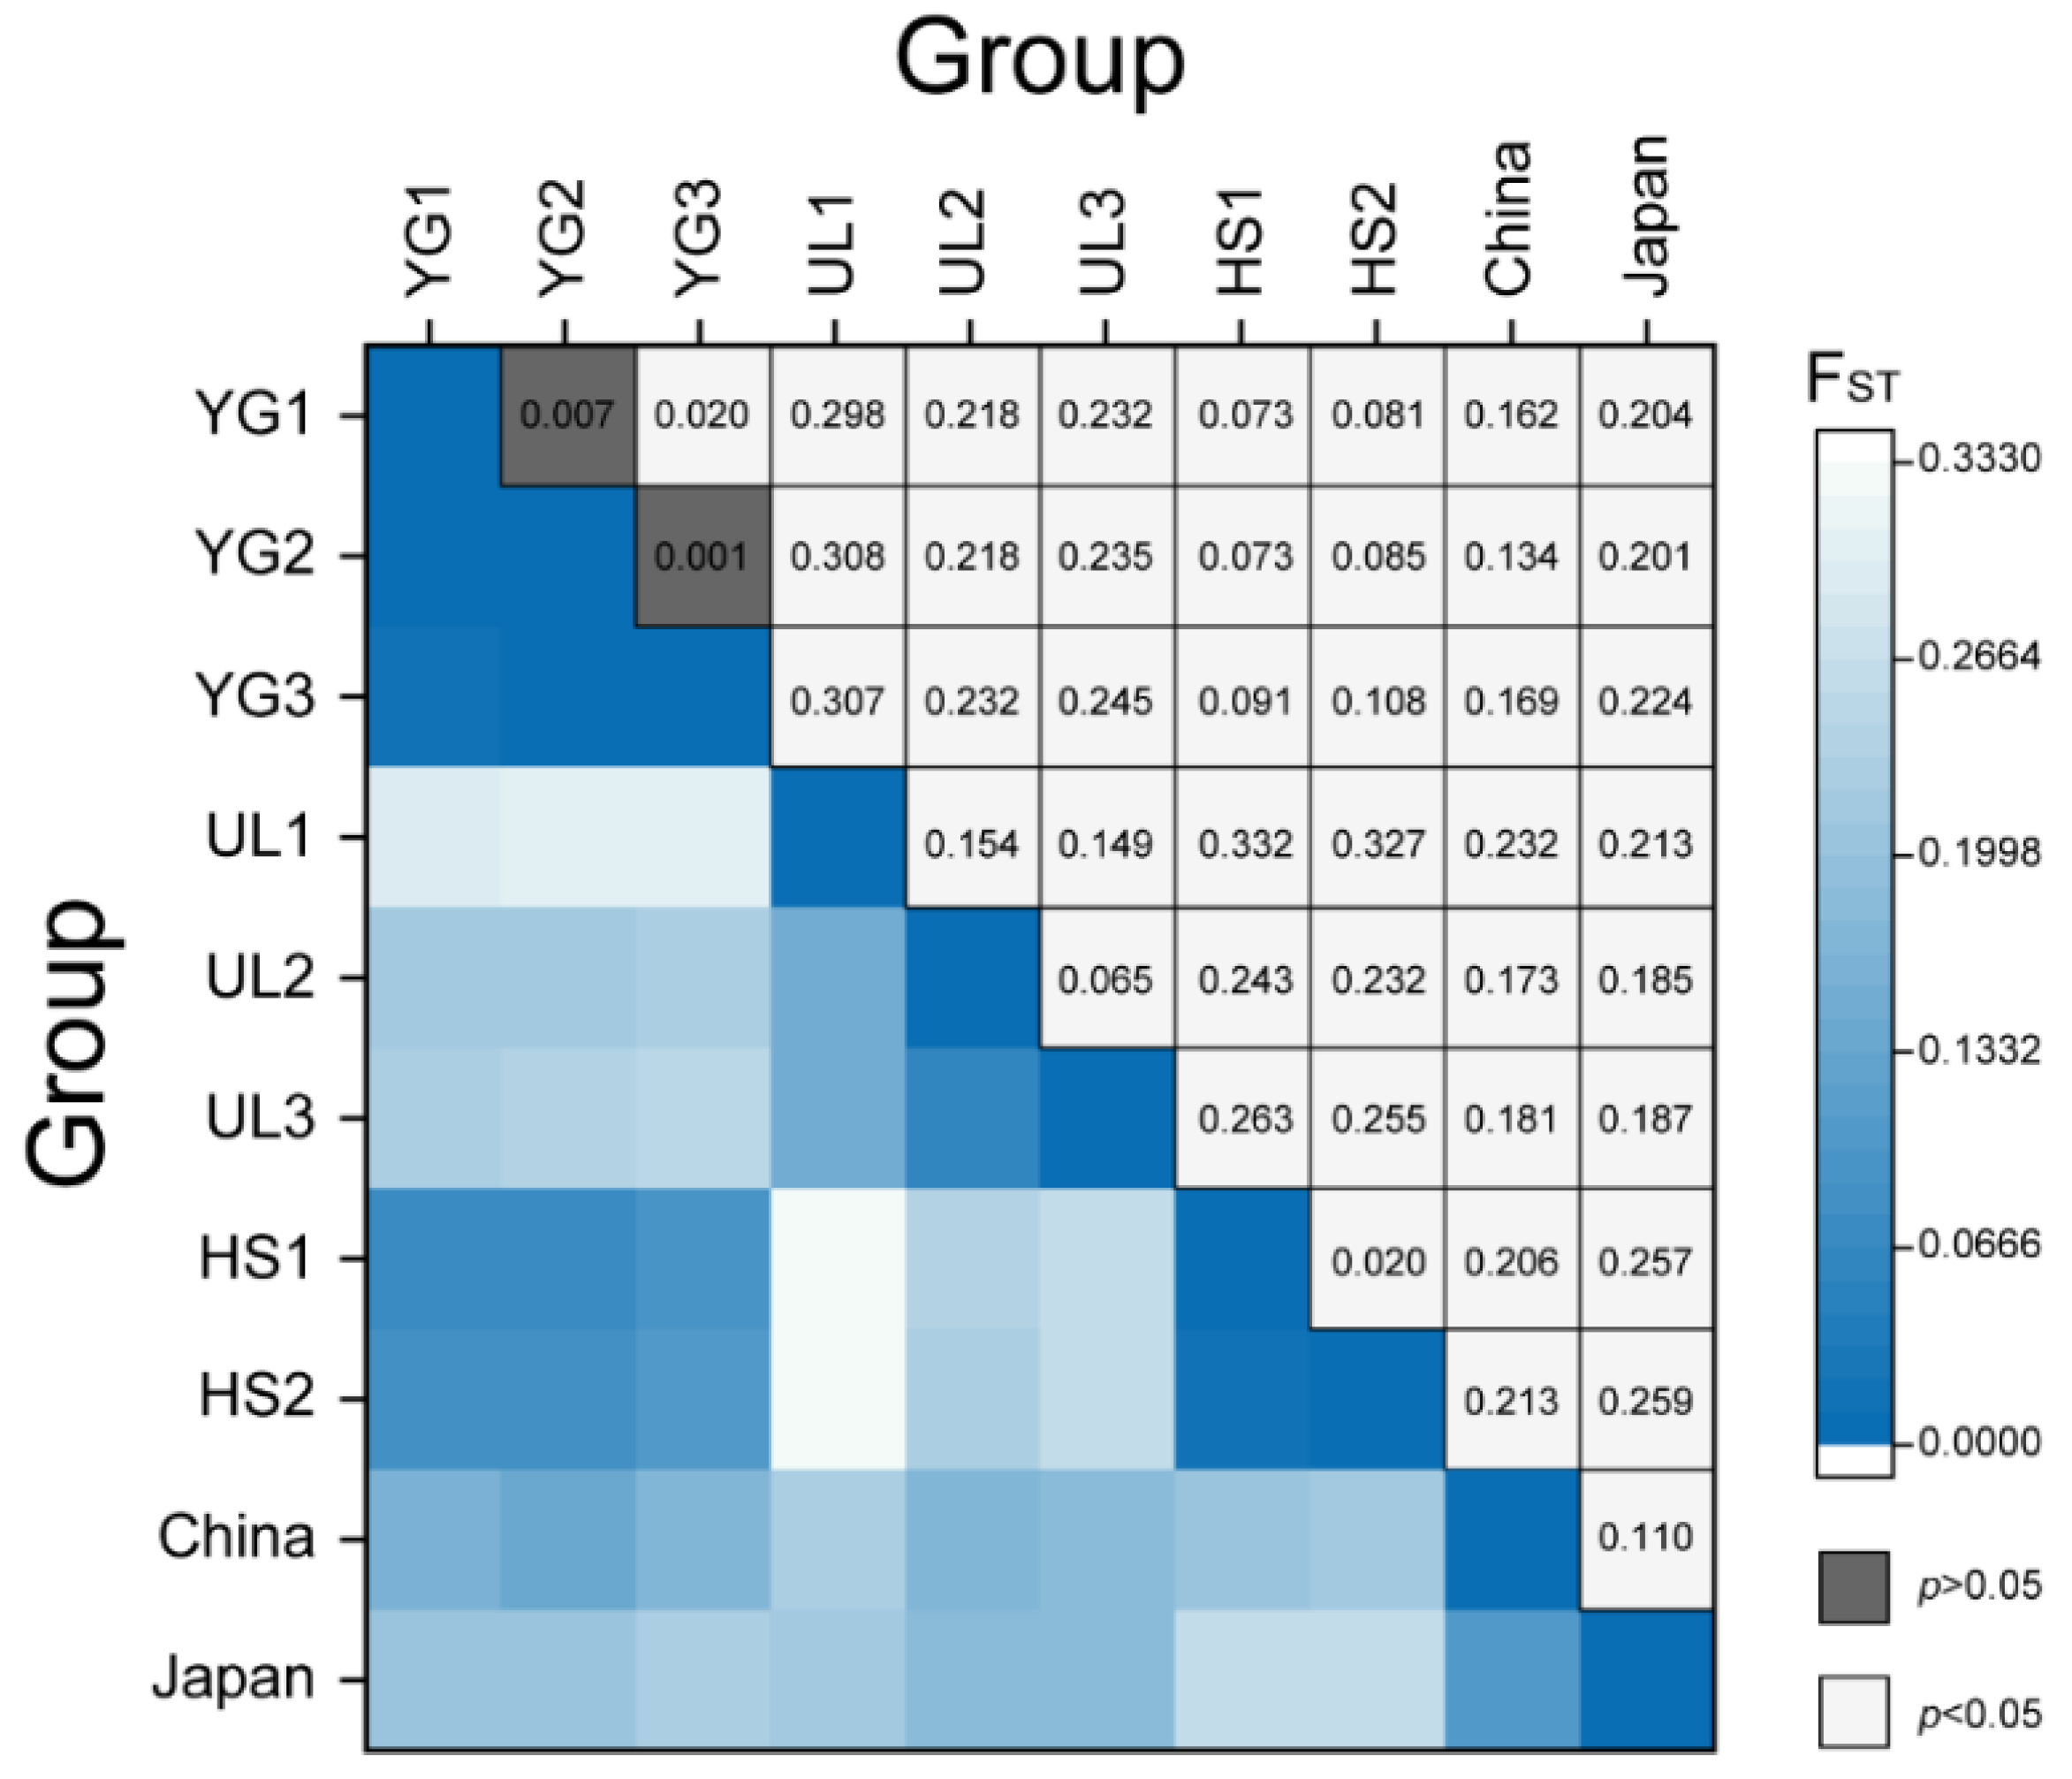
3.2. Pairwise Comparison of the Population Differentiation in Five Sites

The FST of spring orchids in the five groups were ranged from 0.001 (YG2 to YG3) to 0.332 (UL1 to HS1). The FST values were not significant between groups YG1 to YG2 (p = 0.153) and between groups YG2 to YG3 (p = 0.540).
The FST between YG and HS groups was lower than the FST between UL and YG groups and UL and HS groups. The FST between the China and the YG groups was lower than the FST between the China and UL and China and HS. The FST between the Japan and HS groups was higher than the FST between Japan and YG, the FST between Japan and UL (Figure 3).

3.3. Analysis of Population Structure from Five Sites

In the STRUCTURE Harvester analysis, the best-supported K value among the samples from the five sites (YG, UL, HS, CH and JP) was determined to be 2 (Figure 4). The UPGMA tree provided the evidence that the spring orchids in each group of the five sites (YG, UL, HS, CH, and JP) were clearly separated (Figure 5a). In STRUCTURE analysis, the spring orchids of the five sites were divided into two K clusters. YG and HS groups were determined to be derived from the same common ancestor K, and UL was identified to be derived from the same K cluster as CH and JP (Figure 5b).
With DAPC, discriminant function 1 (DF1) explained 52.06%, and DF2 explained 18.04% of the total genetic variation in spring orchids from the sampling sites. DF 1 supported the idea that the spring orchids of the groups YG and HS were assigned to the same cluster and were separated from spring orchids of the group UL. DF 1 also indicated that the spring orchids of China and Japan were assigned to the same cluster and were separated from the three other groups (YG, UL, and HS). DF2 showed that the spring orchids of the groups YG, HS, and China were assigned to the same cluster and were separated from the spring orchids of the groups UL and Japan. DF 2 indicated that the spring orchids of the group UL3 were assigned the same cluster as the spring orchids of Japan, whereas they were separated from the spring orchids of the groups UL1 and UL2 (Figure 6a). The fine-scale structures detected through DAPC separated the spring orchids from the three sites of UL, and samples of YG and HS were assigned to the same cluster. In the case of China and Japan, each group was identified as an independent cluster (Figure 6b).

4. Discussion

This study determined the genetic diversity, inbreeding coefficient, population structure, and clustering of three C. goeringii populations in South Korea through genetic polymorphic analysis of 11 microsatellites. Spring orchids from YG had relatively high genetic diversity (I and h) and low inbreeding coefficient (FIS). The genetic diversity of spring orchids from UL and HS were similar, whereas FIS was remarkably higher on UL than that on HS. Bayesian (STRUCTURE) and multivariate (DAPC) clustering methods, in addition to genetic distances (pairwise FST), indicated that the genetic structure of spring orchid populations from YG and HS were similar, whereas the populations from UL were independent.
Despite the high inbreeding levels of the small isolated island spring orchid populations with limited migratory flow, relatively high genetic diversity and low inbreeding coefficient was observed in the inland population of YG, which is located on the mainland, and in this population, only one locus deviated from the HWE. In general, sample size can affect the levels of alleles, such as Ho, He, and allele per locus [24], suggesting that inbreeding coefficient and genetic diversity can be affected, but this pattern was not seen in in our results (Table 1). In our study, the sample sizes for all populations were mostly a sample size [24] known to be stable (20 or more) than the generally described small sample sizes (5–10).
If spring orchid seeds from China were directly introduced into Korea by the yellow dust, they would occur at a much higher frequency on HS, which is closer to China, than on UL, which is far from China and has a physical barrier in the form of the Taebaek Mountains, the longest mountain range in Korea (Figure 1). However, when comparing the mean population genetic data between the populations from UL and HS, the genetic diversity of the spring orchids in these two populations was very similar. These results suggest that the inflow of spring orchids in HS, which is close to China, is very limited, and its closed population is maintained similar to that on UL. Moreover, the inbreeding coefficient of the population on UL was higher than that of the population on HS. Many studies have reported that the inbreeding rate increases with an increase in the level of habitat fragmentation [25,26,27,28]. Moreover, the over-collection of C. goeringii in the field is negatively correlated with genetic differentiation and kinship [29]. This species usually inhabits relatively low hills or mountains in East Asian countries [1,30,31]. Although the area of UL (72.9 km2) is larger than that of HS (20.0 km2), UL has a high-altitude forest in the middle of the island, which is not the case on HS (Figure 1). These geographic features seem to limit the living space of spring orchids on these islands, thereby increasing inbreeding.
The STRUCTURE analysis, DAPC, and pairwise-FST showed that the population of UL has developed independently from the populations in YG and HS. STRUCTURE analysis indicated that the population of UL was genetically separated from the populations of YG and HS, but was closely linked to the populations of China and Japan. DAPC and pairwise-FST also showed that the population of UL was genetically closer to the populations of China and Japan than to the populations in YG and HS from Korea. This result implied that the population of spring orchids inhabiting YG and HS may have not originated from China by yellow dust winds.
As the first population genetic study of spring orchids distributed in the small distant islands, our study suggests that the genetic diversities of small isolated populations are slightly lower than that of the inland population and are genetically separated from the inland population. In addition, this study concluded that the contribution of yellow dust to the spring orchid distribution in the west of Korea was absent or very weak. This study will be useful for understanding the genetic diversity and population structure of isolated populations, and for the conservation of C. goeringii.

Author Contributions

K.W.C. and Y.D.; molecular analyses, S.W.N., J.S.Y., and D.E.N.; statistical analysis, S.W.N., J.-K.P. and Y.D.; data curation and writing, K.W.C. and Y.D. All authors have read and agreed to the published version of the manuscript.

Funding

This study was supported by the National Research Foundation (grant numbers 2018R1C1B3008645 and 2019R1A2C1087547), Republic of Korea, and by Kongju National University.

Acknowledgments

We sincerely thank the residents of Ulleung- Island, Heuksan- Island, and Yeonggwang-gun for their help with the collection of C. goeringii.

Conflicts of Interest

The authors declare no conflict of interest. The funders had no role in the design of the study, in the collection, analyses, or interpretation of data, in the writing of the manuscript, or in the decision to publish the results.

References

  1. DuPuy, D.; Cribb, P.J. The Genus Cymbidium; Christopher Helm: London, UK, 1988. [Google Scholar]
  2. Dressler, R.L. Phylogeny and Classification of the Orchid Family; Cambridge University Press: Cambridge, UK, 1993. [Google Scholar]
  3. Obara-Okeyo, P.; Kako, S. Genetic diversity and identification of Cymbidium cultivars as measured by random amplified polymorphic DNA (RAPD) markers. Euphytica 1998, 99, 95–101. [Google Scholar] [CrossRef]
  4. Suetsugu, K. Autonomous self-pollination and insect visitors in partially and fully mycoheterotrophic species of Cymbidium (Orchidaceae). J. Plant Res. 2015, 128, 115–125. [Google Scholar] [CrossRef] [PubMed]
  5. Varshney, R.K.; Graner, A.; Sorrells, M.E. Genic microsatellite markers in plants: Features and applications. Trends Biotechnol. 2005, 23, 48–55. [Google Scholar] [CrossRef] [PubMed]
  6. Moe, K.T.; Zhao, W.; Song, H.S.; Kim, Y.H.; Chung, J.W.; Cho, Y.I.; Park, P.H.; Park, H.S.; Chae, S.C.; Park, Y.J. Development of SSR markers to study diversity in the genus Cymbidium. Biochem. Syst. Ecol. 2010, 38, 585–594. [Google Scholar] [CrossRef]
  7. Huang, J.L.; Zeng, C.X.; Li, H.T.; Yang, J.B. Isolation and characterization of 15 microsatellite markers from the spring orchid (Cymbidium goeringii) (Orchidaceae). Am. J. Bot. 2011, 98, e76–e77. [Google Scholar] [CrossRef]
  8. Hyun, Y.S.; Kim, J.; Chung, K.W. Development of polymorphic microsatellite markers for Cymbidium goeringii (Orchidaceae). Am. J. Bot. 2012, 99, e193–e198. [Google Scholar] [CrossRef]
  9. Tang, M.; Zeng, C.X.; Bi, Y.F.; Yang, J.B. Microsatellite markers for the Chinese endangered and endemic orchid Cymbidium tortisepalum (Orchidaceae). Am. J. Bot. 2012, 99, e11–e13. [Google Scholar] [CrossRef]
  10. Li, X.; Jin, F.; Jin, L.; Jackson, A.; Huang, C.; Li, K.; Shu, X. Development of Cymbidium ensifolium genic-SSR markers and their utility in genetic diversity and population structure analysis in cymbidiums. BMC Genet. 2014, 15, 124. [Google Scholar] [CrossRef] [Green Version]
  11. Liu, X.; Huang, Y.; Li, F.; Xu, C.; Chen, K. Genetic diversity of 129 spring orchid (Cymbidium goeringii) cultivars and its relationship to horticultural types as assessed by EST-SSR markers Author links open overlay panel. Sci. Hort. 2014, 174, 178–184. [Google Scholar] [CrossRef]
  12. Lee, H.J.; Park, H.R.; Lee, A.J.; Nam, D.E.; Lee, D.G.; Do, Y.; Chung, K.W. Genetic authentication of cultivars with flower-variant types using SSR markers in spring orchid Cymbidium goeringii. Hort. Environ. Biotechnol. 2020, 61, 577–590. [Google Scholar] [CrossRef]
  13. Kang, D.; Kim, J.E. Fine, ultrafine, and yellow dust: Emerging health problems in Korea. J. Korean Med. Sci. 2014, 29, 621–622. [Google Scholar] [CrossRef] [PubMed] [Green Version]
  14. Rousset, F. Genepop’007: A complete re-implementation of the genepop software for Windows and Linux. Mol. Ecol. Resour. 2008, 8, 103–106. [Google Scholar] [CrossRef]
  15. Peakall, P.; Smouse, P.E. GenAlEx 6.5: Genetic analysis in Excel. Population genetic software for teaching and research—An update. Bioinformatics 2012, 28, 2537. [Google Scholar] [CrossRef] [PubMed] [Green Version]
  16. Excoffier, L.; Lischer, H.E. Arlequin suite ver 3.5: A new series of programs to perform population genetics analyses under Linux and Windows. Mol. Ecol. Resour. 2010, 10, 564–567. [Google Scholar] [CrossRef] [PubMed]
  17. Hammer, Ø.; Harper, D.A.T.; Ryan, P.D. PAST: Paleontological statistics software package for education and data analysis. Palaeontol. Electron. 2001, 4, 9. [Google Scholar]
  18. Pritchard, J.K.; Stephens, M.; Donnelly, P. Inference of population structure using multilocus genotype data. Genetics 2000, 155, 945–959. [Google Scholar] [PubMed]
  19. Evanno, G.; Regnaut, S.; Goudet, J. Detecting the number of clusters of individuals using the software structure: A simulation study. Mol. Ecol. 2005, 14, 2611–2620. [Google Scholar] [CrossRef] [PubMed] [Green Version]
  20. Earl, D.A. Structure harvester: A website and program for visualizing STRUCTURE output and implementing the Evanno method. Conserv. Genet. Resour. 2012, 4, 359–361. [Google Scholar] [CrossRef]
  21. Jombart, T.; Devillard, S.; Balloux, F. Discriminant analysis of principal components: A new method for the analysis of genetically structured populations. BMC Genet. 2010, 11, 94. [Google Scholar] [CrossRef] [Green Version]
  22. Jombart, T. Adegenet: A R package for the multivariate analysis of genetic markers. Bioinformatics 2008, 24, 1403–1405. [Google Scholar] [CrossRef] [Green Version]
  23. Waraniak, J.M.; Fisher, J.D.L.; Purcell, K.; Mushet, D.M.; Stockwell, C.A. Landscape genetics reveal broad and fine-scale population structure due to landscape features and climate history in the northern leopard frog (Rana pipiens) in North Dakota. Ecol. Evol. 2019, 9, 1041–1060. [Google Scholar] [CrossRef] [PubMed] [Green Version]
  24. Pruett, C.L.; Winker, K. The effects of sample size on population genetic diversity estimates in song sparrows Melospiza melodia. J. Avian Biol. 2008, 39, 252–256. [Google Scholar] [CrossRef]
  25. Honnay, O.; Jacquemyn, H.; Bossuyt, B.; Hermy, M. Forest fragmentation effects on patch occupancy and population viability of herbaceous plant species. New Phytol. 2005, 166, 723–736. [Google Scholar] [CrossRef] [PubMed]
  26. Lowe, A.J.; Boshier, D.; Ward, M.; Bacles, C.F.E.; Navarro, C. Genetic resource impacts of habitat loss and degradation; reconciling empirical evidence and predicted theory for neotropical trees. Heredity 2005, 95, 255–273. [Google Scholar] [CrossRef] [PubMed] [Green Version]
  27. Honnay, O.; Jacquemyn, H. Susceptibility of common and rare plant species to the genetic consequences of habitat fragmentation. Conserv. Biol. 2007, 21, 823–831. [Google Scholar] [CrossRef] [PubMed]
  28. Aguilar, R.; Quesada, M.; Ashworth, L.; Herrerias-Diego, Y.; Lobo, J. Genetic consequences of habitat fragmentation in plant populations: Susceptible signals in plant traits and methodological approaches. Mol. Ecol. 2008, 17, 5177–5188. [Google Scholar] [CrossRef]
  29. Chung, M.Y.; Nason, J.D.; Chung, M.G. Significant demographic and fine-scale genetic structure in expanding and senescing populations of the terrestrial orchid Cymbidium goeringii (Orchidaceae). Am. J. Bot. 2011, 98, 2027–2039. [Google Scholar] [CrossRef]
  30. Liu, Z.J.; Chen, S.C.; Ru, Z.Z.; Chen, L.J. The Genus Cymbidium in China; Science Press: Beijing, China, 2006; pp. 195–198. [Google Scholar]
  31. Wang, H.Z.; Wu, Z.X.; Lu, J.J.; Shi, N.N.; Zhao, Y.; Zhang, Z.T.; Liu, J.J. Molecular diversity and relationships among Cymbidium goeringii cultivars based on inter-simple sequence repeat (ISSR) markers. Genetica 2009, 136, 391–399. [Google Scholar] [CrossRef]
Figure 1. Sampling sites of spring orchids (Cymbidium goeringii Lindley) from (a) South Korea, (b) Yeonggwang-gun, (c) Ulleung Island, and (d) Heuksan Island. Different colors on the map indicate different elevations (m). Arrows indicate the direction of the yellow dust winds (westerlies).
Diversity 12 00486 g001
Figure 2. Relationship between the number of multilocus genotypes and the number of loci in 291 individuals of the spring orchid. When the number of loci was seven or higher, the 291 individuals could be 100% separated.
Diversity 12 00486 g002
Figure 3. A heatmap showing paired FST values among spring orchids from Yeonggwang-gun (YG), Ulleung Island (UL), Heuksan Island (HS), China, and Japan. The numbers in the box represent paired FST values between groups. Dark colored boxes with FST values indicate that the FST value is not significant (p > 0.05), whereas light colored boxes with FST values indicate that the FST value is significant (p < 0.05).
Diversity 12 00486 g003
Figure 4. The best suitable K-means obtained by the ΔK method in STRUCTURE Harvester. The range of 1 to 11 possible clusters with three independent runs were obtained at 100,000 simulations after a burn-in of 100,000 simulations.
Diversity 12 00486 g004
Figure 5. Population clustering by genetic distance and Bayesian clustering algorithms. (a) Tree obtained by unweighted pair group method with arithmetic mean (Euclidean algorithm) among the spring orchids from Yeonggwang-gun (YG), Ulleung Island (UL), Heuksan Island (HS), China (CH), and Japan (JP). (b) Two main split clusters obtained by STRUCTURE analysis among the spring orchids from the five sites.
Diversity 12 00486 g005
Figure 6. Population clustering analysis by discriminant analysis of principal components (DAPC). (a) Discriminant function 1 (DF1) explained 52.06% and DF2 explained 18.04% of the genetic variation in spring orchids from ten sites. Each node represents the genotype of a spring orchid connected to a centroid, was assigned based on the clustering of the DAPC scores. The dotted line represents the spanning tree among spring orchids from ten sites. (b) Membership probability of DAPC determined that the sampled individuals were optimally clustered into seven groups, whereas the sampling sites of YG and HS were clustered into each two group.
Diversity 12 00486 g006
Table 1. Genetic diversity and diversity indices of 11 nuclear microsatellite loci estimated for eight sampling sites of the spring orchid (Cymbidium goeringii Lindley).
GroupNNaNeHoHeIFISh
YG1186.6363.3870.6410.6571.3770.0370.711
YG2549.8183.5940.6360.6891.5500.0930.674
YG3328.1823.5040.5710.6561.4510.1270.676
UL1163.6362.4000.5800.5420.957−0.0600.636
UL2365.8183.1720.3890.6371.2710.3620.660
UL3165.0913.2860.4490.6411.2610.2680.560
HS1525.5452.8990.5560.5891.1940.0510.595
HS2445.8182.9030.4770.5911.1950.2440.597
Overall 6.3183.1430.5370.6251.2820.140.639
Yeonggwang-gun (YG), Ulleung Island (UL), Heuksan Island (HS), sample size (N), mean number of alleles (Na), number of effective alleles (Ne), Shannon’s information index (I), observed heterozygosity (Ho), expected heterozygosity (He), inbreeding coefficient relative to the population (FIS), molecular diversity indices (number of different alleles, h).
Publisher’s Note: MDPI stays neutral with regard to jurisdictional claims in published maps and institutional affiliations.

