Article

Macroinvertebrate Taxonomic Richness in Minimally Disturbed Streams on the Southeastern USA Coastal Plain

1
Environmental Sciences and Biotechnology Section, Savannah River National Laboratory, Savannah River Site, Aiken, SC 29808, USA
2
SGW-Remediation Support, Savannah River Site, Aiken, SC 29808, USA
3
ETT Environmental, 4 Craftsman Ct, Greer, SC 29650, USA
*
Author to whom correspondence should be addressed.
Diversity 2020, 12(12), 459; https://doi.org/10.3390/d12120459
Submission received: 20 October 2020 / Revised: 19 November 2020 / Accepted: 27 November 2020 / Published: 1 December 2020

Abstract

:
Collections made over 20 years with a multiple habitat sampling protocol and Hester–Dendy artificial substrate samplers were used to assess macroinvertebrate genera richness in first- to fourth-order streams on the Savannah River Site (SRS), a 780-km2, U.S. government reservation on the upper South Carolina, USA, coastal plain. We collected 312 genera representing 114 families including 268 genera and 87 families of insects. The total number of genera from each stream averaged 139 (97–194) with totals of 171–261 for drainages with more than one stream. Larger streams supported more macroinvertebrate genera, but small headwater streams supported genera not found in higher-order streams and contributed to drainage-wide richness. Sampling effort expressed as number of individuals collected or sites sampled and sampling duration influenced genera richness more than other factors. Genera accumulation curves showed that full representation of richness required several years of sampling and the inclusion of sampling sites that represented all habitats. Upper Three Runs, known for high insect species richness, was the most genera-rich stream, but richness was nearly comparable in other streams after adjusting for sampling effort. Some SRS streams are minimally exposed to anthropogenic disturbance, making them relatively unique in the southeastern USA Sand Hills and valuable as reference models.

1. Introduction

Biodiversity is currently declining in freshwaters because of pollution, invasive species, land use changes, hydrological alterations, and other factors. Freshwater biodiversity losses are fairly well documented for fish but are less understood for other organisms including benthic macroinvertebrates in lotic environments [1,2]. Benthic macroinvertebrates are a major source of freshwater biodiversity, play essential functional roles in stream ecosystems, and are useful for evaluating the ecological quality of aquatic ecosystems [1,3,4]. The taxonomic richness of the entire benthic assemblage or of particular benthic groups is commonly used to describe lotic macroinvertebrate communities and is frequently measured as an indicator of stream health [5]. However, understanding changes in macroinvertebrate taxonomic richness necessitates recognition of factors that affect it including sampling issues that influence its estimation.
The most frequently used measure of biodiversity is species richness, the number of species in a sample or specific area. However, studies of freshwater macroinvertebrates are frequently conducted at the genus or family level of taxonomic resolution because species-level distinctions are poorly understood, difficult in some groups (e.g., Chironomidae), and because diagnostic characteristics are often lacking for larval stages. The accurate measurement of macroinvertebrate taxonomic richness is difficult, as it is for other types of assemblages. The number of taxa is invariably underestimated by sampling, and the comparison of taxonomic richness across assemblages is strongly influenced by sampling effort. The effect of sampling effort on richness estimates is classically described by taxa accumulation curves that depict the increase in number of taxa that occurs as sampling effort increases [6,7,8]. Sampling effort is often expressed as the area sampled (taxa–area relationship) but can also be expressed as the number of samples collected or individual organisms collected. The temporal analogue of this relationship is the taxa–time relationship, which describes the increase in richness that occurs with increasing number of sampling events or sampling duration [9]. Both taxa–area and taxa–time relationships are attributable to passive sampling effects (the observation of more taxa as more individuals are surveyed) and ecological processes. The latter include the addition of different habitats that support different taxa as sample area increases and taxa turnovers resulting from habitat changes and species dispersals as sampling duration increases.
Because the observed number of taxa almost always underestimates the actual number of taxa, a variety of taxa-richness estimators are used to approximate complete richness in a sample [8]. Among the more popular are nonparametric estimators like the first- and second-order jackknife, Chao 1 and 2, and bootstrap, which use information on the numerical distribution of individuals among taxa in an assemblage to estimate total richness [8]. Richness estimators are usually used over small spatial scales where passive sampling effects are largely driving increases in taxa number but can estimate richness over larger areas with heterogeneous habitats if combined with sampling designs that adequately reflect habitat heterogeneity [10,11].
Taxonomic richness is reflective of factors operating at different temporal and spatial scales including large-scale geographic, geological, and climatological factors that influence regional biodiversity and niche diversity, biological interactions, and anthropogenic disturbances that influence biodiversity at local scales by acting as filters on the regional species pool [12]. Numerous ecological factors influence the number of taxa in a macroinvertebrate assemblage. The River Continuum Concept (RCC) emphasizes longitudinal changes in stream ecosystems including progressive downstream shifts in physical gradients and changing energy inputs that produce shifts in trophic organization and assemblage composition [13]. It predicts peak macroinvertebrate taxonomic richness in streams of intermediate size where habitat and niche diversity are maximized by high environmental variability and a variety of autochthonous and allochthonous food sources. An alternative perspective, herein termed Stream Network Theory (SNT), stresses the network structure of streams within a drainage and posits that high beta diversity among diverse headwater streams produces high gamma diversity within the basin, as a whole [14]. High beta diversity among headwaters is a consequence of the relative isolation of headwaters coupled with differing environmental conditions that create a variety of habitats.
Analysis of macroinvertebrate taxonomic richness together with analyses of community composition and the functional traits of benthic organisms are important in the assessment of ecosystem degradation and recovery [4,15,16]. Sites relatively free of anthropogenic disturbances are especially important because they provide baselines (sometimes termed reference models) to measure degradation and recovery from disturbance. In this study, we estimated macroinvertebrate taxonomic richness in several streams in a relatively undisturbed region on the upper South Carolina, USA, coastal plain. Many were “blackwater” streams, a distinctive resource on the coastal plain that supports unique and diverse assemblages [17]. The streams include Upper Three Runs, which has been described as the most speciose stream in the Western Hemisphere [18]. We made use of an unusual long-term data set to (1) document taxonomic richness in the streams, (2) examine factors that influenced taxonomic richness including effects of sampling effort, (3) evaluate observed richness patterns in terms of expectations of the RCC and SNT, and, (4) after adjusting for sampling effort, compare taxonomic richness among streams including other streams discussed in the literature.

2. Materials and Methods

2.1. Study Area

The data were collected in conjunction with environmental monitoring programs conducted at the Savannah River Site (SRS), a 780-km2, US Department of Energy reservation near Aiken, South Carolina, USA, established in 1951 to produce nuclear materials. The SRS is largely forested with scattered industrial areas and no permanent human habitation. It is in the Sand Hills ecoregion, which covers about 20,600 km2 in the southeastern USA coastal plain bordering the fall line [19]. The Sand Hills have deep sands mixed with clay and silt and are dominated by conifers such as longleaf pine (Pinus palustris) plus oaks and other hardwoods. Many of the larger streams are “blackwater,” low-gradient, slow-flowing, and fed by water seeping through sandy soils that underlie floodplains and swamps. The water is stained by decaying organic matter, usually acidic, and with little suspended sediment [20]. Snags and other large, woody material are the predominant instream structure providing habitat and often forming debris dams that affect stream geomorphology [21].
The SRS includes five major stream systems that discharge into the Savannah River: Upper Three Runs (UTR), Fourmile Branch (FMB), Pen Branch (PB), Steel Creek (SC), and Lower Three Runs (LTR) (Figure 1). UTR is the largest stream, with approximately 250 km2 of watershed within the SRS and several tributaries including Tinker Creek (TC), Tims Branch (TB), Crouch Branch (CB), and McQueen Branch (MB). FMB is a 24-km-long stream with a 57-km2 watershed that lies entirely within the SRS. PB and its tributary Indian Grave Branch (IGB) are entirely within the SRS and similar in size to FMB. SC and its major tributary, Meyers Branch (MB), are also located entirely on the SRS. The upper reaches of SC were impounded in 1985 to create a 400-ha cooling reservoir. LTR drains the southeastern portion of the SRS. Its upper reaches were dammed to form a 1012-ha reservoir formerly used as a source of reactor cooling water.
Some SRS streams have been minimally disturbed since the SRS was created in 1951 including most of UTR and TC, upper and middle PB, and MB. In contrast, FMB, IGB, lower PB, and middle and lower SC formerly received heated cooling water from nuclear reactors causing extensive habitat destruction and elimination of most aquatic biota. Recovery of these streams through secondary succession began with reactor shutdowns between 1968 and 1988 (depending upon the stream) and was further aided by reductions in other industrial activities within most watersheds. Although low levels of nonradioactive and radioactive contaminants are still detectable in some locations [22], recovery of these formerly impacted streams has been extensive, and they currently support more biodiverse fish assemblages than most streams within the region [23].

2.2. Macroinvertebrate Sampling

Macroinvertebrates were collected with a Multiple Habitat Sampling Protocol [MHSP] and Hester–Dendy (HD) multiplate artificial substrates [24,25]. The MHSP consisted of collecting macroinvertebrates from natural substrates for three person-hours at each sampling site on each sampling date. All available natural habitats were sampled with a D-frame dip net, kick net, hand sieve, white plastic pan, and fine mesh sampler. The MHSP is designed to ensure that all habitats are sampled and resembles protocols used by many agencies [26,27]. HDs provide a uniform substrate for macroinvertebrate colonization, which can reduce the influence of steam substrate differences on assemblage composition among sites. Each HD sampler consisted of 14 7.6-cm plates separated by about 0.3–1.0 cm (total surface area of 0.18 m2). The HD samplers were hung from a line stretched across the stream to avoid bottom contact and retrieved after about 28 days of colonization.
The MHSP was used to collect 100 macroinvertebrate samples from 39 sites in the SRS streams during 1997, 2000, 2003, 2007, and 2017, although not all sites were sampled in all years (Figure 1, Table 1). HDs were used to collect 85 macroinvertebrate samples from 39 sites concurrently with MHSP sampling (Table 1). Five HD samplers were deployed at each site in 1997, 2000, and 2007, and two were deployed at each site in 2017. HD samples were not collected in 2003. All specimens were preserved in 70% ethanol and taken to the laboratory for microscopic identification. All samples were collected during November and December to minimize variation associated with seasonal changes.
Taxonomic identifications, usually to genus or species level, were performed by experts on regional macroinvertebrate fauna employing appropriate references [28,29,30,31,32,33,34,35,36,37,38]. All identifications were performed by ETT Environmental, Greenville, SC, under the supervision of the same personnel, ensuring consistency among samples and over time.
Stream width near the water surface at each site was measured before or after macroinvertebrate sampling at 7–12 evenly spaced transects across the stream, perpendicular to the direction of water flow. Strahler stream order was determined from U.S. Geological Survey topographical maps.

2.3. Data Analysis

Most (over 97%) of the collected organisms were identified to genus or species (others were mostly damaged, larval or early instar, or members of difficult groups such as annelids) However, the genus level of resolution was used for analysis because it was consistently presented for most taxa. HD and MHSP data from all sample sites over all collection periods were combined to calculate the total number of genera (i.e., observed genera richness) in each stream and stream drainage (for drainages that included more than one sampled stream). We used the Chao 1 nonparametric estimator to estimate complete richness for each stream and drainage because observed richness typically underestimates complete richness. The Chao 1 is based on the presence of rare species represented by only one individual (singletons) or two individuals (doubletons) in a list of taxa abundances [8].
Simple and multiple linear regression models were used to investigate relationships between predictor (independent) variables and observed genus richness (dependent variable) at each sample site. Predictor variables included number of organisms collected, number of samples taken, average number of genera in each sample, average width of the stream, total number of samples from the stream, number of years the stream was sampled, number of sample sites in the stream, and a qualitative overall anthropogenic disturbance score. The latter was based on contaminant levels in environmental media collected from each stream plus information concerning historical impacts [22]. Regression analysis was repeated with observed richness from each stream within each drainage (all sample sites from the stream combined) rather than observed richness from each sample site as the dependent variable. The order in which independent variables were entered in the regression models was based on theoretical considerations rather than on automated methods (e.g., stepwise regression). Only MHSP data were used in the regressions to avoid problems associated with inconsistent HD sampling effort. Preliminary testing indicated that the assumptions of normality and homogeneity of variance were generally met, making transformations unnecessary. Regression was conducted with SigmaPlot [39].
Sorenson and Jaccard dissimilarities were compared between headwater sample sites (stream orders 1 and 2) and higher-order (3 and 4) sample sites to determine if faunal heterogeneity was greater in the former based on the assumption that greater dissimilarity reflects greater heterogeneity. Both types of dissimilarities were calculated among all possible pairs of samples from each group of sites and averaged. Jaccard similarities are based on presence-absence while Bray–Curtis similarities are based on quantitative data, thereby reflecting differences in relative abundance as well as occurrence. Dissimilarity coefficients were calculated with PcOrd [40].
The effects of sampling effort (expressed as number of sites sampled and organisms collected) on observed richness were investigated using MHSP data collected during 2007 from 13 sites in UTR, the most thoroughly sampled stream and year in the study. Genera accumulation curves (GACs) were generated by plotting the increase in cumulative mean genera richness as progressively greater numbers of sample sites and associated collected organisms were pooled. Mean richness for each pool of sample sites was computed from 100 random sites selections without replacement, and the order of site selection was ignored.
The GAC was recalculated with different subsets of the 13 UTR sample sites to investigate the effects of sample site selection on estimates of genera richness. Seven sites were randomly selected from the 13 sites to represent random site selection. This was repeated 10 times and averaged. GACs were also calculated for the seven largest sites (in terms of stream width) and the seven smallest sites. All GACs were extrapolated to the same number of organisms to minimize the effects of differences in sampling effort (expressed as number of organisms) on comparisons among sampling designs [41].
The effects of sampling duration (i.e., number of years) on observed richness for UTR were investigated by constructing GACs for the MHSP samples collected from the five sites in UTR that were sampled during all five sample years (1997, 2000, 2003, 2007, and 2017). Five curves were generated, corresponding to one to five years of cumulative sampling (i.e., the first curve included one year of sampling at each site, the second curve included two years of sampling, etc.). The curves for one to four years of sampling were extrapolated to about the same number of organisms as collected during all five years of sampling to minimize effects on richness resulting solely from increasing effort.
GACs were also used to compare richness among SRS streams. These analyses were based on all MHSP data collected from all sample sites in each stream over all sample years, and results were extrapolated to the same number of samples to adjust for differences in sampling effort. Complete richness for this analysis and the previously described analyses based on MHSP samples from UTR was estimated with the Chao 2 estimator, an incidence estimator based on the presence or absence of species in samples from a larger set of multiple samples [7]. All curves, extrapolations, and richness estimates were computed using Estimate S [42].

3. Results

3.1. Genera Richness

Over 90% of the more than 44,000 collected, individually identified, and counted organisms were insects, with the remainder mostly crustaceans (3%), mollusks (3%), and annelids (2%) (Table 2). A minimum of 312 genera, representing 114 families, were collected including 268 genera and 87 families of insects (Table 2). The actual number of genera might have been slightly higher because a small proportion of the collected organisms (under 3%) could only be identified to family. The 3% were mostly damaged, larval, or early instar, or members of taxonomically difficult groups. Specimens not identified to genus were included in the genus count for a family only if they were the only representatives of the family.
Somewhat more organisms were collected with the MHSP (23,948) than with the HD samplers (20,065) (Table 2). This difference was especially large in the Hirudinea, Mollusca, Crustacea, Coleoptera, Heteroptera, Lepidoptera, and Odonata. Only a few groups, particularly within Chironomidae, were collected in greater number with HD samplers than with the MHSP. The MHSP also collected more total genera (276 compared with 216) and more insect genera (243 compared with 183) than the HD samplers (Table 2, see Supplementary Table S1 for specific genera). This was manifested across most insect orders but especially Coleoptera, Heteroptera, and Odonata (Table 2). However, the use of HD samplers raised the total number (both methods) of insect genera by about 10% indicating its potential value as supplemental method for collecting more taxa.
The observed number of genera in each stream averaged 139 and ranged from 97 to 193 (Table 1). Drainage totals for the three drainages with more than one sampled stream were 195, 172, and 259, respectively for the PB, SC, and UTR drainages. Over all streams and drainages, the number of estimated genera (Chao 1) averaged about 13.9% higher than the number of observed genera, suggesting that sampling was sufficient to represent most genera present. The difference between the observed and estimated complete number of genera was moderately and inversely correlated with the number of organisms collected (Pearson r = −0.56, p = 0.030), reflecting the ability of more intensive sampling (and subsequent collection of more organisms) to better represent complete biodiversity.

3.2. Factors Affecting Genera Richness

Linear regression of the MHSP data indicated that the single strongest predictor of the total number of observed genera collected from each stream was the total number of individual organisms collected (n = 12, R2 = 0.74, p < 0.001). Number of samples was nearly as strong a predictor as number of organisms (R2 = 0.72, p < 0.001). These two predictors were highly correlated (r = 0.88) and both are manifestations of sampling effort (i.e., more organisms are collected with more samples). The addition of other predictor variables to regression models with number of individual organisms failed to produce statistically significant (p ≤ 0.05) increases in predictive power.
Paralleling results for streams, the single best predictor of the total number of genera from each sample site was the total number of individual organisms collected (n = 37, R2 = 0.62, p < 0.001). However, unlike the results for streams, multiple regression analyses for sites indicated that the best predictive model for total number of genera included two significant independent variables: the average number of genera in each sample from the site and the total number of samples from the site (t < 0.001 for both independent variables, R2 = 0.91). Other potential independent variables failed to contribute additional significant predictive power to the regression models. Further analysis showed that the average number of genera per site was significantly influenced by the average number of individuals per collection (p < 0.001) and by average stream width (p = 0.003) (R2 = 0.71 for both variables). Average stream width (a surrogate for stream size) correlates with numerous ecological variables, as described later.

3.3. Effects of Sampling Effort and Site Selection on Estimates of Genera Richness

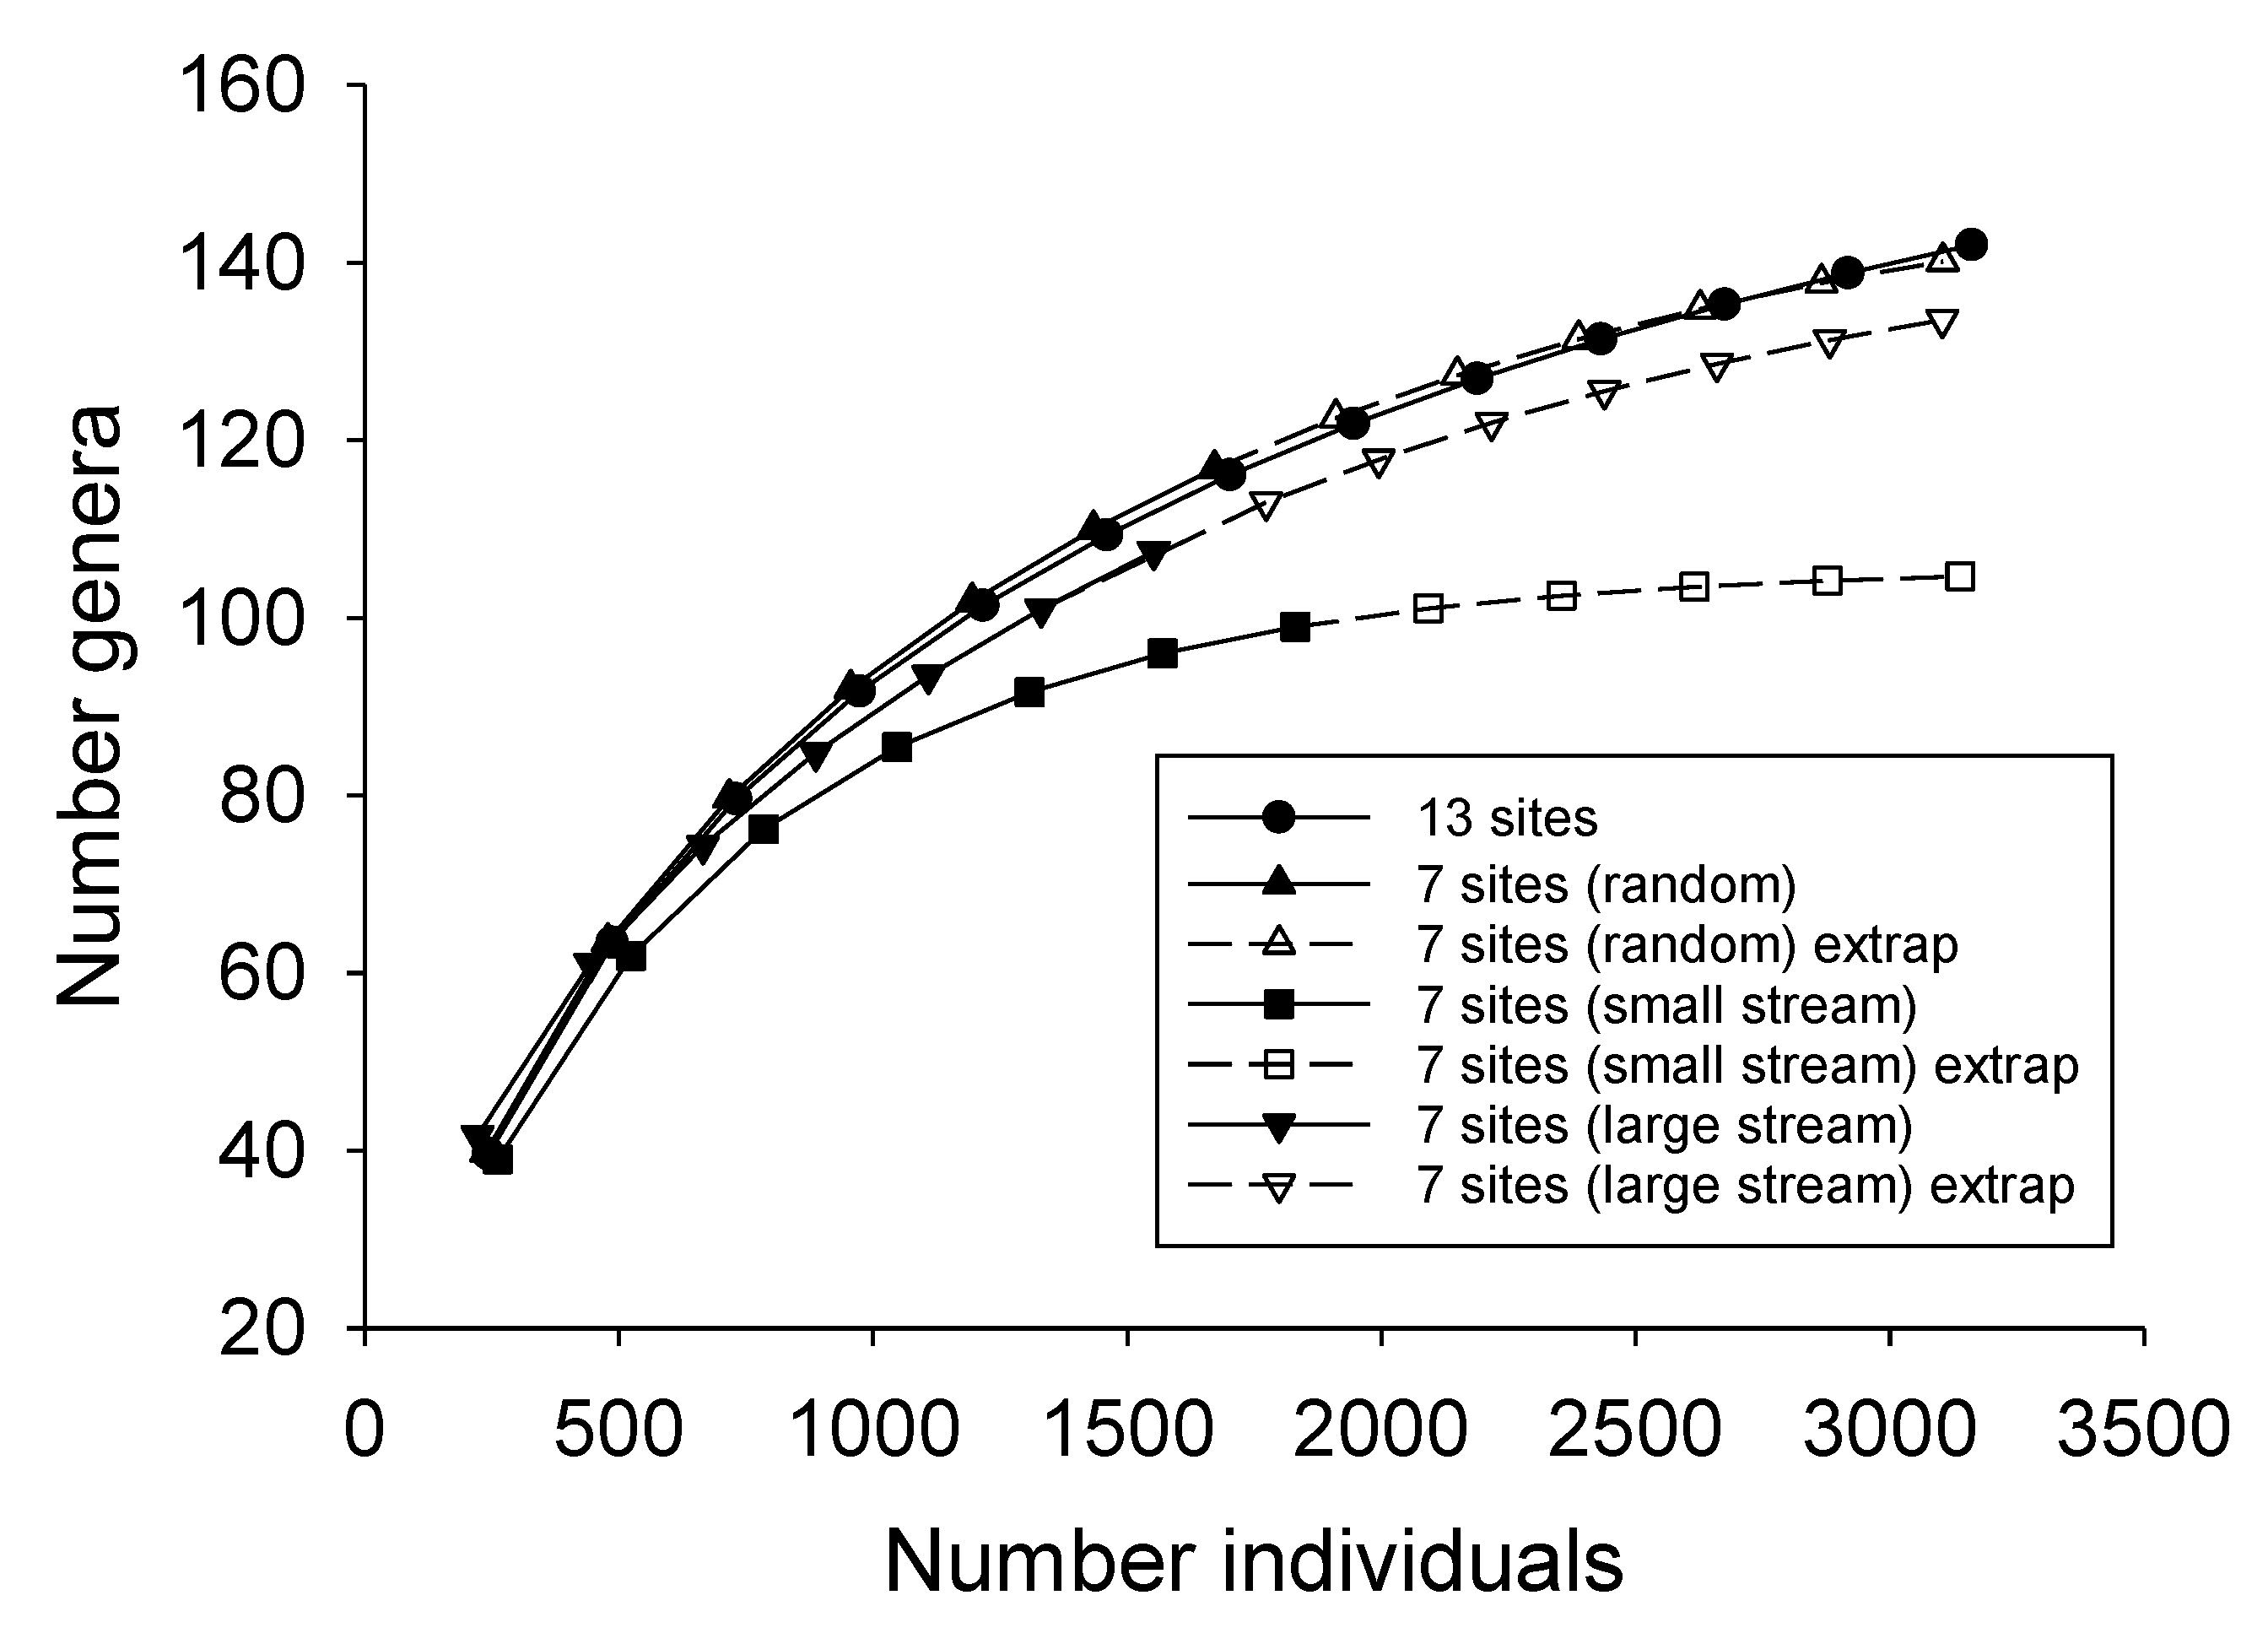
The effects of sampling effort on number of genera collected were investigated by calculating GACs based on MHSP samples from 13 sites in the UTR drainage. These samples included 3161 organisms representing 142 observed genera. The cumulative number of genera increased with sampling effort expressed as number of sites sampled and organisms collected, although the rate of increase decreased with effort, as is typical of taxa accumulation curves (Figure 2). Complete genera richness estimated by the Chao 2 method was 169 (95% Confidence Limits = 154–201), about 19% more than observed.
The resulting average GAC for seven randomly selected sites was similar to the GAC for the full data set when extrapolated to approximately 3160 organisms (the number in the full data set, Figure 2). The average Chao 2 estimate for random site selection was 155 (95% CL = 143–167), slightly less than the Chao 2 estimate for the full data set but about 9% more than the number of observed genera in the full data set. The average for random site selection was compared to two nonrandom site selections: one including the six largest sites (in terms of stream width) and the other, the six smallest. When extrapolated to about 3160 individuals, the GAC for the six largest sites fell below the GAC for the full data set, and the Chao 2 estimate (144, confidence interval = 121–194) was somewhat less than the Chao 2 estimates for the full data set or random site selections. The GAC for the seven sites in the smallest streams fell well below the GAC for the full data set, and Chao 2 estimated genera richness, 105 (101–118), was approximately 26% less than observed genera richness for the full data set. These analyses showed that site selections biased toward small stream sites (i.e., headwaters) underestimated total genera richness because small streams supported fewer genera than large streams, as previously discussed. However, selections biased toward large stream sites also slightly underestimated total genera richness, despite the relatively high richness of these sites.

3.4. Genera Richness in Headwater and Lower Reach Streams

The combined HD and MHSP samples (all sites and years combined) indicated that UTR supported 193 genera. Its tributaries had fewer genera individually (97–121) but together supported 226 genera. When GACs constructed separately for UTR and for all UTR tributaries (all tributaries combined) were rarified to the same number of individuals (i.e., 6338, the number collected from UTR), the difference between UTR and the combined tributaries diminished, but the latter still remained more biodiverse (209 genera compared with 193). The UTR tributaries included 72 genera not found in UTR, therefore contributing to the UTR drainage basin total of 261 genera. The presence of unique headwater genera likely contributed to the previously described reduction in estimated genera richness for the UTR sample site selection biased toward large streams. The contribution of headwater genera to the drainage total was also observed, although to a lesser degree, with the PB and SC drainages, each of which included one sampled tributary. IGB, the tributary of PB, supported 21 genera not found in PB, and MB, the tributary of SC, supported 24 genera not found in SC.
The presence of unique genera in headwater streams may be related to more heterogenous macroinvertebrate assemblages. The heterogeneity of macroinvertebrate assemblages in tributary streams compared with higher order mainstem reaches was examined by comparing Sorenson and Jaccard dissimilarities among macroinvertebrate assemblages collected from sites in UTR tributaries and UTR (MHSP and HD combined). The average Sorenson distance was 0.85 for the tributary sites and 0.74 for sites in UTR, indicating somewhat greater heterogeneity in the former. Respective values for Jaccard distance were 0.92 and 0.85. This pattern was repeated when all sample sites from all streams were divided into headwaters (orders 1 and 2) and lower reaches (orders 3 and 4). Jaccard and Sorenson distances for headwater were 0.83 and 0.72, respectively, compared with 0.77 and 0.64 for higher order sites, again indicating that assemblage heterogeneity was somewhat greater among headwaters than lower stream reaches.

3.5. Effects of Sampling Duration on Estimates of Genera Richness

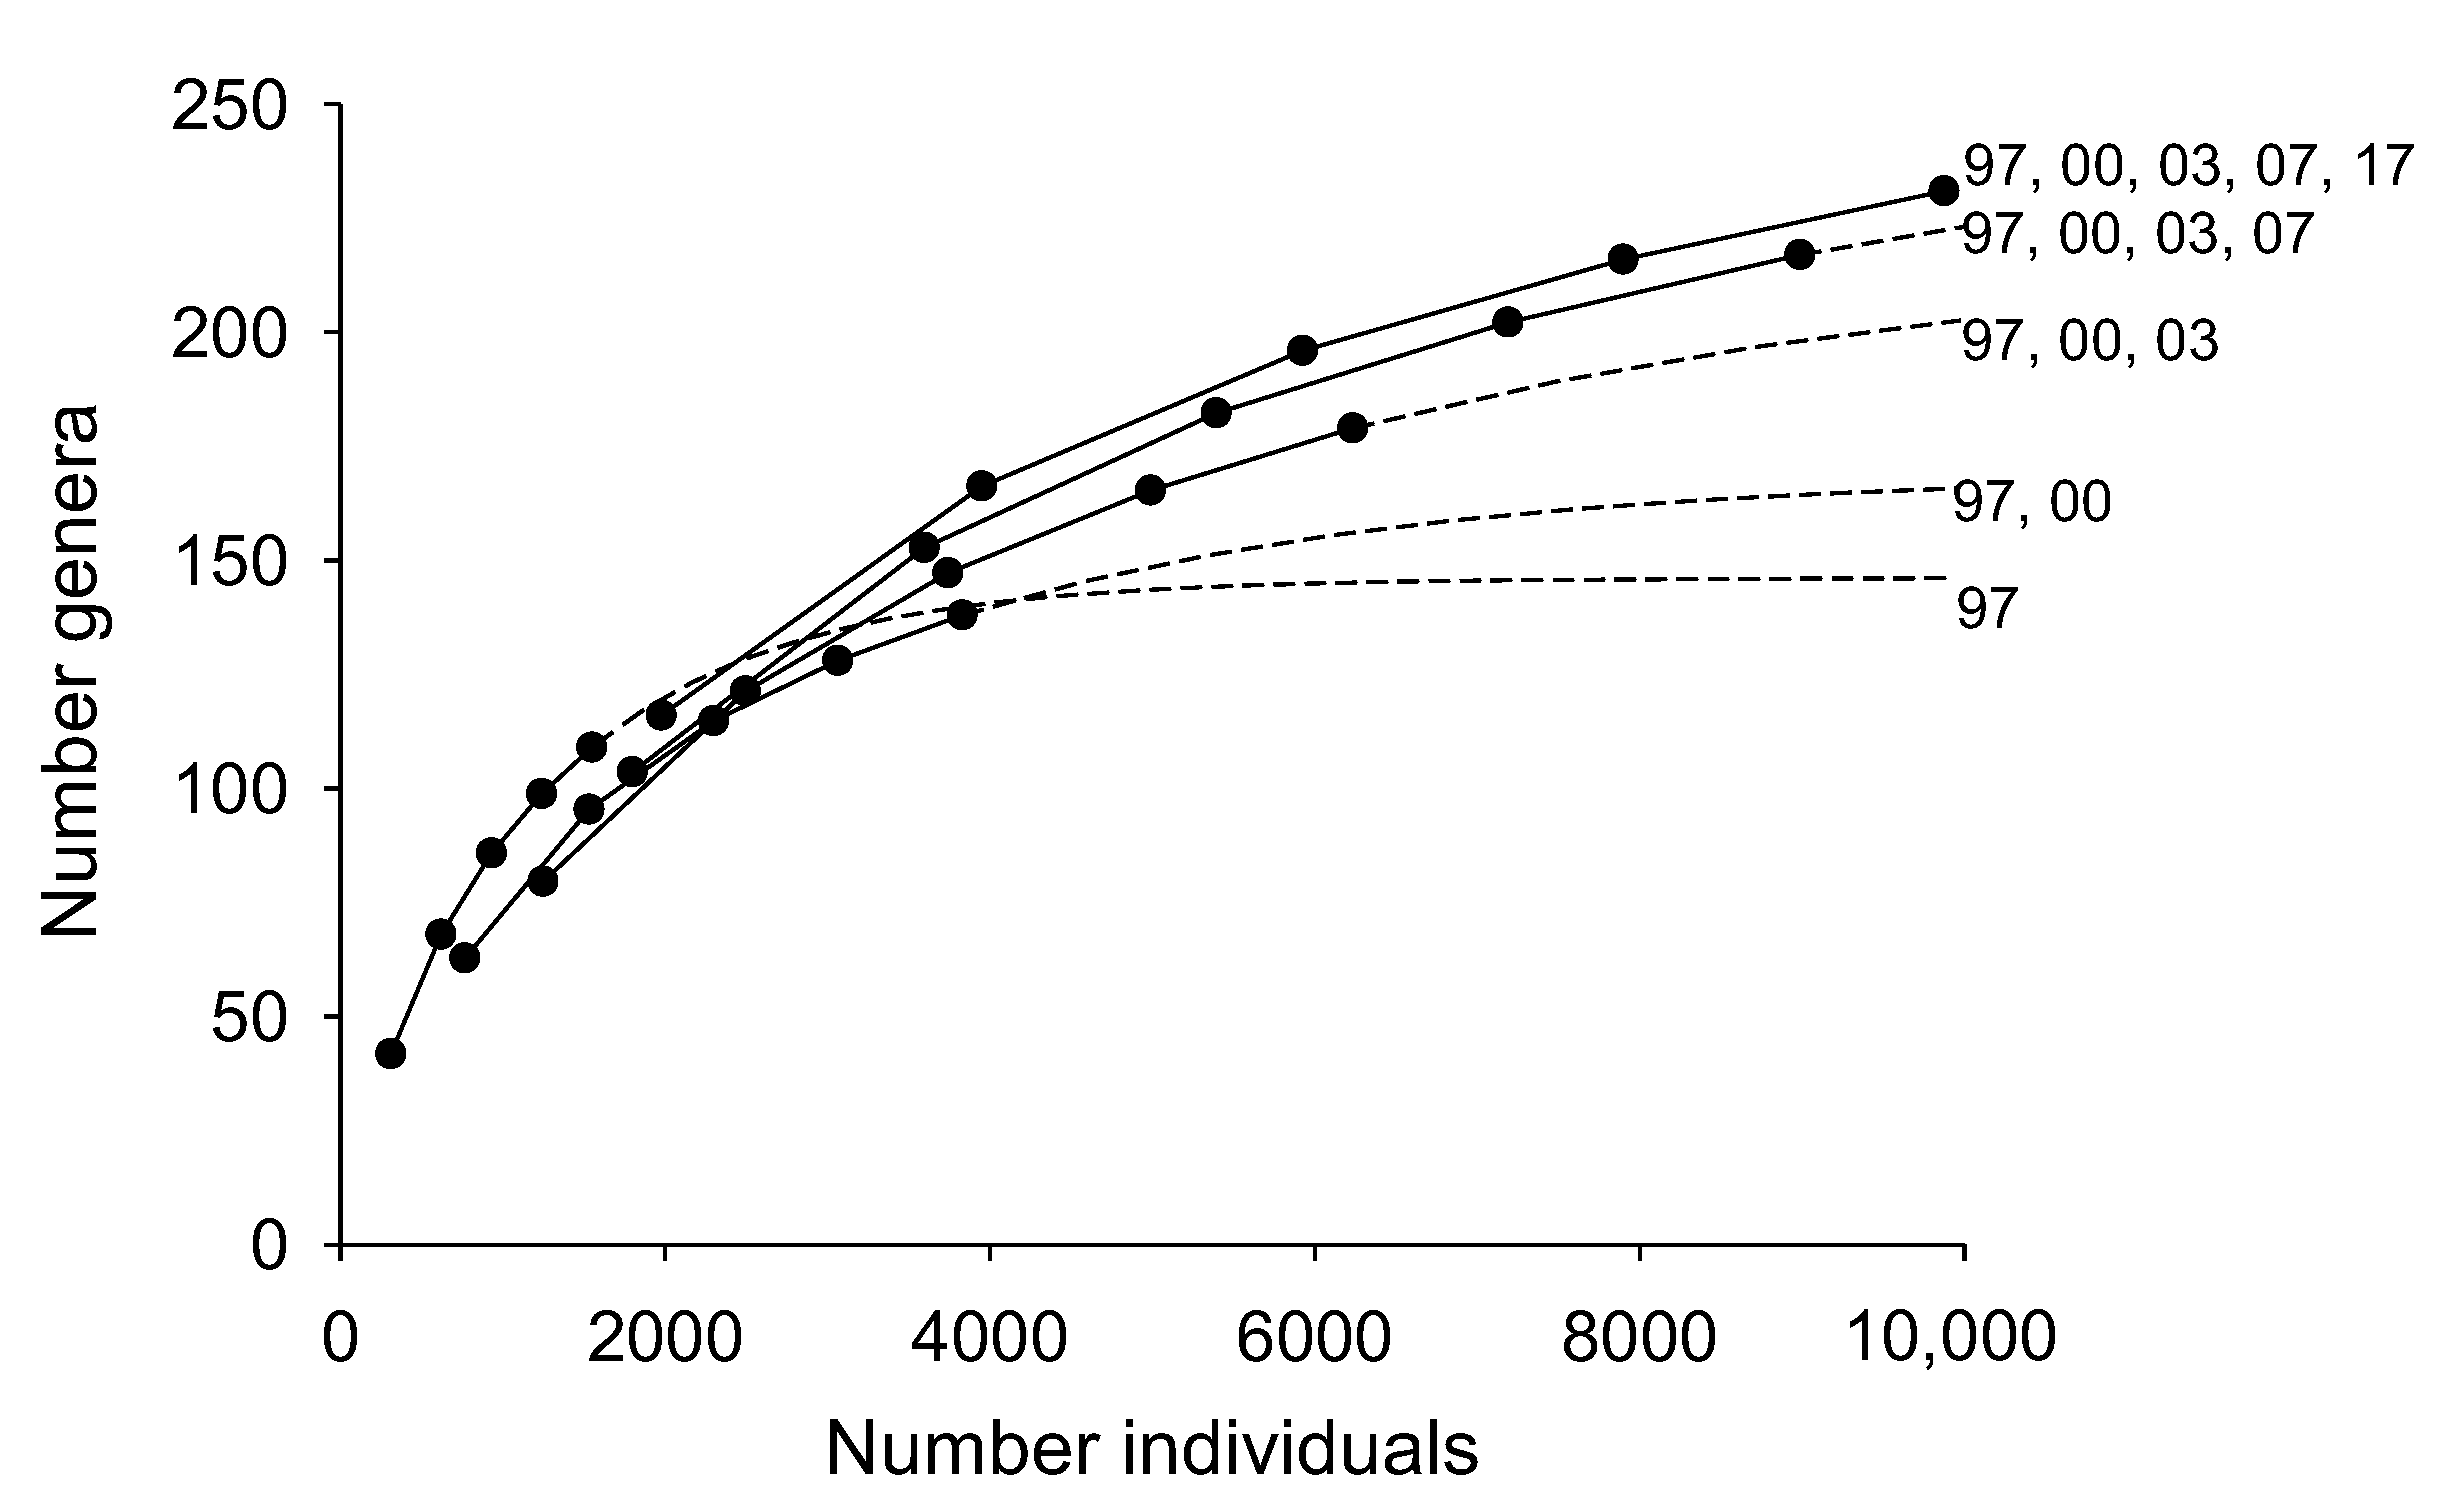
The effects of sampling duration were investigated with data from the five UTR sites that were sampled during all five sample years. These included three headwater and two lower reach sample sites. GACS were constructed for one through five years of cumulative sampling (Figure 3). All GACs were extrapolated to about 10,000 organisms, the cumulative number of organisms collected over all five years, to minimize apparent richness increases resulting solely from the collection of more organisms. Including progressively more collection years resulted in increasingly steeper GACs, reflecting the inclusion of more genera with years sampled. Chao 2 estimates of complete genera richness followed a similar pattern, 144 for one year, 168 for two, 219 for three, 259 for four, and 275 for five years.

3.6. Comparison of UTR to Other Streams

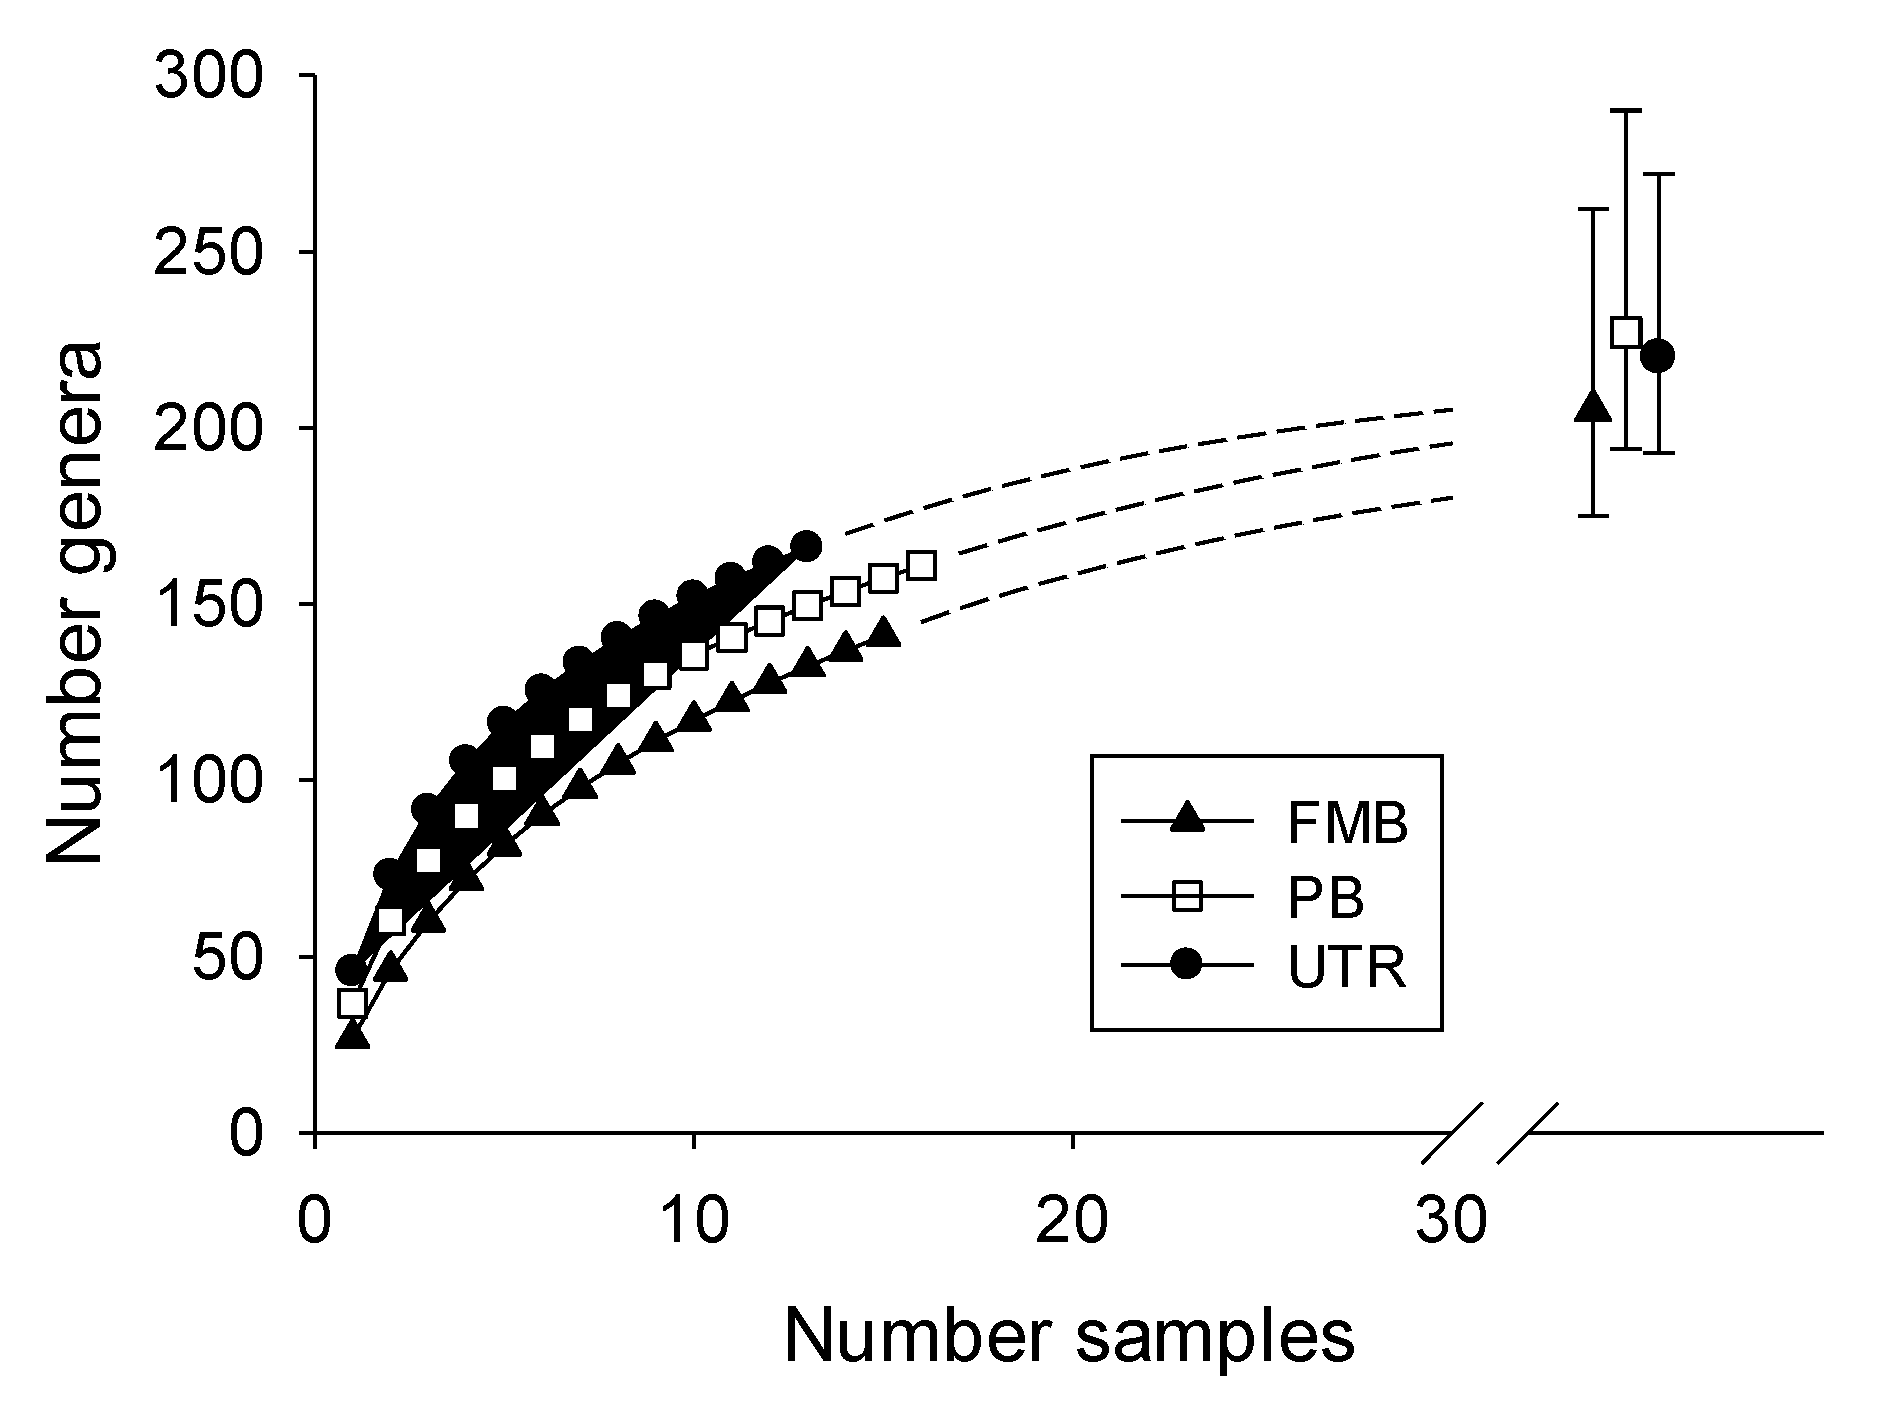
UTR supported more macroinvertebrate genera (193) than other streams, but two other extensively sampled streams, PB and FMB, supported nearly as many, 177 and 184, respectively (Table 1). GACS were developed for these streams from the MHSP data to compare them independently of sampling effort expressed as number of samples collected (Figure 4). When extrapolated to the same level of effort, the estimated number of genera differed little among streams. Chao 2 estimates of the complete number of genera in each stream followed a similar pattern with little difference among estimates and strongly overlapping confidence intervals (Figure 4).

4. Discussion

The accurate estimation of macroinvertebrate taxonomic richness on a stream reach or larger scale depends on interrelated sampling issues operating at different spatial and temporal scales. First, the well-known influence of local habitat factors such as substrate composition, current velocity, depth, and instream structure (e.g., snags) necessitates a sampling methodology that represents all microhabitats. The MHSP used herein was suitable because it employed multiple techniques to sample the different and complex microhabitats in the streams under study. Similar protocols have been used elsewhere to estimate taxa richness; these differ from methods that target specific habitats such as riffles in hard-bottomed streams or snags in low-gradient streams [27,43]. The latter are appropriate for comparing ecological conditions among streams (e.g., for pollution assessment) or assessing relative richness among streams within specific habitats but not for estimating total richness on a larger scale.
Although superior to less comprehensive methods, even MHSPs may fail to collect some taxa, suggesting the inclusion of additional sampling methods for a more complete count. The addition of HD samplers to the protocol for SRS streams resulted in a 10% increase in the total insect genera count (despite representing fewer genera in total than the MHSP). Other supplemental methods can include light traps for sampling emerging aquatic insects or dredges for sampling soft substrates or less accessible habitats in deeper water [44,45,46]. Supplemental methods can compensate for the inability of MHSPs to collect genera from inaccessible habitats or may increase the taxa count simply by increasing the number of collected individuals.
On a larger spatial scale, it is important to select sample sites that represent the range of habitat heterogeneity within the stream under study. Failure to do so restricts the scope of inference to only the habitat types represented by the sample sites. GACs showed that a random but representative subset of sites from UTR produced a richness estimate roughly equivalent to the estimate produced by the full UTR data set. In contrast, a selection biased for small sites within the UTR drainage underestimated genera richness, primarily because small streams within the UTR drainage generally supported fewer genera than large streams. Selections biased for large streams, which were relatively genera rich, produced estimates that deviated only slightly from estimates based on random site selection but lacked taxa largely restricted to headwaters. Random site selections produced more accurate drainage-wide estimates because they generally included a mix of headwater and lower reach sites. Previous research on fish assemblage richness indicated that a stratified design including tributaries and higher-order sites spaced relatively evenly over the stream network was even better than random site selection because it provided a better and more consistent representation of habitat heterogeneity within the study area [23]. It is likely that this conclusion also applies when assessing macroinvertebrate taxa richness on whole-stream or drainage-basin scale.
Like the spatial scale of sampling, the temporal scale of sampling can have a large impact on estimates of macroinvertebrate taxonomic richness. Spatial habitat differences within drainage networks can enhance taxonomic richness through encounters with new species as sample area increases and additional habitats are encountered. Increases in sampling duration can have similar effects that increase with longer time scales that provide opportunity for faunal change. GACs developed from UTR sites sampled five times over 20 years indicated that progressively more taxa were collected with number of years sampled, with the total for five years being about 60% greater than the total for one year (Figure 3). Increased sampling effort with accompanying increases in the number of collected individuals likely contributed to this increase. However, increases in Chao 2 estimates with number of sample years and differences among GACs when extrapolated to the same number of individuals suggested that ecological factors also contributed to the observation of more taxa. Research on temporal changes in stream macroinvertebrate assemblages indicates species persist over time, resulting in relatively stable taxa richness, particularly in stable environments [47,48]. However, relative abundance is prone to greater changes over time than species’ occurrence due to fluctuations in taxa population sizes associated with hydrological events, climate variations, and other environmental factors [48,49,50]. Sampling over several years may provide a more complete representation of taxa richness because taxa that fluctuate in population size may be overlooked except in years of relatively high abundance when they are more likely to be collected.
Embedded in all aspects of spatial and temporal sampling design and sampling methodology is the issue of sampling effort, which determines the number of organisms collected. The likelihood of encountering more taxa with more collected individuals is a well-known statistical effect of increasing sampling effort that underpins taxa accumulation curves. Sampling effort, expressed as total number of macroinvertebrates collected or sites sampled, had a stronger influence on genera richness at the level of individual sample sites and entire streams than any other single factor in this study. Sampling effort, with its concomitant increase in number of collected individuals, grows with designs that sample more microhabitats, more sites, and more years. Its statistical effects cannot be readily separated from ecological processes that contribute more macroinvertebrate taxa as more habitats are sampled and faunas change with time. Therefore, effective sampling designs for macroinvertebrate taxa richness need to encompass ecological factors (e.g., habitat diversity) as well as the associated effects of sampling effort on the likelihood of encountering new taxa. These effects will vary with macroinvertebrate community composition and aquatic habitat structure and should be investigated with taxa accumulation curves and richness estimators that provide insights on the effects of sampling design (e.g., site selection) and level of effort on the approach of taxonomic richness to an asymptote.
Stream size influenced macroinvertebrate taxonomic richness in this study, as also shown in other studies [51,52,53]. Stream width was a significant predictor of taxonomic richness, and number of genera increased with stream width within the range of widths under study. There are a variety of ecological changes that occur as stream size increases with progression from headwater to lower stream reaches. These include numerous physical and chemical variables that determine the availability of allochthonous and autochthonous food sources, environmental variability, and physical habitat structure for benthic organisms. They result in peak macroinvertebrate taxonomic richness in streams of intermediate size where habitat diversity and environmental variability is high and functional niches numerous. Our results are in accord with the RCC [13], although the RCC does not explain all factors that contributed to richness in SRS streams. The presence of unique genera and heterogeneous assemblages in headwater streams likely resulted from the inclusion of a variety of habitats that differed from those in lower-order streams [14]. The presence of distinctive taxa and diverse assemblages in higher order reaches increased overall drainage biodiversity and may have increased richness in higher-order, downstream reaches through emigration (e.g., drift).
An important reason for documenting macroinvertebrate taxa richness is to identify sites of unusual biodiversity that can serve as reference sites for comparison with other streams and provide baselines for documenting long-term changes in ecosystem integrity. Our data suggest that SRS streams support high levels of macroinvertebrate biodiversity compared with other streams of comparable size and corroborate previous studies showing that UTR supports an unusual biodiversity of aquatic insects. Morse et al. [45,46] collected at least 551 species and 276 genera of aquatic insects from the UTR drainage in multiple collections made during September 1976–August 1977. This was the highest insect richness for any North American stream of comparable size at the time. This genera total was somewhat greater than ours (228), but they collected over 34,000 specimens, more than twice what we collected, suggesting that differences in sampling effort may have contributed to the disparity between studies. Morse et al. [45,46] employed semi-quantitative benthic sampling techniques resembling the MHSP but also used light traps to collect insect taxa. In a later study, Floyd et al. [54] identified 93 species of caddisflies (Trichoptera) from UTR, further attesting to the biodiversity of UTR.
Insect richness observed by us in the UTR drainage, 15,886 specimens representing 228 genera and 79 families, compares well with diversity in other intensively sampled drainages, again suggesting UTR’s importance as a reference area and potential baseline for evaluating changes in biodiversity as global change continues. Henriques-Oliveira and Nessimian [55] reported 216 insect taxa (mostly genera) in 83,000 specimens collected from 18 tributaries of the Manbucaba River in the Brazilian Atlantic rainforest. Prommi and Payakka [56] reported 59 families among 8982 insects collected from five sites sampled multiple times in the Mae Tao and Mae Ku watersheds of northern Thailand, and Maneechan and Prommi [57] reported 64 families among 11,153 insects collected from six sites sampled multiple times in the Mae Klong watershed of Western Thailand. Voelz and McArthur [19] compared insect species richness among UTR and six other intensively sampled streams on four continents. They found only one stream with greater insect species richness than UTR: Breitenbach, a small stream that would be expected to support fewer taxa than UTR based on size (drainage area of 8 km2 compared with 571 km2 for UTR). Voelz and McArthur [18] suggested that varied inorganic substrates together with zoogeographic factors contributed to Breitenbach’s diversity. However, Breitenbach was sampled much more than other streams (3000 samples over 25 years), suggesting that sampling effort may have contributed to its high richness.
Voelz and McArthur [18] hypothesized that ecological factors including productivity and habitat heterogeneity were largely responsible for UTR’s unusual taxonomic richness. These factors include numerous functional niches created by diverse sources of allochthonous and autochthonous productivity (i.e., macrophyte beds, leaf and woody matter contributed by seasonally inundated riparian forests, and periphyton) and abundant snags coupled with low flow variability that create habitat diversity. Furthermore, UTR was not subjected to recent glaciation or ocean inundation, permitting an increase in species richness with time. Some of these attributes likely apply to other taxonomically rich SRS streams; e.g., the number of macroinvertebrate genera in PB and FMB was about as great as in UTR when adjusted for sampling effort (Figure 4). Genus and family richness generally correlate well with species richness, suggesting that these patterns observed among SRS streams at the genus level likely represented patterns at the species level. Marshall et al. [58] found that species richness of stream macroinvertebrates was well represented by genus richness, and Growns and Growns [59] found that number of families explained 91% of the species richness in macroinvertebrates from Australian streams.
The preceding findings with macroinvertebrates parallel findings with fish. Paller [23] found that fish species richness in UTR was higher than in other SRS streams, but all SRS streams had higher richness than most North American streams. He attributed this to greater instream habitat diversity, less disturbed land coverage, more forested land, and proximity to species-rich source pools. Many of these qualities are linked to the unusual status of the SRS as a large, mostly undeveloped reservation without agricultural or residential land use since 1951. Former use of some SRS streams (e.g., Fourmile Branch) for industrial purposes including transport of high-temperature cooling water largely ceased in the 1980s, permitting habitat recovery through secondary succession and recovery of aquatic communities under conditions largely free from human disturbance. The status of some SRS streams makes them comparatively unique and suitable as potential ecological reference models representing least-disturbed conditions for comparison with other streams and for charting the progress of ecological change over time.

5. Conclusions

This study showed that estimates of macroinvertebrate taxonomic richness are strongly influenced by three interrelated factors: number of organisms collected, number and distribution of sampling sites, and duration of sampling. The number of organisms collected is important because of the well-understood statistical probability of encountering more taxa with the observation of more individuals. However, full representation of biodiversity requires a spatial distribution of sample sites that represents all habitats. On a small scale, this means a sampling methodology that represents all microhabitats and, on a large scale, a sampling design that includes all habitats within the stream continuum under study. Complete representation of biodiversity also necessitates sufficient time to encompass annual fluctuations in abundance that affect the susceptibility of different taxa to collection.
Our results support both the RCC and stream network theory, the former indicated by the correlation between stream size and taxonomic richness and the latter by the identification of unique taxa in headwater streams that contributed to drainage wide diversity. It is likely that other unexplored factors also contributed to the complexity and taxonomic richness of the macroinvertebrate assemblages in SRS streams. Although UTR was the most biodiverse SRS stream, some other SRS streams were nearly comparable. SRS streams are relatively unique in the southeastern USA in supporting high biodiversity and being minimally exposed to anthropogenic disturbance, in some cases since 1951. These unusual features make them valuable as reference models for comparison with other streams and potential baselines for assessing the effects of environmental changes on lotic biodiversity.

Supplementary Materials

The following are available online at https://www.mdpi.com/1424-2818/12/12/459/s1. Table S1: Macroinvertebrate genera collected from Fourmile Branch (FMB), Lower Three Runs (LTR), Pen Branch (PB), Steel Creek (SC), and Upper Three Runs (UTR) drainages with a multiple habitat sampling protocol (MHSP) and Hester–Dendy artificial substrate samplers.

Author Contributions

M.H.P. contributed text and statistical analyses. S.A.B. contributed to the experimental design, assisted with analyses, and arranged funding. R.W.K. provided all taxonomic identifications. All authors have read and agreed to the published version of the manuscript.

Funding

This work was sponsored by the Savannah River National Laboratory (SRNL) operated by Savannah River Nuclear Solutions, LLC for the U.S. Department of Energy under Contract DE-AC09-798861048.

Acknowledgments

We thank the many field and laboratory personnel who have assisted with field collections and laboratory identifications during this study. We also thank three anonymous reviewers whose comments improved this paper.

Conflicts of Interest

The authors declare no conflict of interest.

References

  1. Roberto, C.G. Freshwater biodiversity: A review of local and global threats. Int. J. Environ. Stud. 2016, 73, 887–904. [Google Scholar]
  2. Vaughn, C.C. Biodiversity losses and ecosystem function in freshwaters: Emerging conclusions and research directions. BioScience 2016, 60, 25–35. [Google Scholar] [CrossRef]
  3. Pallottini, M.; Goretti, E.; Selvaggi, R.; Cappelletti, D.; Dedieu, N.; Céréghino, R. An efficient semiquantitative macroinvertebrate multimetric index for the assessment of water and sediment contamination in streams. Inland Waters 2017, 7, 314–322. [Google Scholar] [CrossRef]
  4. Pallottini, M.; Cappelletti, D.; Fabrizi, A.; Gaino, E.; Goretti, E.; Selvaggi, R.; Céréghino, R. Macroinvertebrate functional trait responses to chemical pollution in agricultural-industrial landscapes. River Res. Appl. 2017, 33, 505–513. [Google Scholar] [CrossRef]
  5. Carter, J.L.; Resh, V.H. Analytical Approaches Used in Stream Benthic Macroinvertebrate Biomonitoring Programs of State Agencies in the United States; U.S. Geological Survey: Reston, VA, USA, 2013; p. 50. [Google Scholar]
  6. Connor, E.F.; McCoy, E.D. The statistics and biology of the species-area relationship. Am. Nat. 1979, 113, 791–833. [Google Scholar] [CrossRef]
  7. Scheiner, S.M. Six types of species-area curves. Glob. Ecol. Biogeogr. 2003, 12, 441–447. [Google Scholar] [CrossRef]
  8. Gotelli, N.J.; Colwell, R.K. Estimating species richness. In Biological Diversity: Frontiers in Measurement and Assessment; Oxford University Press: Oxford, UK, 2011; pp. 39–54. [Google Scholar]
  9. Carey, S.; Ostling, A.; Harte, J.; del Moral, R. Impact of curve construction and community dynamics on the species-time relationship. Ecology 2007, 88, 2145–2153. [Google Scholar] [CrossRef]
  10. Gotelli, N.; Colwell, R.K. Quantifying biodiversity: Procedures and pitfalls in the measurement and comparison of species richness. Ecol. Lett. 2001, 4, 379–391. [Google Scholar] [CrossRef] [Green Version]
  11. Rosenzweig, M.L. Preston’s ergodic conjecture: The accumulation of species in space and time. In Biodiversity Dynamics: Turnover of Populations, Taxa and Communities; McKinney, M.L., Drake, J., Eds.; Columbia University Press: New York, NY, USA, 1998; pp. 311–348. [Google Scholar]
  12. Poff, N.L. Landscape filters and species traits: Towards mechanistic understanding and prediction in stream ecology. J. N. Am. Benthol. Soc. 1997, 16, 391–409. [Google Scholar] [CrossRef]
  13. Vannote, R.L.; Minshall, G.W.; Cummins, K.W.; Sedell, J.R.; Cushing, C.E. The river continuum concept. Can. J. Fish. Aquat. Sci. 1980, 37, 130–137. [Google Scholar] [CrossRef]
  14. Clarke, A.; Mac Nally, R.; Bond, N.; Lake, P.S. Macroinvertebrate diversity in headwater streams: A review. Freshw. Biol. 2008, 53, 1707–1721. [Google Scholar] [CrossRef]
  15. Archaimbault, V.; Usseglio Polatera, P.; Garric, J.; Wasson, J.G.; Babut, M. Assessing pollution of toxic sediment in streams using bio-ecological traits of benthic macroinvertebrates. Freshw. Biol. 2010, 55, 1430–1446. [Google Scholar] [CrossRef]
  16. Mondy, C.P.; Villeneuve, B.; Archaimbault, V.; Usseglio-Polatera, P. A new macroinvertebrate-based multimetric index (I2M2) to evaluate ecological quality of French wadeable streams fulfilling the WFD demands: A taxonomical and trait approach. Ecol. Indic. 2012, 18, 452–467. [Google Scholar] [CrossRef]
  17. HydroGeoLogic. Prepared for the legacy resource management program, strategic environmental research and development program, and environmental security technology certification program. In Proceedings of the Southeast Region Threatened, Endangered, and At-Risk Species Workshop, Cocoa Beach, FL, USA, 1 March 2007. [Google Scholar]
  18. Voelz, N.J.; McArthur, J.V. An exploration of factors influencing lotic insect species richness. Biodivers. Conserv. 2000, 9, 1543–1570. [Google Scholar] [CrossRef]
  19. Schmidt, J.P. Sandhills. In New Georgia Encyclopedia; University of Georgia Press: Athens, GA, USA, 2004. [Google Scholar]
  20. Sabater, F.; Meyer, J.L.; Edwards, R.T. Longitudinal patterns of dissolved organic carbon concentration and suspended bacterial density along a blackwater river. Biogeochemistry 1993, 21, 73–93. [Google Scholar] [CrossRef]
  21. Benke, A.C.; Meyer, J.L. Structure and function of a blackwater river in the southeastern USA. Proc. Int. Assoc. Theor. 1988, 23, 1209–1218. [Google Scholar]
  22. Paller, M.H.; Dyer, S.A.; Coughlin, D.P. Exposure of Ecological Receptors to Metals in the Savannah River Site Integrator Operable Units, Analysis of Refined Data from Multiple Environmental Media; WSRC-STI-2008-00365; Savannah River National Laboratory: Aiken, SC, USA, 2008. [Google Scholar]
  23. Paller, M.H. Estimating fish species richness across multiple watersheds. Diversity 2018, 10, 42. [Google Scholar] [CrossRef] [Green Version]
  24. SCDHEC (South Carolina Department of Health and Environmental Control). Standard Operating and Quality Control Procedures for Macroinvertebrate Sampling; Technical Report No. 004-98; Bureau of Water, Division of Water Monitoring, Assessment and Protection, Aquatic Biology Section: Columbia, SC, USA, 1998.
  25. Hester, F.E.; Dendy, J.S. A multiple-plate sampler for aquatic macroinvertebrates. Trans. Am. Fish. Soc. 1962, 91, 420–421. [Google Scholar] [CrossRef] [Green Version]
  26. Plafkin, J.L.; Barbour, M.T.; Porter, K.D.; Gross, S.K.; Hughes, R.M. Rapid Bioassessment Protocols for Use in Streams and Rivers: Benthic Macroinvertebrates and Fish; EPA/444/4-89-0001; U.S. Environmental Protection Agency: Washington, DC, USA, 1989.
  27. Barbour, M.T.; Gerritsen, J.; Snyder, B.D.; Stribling, J.B. Rapid Bioassessment Protocols for Use in Streams and Wadeable Rivers: Periphyton, Benthic Macroinvertebrates and Fish, 2nd ed.; EPA-841-B-99-002; U.S. Environmental Protection Agency, Office of Water: Washington, DC, USA, 1999.
  28. Brigham, A.R.; Brigham, W.U.; Gnilka, A. The Aquatic Insects and Oligochaetes of North and South Carolina; Brigham, A.R., Gnilka, A., Eds.; Midwest Enterprises: Mahomet, IL, USA, 1982; p. 837. [Google Scholar]
  29. Epler, J.H. Identification Manual for Larval Chironomidae (Diptera) of North and South Carolina; North Carolina Department of Environment and Natural Resources: Raleigh, NC, USA, 2001; p. 526.
  30. Fitzpatrick, J.F. How to Know the Freshwater Crustacea; Wm. C. Brown Company Publishers: Dubuque, IA, USA, 1983; p. 227. [Google Scholar]
  31. Merritt, R.W.; Cummins, K.W.; Berg, M.B. An Introduction to the Aquatic Insects of North America, 4th ed.; Kendall/Hunt Publishing Co.: Dubuque, IA, USA, 2008; p. 1158. [Google Scholar]
  32. Morse, J.C.; McCafferty, W.P.; Stark, B.P.; Jacobus, L.M. Larvae of the Southeastern USA Mayfly, Stonefly, and Caddisfly Species; Clemson Public Service and Agriculture: Clemson, SC, USA, 2017; p. 482. [Google Scholar]
  33. Needham, J.G.; Westfall, M.J.; May, M.L. Dragonflies of North America; Scientific Publishers: Gainesville, FL, USA, 2000; p. 939. [Google Scholar]
  34. Pennak, R.W. Freshwater Invertebrates of the United States, 2nd ed.; John Wiley and Sons: New York, NY, USA, 1978; p. 803. [Google Scholar]
  35. Smith, D.G. Pennak’s Freshwater Invertebrates of the United States: Porifera to Crustacea, 4th ed.; John Wiley and Sons: Indianapolis, IN, USA, 2001; p. 638. [Google Scholar]
  36. Stewart, K.W.; Stark, B.P. Nymphs of North American Stonefly Genera (Plecoptera); University of North Texas Press: Texas City, TX, USA, 1988; p. 460. [Google Scholar]
  37. Thorp, J.H.; Rogers, D.C. Thorp and Covich’s Freshwater Invertebrates: Keys to Nearctic Fauna, 4th ed.; Academic Press-Elsevier: Cambridge, MA, USA, 2016; Volume 2, p. 740. [Google Scholar]
  38. Westfall, M.J.; May, M.L. Damselflies of North America; Scientific Publishers: Gainesville, FL, USA, 1996; p. 649. [Google Scholar]
  39. SYSTAT Software, Inc. SigmaPlot 13.0; SYSTAT Software, Inc.: San Jose, CA, USA, 2007. [Google Scholar]
  40. McCune, B.; Mefford, M.J. PC-ORD Multivariate Analysis of Ecological Data; Version 6; MJM Software: Gleneden Beach, OR, USA, 2011. [Google Scholar]
  41. Colwell, R.K.; Mao, C.X.; Chang, J. Interpolating, extrapolating, and comparing incidence-based species accumulation curves. Ecology 2004, 85, 2717–2727. [Google Scholar] [CrossRef] [Green Version]
  42. Colwell, R.K. EstimateS: Statistical Estimation of Species Richness and Shared Species from Samples, Version 9; User’s Guide and Application. 2013. Available online: http://viceroy.eeb.uconn.edu/estimates/EstimateSPages/EstSUsersGuide/EstimateSUsersGuide.htm (accessed on 9 September 2020).
  43. Boothroyd, I.K.G.; Stark, J.D. Use of invertebrates in Monitoring. In New Zealand Stream Invertebrates: Ecology and Implications for Management; Collier, K., Winterbourn, M.J., Eds.; New Zealand Limnological Society: Hamilton, New Zealand, 2000; pp. 344–373. [Google Scholar]
  44. Collier, K.J.; Wilcock, R.J.; Meredith, A.S. Influence of substrate type and physico-chemical conditions on macroinvertebrate faunas and biotic indices of some lowland Waikato, New Zealand, streams. N. Z. J. Mar. Freshw. Res. 1998, 32, 1–19. [Google Scholar] [CrossRef]
  45. Morse, J.C.; Chapin, J.W.; Herlong, D.D.; Harvey, R.S. Aquatic insects of Upper Three Runs, Savannah River Plant, South Carolina, Part I: Orders other than Diptera. J. Ga. Entomol. Soc. 1980, 15, 73–101. [Google Scholar]
  46. Morse, J.C.; Chapin, J.W.; Herlong, D.D.; Harvey, R.S. Aquatic insects of Upper Three Runs, Savannah River Plant, South Carolina, Part I: Diptera. J. Ga. Entomol. Soc. 1983, 18, 303–316. [Google Scholar]
  47. Weatherley, N.S.; Ormerod, S.J. The Constancy of invertebrate assemblages in soft-water streams: Implications for the prediction and detection of environmental change. J. Appl. Ecol. 1990, 27, 952–964. [Google Scholar] [CrossRef]
  48. Huttunen, K.-L.; Mykrä, H.; Muotka, T. Temporal variability in taxonomic completeness of stream macroinvertebrate assemblages. Freshw. Sci. 2012, 31, 423–441. [Google Scholar] [CrossRef]
  49. Rosillon, D. The influence of abiotic factors and density-dependent mechanisms on between-year variations in a stream invertebrate community. Hydrobiologia 1989, 179, 25–38. [Google Scholar] [CrossRef]
  50. Gutiérrez-Fonseca, P.E.; Ramírez, A.; Pringle, C.M. Large-scale climatic phenomena drive fluctuations in macroinvertebrate assemblages in lowland tropical streams, Costa Rica: The importance of ENSO events in determining long-term (15y) patterns. PLoS ONE 2016, 13, e0191781. [Google Scholar] [CrossRef] [Green Version]
  51. Minshall, G.W.; Petersen, R.C., Jr.; Nimz, C.F. Species richness in streams of different size from the same drainage basin. Am. Nat. 1985, 125, 16–38. [Google Scholar] [CrossRef]
  52. Melo, A.S.; Froehlich, C.G. Macroinvertebrates in neotropical streams: Richness patterns along a catchment and assemblage structure between 2 seasons. J. N. Am. Benthol. Soc. 2001, 20, 1–16. [Google Scholar] [CrossRef] [Green Version]
  53. Paller, M.H.; Specht, W.L.; Dyer, S.A. Effects of stream size on taxa richness and other commonly used benthic bioassessment metrics. Hydrobiologia 2006, 568, 309–316. [Google Scholar] [CrossRef]
  54. Floyd, M.A.; Morse, J.C.; McArthur, J.V. Aquatic insects of Upper Three Runs Creek, Savannah River Site, South Carolina. Part IV: Caddisflies (Trichoptera) of the lower reaches. J. Ga. Entomol. Soc. 1993, 28, 85–95. [Google Scholar] [CrossRef]
  55. Henriques-Oliveira, A.L.; Nessimian, J.L. Aquatic macroinvertebrate diversity and composition in streams along an altitudinal gradient in Southeastern Brazil. Biota Neotrop. 2010, 10, 115–128. [Google Scholar] [CrossRef] [Green Version]
  56. Prommi, T.; Payakka, A. Aquatic insect biodiversity and water quality parameters of streams in northern Thailand. Sains Malays. 2015, 44, 707–717. [Google Scholar] [CrossRef]
  57. Maneechan, W.; Prommi, T.O. Diversity and distribution of aquatic insects in streams of the Mae Klong watershed, western Thailand. Psyche 2015, 2, 1–7. [Google Scholar] [CrossRef]
  58. Marshall, J.C.; Steward, A.L. Taxonomic resolution and quantification of freshwater macroinvertebrate samples from an Australian dryland river: The benefits and costs of using species abundance data. Hydrobiologia 2006, 572, 171–194. [Google Scholar] [CrossRef]
  59. Growns, J.E.; Growns, I.O. Predicting species richness for Australasian freshwater macroinvertebrates: Do we want to know? Mem. Mus. Vic. 1997, 56, 483–490. [Google Scholar] [CrossRef]
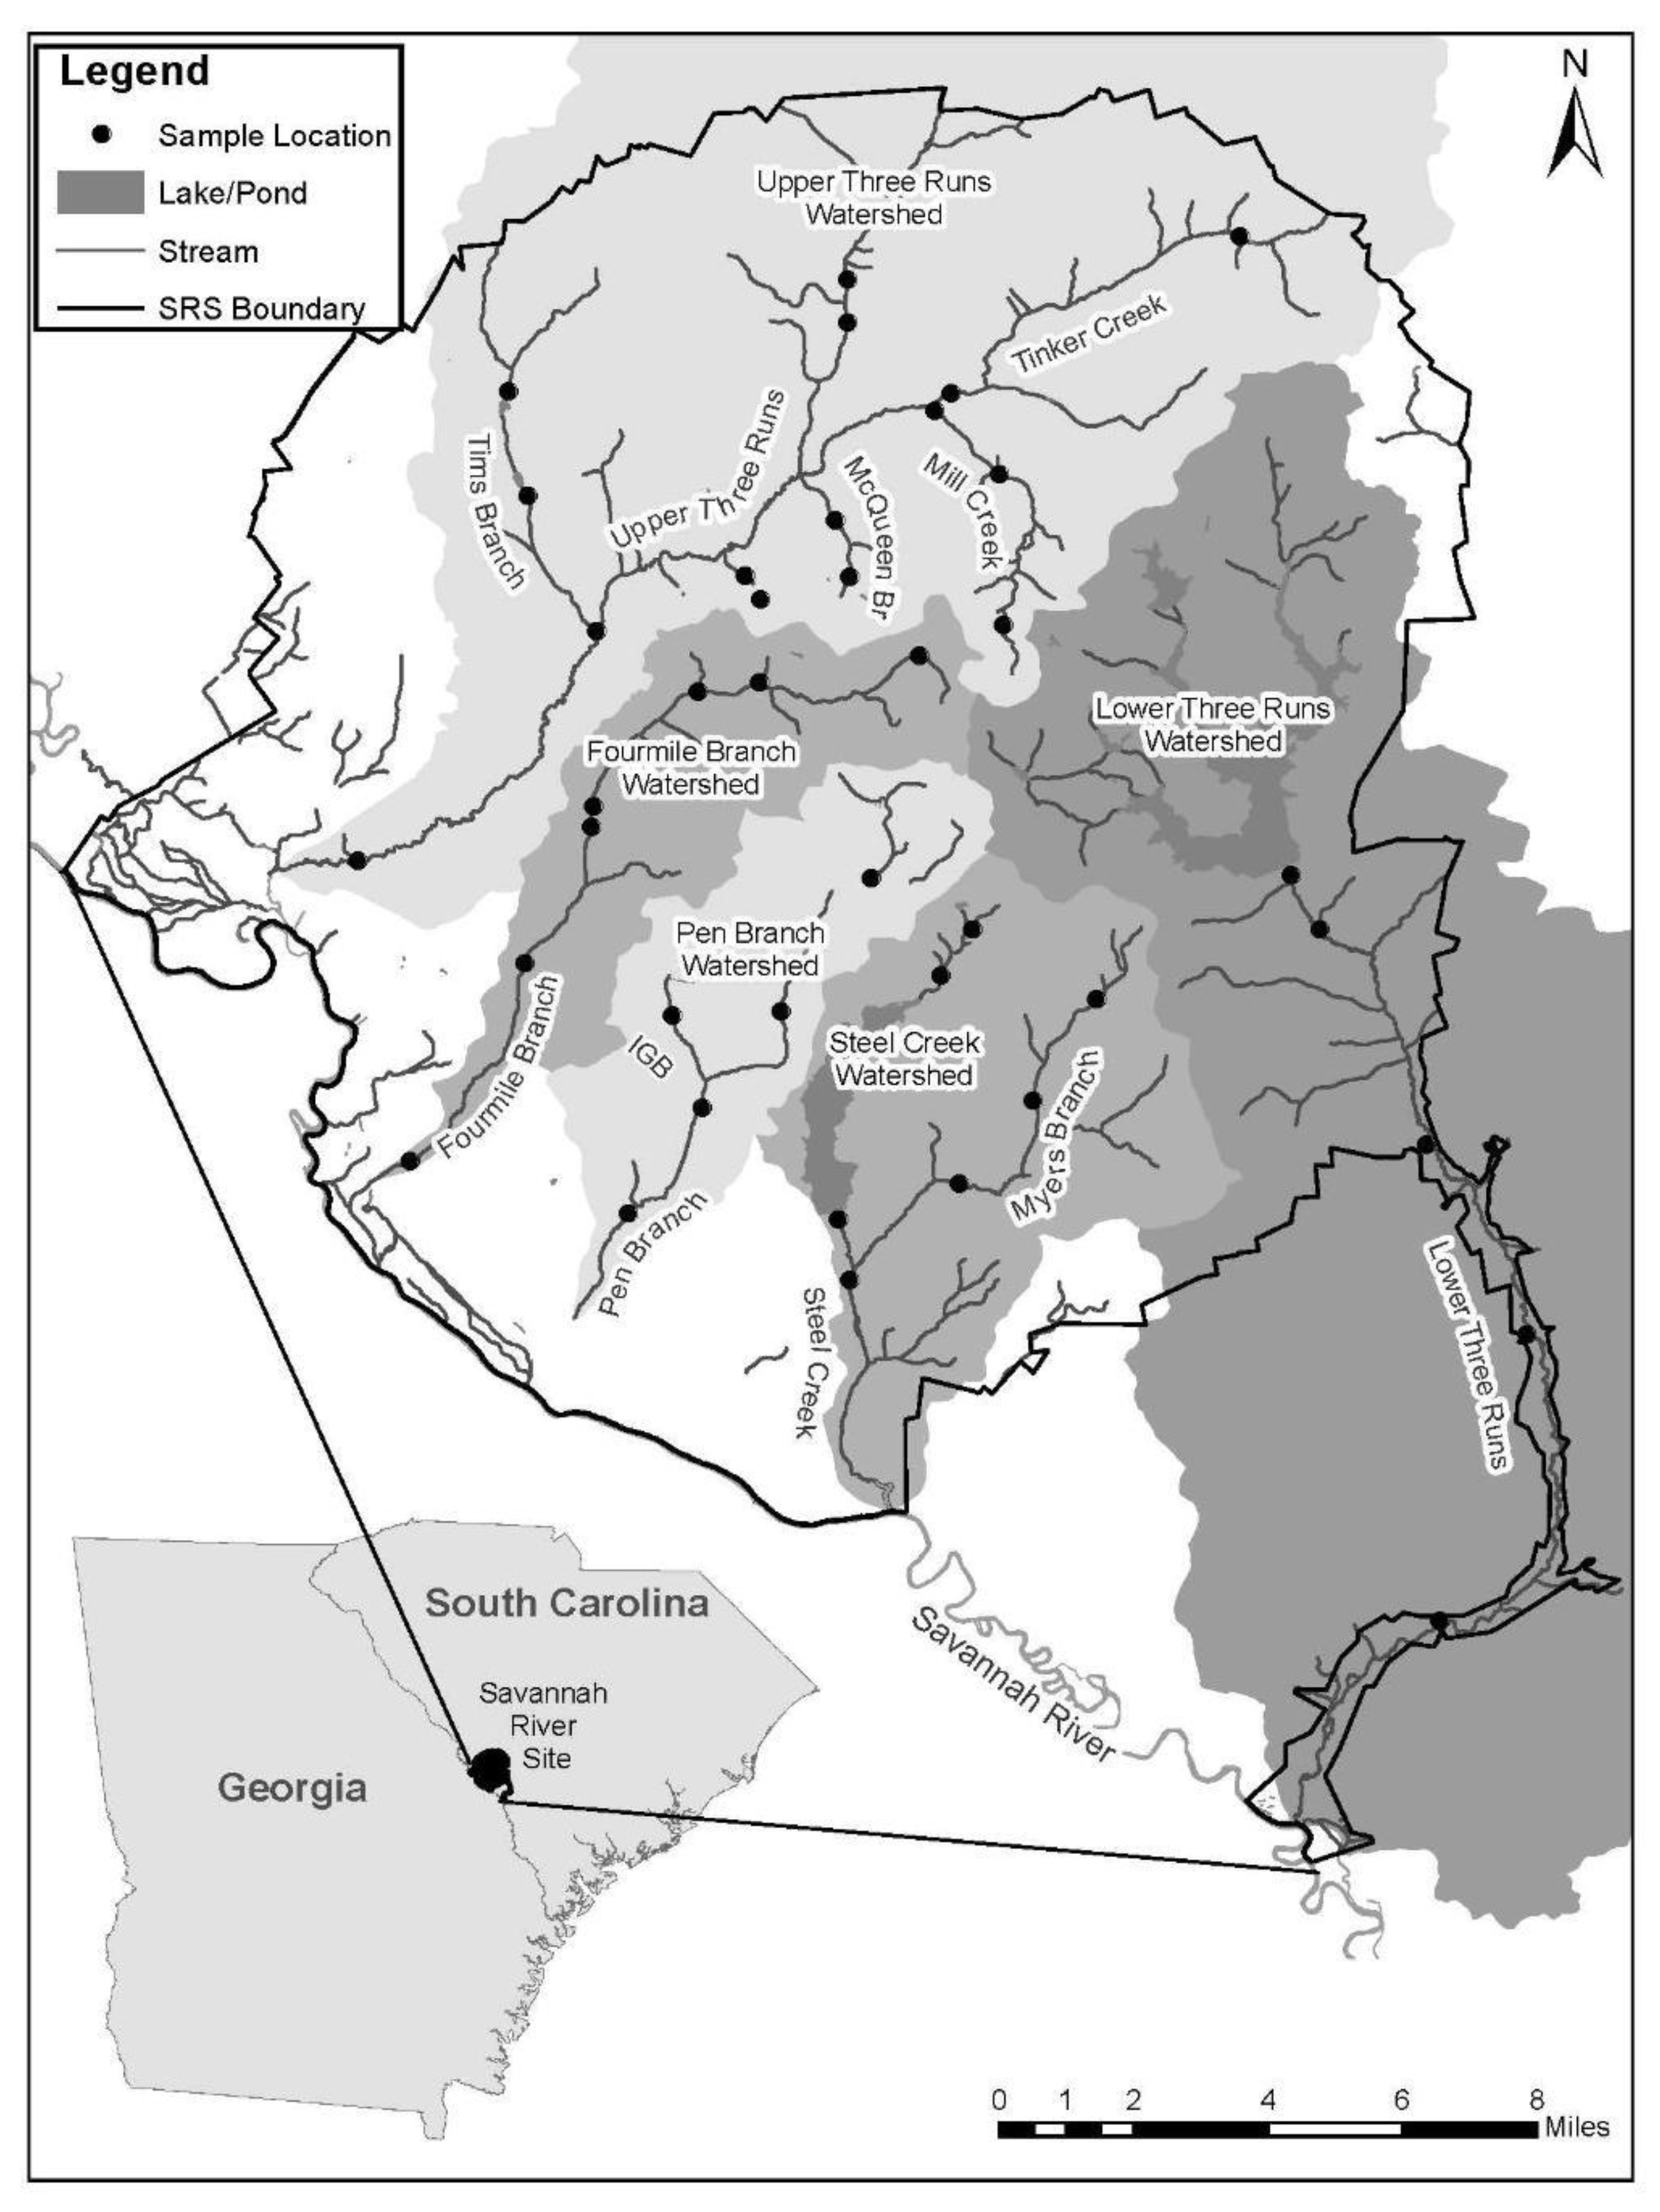
Figure 1. Sample sites for the collection of macroinvertebrates in five drainages on the Savannah River Site near Aiken, SC, USA.
Diversity 12 00459 g001
Figure 2. Genera accumulation curve for progressively greater numbers of individuals collected with a multiple habitat sampling protocol (MHSP) from 13 sites in Upper Three Runs. Also shown are the curves for seven sites selected randomly from the 13 (average of 10 random selections), the seven largest sites (based on stream width) among the 13, and the seven smallest sites among the 13. Number of individuals for the latter three curves was extrapolated to about 3160 individuals, the same number represented by the 13 sites. Symbols represent averages for each pool of 1–13 sample sites.
Diversity 12 00459 g002
Figure 3. Genera accumulation curves for progressively greater numbers of individuals collected with a multiple habitat sampling protocol (MHSP) from five sites in Upper Three Runs (UTR) that were sampled repeatedly (1997, 2000, 2003, 2007, and 2017). Curves were constructed for one through five years of cumulative sampling (i.e., 1997, 1997 plus 2000, etc.). All curves were extrapolated to about 10,000 organisms, the number collected over all five years. Circles represent averages for each pool of one to five sites, and dashed lines represent curve extrapolations.
Diversity 12 00459 g003
Figure 4. Genera accumulation curve for progressively greater numbers of samples collected with a multiple habitat sampling protocol (MHSP) from Fourmile Branch (FMB), Pen Branch (PB), and Upper Three Runs (UTR). Also shown is complete richness for each stream (standard error bars) estimated with the Chao 1 estimator.
Diversity 12 00459 g004
Table 1. Sampling effort, observed number of genera, and estimated complete number of genera (95% confidence interval) for each stream (FMB = Fourmile Branch, LTR = Lower Three Runs, PB = Pen Branch, IGB = Indian Grave Branch, MB = Meyers Branch, SC = Steel Creek, CB = Crouch Branch, MC = Mill Creek, MQ = McQueen Branch, TB = Tims Branch, TC = Tinker Creek, and UTR = Upper Three Runs).
DrainageStreams within DrainageNumber Samples *Number SitesNumber Years
Sampled
Observed Number GeneraEstimated Complete Number of Genera **% Difference between Observed and Estimated
FMBFMB31 (15, 16) *75184217 (199–257)17.9
LTRLTR15 (6, 9)54135150 (139–180)11.1
PBPB29 (16, 13)45177201 (188–232)13.6
IGB9 (5, 4)1597111(102–134)14.4
PB Drainage Total38 (21, 17)55195212 (201–238)8.7
SCMB12 (7, 5)35139169 (151–212)21.6
SC17 (9, 8)45149158 (152–178)6.0
SC Drainage Total29 (16, 13)75172189 (177–221)9.9
UTRCB12 (7, 5)2597108 (101–133)11.3
MC11 (7, 4)35137159 (146–191)16.1
MQ9 (5, 4)24109130 (117–162)19.3
TB9 (5, 4)15120141 (129–173)17.5
TC8 (5, 3)33120147 (130–194)22.5
UTR23 (13, 10)45193212 (201–238)9.8
UTR Drainage Total72 (42, 30)155259280 (268–307)8.1
* Total number of samples (number of Multiple Habitat Sampling Protocol samples, number of Hester–Dendy samples). Each Hester–Dendy sample included two to five artificial substrate samplers. ** Chao 1 estimator.
Table 2. Number of organisms (Num) and number of macroinvertebrate genera (Gen) collected from the Fourmile Branch (FMB), Lower Three Runs (LTR), Pen Branch (PB), Steel Creek (SC), and Upper Three Runs (UTR) drainages with a Multiple Habitat Sampling Protocol (MHSP) and Hester–Dendy artificial substrate samplers (HD). See Supplementary Table S1 for a list of genera.
Taxonomic GroupsFMBLTRPBSCUTRHD
(All Drainages)
MHSP
(All Drainages)
Total NumbersTotal Genera
NumGenNumGenNumGenNumGenNumGenNumGenNumGen
Turbellaria411100114110100101
Nematoda0000000021210021
Annelida-Hirudinea62112110035243594636
Annelida-Lumbriculidae1100000000110011
Annelida-Naididae17959122631653803406525336595
Annelida-Tubificidae12111224271140228113021582
Mollusca-Bivalvia105242113537226339240834173
Mollusca-Gastropoda119121236181101571018311177115861376216
Arachnida-Acari282119014912291791332149718291
Crustacea-Cladocera3100002100510051
Crustaceae-Amphipoda952262912292382118216122792
Crustaceae-Decapoda1133563231418432104100369447944
Crustaceae-Isopoda3120155118123117110211191
Insecta-Collembola110041815118100181
Insecta-Coleoptera230151038226192321611523350022144335194340
Insecta-Diptera-Chironomini1284136191012021486415211021385718222222607925
Insecta-Diptera-Orthocladiinae8811649614107523130616155325293724237425531128
Insecta-Diptera-Tanypodinae2461118911247121899647156751284315151817
Insecta-Diptera-Tanytarsini111341001511545996618437399762110761078
Insecta-Diptera-other4711444830713370119702275219141024216228
Insecta-Ephemeroptera581164071613992175917152023226224240424466625
Insecta-Heteroptera50829853738610212412681527215
Insecta-Lepidoptera236118283294172315911095311543
Insecta-Megaloptera2334344031231214102413742394
Insecta-Odonata3342219710606186361713662422913291027313929
Insecta-Plecoptera119109083381132410779149011474813164916
Insecta-Trichoptera62218365128301984519299526256324309429565829
Totals711318440801358577195760117216,64325920,06521623,94827644,013312
Totals (insects only)619115236011167564168667314715,88622818,85618321,05824339,915268
Num families8268857910186106114
Num Insect families6153666179638387
Publisher’s Note: MDPI stays neutral with regard to jurisdictional claims in published maps and institutional affiliations.