Article

Genetic Differentiation of an Endangered Megalobrama terminalis Population in the Heilong River within the Genus Megalobrama

1
National and Local United Engineering Laboratory for Freshwater Fish Breeding, Heilongjiang River Fisheries Research Institute, Chinese Academy of Fishery Sciences, Harbin 150076, China
2
State Key Laboratory of Freshwater Ecology and Biotechnology, Institute of Hydrobiology, Chinese Academy of Sciences, Wuhan 430072, China
*
Authors to whom correspondence should be addressed.
Diversity 2020, 12(10), 404; https://doi.org/10.3390/d12100404
Submission received: 6 August 2020 / Revised: 5 September 2020 / Accepted: 15 October 2020 / Published: 18 October 2020
(This article belongs to the Special Issue Aquatic Restoration Ecology and Monitoring)

Abstract

:
Megalobrama terminalis, which inhabits the Sino-Russian Heilong-Amur River Basin, has decreased critically since the 1960s. It has been listed in the Red Book of Endangered Fish Species by the Russian Federation in 2004. To guide the utilization and conservation programs of M. terminalis in the Heilong River (MTH), 3.1 kb of mitochondrial DNA (mtDNA) concatenated sequences and sequence-related amplified polymorphism (SRAP) markers (15 primer combinations) were applied to explore the genetic divergence and population differentiation of MTH within the genus Megalobrama. Clear genetic divergence between MTH and six other populations of the genus Megalobrama was found by haplotype network (mtDNA) and principal component (SRAP) analyses. Moreover, the STRUCTURE analysis based on SRAP data showed that MTH could be assigned to a particular cluster, whereas conspecific M. terminalis in the Qiantang River and Jinsha River Reservoir belonged to the same cluster. Analysis of molecular variance (AMOVA) and Fst statistics for the mtDNA and SRAP data revealed significant genetic variance and differentiation among all detected populations. Taken together, the results suggest that MTH has a strong genetic differentiation from other populations within the genus Megalobrama, which contributes to effective utilization in artificial cultivation and breeding of MTH. Furthermore, these results also provide a scientific basis for the management of MTH as a separate conservation unit.

1. Introduction

The genus Megalobrama is a member of Cultrinae in Cyprinidae fish. This genus is a kind of middle-large, economically valuable fish and is famous for its tasty meat quality [1]. The genus Megalobrama in China is mainly composed of M. amblycephala, M. terminalis, M. pellegrini and M. hoffmanni [2,3]. Among these species, M. amblycephala and M. terminalis formed a certain aquaculture scale. The M. amblycephala has two new selective breeding varieties (Pujiang No. 1 and Huahai No. 1), and its production reached 700,000 tons in 2014 [4]. In contrast, no new breed of M. terminalis has been systematically selected, and germplasm resources for aquaculture originated from the Qiantang River in Zhejiang Province and the Jinsha River Reservoir of Hongan County in Hubei Province [5,6]. According to statistics from 2016, the aquaculture area of M. terminalis in the Qiantang River (MTQ) has exceeded 600 ha in the areas of Hangzhou, Jinhua and other places in Zhejiang Province [1]. Since the success of artificial reproduction in 1988, M. terminalis in the Jinsha River Reservoir (MTJ) has been extended to the Hubei, Henan, Anhui, Sichuan, Guangdong and Fujian Provinces [6].
Remarkably, there is another native wild population of M. terminalis in the Heilong River (the Amur River in Russia), which is the northernmost, highest-latitude river in China. Although M. terminalis was historically widespread in bodies of water in the Heilong River Basin, such as the Heilong River, the Nen River, the Songhua River, Jingpo Lake and Khanka Lake [7] (Supplementary Materials Figure S1), its habitats have been shrinking year by year since the 1960s with the effects of overfishing and environmental changes [8]. Currently, only dozens of individuals can be captured per year in the Fuyuan section (134°28′ E, 48°37′ N) of the Heilong River (Figure S1). M. terminalis in the Amur River has been included in the Red Book of endangered species of the Russian Federation [9]. M. terminalis in the Heilong River (MTH) is highly popular among local consumers because of its large size and delicious taste. The potential value of these excellent properties determines that MTH will be an ideal commercially exploited species [3,7]. Due to the difficulty of wild fish collection and the high mortality in the course of temporary rearing and transport, however, systematic research on population genetics for MTH is highly limited. Recently, the phylogenetic relationships among seven populations from four species in the genus Megalobrama, including M. terminalis in the Heilong River (MTH), were clarified at the mitochondrial genome level [10]. Moreover, the artificial reproduction of MTH was achieved under pond domestication conditions [11]. However, the genetic divergence and differentiation at a population level between MTH and other populations from M. terminalis and other species within the genus Megalobrama have been not determined, which limits the effective utilization and protection of MTH.
Regarding fish species of the genus Megalobrama, genetic variance and differentiation have been well-evaluated in different natural and selected populations from M. amblycephala using morphometrics, isozymes, mitochondrial DNA (mtDNA), random amplified polymorphic DNA (RAPD) and sequence-related amplified polymorphism (SRAP) markers [12,13,14,15]. However, existing data only reflect the morphological differences between the Qiantang River and the Jinsha River reservoir, as well as between the Heilong River and the Liangzi Lake, in M. terminalis [8,16]. At the interspecies level, Li et al. completed a preliminary comparison of genetic variations among M. terminalis in the Qiantang River, M. amblycephala and M. hoffmanni using morphometrics, isozymes and RAPD markers [17]. It can be seen from existing reports that the investigations on intra- and interspecies relationships involved in M. terminalis are highly limited.
The amplified target site of SRAP is in the coding regions of the genes, and it is a highly reproducible and informative marker system. SRAP markers have been widely used to estimate the genetic diversity and structure, and varietal identification in plants [18,19] and their discriminating power is stronger than those of simple sequence repeats (SSR), inter-simple sequence repeats (ISSR) and RAPD [20]. In addition, this technique has been extended to studies of population genetics in other living organisms [21], including aquatic animals [15,22,23,24,25,26,27,28]. To understand the genetic relationships, especially the level of genetic differentiation of MTH with MTQ, MTJ and other representative geographic samples within the genus Megalobrama, containing M. amblycephala from the Liangzi Lake (MAL) and the Yi River (MAY) and M. Pellegrini from the Longxi River (MPL) and M. hoffmanni from the Xi River (MHX), we performed this survey based on mtDNA and SRAP markers.

2. Materials and Methods

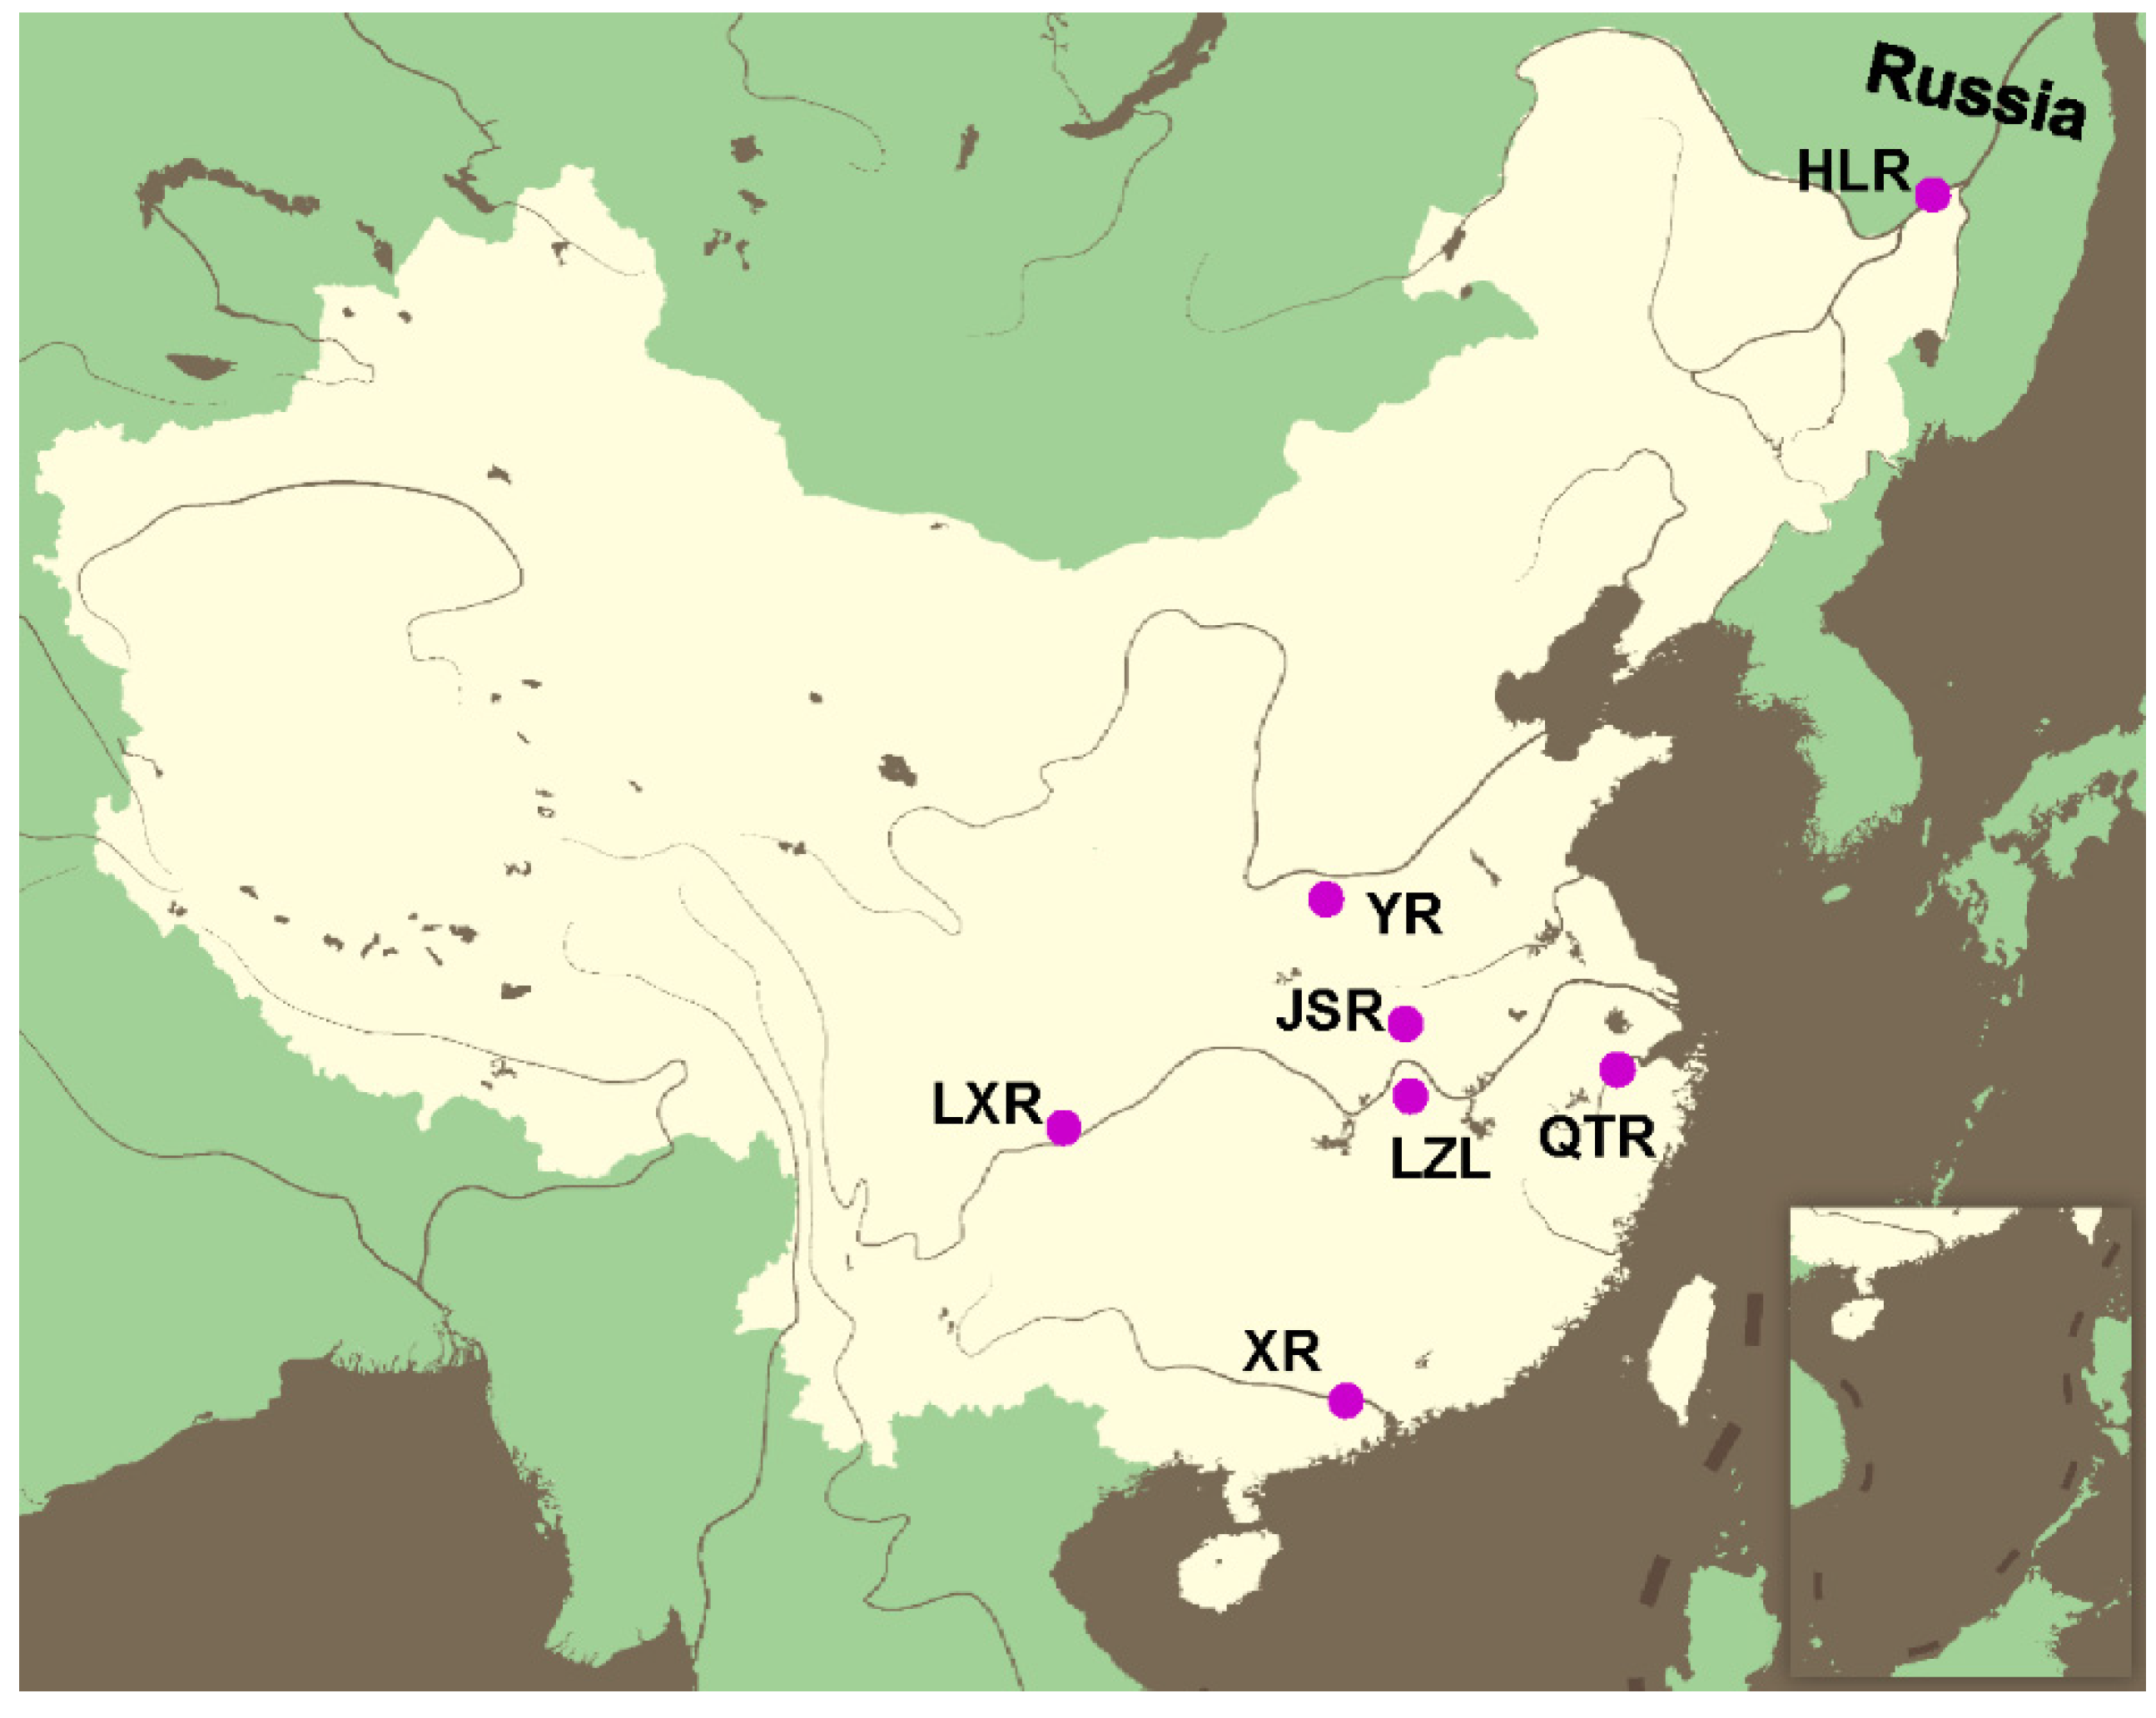
2.1. Sampling and DNA Extraction

Two hundred and ten individuals, including 7 wild populations (30 per population) of 4 species in the genus Megalobrama, were sampled by means of drift-net fishing. Sampling sites are shown in Figure 1. The numbers of individuals used for mitochondrial and SRAP analysis are shown in Table S1. Genomic DNA from fin tissues was isolated using the phenol/chloroform method and preserved in 1× TE buffer (10 mM Tris, 1 mM EDTA, pH 8.0). The quality and quantity of the DNA were detected by agarose gel electrophoresis and absorbance at 260 nm and 280 nm. DNA samples were quantified 200 ng/µL and diluted to 50 ng/µL for PCR. All animal experiments were conducted in accordance with the guidelines and approval of the Animal Research and Ethics Committees of Heilongjiang River Fisheries Research Institute.

2.2. Mitochondrial Sequencing and Analysis

Based on our previous comparative analysis of mitochondrial genome sequences of 7 populations [10], three pairs of primers were designed using Primer 5.0 (Premier Biosoft International, Palo Alto, CA, USA) to amplify putative sequences with a total of 3845 bp, including a D-loop of 1115 bp, ND2 of 1337 bp and CYTB of 1393 bp (Table S2). PCR products were amplified in a 20-µL reaction system containing 2-µL 10× PCR buffer, 1.6-µL 1.5-mM MgCl2, 0.6 µL of each primer (10 µM), 0.4-µL dNTP Mix (10-mM each of dATP, dCTP, dGTP and dTTP), 0.1-µL Taq DNA polymerase (5 U/µL), 13.7-µL H2O and 1-µL genomic DNA (50 ng/µL). The amplification protocol was as follows: 94 °C for 5 min followed by 30 cycles at 94 °C for 30 s, 52 °C for 15 s and 72 °C for 70 s and an extension at 72 °C for 5 min. PCR products were purified using an E.Z.N.A. Gel Extraction Kit (Omega Bio-Tek, Norcross, GA, USA) and subcloned into pMD18-T vectors (TaKaRa, Shiga, Japan). Recombinant clones containing each target fragment were sequenced on an ABI 3700 sequencer (Applied Biosystems, PerkinElmer, Foster City, CA, USA).
All sequences amplified by PCR were edited and aligned using the CLUSTAL X program, as implemented in MEGA 7 (Temple University, Philadelphia, PA, USA) [29] and, subsequently, aligned manually. Analysis of population variation, such as the number of haplotypes, haplotype diversity (h) and nucleotide diversity (π), were calculated by DNAsp5.0 software (Universitat de Barcelona, Barcelona, Spain) [30]. A haplotype network was constructed using the median-joining method in NETWORK 5.0.1.1 software (Fluxus Technology Ltd., Clare, Suffolk, UK) to analyze and visualize the relationships among DNA sequences. The software ARLEQUIN v3.5.2 (University of Berne, Berne, Switzerland) [31] was used to complete the analysis of molecular (AMOVA) for detecting genetic variation levels among populations and calculate pairwise Fst values for estimating the extent of genetic differentiation among populations. Significance was tested using 1000 permutations. All accession numbers of the mtDNA fragments are MN958398-MN958523.

2.3. SRAP Primer, PCR Amplification and Analysis

The primers required for SRAP refer to the primer sequences published by Li et al. [21]; 15 primer combinations (Table S3) with clear amplification bands, strong reaction stability and high reproducibility were identified from 240 combinations. All 210 individuals from 7 populations (30 per population) were genotyped using 15 primer combinations selected. The reaction system of 20 μL contained 7-μL H2O, 1-μL 10 × PCR buffer, 0.8-μL 1.5-mmol/L MgCl2, 0.2-μL 10-mmol/L dNTPs, 0.5 μL of each primer (10 µM) and 0.5 μL of 50-ng/μL genomic DNA. The PCR conditions were as follows: pre-denaturation for 5 min at 94 °C followed by the first cycle for 5 cycles of 94 °C for 1 min, 35 °C for 1 min and 72 °C for 1 min, followed by the second cycle for 35 cycles of 94 °C for 1 min, 50 °C for 1 min and 72 °C for 5 min, followed by an extension of 10 min at 72 °C. The PCR product was detected by 1.5% agarose gel electrophoresis and was further loaded to a 10% polyacrylamide gel electrophoresis with reference to the pBR 322/Msp I marker (TIANGEN, Beijing, China). The silver staining method [32] was used to display the bands. The electropherogram was analyzed by Gel-pro analyzer 4.5 software (Media Cybernetics, Inc., Rockville, MD, USA). In most of the gels, in addition to the markers to indicate the size of the bands, we also clicked a sample from a certain population used for the marker or control between gels. Moreover, the samples were from several populations in the same gel, which were contrasted with each other to reduce the influence of differences between gels on the result judgment (Figure S2). The principle for determining bands was the stability of amplification. The judgment of weak bands needed to take into account the overall (multiple populations) amplification situations. If some bands were weak but others were clear in the same pair of primers, it should be caused by the different amplification efficiency among samples; such bands were recorded in the statistics. Whereas bands in different populations were weak, indicating unstable amplification; such bands were not included. Undecidable bands were regarded as missing data. Different and reproducible SRAP bands were scored as present (1) or absent (0), and ambiguous bands or missing data were recorded with number “9”.
The polymorphism information content (PIC) of each SRAP marker was calculated by the following formula: PIC = 1 − (f2 + (1 − f)2), where f is the frequency at which the band appeared in all samples [33]. Principal component analysis (PCoA) was performed based on genetic distance using the GenAIEx 6.5 package (Australian National University, Canberra, Australia) [34] to examine the positional relationship of each group on the two-dimensional clustering map of the main coordinates. Genetic structure analysis was carried out based on the Bayesian model using Structure 2.3.4 software (Stanford University, Palo Alto, CA, USA) [35,36]. The number of subgroups was set to 1~7 with 10 repetitions. The length of the burn period for each run was set to 10,000, and the number of iterations for Markov chain Monte Carlo (MCMC) after burning was set to 100,000. The results of the calculations were analyzed online using Structure Harvester program (University of California, Santa Cruz, CA, USA), and the most likely K values were determined based on LnP(K) or ΔK values. The analysis of molecular variance (AMOVA) and the pairwise Fst values with 1000 permutations were performed using ARLEQUIN v3.5.2 software [31].

3. Results

3.1. Genetic Variability

The effective sequences of the D-loop, ND2 and CYTB from each specimen were aligned and processed separately. The concatenated sequence length for haplotype analysis was 3116 bp in samples from M. terminalis and M. pellegrini, including a D-loop of 930 bp, ND2 of 1045 bp and CYTB of 1141 bp (Table S2). The length in the CYTB gene is 1137 bp in all samples in M. amblycephala, and the length for the haplotype study in the D-loop is 927 bp, 929 bp or 931 bp in different samples in M. hoffmanni. Concatenated mtDNA sequences were obtained from 135 individuals across seven populations, and 42 haplotypes were defined. In MTH, all seven haplotypes (hap 26 to hap 32) were unique. Haplotype 26 was the most frequently observed (14 individuals), followed by hap 27 (five individuals). The haplotype diversity (Hd) was lowest in MPL (0.189), highest in MHX (0.995) and moderate in other populations (0.567–0.784). The nucleotide diversity (π) was very low in MTH (0.00045), MAL (0.00023), MAY (0.0002) and MPL (0.00073) and relatively high in MTQ (0.0033), MTJ (0.00363) and MHX (0.00437). The Hd and π for seven populations are summarized in Table 1.
Fifteen SRAP primer combinations generated 221 stable and reproducible bands, of which 214 (97%) were polymorphic (Table 2). The amplification profiles of primer combinations 1f5r, 2f9r, 4f20r and 7f20r were shown in Figure S2. The most polymorphism was from the 7f20r combination, which produced 22 polymorphic bands. The PIC of each combination ranged from 0.262 to 0.412, with an average of 0.311 (Table 2). Based on the detection values of four SRAP diversity parameters, seven populations can be divided into two distinct groups in which data for different parameters were similar within each group. Three M. terminalis populations (MTH, MTQ and MTJ) showed relatively high levels of variability (number of polymorphic bands (NPB) = 112–115, percent polymorphic bands (PPB) = 50.68–52.04%, Nei’s gene diversity (h) = 0.168–0.177, Shannon’s Information Index (I) = (0.252–0.263) (Table 3). In contrast, the other four populations (MAL, MAY, MPL and MHX) exhibited relatively low variation (NPB = 76–83, PPB = 34.39–37.56, h = 0.109–0.128, I = 0.169–0.192) (Table 3).

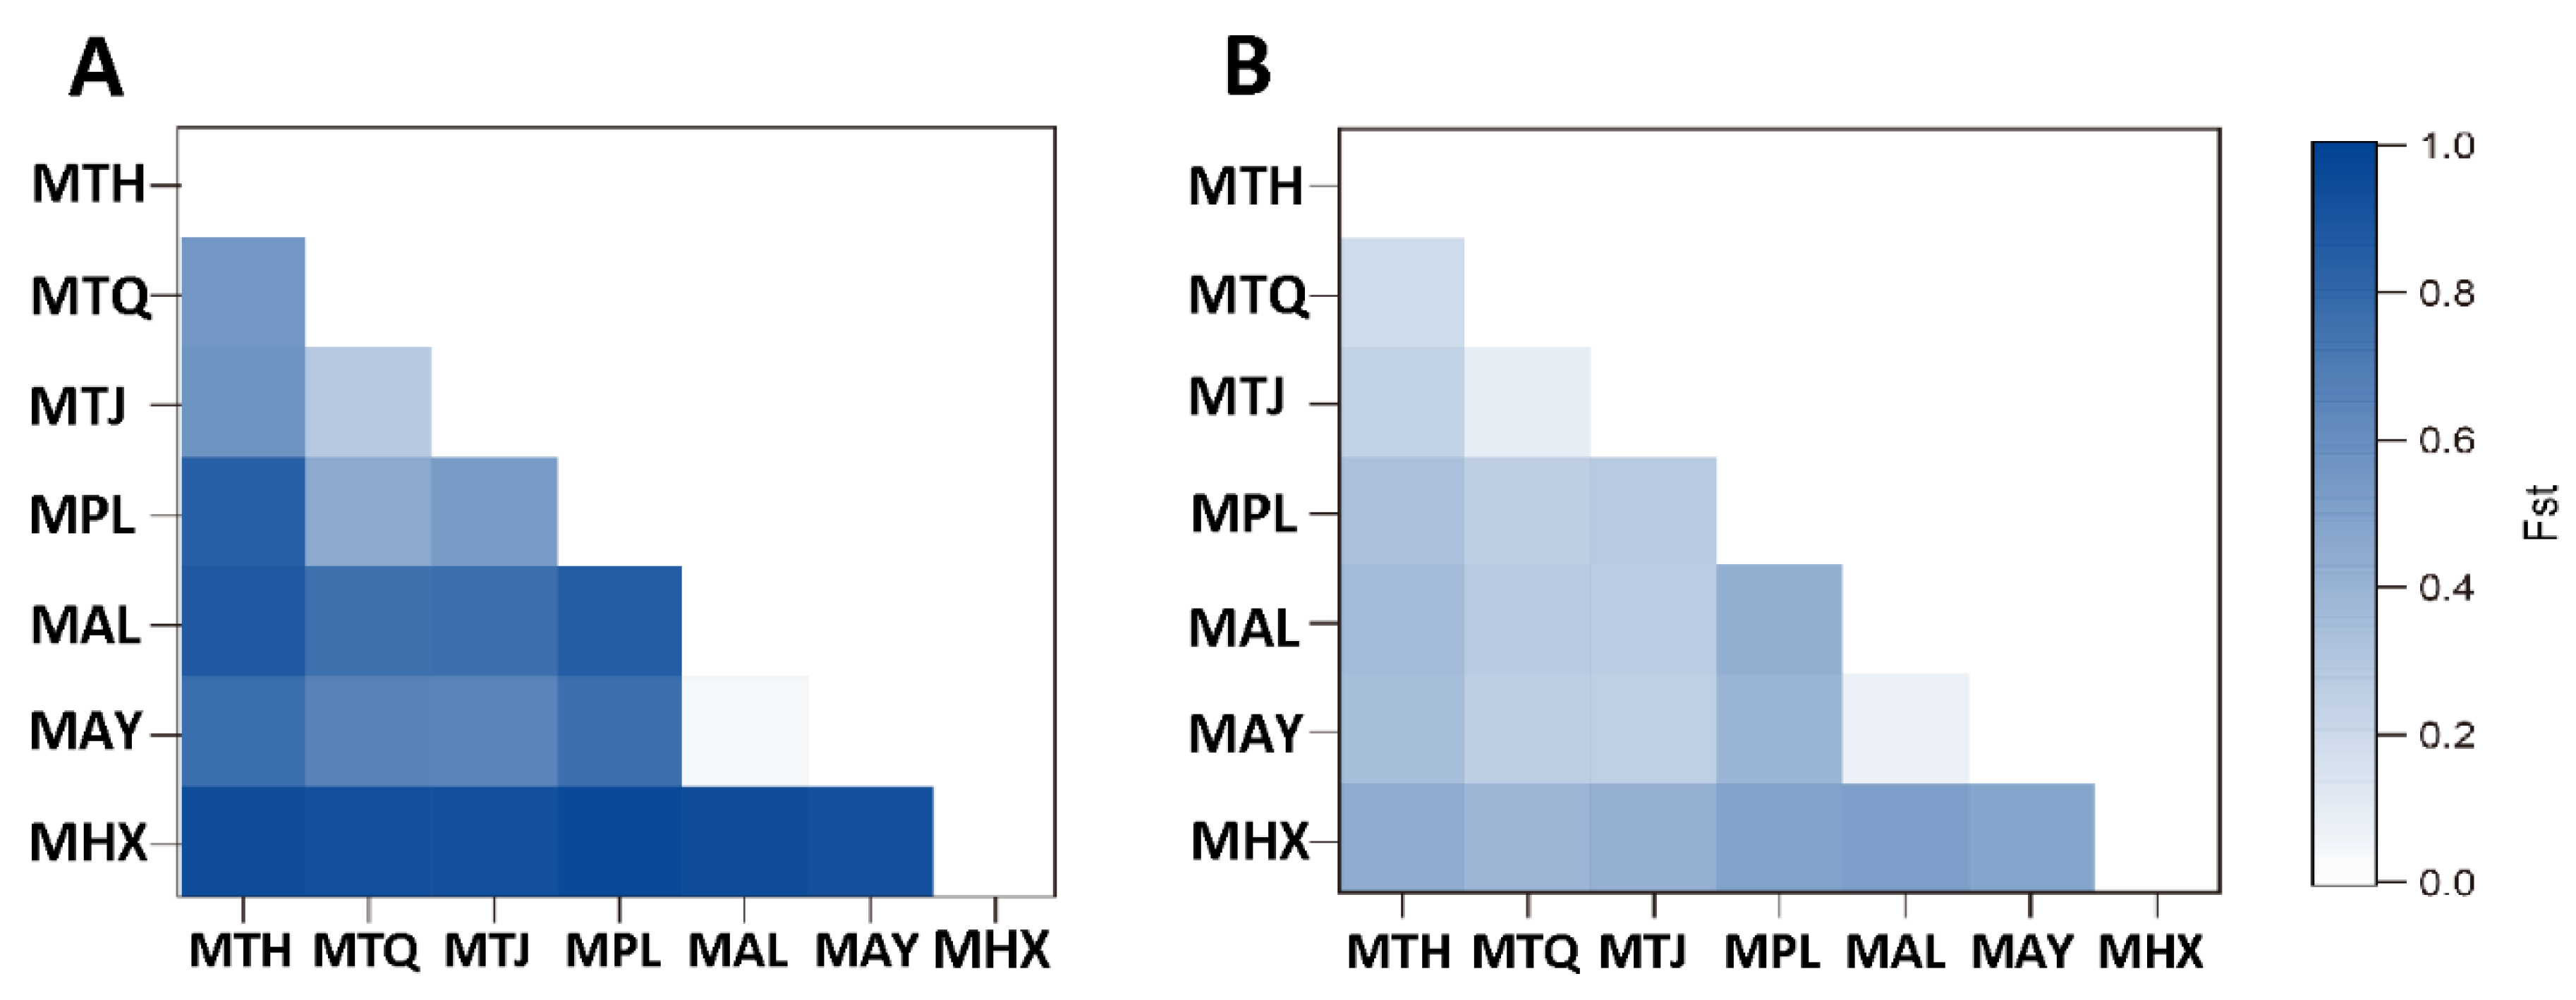
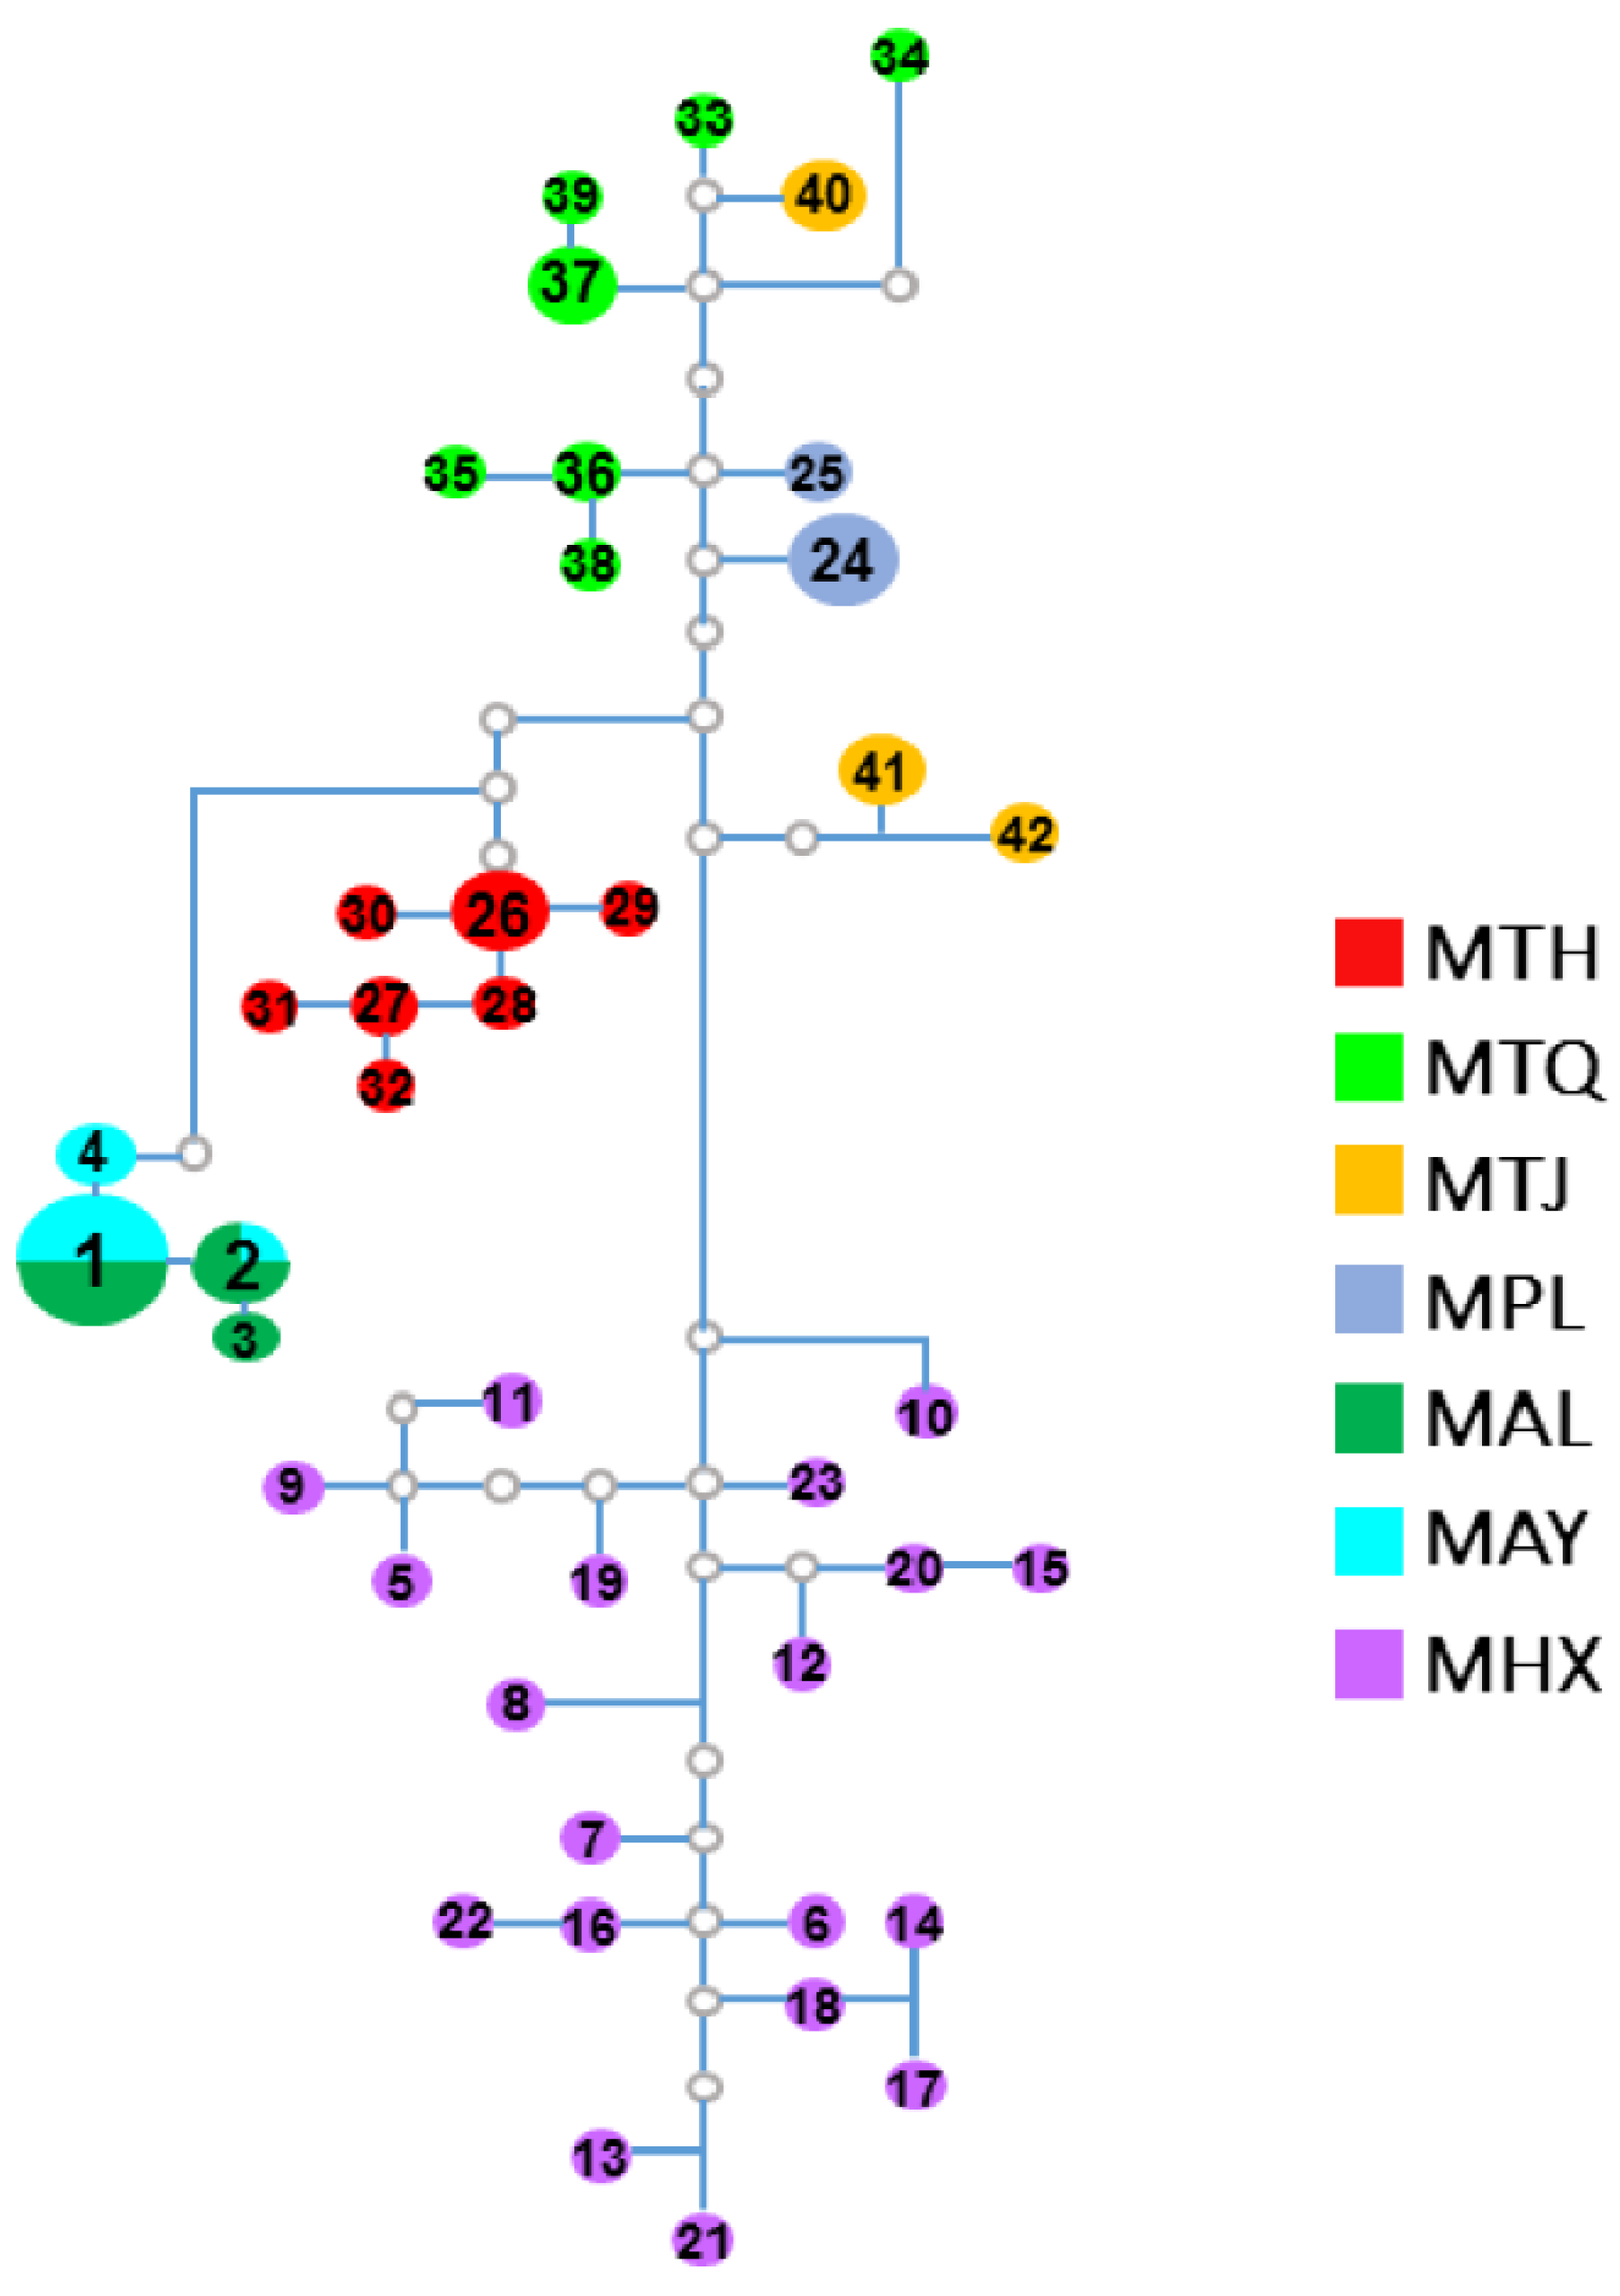
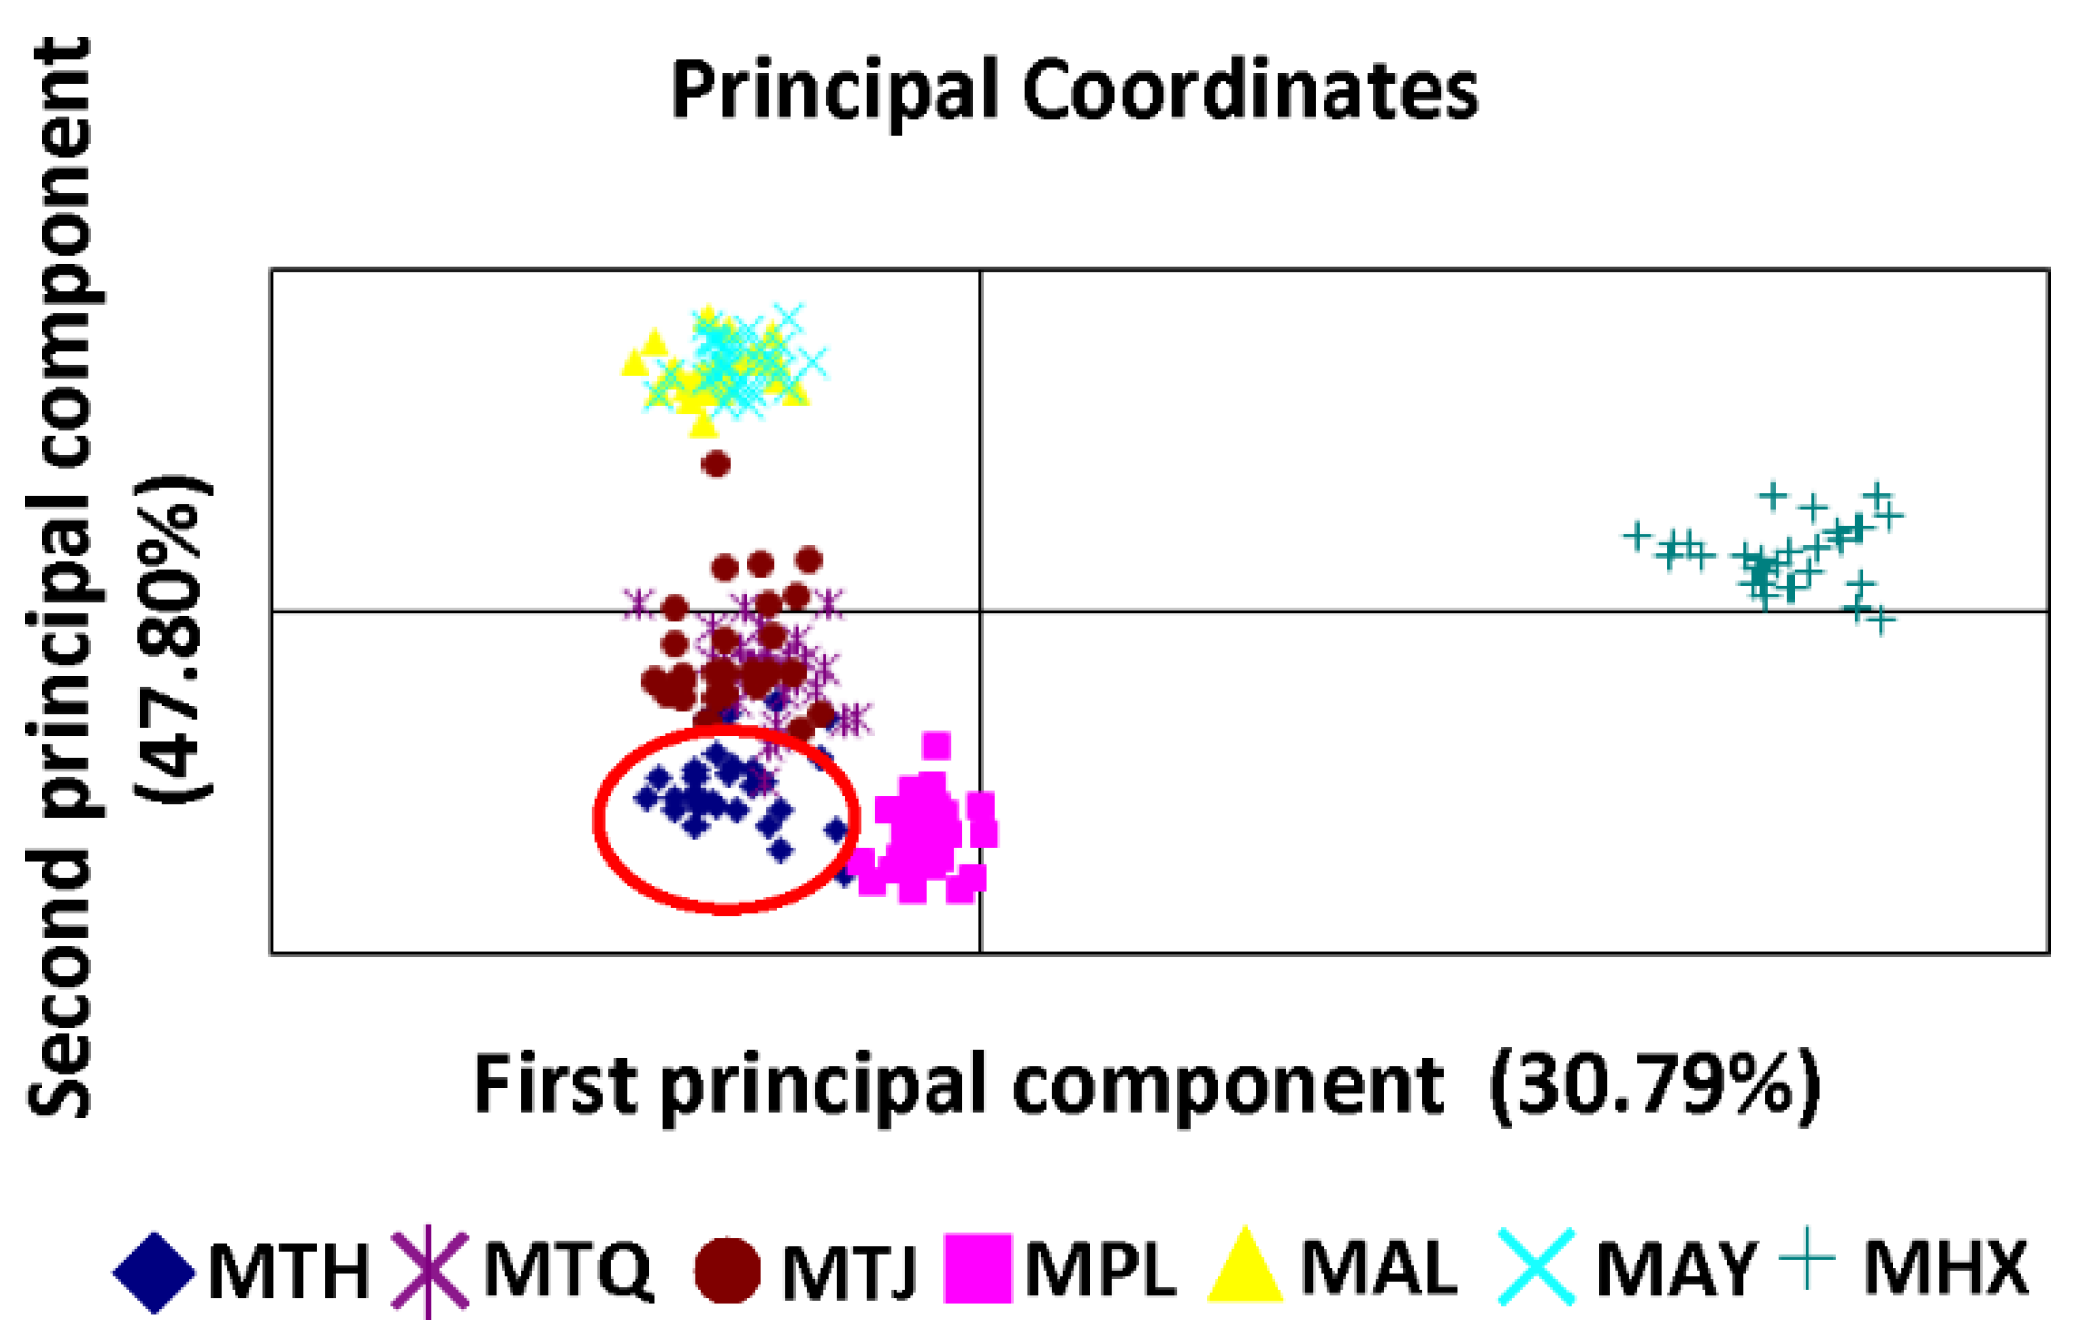
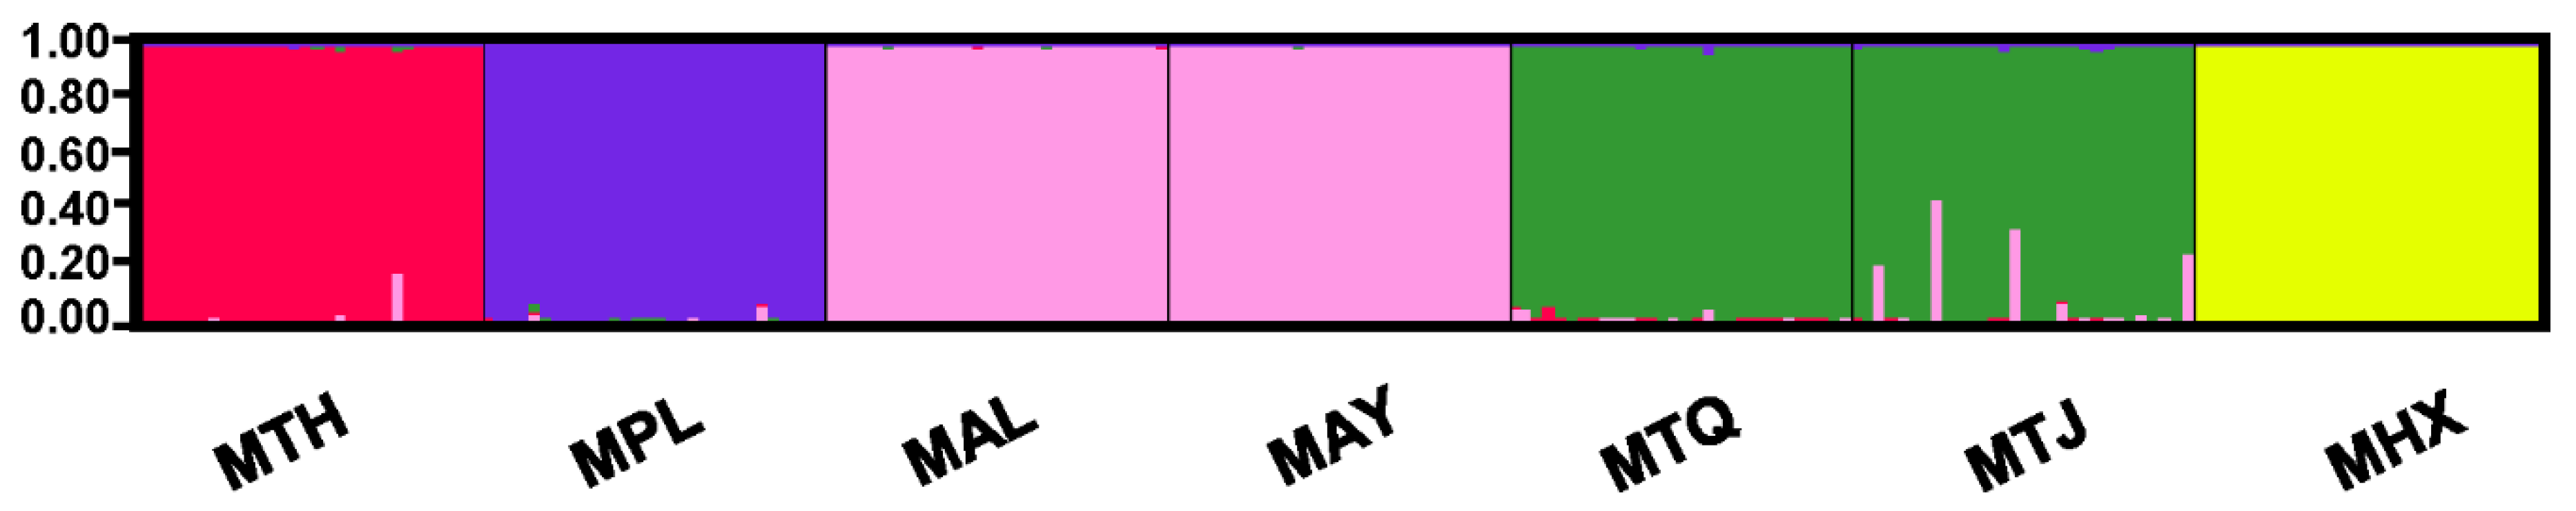
3.2. Population Genetic Structure and Differentiation

Median-joining network analysis showed that MTH formed a single haplogroup, whereas there were only three haplotypes in MTJ, and one of them was clustered with the haplogroup of MTQ. Two populations for MAL and MAY constituted a haplogroup in which there were two shared haplotypes (Figure 2).
In the principal component analysis (PCoA), the first and second axes explained 30.79% and 47.80% of the variation, respectively. The single scattered point clusters corresponding to MTH, MPL and MHX had almost no overlap with other populations, while the points corresponding to MTQ and MTJ and between MAL and MAY had a certain degree of overlap (Figure 3).
Moreover, the best K value was determined online using Structure Harvester. Based on the method described by Evanno et al. [37], a clear peak (ΔK = 148.76) was shown at K = 5 (Figure S3). Estimated subpopulations for the 210 individuals (seven populations) are shown in Figure 4. Any individual with a membership probability (Q) less than 0.8 was treated as admixed. All of the individuals from MTH were assigned irrefutably to the red subset (Q > 0.98). Individuals from MTQ and MTJ were placed in the green subset (Q > 0.96), except four individuals from MTJ, who were treated as admixed. The purple subset only consisted of individuals from MAL and MAY (Q > 0.98), while the blue (Q > 0.94) and yellow (Q > 0.98) subsets contained individuals from MPL and MHX, respectively.
To characterize the genetic variance among populations in four species of the genus Megalobrama, four groups were considered based on each species and compared on the basis of hierarchical AMOVA with both mtDNA and SRAP markers (Table 4). Significant genetic differentiation was detected among the four groups (p < 0.01), among the seven populations within the groups (p < 0.01) and within the populations (p < 0.01). In addition, each of the seven populations showed highly significant genetic differentiation (p < 0.01), except between MAL and MAY (p < 0.05), by pairwise Fst based on mtDNA and SRAP genotypes (Figure 5).

4. Discussion

Our recent research clarified the characterization of the mitochondrial genome of MTH in the genus Megalobrama [10]. Based on the analysis of the genomic-level variation sites, the concatenated fragment of D-loop, ND2 and CYTB was selected for the present study. MTH displayed a low level of genetic variability in the mtDNA sequences (π = 0.00045) compared with the other two M. terminalis populations (MTQ, π = 0. 0033 and MTJ, π = 0.0036), while MTH was at the same level as MPL (π = 0.00073), MAL (π = 0.00023) and MAY (π = 0.0002). This level of variation of MPL was highly consistent with a previous report (π = 0.00077) based on the D-loop fragment [38], providing evidence of the reliability of this data. MTH need at least five years to reach sexual maturity, and it is easy to catch on account of body shape [7,9]. These characteristics of MTH makes it more susceptible to environmental and anthropogenic factors; we therefore speculate that the low diversity of MTH may be due to the bottleneck effect. Since samples were not collected before the population declined, the exact mechanism needs further study.
Moreover, SRAP markers have also been used in genetic variability analyses at the nuclear genome level. Among these markers in the MAL, we obtained 82 polymorphic bands, which is similar to the result (88 polymorphic bands) reported by Ji et al. based on 13 pairs of primers in M. amblycephala of the Liangzi Lake [15], indicating that SRAP has desirable repeatability and stability. On the other hand, based on results of the SRAP analysis, the genetic variability level of MTH was comparable to MTQ and MTJ, which was inconsistent with the low variation level of MTH obtained by the mtDNA fragments. In many species, including fish, discordant results between nuclear diversity and mtDNA diversity are common [39,40,41,42], which may be related to inheritance patterns, mutation rates and differences in marker characteristics between the mitochondrial and nuclear genomes. Another probable reason is that the effective population size of MTH is sufficiently small, so that the combined effects of genetic drift produced a greater impact on mtDNA diversity than on nuclear DNA diversity [43].
Although phylogenetic research clarified that MTH shared a common ancestor with MTQ, MTJ and MPL, and provided evidence that MPL should be regarded as one of the geographical populations of M. terminalis, the exact genetic differentiation between MTH and other populations in the genus Megalobrama remains to be determined at the population level. In this study, information from the haplotype (D-loop, ND2 and CYTB) network and PCoA (SRAP markers) analysis suggested that there was a strong genetic divergence of MTH with other closely related populations. Furthermore, the STRUCTURE analysis showed that MTH could be assigned to a particular cluster, whereas MTQ and MTJ belonged to the same cluster. These data demonstrated that MTH underwent long-term reproductive isolation resulting from habitat fragmentation and barriers to gene flow. On the other hand, this finding also reflected that MTH maintains a pure gene pool without any gene pollution from farmed M. terminalis or M. amblycephala. Notably, the hierarchical AMOVA and pairwise Fst values results for the mtDNA and SRAP data revealed significant genetic variation and differentiation among all populations, and it showed higher pairwise Fst values between MTH and MPL than MTH with MTQ and MTJ. These findings indicate the genetic differentiation level of MTH from other populations, and further provide evidence to support the species taxonomy of MTH [10]. It is not difficult to conclude that MTH has generated a substantial population structure.
The Heilong River Basin is currently one of the most well-preserved bodies of waters for fish diversity in China [44]. Fish species distributed in the Heilong River usually have the characteristics of large size, strong stress resistance and good meat quality [45]. As the only naturally distributed fish species in the genus Megalobrama north of the Yellow River, MTH possesses notably high economic, scientific and ecological value. In particular, MTH has the potential to be an excellent hybrid parent, because long-term segregation in unique habitats may enable it to evolve key genes required for the breeding of fish species in the genus Megalobrama. To the best of our knowledge, this report is the first to describe the genetic divergence and population differentiation between MTH and other populations in the genus Megalobrama. These data provide an important scientific basis for the further artificial cultivation, breeding application and scientific protection of this endangered species in the future.

Supplementary Materials

The following are available online at https://www.mdpi.com/1424-2818/12/10/404/s1: Figure S1: Historical distribution of M. terminalis in the Heilong River Basin. HLR, the Heilong River (Fuyuan); AR, the Amur River; SHR, the Songhua River; NR, the Nen River; JPL, Jingpo Lake and KL, Khanka Lake. A red dot represents that wild M. terminalis in the location has disappeared. A blue dot indicates that wild M. terminalis in the location is still present. Figure S2: SRAP marker profiles generated from partial samples of 6 populations in the genus Megalobrama with primer combinations 1f5r (A), 2f9r (B), 4f20r (C) and 7f20r (D). M: pBR 322/Msp I marker; Lanes with different color represent samples of corresponding populations (MTH, M. terminalis in the Heilong River; MTQ, M. terminalis in the Qiantang River; MTJ, M.terminalis in the Jinsha River Reservoir; MPL, M. pellegrini in the Longxi River; MAL, M. amblycephala in the Liangzi Lake and MAY, M. amblycephala in the Yi River). The red arrows point to polymorphic bands with amplification stability. Figure S3: Establishment of the K value in the STRUCTURE analysis. (A) Relationship between K and Delta K. (B) Table output following the method of Evanno et al. [37]. Yellow highlight indicates the largest value in the Delta K column. Table S1: Sampling sites and number of individuals used for mtDNA and SRAP analysis. Table S2: Information on fragments for amplification and haplotype analysis in the D-loop, ND2 and CYTB genes. Reference mtDNA sequence of Megalobrama terminalis in the Heilong River (MTH) (accession no. MH289765). Table S3: Sequences of 15 SRAP primers.

Author Contributions

Conceptualization, X.H., B.M., J.T. and L.S.; methodology, X.H. and B.M.; formal analysis, Z.J. and X.H.; investigation, X.H., C.L. and X.J.; resources, C.L., X.H. and J.T.; supervision, B.M. and L.S.; visualization, Y.G. and X.H., data curation, X.H.; writing—original draft preparation, X.H.; writing—review and editing, X.H., B.M., C.L, Z.J., X.J, Y.G., J.T. and L.S.; project administration, X.H. and L.S. and funding acquisition, X.H., B.M. and L.S. All authors have read and agreed to the published version of the manuscript.

Funding

This research was funded by the Central Public-interest Scientific Institution Basal Research Fund HRFRI (grant number: HSY201807M), Special project on agricultural financial fund from the Ministry of Agriculture and Rural Affairs of China entitled “Survey of fishery resources and environment in key waters of Northeast China” and Central Public-interest Scientific Institution Basal Research Fund CAFS (grant number: 2018HY-XKQ02-04).

Acknowledgments

We thank Xiaoyu Feng, Weimin Wang, Zuogang Peng, Zhixun Li and Changyi Qu for their help during the sample collection.

Conflicts of Interest

The authors declare no conflict of interest.

References

  1. Liu, X.Y.; Xie, N.; Ma, H.J.; Feng, X.Y. An overview of the germplasm characteristics of four fish species in the genus Megalobrama. H. Z. Agr. Sci. Tech. 2016, 6, 41–43. (In Chinese) [Google Scholar]
  2. Yi, P.L. Notes on Megalobrama amblycephala, sp. Nov., a distinct species from M. terminalis (Richardson). Hydribiol. Anthol. 1955, 2, 115–122, (In Chinese with English Abstract). [Google Scholar]
  3. Hu, X.S.; Shi, L.Y. Research progress on germplasm resource of black bream (Megalobrama terminalis) in China. Chin. J. Fish. 2020, 3, 84–89, (In Chinese with English Abstract). [Google Scholar]
  4. Gao, Z.X.; Wang, W.M.; Jiang, E.M.; Chen, B.X. Research advances on germplasm resources and genetic improvement of blunt snout bream (Megalobrama amblycephala). J. Huazhong Agric. Univ. 2014, 33, 138–144, (In Chinese with English Abstract). [Google Scholar]
  5. Feng, X.Y. Research progress, demonstration and expansion of Megalobrama terminalis in Zhejiang Province. Sci. Fish Farming 2009, 10, 40–41. (In Chinese) [Google Scholar]
  6. Liang, K.X.; Li, M.B. Developing now breeds and large-scale culturing Megalobrama terminalis. J. Hydroecol. 1994, 6, 37–38. (In Chinese) [Google Scholar]
  7. Zhang, J.M. Ichthyography of the Heilongjiang Province, 1st ed.; Heilongjiang Science and Technology Press: Harbin, China, 1995; p. 120. (In Chinese) [Google Scholar]
  8. Wang, Z.Y.; Yang, D.Y.; Zhang, Z.H.; Ma, X.Z.; Jin, X.; Hu, C.X. The preliminary study on Megalobrama skolkovii Dybowsky from Heilong River. Fish Heilongjiang 1993, 10–13. (In Chinese) [Google Scholar]
  9. Novomodny, G.; Sharov, P.; Zolotukhin, S. Amur Fish: Wealth and Crisis, 1st ed.; WWF RFE: Vladivostok, Russia, 2004; p. 15. [Google Scholar]
  10. Hu, X.S.; Luan, P.X.; Cao, C.H.; Li, C.T.; Jia, Z.Y.; Ge, Y.L.; Shang, M.; Wang, S.H.; Meng, Z.N.; Tong, J.G.; et al. Characterization of the mitochondrial genome of Megalobrama terminalis in the Heilong River and a clearer phylogeny of the genus Megalobrama. Sci. Rep. 2019, 9, 8509. [Google Scholar] [CrossRef]
  11. Hu, X.S.; Xu, C.X. Artificial breeding of Faluo fish has been successful. Fish. Sci. Tech. Inform. 2019, 46, 236–237. (In Chinese) [Google Scholar]
  12. Li, S.F.; Cai, W.Q.; Zhou, B.Y. Morphology and biochemical genetic variations among populations of blunt snout bream (Megalobrama abmlycephala). J. Fish. China 1991, 15, 204–211, (In Chinese with English Abstract). [Google Scholar]
  13. Zhang, D.C. Study on genetic diversity of bluntnose black bream from Yunihu and Liangzihu Lakes. J. Chin. Three Gorges Univ. 2001, 23, 282–284, (In Chinese with English Abstract). [Google Scholar]
  14. Li, H.H. MtDNA sequence variation and genetic structure of the Megalobrama amblycephala from Yuni Lake, Liangzi Lake and Poyang Lake. Freshw. Fish. 2008, 38, 63–65, (In Chinese with English Abstract). [Google Scholar]
  15. Ji, W.; Zhang, G.R.; Ran, W.; Gardner, J.P.A.; Wei, K.J.; Wang, W.M.; Zou, G.W. Genetic diversity of and differentiation among five populations of blunt snout bream (Megalobrama amblycephala) revealed by SRAP markers: Implations for conservation and management. PLoS ONE 2014, 9, e108967. [Google Scholar] [CrossRef] [PubMed] [Green Version]
  16. Song, W.; Wang, Y.Z.; Zhu, D.M.; Nie, Z.L.; Wang, W.M. Morphological variation and discriminant analysis of three geographical populations of freshwater bream Megalobrama skolkovii. Chin. J. Fish. 2013, 26, 1–7, (In Chinese with English Abstract). [Google Scholar]
  17. Li, S.F.; Zhu, Z.W.; Zou, S.M.; Zhao, J.L.; Cai, W.Q. Interspicific phylogenesis and intraspecific genetic differences of genus Megalobrama: Bluntnose black bream (M. amblycephala), Guangdong black bream (M. hoffmanni) and black bream (M. terminalis). Acta Zool. Sin. 2002, 48, 339–345, (In Chinese with English Abstract). [Google Scholar]
  18. Robarts, D.W.H.; Wolfe, A.D. Sequence-related amplified polymorphism (SRAP) markers: A potential resource for studies in plant molecular biology. Appl. Plant Sci. 2014, 2, 1400017. [Google Scholar] [CrossRef] [PubMed]
  19. Li, G.; Quiros, C.F. Sequence-related amplified polymorphism (SRAP), a new marker system based on a simple PCR reaction: Its application to mapping and gene tagging in Brassica. Theor. Appl. Genet. 2001, 103, 455–461. [Google Scholar] [CrossRef]
  20. Budak, H.; Shearman, R.C.; Parmaksiz, I.; Dweikat, I. Comparative analysis of seeded and vegetative biotypes buffalograsses based on phylogenetic relationship using ISSRs, SSRs, RAPDs and SRAPs. Theor. Appl. Genet. 2004, 109, 280–288. [Google Scholar] [CrossRef]
  21. Li, X.Y.; Li, J.; Zhao, Z.J.; Yang, F.; Fu, Q.W.; Liu, H.S.; Wang, D.D.; Yang, Y.C.; Yang, R.Y. Sequence-related amplified polymorphism (SRAP) for studying genetic diversity and population structure of plants and other living organisms: A protocol. J. Anim. Plant Sci. 2014, 24, 1478–1486. [Google Scholar]
  22. Hu, Z.H.; Xu, J.Z.; Wang, Y.B.; Chai, X.J. SRAP analysis of genetic variation between female and male swimming carb (Portunus trituberculatus). J. Shanghai Ocean Univ. 2010, 19, 734–738, (In Chinese with English Abstract). [Google Scholar]
  23. Ding, W.D.; Cao, Z.M.; Cao, L.P. Molecular analysis of grass carp (Ctenopharyngodon idella) by SRAP and SCAR molecular markers. Aquacult. Int. 2010, 18, 575–587, (In Chinese with English Abstract). [Google Scholar] [CrossRef]
  24. Zhang, H.Y.; He, M.X. Segregation pattern of SRAP marker in F1 generation of Pinctada martensii family. Mar. Sci. Bull. 2009, 28, 50–56, (In Chinese with English Abstract). [Google Scholar]
  25. Zhang, Z.W.; Han, Y.P.; Zhong, X.M.; Zhang, Z.Y.; Cao, Z.M.; Wu, T.T. Genetic structure analysis of grass carp populations between wild and cultured ones. J. Fish. Sci. China 2007, 14, 720–725, (In Chinese with English Abstract). [Google Scholar]
  26. Xin, W.T.; Sun, Z.W.; Yin, H.B.; Sun, Y. Identification of sex-associated SRAP markers in Pelteobagrus fulvidraco. J. Northeast For. Univ. 2009, 37, 112–113, (In Chinese with English Abstract). [Google Scholar]
  27. Zhang, H.; Sun, Z.W.; Liu, W.; Yin, H.B. Orthogonal design and optimization of SRAP amplification system for Oncorhynchus keta. Chin. J. Fish. 2010, 23, 6–10, (In Chinese with English Abstract). [Google Scholar]
  28. Fadly, G.E.; Khatab, I.; Rehan, M.; Kalboush, A. Genetic diversity in Egyptian populations of Tilapia species using RAPD and SRAP markers. J. Bio. Env. Sci. 2016, 8, 231–243. [Google Scholar]
  29. Kumar, S.; Stecher, G.; Tamura, K. MEGA7: Molecular evolutionary genetics analysis version 7.0 for bigger datasets. Mol. Biol. Evol. 2016, 33, 1870–1874. [Google Scholar] [CrossRef] [PubMed] [Green Version]
  30. Librado, P.; Rozas, J. DnaSP v5: A software for comprehensive analysis of DNA polymorphism data. Bioinformatics 2009, 25, 1451–1452. [Google Scholar] [CrossRef] [PubMed] [Green Version]
  31. Excoffier, L.; Lischer, H.E.L. Arlequin suite ver 3.5: A new series of programs to perform population genetics analyses under Linux and Windows. Mol. Ecol. Resour. 2010, 10, 564–567. [Google Scholar] [CrossRef]
  32. Bassam, B.J.; Caetano-Anollés, G.; Gresshoff, P.M. Fast and sensitive silver staining of DNA in polyacrylamide gels. Anal. Biochem. 1991, 196, 80–83. [Google Scholar] [CrossRef]
  33. Riek, J.D.; Calsyn, E.; Everaert, I.; Bockstaele, E.V.; Loose, M.D. AFLP based alternatives for the assessment of distinctness, uniformity and stability of sugar beet varieties. Theor. Appl. Genet. 2001, 103, 1254–1265. [Google Scholar] [CrossRef]
  34. Peakall, R.; Smouse, P.E. GenAlEx 6.5: Genetic analysis in Excel. Population genetic software for teaching and research-an update. Bioinformatics 2012, 28, 2537–2539. [Google Scholar] [CrossRef] [PubMed] [Green Version]
  35. Pritchard, J.K.; Stephens, M.; Donnelly, P. Inference of population structure using multilocus genotype data. Genetics 2000, 155, 945–959. [Google Scholar] [PubMed]
  36. Falush, D.; Stephens, M.; Prichard, J.K. Inference of population structure using multilocus genotype data: Dominant markers and null alleles. Mol. Ecol. Notes 2007, 7, 574–578. [Google Scholar] [CrossRef] [PubMed]
  37. Evanno, G.; Regnaut, S.; Goudet, J. Detecting the number of clusters of individuals using the software STRUCTURE: A simulation study. Mol. Ecol. Resour. 2005, 13, 377–392. [Google Scholar] [CrossRef] [PubMed] [Green Version]
  38. Wang, J.J.; Tong, J.G.; Zhang, Y.G.; Peng, Z.G. Study on the genetic diversity of two wild populations of Megalobrama Pellegrini (Teleostei, Cyprinidae). Acta Hydrobiol. Sin. 2014, 38, 975–979, (In Chinese with English Abstract). [Google Scholar]
  39. Brunner, P.C.; Douglas, M.R.; Bernatchez, L. Microsatellite and mitochondrial DNA assessment of population structure and stocking effects in Arctic charr Salvelinus alpinus (Teleostei: Salmonidae) from central alpine lakes. Mol. Ecol. 1998, 7, 209–233. [Google Scholar] [CrossRef] [Green Version]
  40. Yamaguchi, K.; Nakajima, M.; Taniguchi, N. Loss of genetic variation and increased population differentiation in geographically peripheral populations of Japanese char Salvelinus leucomaenis. Aquaculture 2010, 308, S20–S27. [Google Scholar] [CrossRef]
  41. Höglund, J.; Morrison, D.A.; Mattsson, J.G.; Engström, A. Population genetic of the bovine/cattle lungworm (Dictyocaulus viviparus) based on mtDNA and AFLP marker techniques. Parasitology 2006, 133, 89–99. [Google Scholar] [CrossRef] [Green Version]
  42. Omote, K.; Nishida, C.; Takenaka, T.; Saito, K.; Shimura, R.; Fujimoto, S.; Sato, T.; Masuda, R. Recent fragmentation of the endangered Blakiston′s fish owl (Bubo blakistoni) population on Hokkaido island, Northern Japan, revealed by mitochondrial DNA and microsatellite analysis. Zool. Lett. 2015, 1, 16. [Google Scholar] [CrossRef] [Green Version]
  43. Palumbi, S.R.; Cipriano, F.; Hare, M.P. Predicting nuclear gene coalescence from microchondrial data: Three-times rule. Evolution 2001, 55, 859–868. [Google Scholar] [CrossRef]
  44. Ren, M.L. Ichthyofauna of the Heilongjiang River. Chin. J. Fish. 1994, 7, 1–14, (In Chinese with English Abstract). [Google Scholar]
  45. Xu, W.; Geng, L.W.; Jiang, H.F.; Tong, G.X. Exploitation and utilization of fish stocks in Heilongjiang River Basin. Chin. J. Fish. 2017, 30, 50–53, (In Chinese with English Abstract). [Google Scholar]
Figure 1. Sampling locations of fish in the genus Megalobrama. HLR, the Heilong River; QTR, the Qiantang River; JSR, the Jinshahe Reservoir; YR, the Yi River; LZL, the Liangzi Lake; LXR, the Longxi River and XR, the Xi River.
Diversity 12 00404 g001
Figure 2. Median-joining network of Megalobrama fish mitochondria DNA (mtDNA) haplotypes based on 3.1 k mtDNA sequences. The area of the oval circle is approximately proportional to the haplotype frequency. Small gray circles on the lines connecting oval circles of haplotypes indicate substitutions. MTH, M. terminalis in the Heilong River; MTQ, M. terminalis in the Qiantang River; MTJ, M. terminalis in the Jinsha River Reservoir; MPL, M. pellegrini in the Longxi River; MAL, M. amblycephala in the Liangzi Lake; MAY, M. amblycephala in the Yi River and MHX, M. hoffmanni in the Xi River.
Diversity 12 00404 g002
Figure 3. Two-dimensional scatterplot of the principal coordinate analysis (PCoA) of Megalobrama fish based on sequence-related amplified polymorphism (SRAP) markers. MTH is marked by red circle. MTH, M. terminalis in the Heilong River; MTQ, M. terminalis in the Qiantang River; MTJ, M. terminalis in the Jinsha River Reservoir; MPL, M. pellegrini in the Longxi River; MAL, M. amblycephala in the Liangzi Lake; MAY, M. amblycephala in the Yi River and MHX, M. hoffmanni in the Xi River.
Diversity 12 00404 g003
Figure 4. Structure analysis of 7 populations from the genus Megalobrama based on sequence-related amplified polymorphism (SRAP) markers. Each color represents a special cluster, and each individual is represented by a vertical line. MTH, M. terminalis in the Heilong River; MTQ, M. terminalis in the Qiantang River; MTJ, M. terminalis in the Jinsha River Reservoir; MPL, M. pellegrini in the Longxi River; MAL, M. amblycephala in the Liangzi Lake; MAY, M. amblycephala in the Yi River and MHX, M. hoffmanni in the Xi River.
Diversity 12 00404 g004
Figure 5. Heat map of pairwise Fst comparing between 7 populations of Megalobrama fish according to mtDNA (A) and SRAP (B) marker data. All estimates were significantly different from zero at the p < 0.05 level. MTH, M. terminalis in the Heilong River; MTQ, M. terminalis in the Qiantang River; MTJ, M. terminalis in the Jinsha River Reservoir; MPL, M. pellegrini in the Longxi River; MAL, M. amblycephala in the Liangzi Lake; MAY, M. amblycephala in the Yi River and MHX, M. hoffmanni in the Xi River.
Diversity 12 00404 g005
Table 1. Estimates of the molecular genetic diversity from combined mitochondrial DNA (mtDNA) sequences (3116 bp) of 7 populations in the genus Megalobrama.
PopulationSample SizeNo. of HaplotypesNo. of Variable SitesPercent Variable Sites (%)Haplotype Diversity (Hd) (±SD)Nucleotide Diversity (π) (±SD)
MTH26780.260.683 ± 0.0870.00045 ± 0.00009
MTQ208571.830.784 ± 0.0840.00330 ± 0.00104
MTJ153250.80.686 ± 0.0610.00363 ± 0.00039
MPL202120.390.189 ± 0.1080.00073 ± 0.00042
MAL18320.060.601 ± 0.0800.00023 ± 0.00004
MAY16320.060.567 ± 0.1090.00020 ± 0.00005
MHX2019611.960.995 ± 0.0180.00437 ± 0.00033
Total13542167
MTH, M. terminalis in the Heilong River; MTQ, M. terminalis in the Qiantang River; MTJ, M. terminalis in the Jinsha River Reservoir; MPL, M. pellegrini in the Longxi River; MAL, M. amblycephala in the Liangzi Lake; MAY, M. amblycephala in the Yi River and MHX, M. hoffmanni in the Xi River.
Table 2. Amplification results of 7 populations in the genus Megalobrama at 15 sequence-related amplified polymorphism (SRAP) loci. PIC: polymorphism information content.
Primer Pair IDTotal BandsPolymorphic BandsPercent Polymorphic Bands (%)PIC Values
1f2r1413930.320
1f5r1110910.352
1f17r14141000.412
2f5r12121000.309
2f9r11111000.349
4f20r17171000.278
7f8r13131000.340
7f19r2120950.262
7f20r22221000.265
10f13r13121000.298
10f18r1111850.293
10f20r15151000.282
12f3r20171000.352
12f4r1717970.286
12f5r1010970.273
Total221214\\
Mean14.7314.27970.311
Table 3. Genetic diversity of 7 populations in the genus Megalobrama at 15 SRAP loci.
PopulationNumber of Polymorphic Bands (NPB)Percent of Polymorphic Bands (PPB, %)Nei’s Gene Diversity (h) (±SD)Shannon’s Information Index (I) (±SD)
MTH11351.130.177 ± 0.2050.263 ± 0.291
MTQ11552.040.173 ± 0.1960.261 ± 0.281
MTJ11250.680.168 ± 0.1980.252 ± 0.283
MPL7634.390.125 ± 0.1910.185 ± 0.274
MAL8237.100.109 ± 0.1670.169 ± 0.246
MAY8337.560.128 ± 0.1840.192 ± 0.267
MHX8036.200.120 ± 0.1820.181 ± 0.263
MTH, M. terminalis in the Heilong River; MTQ, M. terminalis in the Qiantang River; MTJ, M. terminalis in the Jinsha River Reservoir; MPL, M. pellegrini in the Longxi River; MAL, M. amblycephala in the Liangzi Lake; MAY, M. amblycephala in the Yi River and MHX, M. hoffmanni in the Xi River.
Table 4. Analysis of molecular variance (AMOVA) of 7 populations in the genus Megalobrama based on combined mtDNA sequences (3116 bp) and 15 SRAP loci.
Source of VariationDegrees of FreedomSum of SquaresPercentage Variation (%)p-Value
Based on mtDNA sequences
Among groups33646.43588.48< 0.01
Among populations within groups6129.3045.00< 0.01
Within populations128356.2766.52< 0.01
Total1344132.015100\
Based on SRAP loci
Among groups3170.6568.00< 0.01
Among populations within groups683.9069.78< 0.01
Within populations2031242.70082.22< 0.01
Total2091497.262100\
p-value = significance level for AMOVA analysis (significance is p < 0.01).
Publisher’s Note: MDPI stays neutral with regard to jurisdictional claims in published maps and institutional affiliations.

