Can Functional Traits Explain Plant Coexistence? A Case Study with Tropical Lianas and Trees

Abstract
1. Introduction
2. Methods
2.1. Study Selection
2.2. Data Collection and Analyses
3. Results
4. Discussion
Supplementary Materials
Author Contributions
Funding
Acknowledgments
Conflicts of Interest
References
- Violle, C.; Navas, M.-L.; Vile, D.; Kazakou, E.; Fortunel, C.; Hummel, I.; Garnier, E. Let the concept of trait be functional! Oikos 2007, 116, 882–892. [Google Scholar] [CrossRef]
- McGill, B.J.; Enquist, B.J.; Weiher, E.; Westoby, M. Rebuilding community ecology from functional traits. Trends Ecol. Evol. 2006, 21, 178–185. [Google Scholar] [CrossRef] [PubMed]
- Wright, I.J.; Reich, P.B.; Westoby, M.; Ackerly, D.; Baruch, Z.; Bongers, F.; Cavender-Bares, J.; Chapin, T.; Cornelissen, J.H.C.; Diemer, M.; et al. The worldwide leaf economics spectrum. Nature 2004, 428, 821–827. [Google Scholar] [CrossRef] [PubMed]
- Wright, S.J.; Kitajima, K.; Kraft, N.J.B.; Reich, P.B.; Wright, I.J.; Bunker, D.E.; Condit, R.; Dalling, J.W.; Davies, S.J.; Díaz, S.; et al. Functional traits and the growth–mortality trade-off in tropical trees. Ecology 2010, 91, 3664–3674. [Google Scholar] [CrossRef] [PubMed]
- Adler, P.B.; Salguero-Gómez, R.; Compagnoni, A.; Hsu, J.S.; Ray-Mukherjee, J.; Mbeau-Ache, C.; Franco, M. Functional traits explain variation in plant life history strategies. Proc. Natl. Acad. Sci. USA 2013, 111, 740–745. [Google Scholar] [CrossRef] [PubMed]
- Díaz, S.; Kattge, J.; Cornelissen, J.H.C.; Wright, I.J.; Lavorel, S.; Dray, S.; Reu, B.; Kleyer, M.; Wirth, C.; Prentice, I.C.; et al. The global spectrum of plant form and function. Nat. Cell Biol. 2015, 529, 167–171. [Google Scholar] [CrossRef] [PubMed]
- Adler, P.B.; Fajardo, A.; Kleinhesselink, A.R.; Kraft, N.J.B. Trait-based tests of coexistence mechanisms. Ecol. Lett. 2013, 16, 1294–1306. [Google Scholar] [CrossRef]
- Tilman, D. Resource Competition and Community Structure; Princeton University Press: Princeton, NJ, USA, 1982; ISBN 9780691209654. [Google Scholar]
- Chen, Y.; Uriarte, M.; Wright, S.J.; Yu, S. Effects of neighborhood trait composition on tree survival differ between drought and postdrought periods. Ecology 2019, 100, e02766. [Google Scholar] [CrossRef]
- Shipley, B. Net assimilation rate, specific leaf area and leaf mass ratio: Which is most closely correlated with relative growth rate? A meta-analysis. Funct. Ecol. 2006, 20, 565–574. [Google Scholar] [CrossRef]
- Kunstler, G.; Falster, D.S.; Coomes, D.A.; Hui, F.; Kooyman, R.; Laughlin, D.C.; Poorter, L.; Vanderwel, M.; Vieilledent, G.; Wright, S.J.; et al. Plant functional traits have globally consistent effects on competition. Nat. Cell Biol. 2015, 529, 204–207. [Google Scholar] [CrossRef]
- Münkemüller, T.; Gallien, L.; Pollock, L.J.; Barros, C.; Carboni, M.; Chalmandrier, L.; Mazel, F.; Mokany, K.; Roquet, C.; Smyčka, J.; et al. Dos and don’ts when inferring assembly rules from diversity patterns. Glob. Ecol. Biogeogr. 2020, 29, 1212–1229. [Google Scholar] [CrossRef]
- Messier, J.; McGill, B.J.; Lechowicz, M.J. How do traits vary across ecological scales? A case for trait-based ecology. Ecol. Lett. 2010, 13, 838–848. [Google Scholar] [CrossRef]
- Schnitzer, S.A. Testing ecological theory with lianas. New Phytol. 2018, 220, 366–380. [Google Scholar] [CrossRef] [PubMed]
- Schnitzer, S.A. The ecology of lianas and their role in forests. Trends Ecol. Evol. 2002, 17, 223–230. [Google Scholar] [CrossRef]
- Santiago, L.S.; Wright, S.J. Leaf functional traits of tropical forest plants in relation to growth form. Funct. Ecol. 2007, 21, 19–27. [Google Scholar] [CrossRef]
- Estrada-Villegas, S.; Schnitzer, S.A. A comprehensive synthesis of liana removal experiments in tropical forests. Biotropica 2018, 50, 729–739. [Google Scholar] [CrossRef]
- Van Der Heijden, G.; Powers, J.S.; Schnitzer, S.A. Lianas reduce carbon accumulation and storage in tropical forests. Proc. Natl. Acad. Sci. USA 2015, 112, 13267–13271. [Google Scholar] [CrossRef]
- Álvarez-Cansino, L.; Schnitzer, S.A.; Reid, J.; Powers, J.S. Liana competition with tropical trees varies seasonally but not with tree species identity. Ecology 2015, 96, 39–45. [Google Scholar] [CrossRef] [PubMed]
- León, M.M.G.; Izquierdo, L.M.; Mello, F.N.A.; Powers, J.S.; Schnitzer, S.A. Lianas reduce community-level canopy tree reproduction in a Panamanian forest. J. Ecol. 2017, 106, 737–745. [Google Scholar] [CrossRef]
- González, A.D.V.; Mello, F.N.A.; Schnitzer, S.A.; César, R.G.; Tomazello-Filho, M. The negative effect of lianas on tree growth varies with tree species and season. Biotropica 2020. [Google Scholar] [CrossRef]
- Schnitzer, S.A.; Van Der Heijden, G.M.F. Lianas have a seasonal growth advantage over co-occurring trees. Ecology 2019, 100, e02655. [Google Scholar] [CrossRef] [PubMed]
- Parolari, A.J.; Paul, K.; Griffing, A.; Condit, R.; Perez, R.; Aguilar, S.; Schnitzer, S.A. Liana abundance and diversity increase with rainfall seasonality along a precipitation gradient in Panama. Ecography 2019, 43, 25–33. [Google Scholar] [CrossRef]
- Santiago, L.S.; Pasquini, S.C.; De Guzman, M.E. Physiological implications of the liana growth form. In Ecology of Lianas; 2014; pp. 288–298. Available online: https://onlinelibrary.wiley.com/doi/10.1002/9781118392409.ch20 (accessed on 20 August 2020).
- Castellanos, A.E.; Mooney, H.A.; Bullock, S.H.; Jones, C.; Robichaux, R. Leaf, Stem, and Metamer Characteristics of Vines in a Tropical Deciduous Forest in Jalisco, Mexico. Biotropica 1989, 21, 41. [Google Scholar] [CrossRef]
- Johnson, D.M.; Domec, J.-C.; Woodruff, D.R.; McCulloh, K.A.; Meinzer, F.C. Contrasting hydraulic strategies in two tropical lianas and their host trees. Am. J. Bot. 2013, 100, 374–383. [Google Scholar] [CrossRef]
- Apgaua, D.M.G.; Tng, D.Y.P.; Cernusak, L.A.; Cheesman, A.W.; Santos, R.M.; Edwards, W.J.; Laurance, W.F. Plant functional groups within a tropical forest exhibit different wood functional anatomy. Funct. Ecol. 2016, 31, 582–591. [Google Scholar] [CrossRef]
- Avalos, G.; Mulkey, S.S.; Kitajima, K. Leaf Optical Properties of Trees and Lianas in the Outer Canopy of a Tropical Dry Forest1. Biotropica 1999, 31, 517–520. [Google Scholar] [CrossRef]
- Buckton, G.; Cheesman, A.W.; Munksgaard, N.C.; Wurster, C.M.; Liddell, M.J.; Cernusak, L.A. Functional traits of lianas in an Australian lowland rainforest align with post-disturbance rather than dry season advantage. Austral Ecol. 2019, 44, 983–994. [Google Scholar] [CrossRef]
- Castro, C.C.; Newton, A. Leaf and stem trait variation and plant functional types in 113 woody species of A seasonally dry tropical forest. Colomb. For. 2015, 18, 117–138. [Google Scholar] [CrossRef]
- Cernusak, L.A.; Winter, K.; Aranda, J.; Turner, B.L. Conifers, Angiosperm Trees, and Lianas: Growth, Whole-Plant Water and Nitrogen Use Efficiency, and Stable Isotope Composition (δ13C and δ18O) of Seedlings Grown in a Tropical Environment. Plant Physiol. 2008, 148, 642–659. [Google Scholar] [CrossRef] [PubMed]
- Cai, Z.-Q.; Poorter, L.; Cao, K.-F.; Bongers, F. Seedling Growth Strategies in Bauhinia Species: Comparing Lianas and Trees. Ann. Bot. 2007, 100, 831–838. [Google Scholar] [CrossRef]
- Cai, Z.-Q.; Schnitzer, S.A.; Bongers, F. Seasonal differences in leaf-level physiology give lianas a competitive advantage over trees in a tropical seasonal forest. Oecologia 2009, 161, 25–33. [Google Scholar] [CrossRef] [PubMed]
- Chen, Y.-J.; Cao, K.-F.; Schnitzer, S.A.; Fan, Z.-X.; Zhang, J.-L.; Bongers, F. Water-use advantage for lianas over trees in tropical seasonal forests. New Phytol. 2014, 205, 128–136. [Google Scholar] [CrossRef] [PubMed]
- Collins, C.G.; Wright, S.J.; Wurzburger, N. Root and leaf traits reflect distinct resource acquisition strategies in tropical lianas and trees. Oecologia 2015, 180, 1037–1047. [Google Scholar] [CrossRef] [PubMed]
- Dias, A.D.S.; Oliveira, R.S.; Martins, F.R. Costs and benefits of gas inside wood and its relationship with anatomical traits: A contrast between trees and lianas. Tree Physiol. 2020, 40, 856–868. [Google Scholar] [CrossRef]
- Dias, A.S.; Oliveira, R.S.; Martins, F.R.; Bongers, F.; Anten, N.P.R.; Sterck, F. How Do Lianas and Trees Change Their Vascular Strategy in Seasonal versus Rain Forest? Perspect. Plant Ecol. Evol. Syst. 2019, 40, 125465. [Google Scholar] [CrossRef]
- De Guzman, M.E.; Santiago, L.S.; Schnitzer, S.A.; Álvarez-Cansino, L. Trade-offs between water transport capacity and drought resistance in neotropical canopy liana and tree species. Tree Physiol. 2016, 37, 1404–1414. [Google Scholar] [CrossRef]
- De Guzman, M.E.; Acosta-Rangel, A.; Winter, K.; Meinzer, F.C.; Bonal, D.; Santiago, L.S. OUP accepted manuscript. Tree Physiol. 2020. [Google Scholar] [CrossRef]
- Domingues, T.F.; Martinelli, L.A.; Ehleringer, J.R. Ecophysiological traits of plant functional groups in forest and pasture ecosystems from eastern Amazônia, Brazil. Plant Ecol. 2007, 193, 101–112. [Google Scholar] [CrossRef]
- Han, L.; Xie, L.-J.; Dai, K.-J.; Yang, Q.; Cai, Z.-Q. Contrasting leaf characteristics of trees and lianas in secondary and mature forests in southwestern China. Photosynthetica 2010, 48, 559–566. [Google Scholar] [CrossRef]
- Kazda, M.; Salzer, J. Leaves of Lianas and Self-Supporting Plants Differ in Mass per Unit Area and in Nitrogen Content. Plant Biol. 2000, 2, 268–271. [Google Scholar] [CrossRef]
- Kazda, M.; Miladera, J.C.; Salzer, J. Optimisation of spatial allocation patterns in lianas compared to trees used for support. Trees 2008, 23, 295–304. [Google Scholar] [CrossRef]
- Liu, W. Leaf trait patterns of monsoon evergreen broad-leaved forest in relation to growth form. Afr. J. Agric. Res. 2012, 7, 3022–3028. [Google Scholar] [CrossRef]
- Maréchaux, I.; Bartlett, M.K.; Iribar, A.; Sack, L.; Chave, J. Stronger seasonal adjustment in leaf turgor loss point in lianas than trees in an Amazonian forest. Biol. Lett. 2017, 13, 20160819. [Google Scholar] [CrossRef] [PubMed]
- Maréchaux, I.; Saint-André, L.; Bartlett, M.K.; Sack, L.; Chave, J. Leaf drought tolerance cannot be inferred from classic leaf traits in a tropical rainforest. J. Ecol. 2019, 108, 1030–1045. [Google Scholar] [CrossRef]
- Rios, R.S.; Salgado-Luarte, C.; Gianoli, E. Species Divergence and Phylogenetic Variation of Ecophysiological Traits in Lianas and Trees. PLoS ONE 2014, 9, e99871. [Google Scholar] [CrossRef] [PubMed]
- Sanchez-Azofeifa, G.; Castro, K.; Wright, S.J.; Gamon, J.; Kalacska, M.; Rivard, B.; Schnitzer, S.A.; Feng, J.-L. Differences in leaf traits, leaf internal structure, and spectral reflectance between two communities of lianas and trees: Implications for remote sensing in tropical environments. Remote. Sens. Environ. 2009, 113, 2076–2088. [Google Scholar] [CrossRef]
- Slot, M.; Wright, S.J.; Kitajima, K. Foliar respiration and its temperature sensitivity in trees and lianas: In situ measurements in the upper canopy of a tropical forest. Tree Physiol. 2013, 33, 505–515. [Google Scholar] [CrossRef] [PubMed]
- Slot, M.; Rey-Sánchez, C.; Winter, K.; Kitajima, K. Trait-based scaling of temperature-dependent foliar respiration in a species-rich tropical forest canopy. Funct. Ecol. 2014, 28, 1074–1086. [Google Scholar] [CrossRef]
- Smith-Martin, C.M.; Bastos, C.L.; Lopez, O.R.; Powers, J.S.; Schnitzer, S.A. Effects of dry-season irrigation on leaf physiology and biomass allocation in tropical lianas and trees. Ecology 2019, 100, e02827. [Google Scholar] [CrossRef]
- Van Der Sande, M.T.; Poorter, L.; Schnitzer, S.A.; Markesteijn, L. Are lianas more drought-tolerant than trees? A test for the role of hydraulic architecture and other stem and leaf traits. Oecologia 2013, 172, 961–972. [Google Scholar] [CrossRef]
- Van Der Sande, M.T.; Poorter, L.; Schnitzer, S.A.; Engelbrecht, B.M.J.; Markesteijn, L. The hydraulic efficiency–safety trade-off differs between lianas and trees. Ecology 2019, 100, e02666. [Google Scholar] [CrossRef] [PubMed]
- Vivek, P.; Parthasarathy, N. Liana community and functional trait analysis in tropical dry evergreen forest of India. J. Plant Ecol. 2014, 8, 501–512. [Google Scholar] [CrossRef]
- Werden, L.K.; Waring, B.; Smith-Martin, C.M.; Powers, J.S. Tropical dry forest trees and lianas differ in leaf economic spectrum traits but have overlapping water-use strategies. Tree Physiol. 2017, 38, 517–530. [Google Scholar] [CrossRef] [PubMed]
- Zhang, L.; Chen, Y.-J.; Ma, K.; Bongers, F.; Sterck, F.J. Fully exposed canopy tree and liana branches in a tropical forest differ in mechanical traits but are similar in hydraulic traits. Tree Physiol. 2019, 39, 1713–1724. [Google Scholar] [CrossRef]
- Zhu, S.-D.; Chen, Y.-J.; Fu, P.-L.; Cao, K.-F. Different hydraulic traits of woody plants from tropical forests with contrasting soil water availability. Tree Physiol. 2017, 37, 1469–1477. [Google Scholar] [CrossRef] [PubMed]
- Zhu, S.-D.; Cao, K.-F. Contrasting cost–benefit strategy between lianas and trees in a tropical seasonal rain forest in southwestern China. Oecologia 2010, 163, 591–599. [Google Scholar] [CrossRef] [PubMed]
- Zhu, S.-D.; Cao, K.-F. Hydraulic properties and photosynthetic rates in co-occurring lianas and trees in a seasonal tropical rainforest in southwestern China. Plant Ecol. 2009, 204, 295–304. [Google Scholar] [CrossRef]
- Williamson, G.B.; Wiemann, M.C. Measuring wood specific gravity…Correctly. Am. J. Bot. 2010, 97, 519–524. [Google Scholar] [CrossRef]
- The R Project for Statistical Computing. Available online: http://www.R-project.org/ (accessed on 8 October 2020).
- Van Rossum, G.; Drake, F.L. Python 3 Reference Manual; CreateSpace: Scotts Valley, CA, USA, 2009. [Google Scholar]
- McKinney, W. Data Structures for Statistical Computing in Python. In Proceedings of the 9th Python in Science Conference, Austin, TX, USA, 28 June–3 July 2010; pp. 56–61. [Google Scholar]
- Hodgson, J.; Wilson, P.; Hunt, R.; Grime, J.P.; Thompson, K. Allocating C-S-R Plant Functional Types: A Soft Approach to a Hard Problem. Oikos 1999, 85, 282. [Google Scholar] [CrossRef]
- Osnas, J.L.D.; Katabuchi, M.; Kitajima, K.; Wright, S.J.; Reich, P.B.; Van Bael, S.A.; Kraft, N.J.B.; Samaniego, M.J.; Pacala, S.W.; Lichstein, J.W. Divergent drivers of leaf trait variation within species, among species, and among functional groups. Proc. Natl. Acad. Sci. USA 2018, 115, 5480–5485. [Google Scholar] [CrossRef]
- Abdala-Roberts, L.; Galmán, A.; Petry, W.K.; Covelo, F.; De La Fuente, M.; Glauser, G.; Moreira, X. Interspecific variation in leaf functional and defensive traits in oak species and its underlying climatic drivers. PLoS ONE 2018, 13, e0202548. [Google Scholar] [CrossRef] [PubMed]
- Reich, P.B.; Oleksyn, J.; Wright, I.J. Leaf phosphorus influences the photosynthesis–nitrogen relation: A cross-biome analysis of 314 species. Oecologia 2009, 160, 207–212. [Google Scholar] [CrossRef] [PubMed]
- He, P.; Gleason, S.M.; Wright, I.J.; Weng, E.; Liu, H.; Zhu, S.; Lu, M.; Luo, Q.; Li, R.; Wu, G.; et al. Growing-season temperature and precipitation are independent drivers of global variation in xylem hydraulic conductivity. Glob. Chang. Biol. 2019, 26, 1833–1841. [Google Scholar] [CrossRef] [PubMed]
- Rosell, J.A.; Olson, M.E. Do lianas really have wide vessels? Vessel diameter–stem length scaling in non-self-supporting plants. Perspect. Plant Ecol. Evol. Syst. 2014, 16, 288–295. [Google Scholar] [CrossRef]
- Meunier, F.; Moorthy, S.M.K.; De Deurwaerder, H.P.T.; Kreus, R.; Bulcke, J.V.D.; Lehnebach, R.; Verbeeck, H. Within-Site Variability of Liana Wood Anatomical Traits: A Case Study in Laussat, French Guiana. Forests 2020, 11, 523. [Google Scholar] [CrossRef]
- Jiménez-Castillo, M.; Wiser, S.K.; Lusk, C.H. ORIGINAL ARTICLE: Elevational parallels of latitudinal variation in the proportion of lianas in woody floras. J. Biogeogr. 2006, 34, 163–168. [Google Scholar] [CrossRef]
- Hacke, U.G.; Sperry, J.S.; Wheeler, J.K.; Castro, L. Scaling of angiosperm xylem structure with safety and efficiency. Tree Physiol. 2006, 26, 689–701. [Google Scholar] [CrossRef] [PubMed]
- Markesteijn, L.; Poorter, L.; Bongers, F.; Paz, H.; Sack, L. Hydraulics and life history of tropical dry forest tree species: Coordination of species’ drought and shade tolerance. New Phytol. 2011, 191, 480–495. [Google Scholar] [CrossRef]
- Schnitzer, S.A. A Mechanistic Explanation for Global Patterns of Liana Abundance and Distribution. Am. Nat. 2005, 166, 262–276. [Google Scholar] [CrossRef]
- DeWalt, S.J.; Schnitzer, S.A.; Alves, L.F.; Bongers, F.; Burnham, R.J.; Cai, Z.; Carson, W.P.; Chave, J.; Chuyong, G.B.; Costa, F.R.C.; et al. Biogeographical patterns of liana abundance and diversity. In Ecology of Lianas; 2014; pp. 131–146. Available online: https://onlinelibrary.wiley.com/doi/10.1002/9781118392409.ch11 (accessed on 20 August 2020).
- Gilbert, B.; Wright, S.J.; Muller-Landau, H.C.; Kitajima, K.; Hernandéz, A. Life history trade-offs in tropical trees and lianas. Ecology 2006, 87, 1281–1288. [Google Scholar] [CrossRef]
- Asner, G.P.; Martin, R. Canopy chemistry expresses the life-history strategies of lianas and trees. In Ecology of Lianas; 2014; pp. 299–308. Available online: https://onlinelibrary.wiley.com/doi/10.1002/9781118392409.ch21 (accessed on 20 August 2020).
- Schnitzer, S.A.; Carson, W.P. Treefall gaps and the maintenance of species diversity in a tropical forest. Ecology 2001, 82, 913–919. [Google Scholar] [CrossRef]
- Ledo, A.; Schnitzer, S.A. Disturbance and clonal reproduction determine liana distribution and maintain liana diversity in a tropical forest. Ecology 2014, 95, 2169–2178. [Google Scholar] [CrossRef] [PubMed]
- Odell, E.H.; Stork, N.E.; Kitching, R.L. Lianas as a food resource for herbivorous insects: A comparison with trees. Biol. Rev. 2019, 94, 1416–1429. [Google Scholar] [CrossRef] [PubMed]
- Schupp, E.W.; Feener, D.H. Phylogeny, lifeform, and habitat- dependence of ant-defended plants in a Panamanian forest. In Ant-Plant Interactions; Huxley, C.R., Culver, D.K., Eds.; Oxford University Press: Oxford, UK, 1991; pp. 175–197. ISBN 978-110-715-975-4. [Google Scholar]


| Study Citation | Site Country | Forest Type | Mean Annual Precipitation Wet Season Period | Liana and Tree Species Sampling |
|---|---|---|---|---|
| Apagua et al. 2016 [27] | Daintree Rainforest Observatory Australia | Lowland Tropical Rainforest | 4900 mm | 15 lianas and 45 trees |
| Avalos et al. 1999 [28] | Parque Metropolitano Panama | Tropical Dry Forest | 1740 mm | 12 lianas and 7 trees |
| Buckton et al. 2019 [29] | Cape Tribulation Australia | Lowland Tropical Rainforest | 4207 mm December–April | 7 lianas and 11 trees |
| Castellanos et al. 1989 [25] | Chamela field station Mexico | Tropical Deciduous Forest | 748 mm July–October | 41 lianas (no information about tree sampling) |
| Castellanos-Castro & Newton 2015 [30] | Totumo region, Caribbean coast Colombia | Tropical dry forest | 900 mm April–December | 14 lianas and 94 trees |
| Cernusak et al. 2008 [31] | Gamboa Panama | Tropical Moist Forest | Not informed | 4 lianas and 9 trees |
| Cai et al. 2007 [32] | Xishuanbanna China | Tropical Seasonal Forest | 1539 mm May–October | 3 lianas and 2 trees |
| Cai et al. 2009 [33] | Xishuanbanna China | Tropical Seasonal Forest | 1559 mm May–October | 18 lianas and 16 trees |
| Chen et al. 2014 [34] | Xishuanbanna China | Karst forest; Tropical Seasonal Forest; Flood Plain Forest | 1560 mm May–October | Karst forest-6 lianas and 10 trees; TSF-9 lianas and 12 trees; FPF-5 lianas and 11 trees |
| Collins et al. 2016 [35] | Barro Colorado Island Panama | Tropical Moist Forest | 2600 mm May–December | 6 lianas and 6 trees |
| Dias et al. 2020 [36] | Ribeirão Cachoeira Brazil | Tropical Seasonal Semi-deciduous forest | 1409 mm October–March | 16 lianas and 15 trees |
| Dias et al. 2019 [37] | Paraná forest Brazil | Seasonally Dry Forest | 1409 mm September–March | The most abundant lianas and trees |
| De Guzman et al. 2016 [38] | Parque Metropolitano Panama | Lowland Tropical Rainforest | 1865 mm May–November | 6 lianas and 6 trees |
| De Guzman et al. 2020 [39] | Fuerte de San Lorenzo Panama | Lowland Tropical Rainforest | 3300 mm April–December | 3 lianas and 6 trees |
| Domingues et al. 2007 [40] | Flona Tapajós, Santarém Brazil | Amazonian terra-firme tropical Rainforest | 2000 mm December–June | 6 lianas and 11 trees |
| Han et al. 2010 [41] | Xishuanbanna China | Lowland Tropical Rainforest | 1500 mm May–October | 14 lianas and 16 trees (SF); 18 lianas and 18 trees (MF) |
| Johnson et al. 2013 [26] | Parque Metropolitano Panama | Lowland Tropical Rainforest | 1865 mm May–October | 2 lianas and 1 tree |
| Kazda & Salzer 2000 [42] | Makandé Gabon | Lowland Tropical Rainforest | 1753 mm October–December and March–May | 49 lianas and 42 trees |
| Kazda et al. 2009 [43] | Masoala National Park Madagascar | Dense subequatorial humid forest | 3500 mm November–April | 57 samples of lianas and trees (species per life form not mentioned) |
| Liu et al. 2012 [44] | Yunnan Province China | Monsoon evergreen broad-leaved forests | 1547.6 mm May–October | 91 species (liana and tree species not mentioned) |
| Marechaux et al. 2017 [45] | Nouragues French Guiana | Lowland Tropical Rainforest | 3000 mm December–July | 11 botanical families of lianas and 71 trees |
| Marechaux et al. 2019 [46] | Nouragues French Guiana | Lowland Tropical Rainforest | 3000 mm December–July | 11 botanical families of lianas and 10 trees |
| Rios et al. 2014 [47] | Multiple sites and countries | Forest Ecosystems | Multiple sites | 63 lianas and 71 trees |
| Sánchez-Asofeifa et al. 2009 [48] | Fuerte de San Lorenzo and Parque Metropolitano Panama | Tropical Wet and Tropical Dry | 3300 mm May–December 1740 mm May–December | 35 lianas and 18 trees |
| Santiago & Wright 2007 [16] | Fuerte de San Lorenzo Panama | Lowland Tropical Rainforest | 3100 mm April–December | 11 lianas and 21 trees |
| Slot et al. 2013 [49] | Parque Metropolitano Panama | Tropical Dry Forest | 1740 mm May–December | 13 lianas and 13 trees |
| Slot et al. 2014 [50] | Parque Metropolitano Panama | Tropical Dry Forest | 1865 mm May–December | 14 lianas and 14 trees |
| Smith-Martin et al. 2019 [51] | Canal zone–Summit Panama | Tropical Moist Forest | 2226 mm May–December | 6 lianas and 6 trees |
| van der Sande et al. 2013 [52] | Parque Soberania Panama | Lowland Tropical Rainforest | 2400 mm April–December | 11 lianas and 13 trees |
| van der Sande et al. 2019 [53] | Fuerte de San Lorenzo and Parque Soberania Panama | Tropical Moist Forest and Wet Forest | 3203 mm April–December 2311 mm May–November | 13 lianas and 13 trees |
| Vivek & Parthasarathy 2018 [54] | Coromandel Coast India | Tropical Dry Evergreen Forest | 1141mm October–December | 10 lianas and 10 trees |
| Werden et al. 2017 [55] | Guanacaste Costa Rica | Seasonally Dry Forest | 880–3030 mm May–Decemebr | 7 lianas and 14 trees |
| Zhang et al. 2019 [56] | Xishuanbanna China | Lowland Tropical Rainforest | 1493mm May–October | 12 lianas and 10 trees |
| Zhu et al. 2017 [57] | Xishuanbanna China | Lowland Tropical Rainforest | 1600 mm May–October | Karst forest- 2 lianas and 8 trees; Non-karst forest–3 lianas and 10 trees |
| Zhu & Cao 2010 [58] | Xishuanbanna China | Tropical Seasonal Forest | 1500 mm May–October | 18 lianas and 19 trees |
| Zhu & Cao 2009 [59] | Xishuanbanna China | Tropical Seasonal Forest | 1379 mm May–October | 3 lianas and 3 trees |
| Functional Trait | Liana Mean Trait Value | Tree Mean Trait Value | t-Test Statistic and p-Value |
|---|---|---|---|
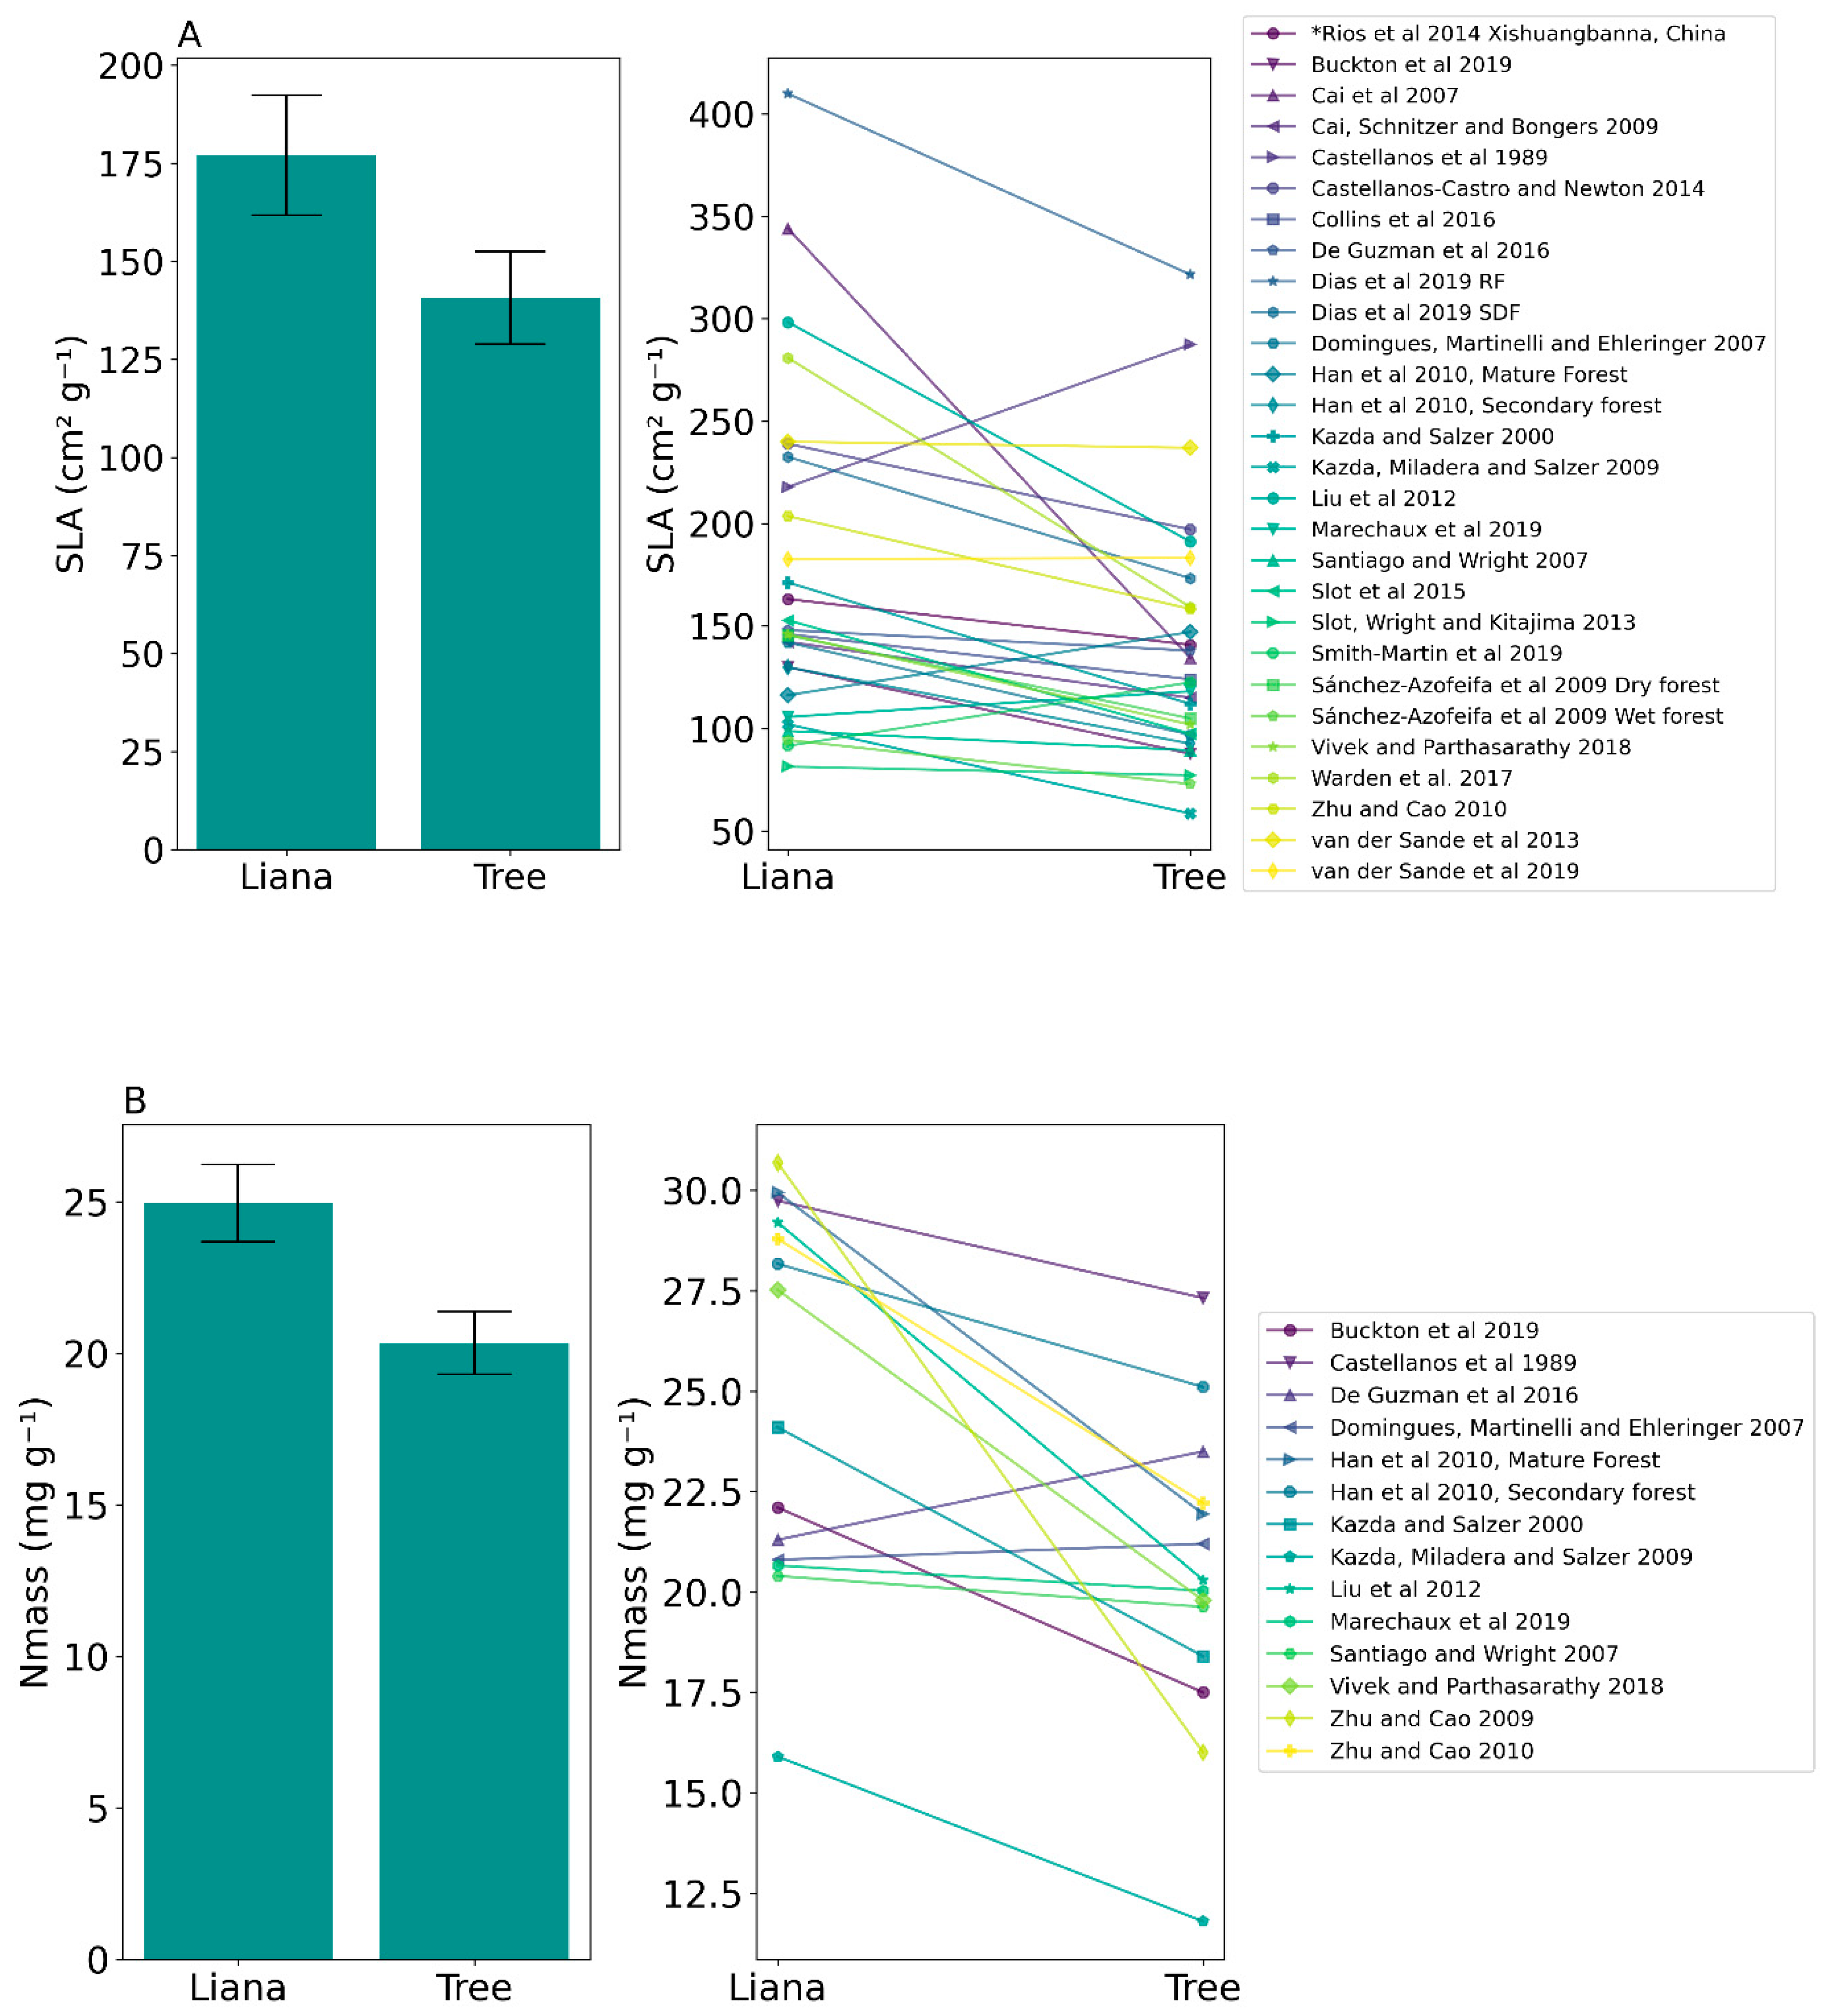
| Specific Leaf Area (SLA) | 176.98 ± 80.77 SD | 140.70 ± 62.41 SD | t(27) = 3.64, p = 0.001 * |
| Mass-based nitrogen concentration (Nmass) | 24.95 ± 4.73 SD | 20.34 ± 3.85 SD | t(13) = 3.89, p = 0.002 * |
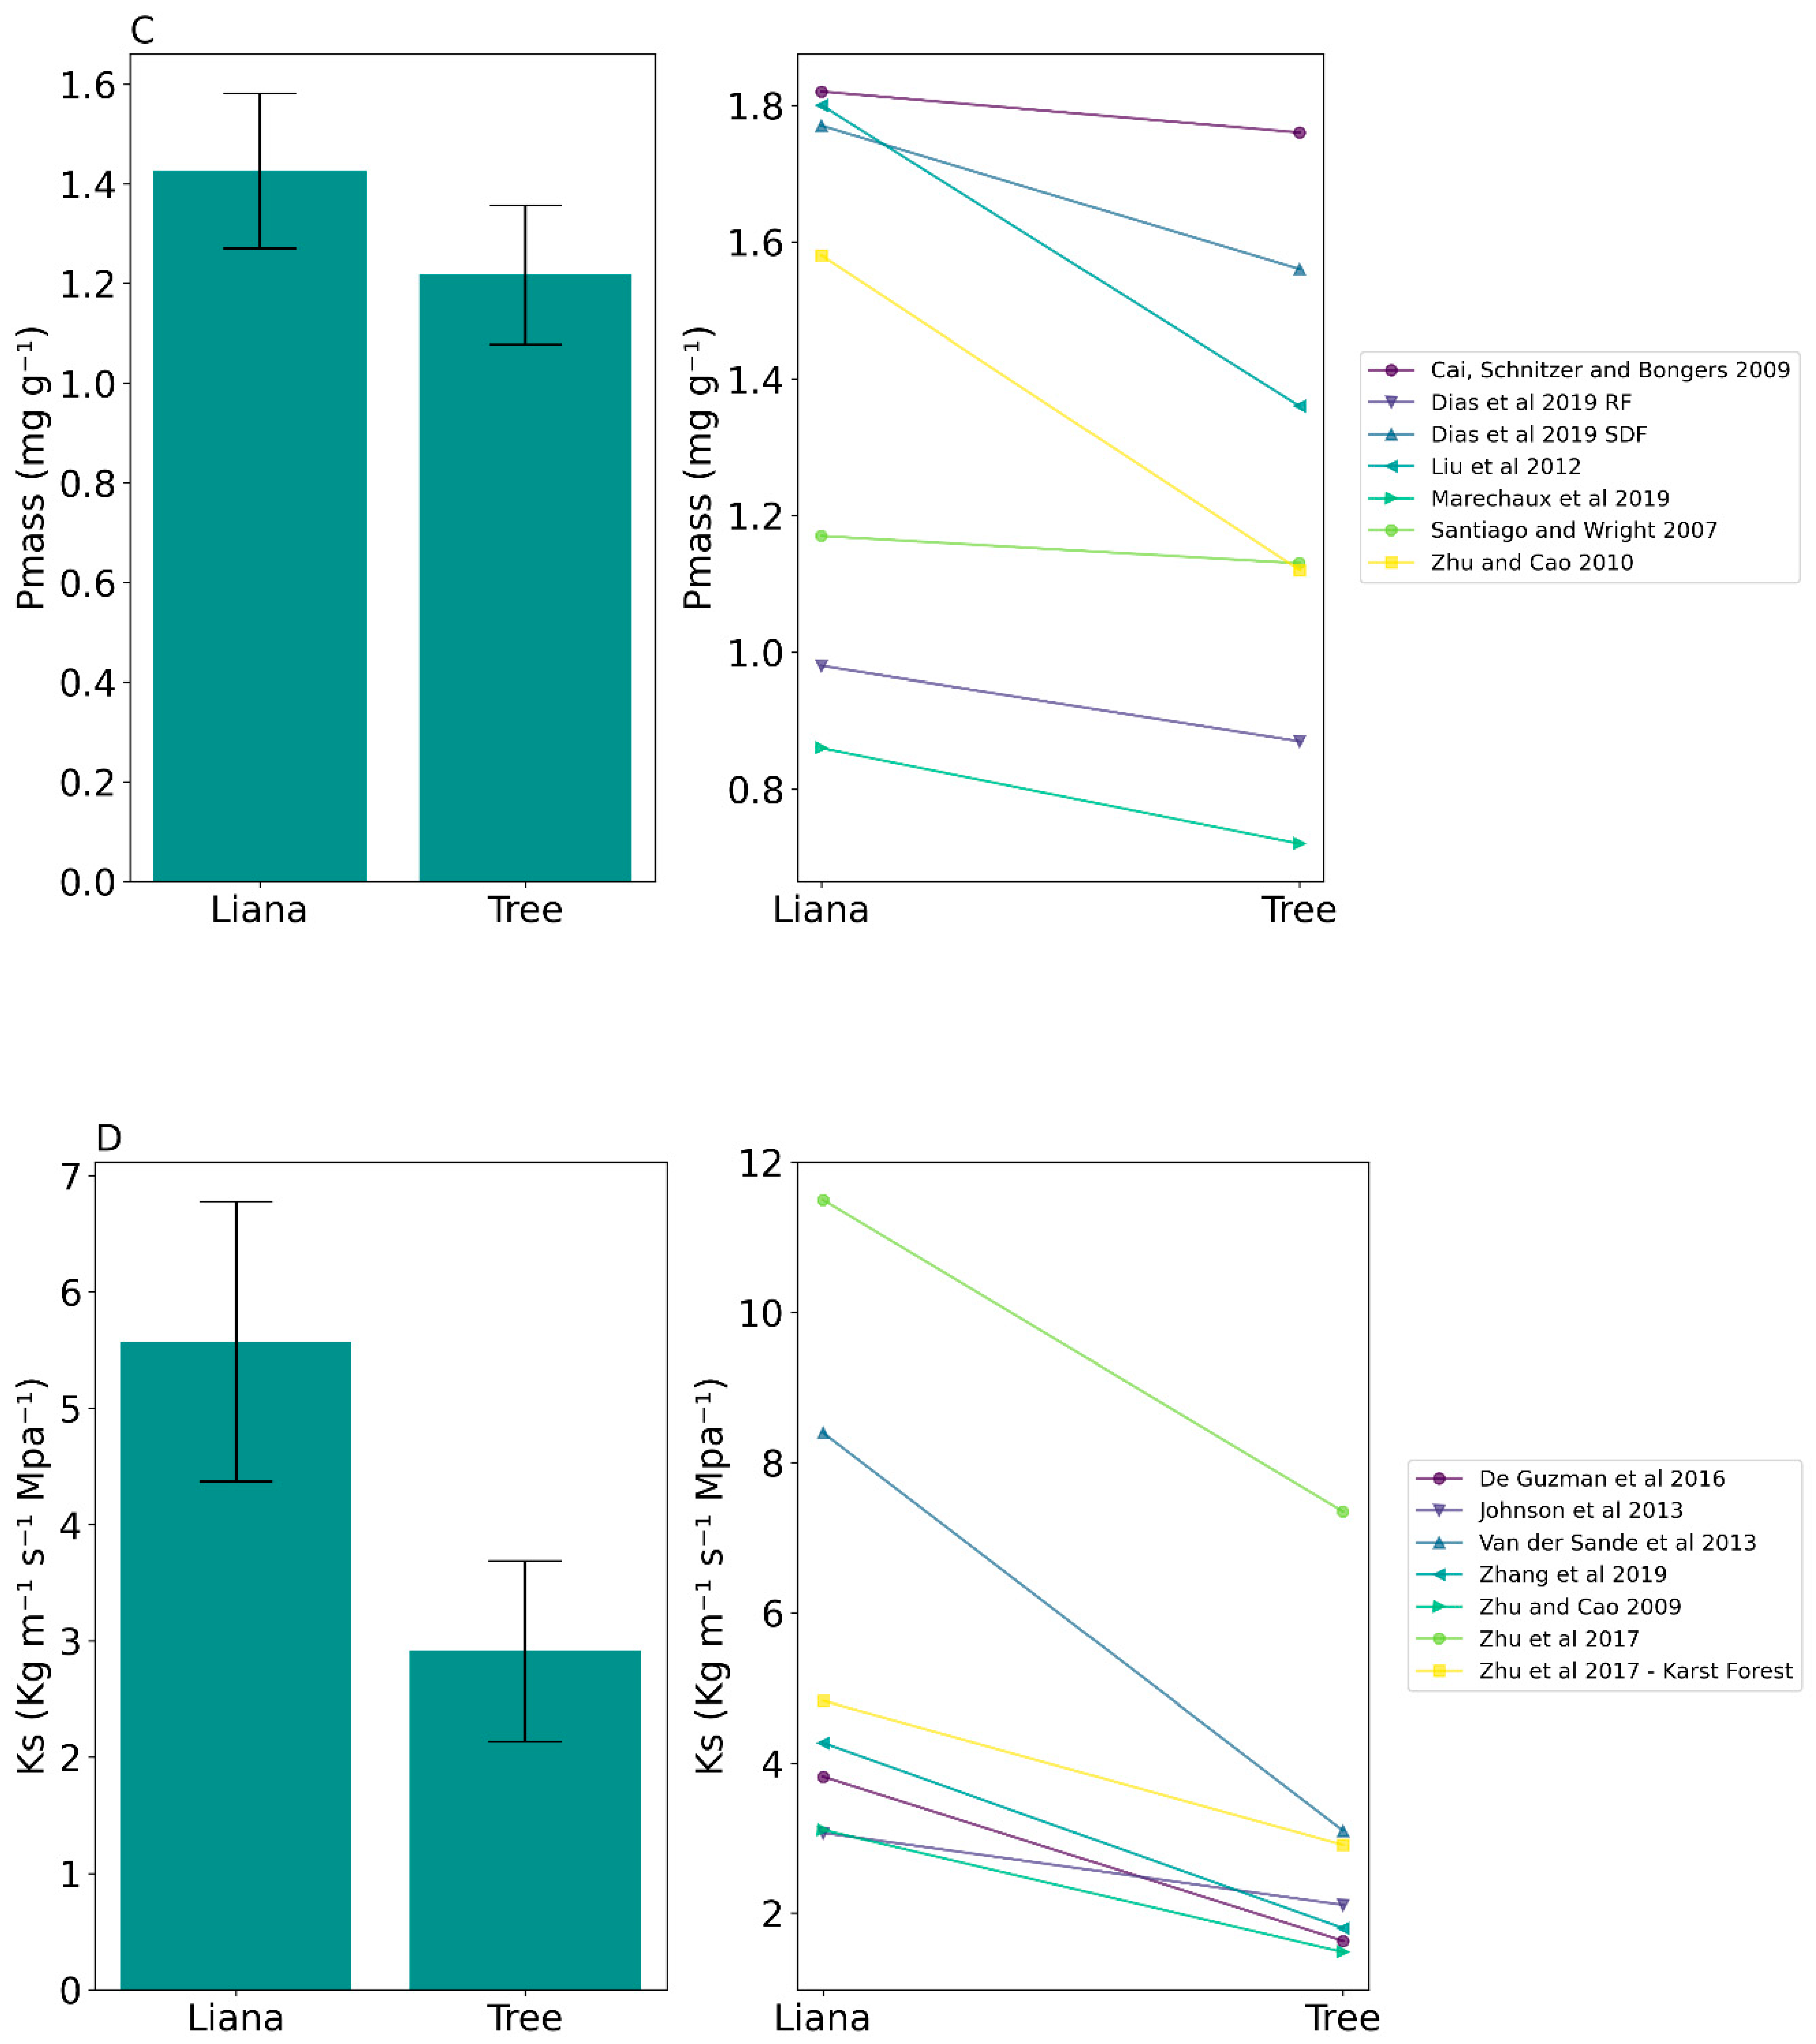
| Mass-based phosphorus concentration (Pmass) | 1.43 ± 0.41 SD | 1.22 ± 0.4 SD | t(6) = 3.17, p = 0.02 * |
| Sapwood specific conductivity (Ks) | 5.57 ± 3.18 SD | 2.91 ± 2.05 SD | t(6) = 4.62, p = 0.004 * |
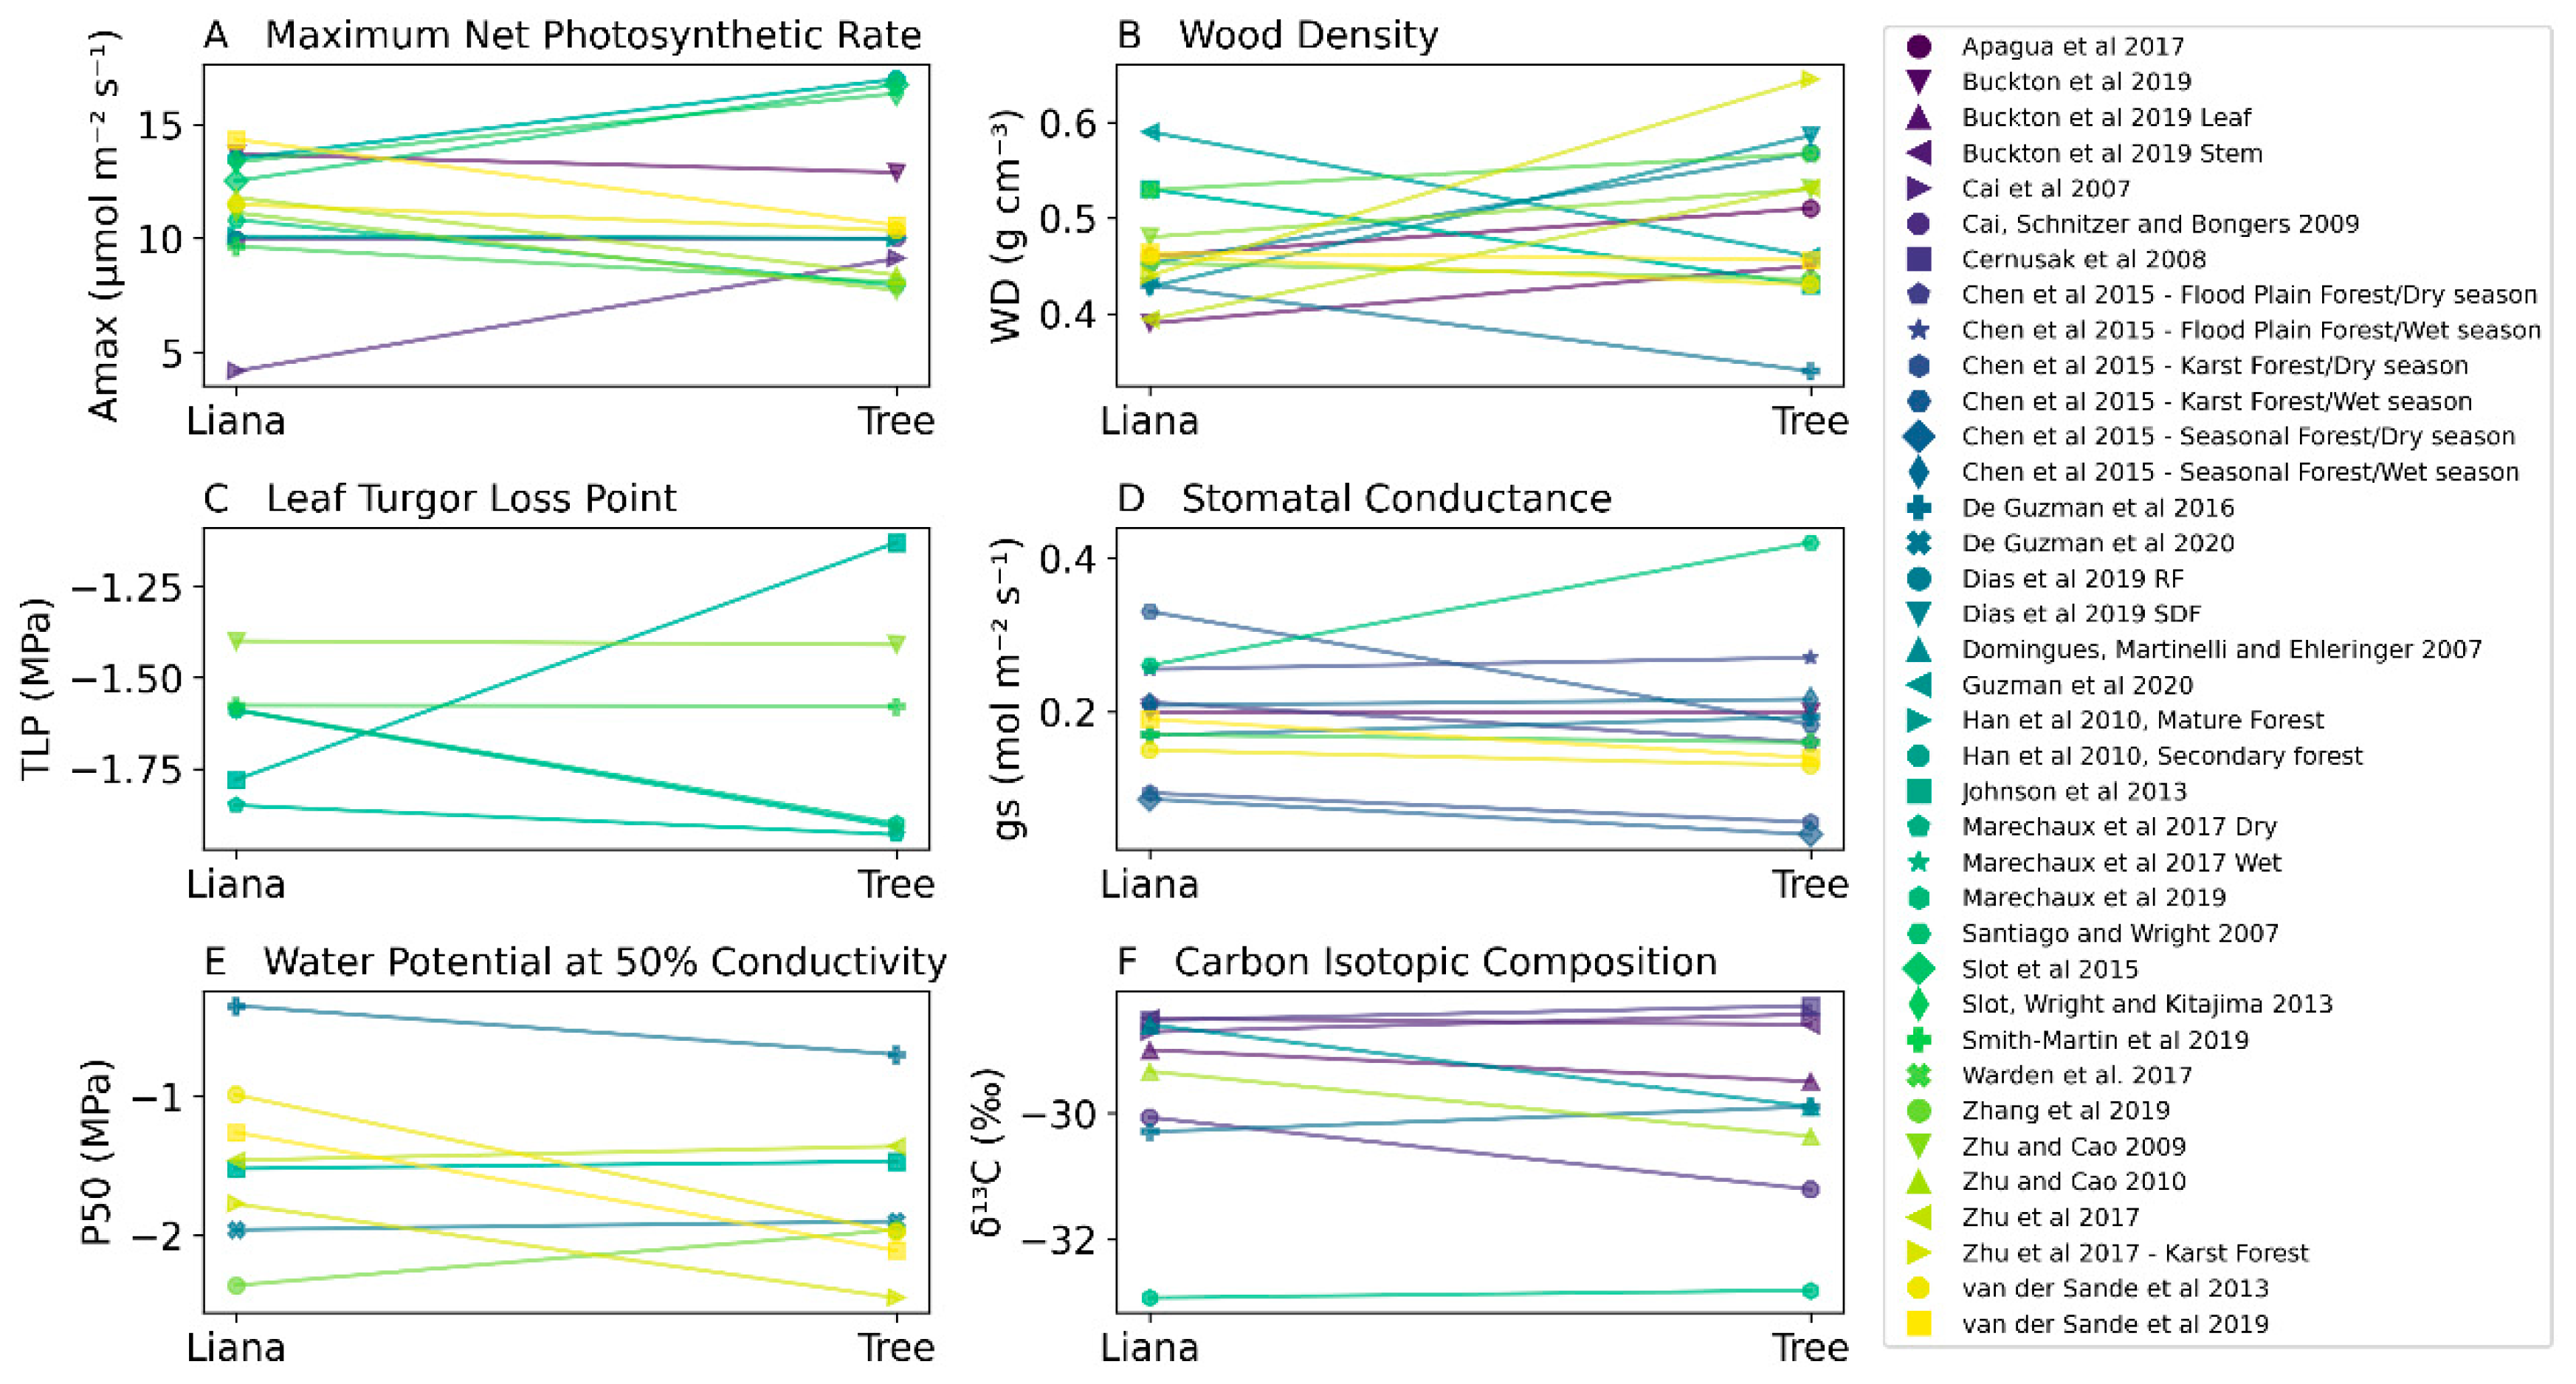
| Maximum area-based net photosynthetic rate (Amax) | 11.28 ± 2.63 SD | 11.17 ± 3.45 SD | t(12) = 0.12, p = 0.9 |
| Carbon isotopic composition (δ13C) | −29.55 ± 1.43 SD | −29.9 ± 1.46 SD | t(8) = 1.51, p = 0.17 |
| Wood density (WD) | 0.46 ± 0.05 SD | 0.5 ± 0.08 SD | t(13) = −1.16, p = 0.26 |
| Leaf Turgor Loss Point (πtlp) | −1.63 ± 0.16 SD | −1.64 ± 0.33 SD | t(5) = 0.09, p = 0.93 |
| Stomatal conductance (gs) | 0.19 ± 0.07 SD | 0.18 ± 0.1 SD | t(6) = −0.18, p = 0.86 |
| Water potential at 50 percent loss of conductivity (P50) | −1.46 ± 0.62 SD | −1.74 ± 0.54 SD | t(7) = 1.56, p = 0.16 |
Publisher’s Note: MDPI stays neutral with regard to jurisdictional claims in published maps and institutional affiliations. |
© 2020 by the authors. Licensee MDPI, Basel, Switzerland. This article is an open access article distributed under the terms and conditions of the Creative Commons Attribution (CC BY) license (http://creativecommons.org/licenses/by/4.0/).
Share and Cite
Mello, F.N.A.; Estrada-Villegas, S.; DeFilippis, D.M.; Schnitzer, S.A. Can Functional Traits Explain Plant Coexistence? A Case Study with Tropical Lianas and Trees. Diversity 2020, 12, 397. https://doi.org/10.3390/d12100397
Mello FNA, Estrada-Villegas S, DeFilippis DM, Schnitzer SA. Can Functional Traits Explain Plant Coexistence? A Case Study with Tropical Lianas and Trees. Diversity. 2020; 12(10):397. https://doi.org/10.3390/d12100397
Chicago/Turabian StyleMello, Felipe N. A., Sergio Estrada-Villegas, David M. DeFilippis, and Stefan A. Schnitzer. 2020. "Can Functional Traits Explain Plant Coexistence? A Case Study with Tropical Lianas and Trees" Diversity 12, no. 10: 397. https://doi.org/10.3390/d12100397
APA StyleMello, F. N. A., Estrada-Villegas, S., DeFilippis, D. M., & Schnitzer, S. A. (2020). Can Functional Traits Explain Plant Coexistence? A Case Study with Tropical Lianas and Trees. Diversity, 12(10), 397. https://doi.org/10.3390/d12100397