Abstract
The common bean (Phaseolus vulgaris L.) is one of the main legumes worldwide and represents a valuable source of nutrients. Independent domestication events in the Americas led to the formation of two cultivated genepools, namely Mesoamerican and Andean, to which European material has been brought back. In this study, Italian common bean landraces were analyzed for their genetic diversity and structure, using single nucleotide polymorphism (SNP) markers derived from genotyping-by-sequencing (GBS) technology. After filtering, 11,866 SNPs were obtained and 798 markers, pruned for linkage disequilibrium, were used for structure analysis. The most probable number of subpopulations (K) was two, consistent with the presence of the two genepools, identified through the phaseolin diagnostic marker. Some landraces were admixed, suggesting probable hybridization events between Mesoamerican and Andean material. When increasing the number of possible Ks, the Andean germplasm appeared to be structured in two or three subgroups. The subdivision within the Andean material was also observed in a principal coordinate analysis (PCoA) plot and a dendrogram based on genetic distances. The Mesoamerican landraces showed a higher level of genetic diversity compared to the Andean landraces. Calculation of the fixation index (FST) at individual SNPs between the Mesoamerican and Andean genepools and within the Andean genepool evidenced clusters of highly divergent loci in specific chromosomal regions. This work may help to preserve landraces of the common bean from genetic erosion, and could represent a starting point for the identification of interesting traits that determine plant adaptation.
1. Introduction
The common bean (Phaseolus vulgaris L.) is one of the main agricultural food crops worldwide [1]. Its rich nutritive composition, high levels of variation in growth habit and environmental adaptation, and versatility for various consumption forms (green leaves, green pods, immature seeds, and dry seeds) make it an interesting and valuable crop. Although less important than cereals, the common bean is an affordable source of vegetable proteins, calories, and micronutrients [2]. Like for other legumes, the major limitations are represented by the low content of sulfur-amino acids and the presence of anti-nutritional compounds [3].
The American continent produces nearly half of the world’s supply of dry beans, with Brazil, the USA, Mexico, and Central American countries being the major producers. The main Asian bean productions are based in India, China, and Myanmar [1]. In Europe, cultivation is concentrated in regions bordering the Mediterranean basin, such as the Iberian Peninsula, Italy, Greece, and the Balkan countries, though this production is not sufficient to cover the world’s demand [4].
The New World origin of the Phaseolus genus is not in doubt, but the precise geographical region of the common bean’s origin is still debated. Wild common bean forms, located in a restricted area between Northern Peru and Ecuador, have been considered as the putative ancestors from which the species P. vulgaris originated [5,6], but more recently as a distinct, but not ancestral, form [7]. An alternative hypothesis of the Mesoamerican origin of the common bean, most likely located in Mexico, was supported by data obtained with multi-locus molecular markers [8,9], which was recently corroborated on the basis of sequence data [10,11]. Notwithstanding these assumptions, an Andean origin of the common bean cannot be completely excluded; further studies on this issue need to be accomplished [12].
Domestication from wild beans occurred independently in Mesoamerica and Andean South America and gave rise to two major distinct gene pools within the cultivated forms. The occurrence of separate domestication events has been well established using multiple approaches [7,13,14,15,16,17,18].
Bitocchi et al. [19] and Rodriguez et al. [20] investigated the effect of domestication on genetic diversity in both gene pools. These studies highlighted a single domestication event within each gene pool, and indicated the Oaxaca valley in Mesoamerica and southern Bolivia–northern Argentina in South America as the geographical areas of common bean domestication. One of the striking differences between the two cultivated gene pools was the pattern of phaseolin, the main seed storage protein; Mesoamerican common beans possessed an S-type phaseolin, while Andean forms showed T, C, or H phaseolin types [13], indicating a rapid attribution to either of the two gene pools.
Starting from the 1990s, systematic studies on the European common bean landraces were carried out by recording morphological and agronomical traits, seed quality traits, and phaseolin patterns. The prevalence of the Andean types was first described by Gepts and Bliss [21] and was confirmed by subsequent studies at national [22,23,24] and regional [25,26,27] levels. By analyzing six chloroplast simple sequence repeats (SSRs) and two nuclear loci in a large collection of European landraces, Angioi and collaborators [28] showed that 67% were of Andean origin. Moreover, a later study [29] confirmed that a relatively high proportion of European germplasm (40%) was derived from hybridization between the two common bean gene pools, a proportion that was five-fold higher than that found in American materials. As a result, the bottleneck of introduction in Europe could have been mitigated from intercrossing between the gene pools, creating new combinations of traits. Adaptation to changed environmental conditions, biotic and abiotic stresses, and unconscious selection operated by farmers might have resulted in a strong impact on the evolution of the European common bean, leading to a myriad of landraces.
Landraces are local populations strongly adapted to environmental conditions of the cultivation area and closely associated to the uses and cultures of the people that continue to grow them; they represent an important component of agrobiodiversity and are often at risk of extinction, since they are cultivated by old farmers and are gradually substituted by modern cultivars [30]. Plant landraces, including many common bean materials, are often cultivated in marginal areas and contain important adaptation traits to soil problems, drought, or stressful environments [31,32,33].
A number of molecular markers have been used in the common bean for the analysis of origin, domestication, diffusion, population structure, and genetic variation. In recent years, a helpful tool to enhance genetic analysis has emerged called genotyping-by-sequencing (GBS), a technology based on massive sequencing which is able to discover a large number of single nucleotide polymorphisms (SNPs). Genotyping-by-sequencing methods allow the sequencing of a reduced portion of the genome by targeting DNA fragments flanking restriction sites, or Restriction Associated DNA (RAD) [34]. The digestion of genomic DNA is performed using a single restriction enzyme [35,36], a combination of a single enzyme with random shearing [34,37], or two restriction enzymes [38,39]. The GBS technique was successfully optimized and used in the common bean for various purposes [40,41,42].
The objective of this study was to use GBS-derived SNP markers to assess population genetics and phylogenetic relationships in a set of 50 Italian common bean accessions attributed to the Andean or Mesoamerican genepools through the diagnostic marker phaseolin.
2. Materials and Methods
2.1. Plant Material
Fifty Italian common bean accessions were used in this study. The predominant part of samples were landraces from southern Italy (especially Apulia and Basilicata regions), however other Italian regions were also represented (Table S1). Most samples were gathered during collecting missions carried out in Apulia region between 2015 and 2016. The other materials were from a common bean working collection held at the Institute of Biosciences and Bioresources, CNR, Italy, and five samples were bought as market-improved varieties.
2.2. Protein Extraction and SDS/PAGE (Sodium Dodecyl Sulphate/PolyAcrylamide Gel Electrophoresis)
The dry cotyledons of three single seeds per sample was finely ground and the proteins were extracted for two hours by adding 10 volumes of 0.002 M borate buffer pH 9.0. The proteins were dissociated by heating to 90 °C for 2 min in the presence of denaturing buffer (20 mM Tris-HCl pH 8.6 containing 1% SDS, 2% 2-mercaptoethanol, and 8.3% glycerol). One-dimensional SDS/PAGE was performed following the procedure described by Laemmli [43] using 15% polyacrylamide gel slabs.
2.3. DNA Extraction, GBS Assay, and SNP Filtering
Plants were grown in a greenhouse and genomic DNA was extracted from young leaves of single plants using the DNeasy Plant Mini Kit (Qiagen, Hilden, Germany). The DNA quality was verified using a Nanodrop (Thermo Fisher Scientific, Rockfort, IL, USA) and its concentration was quantified with a Qubit fluorometer (Life Technologies, Carlsbad, CA, USA).
A custom ddRAD protocol inspired by the method proposed by Peterson and collaborators [38] was optimized for P. vulgaris. DNA libraries were prepared at IGA Technology Services S.r.l. (Udine, Italy) by using SphI + MboI restriction enzymes. After digestion, fragments were ligated to adapters. Fragments between 350 and 600 bp were isolated from agarose gel and purified using the QIAquick Gel Extraction kit (Qiagen). Illumina hybridization and sequencing sites along with index sequences for combinational multiplexing were incorporated by enrichment PCR. The quality, quantity, and reproducibility of libraries were verified using a Caliper instrument (DNA High Sensitivity chip). A HiSeq 2500 platform on high-output mode was used to produce paired-end sequences of 125 bp.
Cluster analysis was carried out using the Illumina CASAVA v1.8.2 software and higher level multiplex divided by means of Illumina TruSeq indexes (24 samples each, with variable inline barcodes). Internal pipelines were applied to raw reads in order to remove low quality reads and to demultiplex single individuals according to inline barcodes. These were removed from each read and RAD site concordance was checked.
RAD sequence analysis was carried out by the alignment on reference genome using a BWA MEM aligner v0.7.10 [44]. Default parameters and alignments with mapping quality > 4 were retained in order to remove ambiguous loci that could confound SNP calling. SNP/haplotype calling was performed using Stacks v1.35 software [45].
Biallelic SNPs were filtered for a minimum depth of three reads and for a minor allele frequency (MAF) higher than 5%, a call rate higher than 80%, and an inbreeding coefficient > 0.8, by means of TASSEL v5.2.20 [46] and SNP & Variation Suite (SVS) software v8.4.0 (Golden Helix Inc., Bozeman, MT, USA). Downstream analyses were performed on genotypes with less than 30% missing data. SNP statistics were obtained with customized R scripts.
Common bean SNP markers were deposited in the EVA-EMBL (https://www.ebi.ac.uk/eva/) public database (Project: PRJEB33094, Analyses: ERZ990093).
2.4. Structure Analysis and Genetic Relationships
Prior to analysis, the SVS software v8.4.0 was used to trim the SNP dataset based on pairwise linkage disequilibrium (LD) between adjacent markers. The threshold was set at r2 > 0.5, as reported in previous SNP analyses in the common bean [42,47].
Structure analysis was carried out using a Bayesian formulation of a clustering procedure and the admixture model by means of the software STRUCTURE (v2.3.4) [48]. To estimate the number of subpopulations (K) inside P. vulgaris germplasm, 10 independent runs were performed for each K value from K = 2 to K = 10, applying a length of burning period of 50,000 and a number of Markov chain Monte Carlo (MCMC) repetitions after burning equal to 100,000. The “optimal” number of clusters (K value), was determined by ad hoc ΔK statistics [49] using Structure Harvester software [50].
The output of STRUCTURE was used to obtain expected heterozygosity between individuals in the same group and the ˝net nucleotide distance˝ (allele frequency divergence) between clusters.
SNPs selected as previously described were used to evaluate the genetic relationships among the common bean genotypes. The Tamura–Nei genetic distance [51] was calculated and a principal coordinate analysis (PCoA) was performed with GenAlex 6.5.02. A neighbor joining (NJ) tree was constructed using MEGA7 [52], with 500 bootstrap replicates.
2.5. Pairwise Fixation Index (FST)
FST values at individual loci were plotted against the common bean genome assembly using SVS v8.4.0, implementing the Weir and Cockerham algorithm [53]. All the initially filtered SNPs, including those in LD, were considered for this analysis.
3. Results
3.1. Seed Morphological Traits and Phaseolin Pattern
The material analyzed was variable in seed shape, size, and color (Table S1, Figure S1). Three seed phaseolin patterns were observed, i.e., type S for 19 landraces, type T for 17 samples (including 5 commercial varieties), and type C for 14 landraces (Table S1). All common beans with S phaseolin displayed light-colored seeds, including white, light brown, pale brown, and pale yellow, with the exception of “Carrubara” (8) which was collected in Sicily, which showed a black coloration. The seed colors in type C and T were more variable and generally darker than in type S, ranging from white to light brown, brown, reddish-brown, dark red, and black. Some accessions had a seed coat pattern varying from striped to mottled, spotted, or showing a colored eye around the hilum.
Phaseolin S accessions displayed predominantly a kidney, cuboid, or oval shape, while phaseolin T samples were mainly cylindrical or oval, and phaseolin C accessions were very variable, but predominantly oval and cuboid. “Locale di Accettura” (20) accession was the only kidney-shaped accession among the ones displaying phaseolin type C.
Most of the analyzed accessions are consumed as dry seeds, but some are eaten as fresh vegetables, and some can be consumed either way. A number of common bean landraces take their name from their seed tegument color, e.g., “Zolfino” (sulfur, yellow), “Verdolino” (light greenish), “Tabacchino” (“small tobacco”, brown), or seed shape or size, e.g., “Riso” (rice), “Piattella” (flat). In some cases, the same common name is used to identify genetically different material, for instance “Cannellino” is a market class usually referred to white, kidney/cylindrical-shaped common beans, while “Fagiolini” (little beans) or “Mangiatutto” (eat all) generally refer to snap beans. This popular nomenclature is common also in other Italian regions [54].
3.2. Sequencing Output
Illumina raw reads were analyzed in order to eliminate low quality reads and demultiplex single individuals according to internal barcodes, which were removed, and RAD site concordance was checked. All reads were trimmed to a fixed length of 110 bp to maintain maximum compatibility for downstream software. After pre-processing steps, 94% of raw reads were successfully demultiplexed and linked to samples. The average read count per sample was 3.09 M.
After filtering SNPs for MAF, call rate, and inbreeding coefficient, 11,866 polymorphic sites were detected in 50 samples. Transitions were 63.68% and transversions were 36.32%, therefore the transition–transversion rate was 1.75.
3.3. Genetic Structure
In order to highlight a possible genetic structure in the analyzed germplasm, SNPs were further filtered so that they were approximately in linkage equilibrium; a final set of 798 markers was subjected to the software STRUCTURE using the admixture model. The best number of subpopulations identified by the Evanno delta K method [49] was two (Figure S2), which separated the group of accessions with phaseolin pattern S (red) from the other accessions (green), suggesting that our material was made up of two main genetic groups (Figure 1). The threshold of the membership coefficient (q) used to assign a genotype to a group was q ≥ 0.8. At K = 2, most accessions both in the red and in the green group showed q = 1.00. Six accessions were admixed, including three landraces, namely “Corno di capra” (18), “Zolfino” (19), “Locale di Accettura” (20), and three commercial varieties, i.e., “Mangiatutto Sx015” (21), “Mangiatutto Mx200” (22), and “Saporro” (23) (Figure 1).

Figure 1.
Population structure of the common bean material analyzed in this study. From top to bottom: K = 2, K = 3, K = 4, K = 5, and K = 6 graphs. The y-axis indicates the estimated membership coefficient (q). Each accession is represented by a single vertical bar, and is identified by a progressive number (above the K = 2 graph) and its name, plus its phaseolin type (below the K = 6 graph), as in Table S1. Different colors correspond to the distinct groups at each K, as identified by the STRUCTURE software.
Considering that, in the presence of a hierarchical population structure, the Evanno method can underestimate the number of K [55], STRUCTURE models from K = 3 to K = 6 were also taken into account (Figure 1). In K3, the group of accessions with the S phaseolin pattern (red) was maintained, while the other genotypes formed two sets of samples, which were blue and green (Figure 1). The blue group was mostly composed of common beans with a T phaseolin type, the only exception being “Villata” (29), showing a type C phaseolin. Within this group, three market varieties were included, together with “Mangiatutto” (24), “Saluggia” (25), “Cosaruciaru” (26), “Marconi Nero” (27), “Cannellino” (28), “Villata” (29), and “Verdolino” (30). The first two admixed samples with a higher q value for the blue group, namely “Ciuoto” (31) and “Tabacchino” (32), had q values of ≥0.7 and a type T phaseolin. The green group included 14 genotypes, mostly with a type C phaseolin, while three samples (“Nasieddu” 39, “San Michele” 46, and “Riso giallo” 47) had a T phaseolin. All of these common beans in the green group were from southern Italy.
In the K4 model, the red group, which included accessions with an S phaseolin pattern, was maintained. On the other hand, the previous blue set in K3 split into two parts: (i) A green group formed by the market varieties “Mangiatutto Sx015” (21), ˝Mangiatutto Mx200˝ (22), and “Saporro” (23), all of them with q values equal to 1.00 and a T phaseolin pattern (Figure 1), and (ii) a blue group with the remaining accessions, plus “Ciuoto” (31). The fourth group (yellow) corresponded to the previous green group in K3. In the K5 model, “Zolfino” (19), which was previously admixed, was isolated, and the K6 solution also separated the landrace “Corno di capra” (18) (Figure 1).
Therefore, generally speaking, the common beans with an S-type phaseolin constituted a very compact group at all K values, except for the samples “Corno di capra” (18) and “Zolfino” (19), which were usually admixed and isolated from the rest of the germplasm at higher K. Other samples showing an admixed genetic background from K3 onwards were “Locale di Accettura” (20), “Riso” (33), “Billò” (34) with a C phaseolin, and “Pezzati” (50) with a T phaseolin.
The gene diversity, or expected heterozygosity (Hexp) at K2 was 0.240 and 0.186 for the Mesoamerican and Andean common bean accessions, respectively. At K4, the Mesoamerican landraces showed a Hexp equal to 0.235, while for the mainly type T (blue group in Figure 1) and type C phaseolin (yellow group in Figure 1) Hexp was 0.162 and 0.100, respectively. Net nucleotide distance is the average of pairwise difference between alleles from different groups, excluding the variation found within each group; in this study, this was calculated at the most significant K values, i.e., K2 and K4. At K2, the net value between the Mesoamerican and Andean germplasms was 0.120. At K4, the highest net values (0.181–0.232) were observed between improved varieties (green group, Figure 1) and the other material, especially with the prevailing type C accessions (0.232), while the lowest (0.127) net distance was detected within the Andean material, i.e., between the blue and yellow groups (Figure 1). The nucleotide distances between the Mesoamerican and prevailing type T or type C were 0.158 and 0.143, respectively.
In order to assess the genetic relationships, the Tamura–Nei genetic distance between accessions was calculated and the distance matrix was used to construct a PCoA scatterplot and a neighbor joining tree. The PCoA graph (Figure 2A) highlights four main groupings corresponding to the clusters present in the K4 solution of the structure analysis. In particular, the samples at the top on the right hand side are the S-phaseolin common beans (red), in the lower right-hand side three improved commercial varieties can be found (green), in the lower left quadrant mainly-type T phaseolins are included (blue), and at the top left side, mainly type C phaseolin landraces are found (black). The landraces, which were admixed in the structure analysis, are scattered throughout the graph and appear to be separated from the groups.
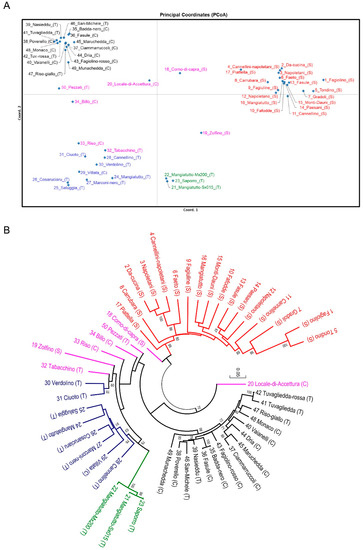
Figure 2.
(A) Graph of the first two axes from a principal coordinate analysis (PCoA) of common bean genotypes used in this study. Colors refer to groups in K = 4 of Figure 1, except for the yellow group, which is black, and the admixed samples, which are fuchsia colored. (B) Neighbor joining tree based on Tamura–Nei genetic distance derived from single nucleotide polymorphism (SNP) analysis. Bootstrap values ≥ 60 are shown. Common bean accessions are indicated with a progressive number, common name, and phaseolin pattern (in brackets).
The dendrogram (Figure 2B) is divided in two major branches; the top branch includes accessions displaying an S phaseolin pattern (Mesoamerican), while the other is mainly formed by samples with and type C and T phaseolin patterns (Andean). In the Mesoamerican cluster, accessions were quiet compact, the most distantly related being “Corno di capra” (18), which was admixed in the structure analysis. The seed shape of this material was mainly oval or kidney. In the lower cluster, the accession “Locale di Accettura” (20) was isolated from the remaining samples, which formed two subgroups. The cluster on the right-hand side was quite compact and contained 15 accessions from southern Italy (mostly with a C phaseolin type). The landraces composing these groups showed seed shapes ranging from oval to oval/cuboid and round. The other branch, on the left-hand side, included 16 accessions (mostly with a T phaseolin type), distributed in small clusters. Three landraces (33, 34, 50) were isolated, while the other material formed two groups. One of these included various landraces (24–29) with seed shapes from oval to cylindrical to kidney-shaped and, at a higher distance, a subgroup with the three market varieties 21, 22, and 23 (cylindrical). The other group was composed of oval shaped landraces from the Basilicata region (30, 31, 32). The type S “Zolfino” (19), which was admixed in the structure analysis, was positioned in this latter group, although at a large genetic distance.
Snap beans, which can have any phaseolin type, were quite dispersed in the tree.
3.4. Pairwise Fixation Index (FST)
In order to detect genomic regions putatively subjected to directional selection, FST values at the 11,866 individual loci were plotted against the common bean genome. To do this, we defined three different clusters, i.e., the type S phaseolin, the prevailing type T phaseolin, and the prevalent type C phaseolin groups, corresponding to the red, blue, and yellow groups in K4 (Figure 1), respectively, and excluded admixed material. We performed two kinds of comparisons: The Mesoamerican S-type common beans against the other accessions (Andean), and the prevailing T-type material against the prevalent C-type accessions, which both belonged to the Andean genepool. In the first case, as expected, many SNPs showed a high FST value, scattered in almost all chromosomes, even though SNPs with FST = 1 formed some blocks, especially in chromosomes Pv1, Pv7, Pv9, Pv10, and Pv11 (Figure 3A). When comparing the two C/T-groups, a lower number of high-FST SNPs was observed and the 181 SNPs with an FST value equal to 1 were concentrated in some chromosomes (Figure 3B). We analyzed these SNPs and found that chromosomes Pv1, Pv2, Pv3, Pv4, Pv7, and Pv10 contained 42, 6, 1, 10, 24, and 98 SNPs, respectively (Table S2). Of these, 14 SNPs were located in 11 genes, with 6 in introns (4 genes in chromosomes Pv1, Pv2, Pv10), 5 in CDS (5 genes in chromosomes Pv7 and Pv10), and 3 in 3′UTR (2 genes, chromosomes Pv1 and Pv7). These genes had putative different functions, including cadmium transporter ATPase, starch synthase, DNA binding, serine/threonine protein kinase, ribosome protein, etc. (Table S3).
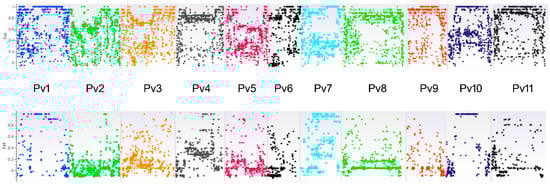
Figure 3.
Fixation index (FST) for SNPs analyzed between (A) Mesoamerican and Andean accessions and (B) within Andean groups. Each bar represents a common bean chromosome. From left to right, Pv1 to Pv11. Each color refers to a common bean chromosome.
4. Discussion
The analysis of agro-biodiversity, that is, plant genetic resources used for food and agriculture, is pivotal to ensure the knowledge and maintenance of genetic variation within crops, thus sustaining ecosystem operation, resilience, and productivity [56]. Moreover, agro-biodiversity supplies farmers and breeders with genetically variable plants, which is useful for the selection and adaptation of crops to environmental changes [57]. The screening of P. vulgaris germplasm for molecular variation of candidate genes potentially associated with drought tolerance highlighted the importance of studying diverse genetic material adapted to environmental constraints [58,59,60].
In this study, we used GBS technology to study population genetics and genetic relationships in a set of common bean landraces mostly collected in southern Italy, especially the Apulia and Basilicata regions, and compared them to germplasm from other Italian regions and to some commercial varieties. Our material was comprised mostly of landraces belonging to the Andean gene pool, in agreement with previous observations in European countries on a larger scale [21,61]. Within the European Andean germplasm, phaseolin T-types prevailed over C-types [21], while Logozzo et al. [61] found an exceptionally higher rate of C-types in Italy. In our study, the numbers of T- and C-type landraces were comparable.
Because LD can affect both STRUCTURE analysis and principal coordinate analysis (PCoA), the 11,866 SNPs obtained after an initial filtering of GBS data were subjected to LD-pruning; a reduced portion, i.e., 798 markers, were used to infer population structure and genetic relationships. The strong decrease in SNP number for downstream analyses might be mainly ascribed to the predominant self-pollinating nature of the common bean, leading to very long blocks of markers in linkage disequilibrium [62].
The population structure of our accessions reflected the two independent domestication events that occurred, separating the common beans into Mesoamerican genotypes, characterized by a type S phaseolin, and Andean material, with a C or T phaseolin pattern [63]. In fact, the most probable number of groups in our structure analysis was K = 2, dividing these two sets of accessions, as already observed in other common bean germplasm collections [20,42]. Some admixed accessions between the two groups might have derived from hybridization events. For instance, ˝Locale di Accettura˝ landrace possessed a C-type phaseolin and its seeds were kidney-shaped; this latter trait was usual for Mesoamerican, but not Andean common beans. Also, in other Italian common bean landraces, phaseolin S material generally showed kidney and cuboid shapes and a prevalence of white or whitish seeds [54]. Therefore, the landrace ˝Locale di Accettura˝, which was admixed in all the structure plots and isolated in the phylogenetic tree, could have been derived from a hybridization event. Hybridizations between Andean and Mesoamerican genepools are quite diffuse in the European common bean germplasm (> 40%), but with a lower frequency in Spain and Italy [28,42].
The strongly supported separation between Mesoamerican and Andean clusters (high DeltaK value for K = 2) is due to the high genetic differentiation between these two genepools, which could hide other possible substructures of our material. In fact, when analyzing clusters for K > 2, while the Mesoamerican material remained compact, the Andean genotypes showed an internal structure with two (K = 3) or three (K > 3) subpopulations. This result highlighted a heterogeneous background regarding the material from the Andean origin. It was observed that, while the Mesoamerican landraces were less diverse than the wild Mesoamerican populations, the Andean landraces were more diverse than the wild Andean populations, possibly due to admixture with Mesoamerican common beans and/or due to new mutations that occurred in the Andean cultivated material [64]. Heterogeneity in common beans from Andean origin was also detected in other Italian germplasm, although those studies were based on much fewer loci. An analysis with 12 SSR polymorphic loci structured some Italian common bean landraces into three clusters; one mostly included Mesoamerican S-type phaseolin accessions, but the others had no precise pattern of distribution for Andean type T and C phaseolin. This could possibly be ascribed to adaptation to different environmental conditions determined by altitude [54]. Another SSR study on common bean landraces from the Calabria region (southern Italy) identified one and four groups of Mesoamerican and Andean origin, respectively, and a relatively high proportion of accessions deriving from inter- and intra-specific hybridizations [65].
In our study, notwithstanding the heterogeneity identified in the Andean material by the structure analysis, a higher gene diversity (Hexp) was found within the Mesoamerican samples compared to Andean accessions. This result is in agreement with what was observed on a larger scale regarding the domesticated common bean [20]. The dispersion of materials used for snap bean consumption confirmed recent data suggesting that snap beans might have been independently derived from dry beans more than once and from both centers of domestication [66]. Since strong differentiation was observed between the Mesoamerican and Andean materials, and subgroups were detected within the latter genepool, we compared these genotypic groups by seeking SNPs with high FST values, although our population size was not large. We first compared Mesoamerican versus Andean groups and found many SNPs with high FST on various chromosomes. When analyzing high FST SNPs between the two groups of Andean material, more discrete genomic regions appeared to differentiate between the two Andean groups. In our study, blocks of SNPs with FST values equal to 1 between the Mesoamerican and Andean genepools were present in chromosomes Pv1, Pv7, Pv9, Pv10, and Pv11. By comparing cultivated versus wild material, selection regions related to domestication were highlighted, most of which were different for Mesoamerican and Andean germplasm due to distinct domestication pathways followed by the two genepools [64]. These regions were concentrated in chromosomes Pv2, Pv7, and Pv9 for Mesoamerican domestication. In a recent genomic landscape study, common bean genepool divergence was disclosed in four outlier regions in the Pv1, Pv5, Pv10, and Pv11 chromosomes [33]. In the same study, it was highlighted that within-species divergence did not necessarily arise within the speciation islands of Phaseolus beans.
On the other hand, in Andean common beans, domestication events primarily involved chromosomes Pv1, Pv2, and Pv10 [64]; in our material, chromosomes Pv1 and Pv10 contained the highest number of SNPs, with FST = 1 (42 and 98, respectively) differentiating the Andean subgroups. It is likely that, in our study, the regions discriminating the Andean groups contained signatures of selection related to landrace adaptation and desired seed and plant traits [64], although, due to the high LD and broad haplotype blocks in the common bean, signatures of selection should be viewed with caution. In the wild common bean, SNPs associated with the bioclimatic-based drought index were found in several regions spread throughout all chromosomes, and two candidate genes were identified in Pv3 and Pv8; results from summary statistics suggested that adaptation to drought occurred under true natural divergent selection, rather than confounding demographic processes [32].
In conclusion, GBS proved to be a valuable tool to study the population genetics and relationships in common bean germplasm, even at local level, as already observed for other crops [67,68,69,70]. In addition, our work is relevant regarding the preservation of local landraces of the common bean from genetic erosion, and could be useful for future studies to tackle the identification of interesting traits relating to plant adaptation for breeding purposes.
Supplementary Materials
The following are available online at https://www.mdpi.com/1424-2818/11/9/154/s1, Figure S1: Italian common bean (Phaseolus vulgaris L.) landraces used in this study. Photos for three market varieties are absent since these seeds are dressed and did not display their natural coloration. Figure S2: estimate of the most probable K by means of ΔK statistics. The number of subpopulations (K) was ascertained based on maximum likelihood and ΔK values. Table S1: list of common bean germplasms analyzed, sample codes, seed features, product type, and phaseolin patterns. Table S2: SNP markers with FST = 1 between two groups of Andean common bean accessions analyzed in the present study. Table S3: SNP markers from Table S2, found in P. vulgaris genes. Transcript name, SNP localization, and functional annotation are indicated.
Author Contributions
Conceptualization: G.S. and L.L.; Formal analysis: S.P., G.S., D.L.Z., L.L.; Funding acquisition: G.S.; Investigation: G.S., L.L., S.P., D.L.Z.; Resources: G.S.; Supervision: G.S.; Writing - original draft: L.L. and G.S.; Writing - review & editing: G.S. and L.L.
Funding
This research was funded by the project BiodiverSO—PSR Puglia 2007-2013 Mis. 214/4 subaz. a), and by the project BiodiverSO—PSR Puglia 2014-2020 Mis.10.2.
Acknowledgements
Authors thank Salvatore Cifarelli (SC) and Francesco P. Losavio for collecting the germplasms in the Apulia region, SC for seed pictures, and Vittoria Liuzzi for DNA extraction. Special thanks to the reviewers and the editor for their valuable suggestions and comments.
Conflicts of Interest
The authors declare no conflict of interest. The funders had no role in the design of the study, in the collection, analyses, or interpretation of data, in the writing of the manuscript, or in the decision to publish the results.
References
- FAO. FAOSTAT Crops. Available online: http://www.fao.org/faostat/en/#data/QC 2017 (accessed on 24 July 2019).
- Broughton, W.J.; Hernandez, G.; Blair, M.; Beebe, S.; Gepts, P.; Vanderleyden, J. Beans (Phaseolus spp.)—Model food legumes. Plant Soil 2003, 252, 55–128. [Google Scholar]
- Sparvoli, F.; Bollini, R.; Cominelli, E. Nutritional value. In Grain Legumes. Handbook of Plant Breeding; De Ron, A., Ed.; Springer: New York, NY, USA, 2015; pp. 291–325. [Google Scholar]
- Lioi, L.; Piergiovanni, A.R. Common bean cultivation in the Mediterranean basin. Legume Perspect. 2015, 10, 22–24. [Google Scholar]
- Debouck, D.G.; Toro, O.; Paredes, O.M.; Johnson, W.C.; Gepts, P. Genetic diversity and ecological distribution of Phaseolus vulgaris (Fabaceae) in northwestern South America. Econ. Bot. 1993, 47, 408–423. [Google Scholar] [CrossRef]
- Kami, J.; Velásquez, V.B.; Debouck, D.G.; Gepts, P. Identification of presumed ancestral DNA sequences of phaseolin in Phaseolus vulgaris. Proc. Natl. Acad. Sci. USA 1995, 92, 1101–1104. [Google Scholar] [CrossRef] [PubMed]
- Blair, M.W.; Soler, A.; Cortés, A.J. Diversification and population structure in common beans (Phaseolus vulgaris L.). PLoS ONE 2012, 7, e49488. [Google Scholar] [CrossRef] [PubMed]
- Rossi, M.; Bitocchi, E.; Bellucci, E.; Nanni, L.; Rau, D.; Attene, G.; Papa, R. Linkage disequilibrium and population structure in wild and domesticated populations of Phaseolus vulgaris L. Evol. Appl. 2009, 2, 504–522. [Google Scholar] [CrossRef] [PubMed]
- Kwak, M.; Kami, J.A.; Gepts, P. The putative Mesoamerican domestication center of Phaseolus vulgaris is located in the Lerma-Santiago Basin of Mexico. Crop Sci. 2009, 49, 554–563. [Google Scholar]
- Mamidi, S.; Rossi, M.; Annam, D.; Moghaddam, S.; Lee, R.; Papa, R.; McClean, P. Investigation of the domestication of common bean (Phaseolus vulgaris) using multilocus sequence data. Funct. Plant Biol. 2011, 38, 953–967. [Google Scholar] [CrossRef]
- Bitocchi, E.; Nanni, L.; Bellucci, E.; Rossi, M.; Giardini, A.; Spagnoletti Zeuli, P.; Logozzo, G.; Stougaard, J.; McClean, P.; Attene, G.; et al. Mesoamerican origin of the common bean (Phaseolus vulgaris L.) is revealed by sequence data. Proc. Natl. Acad. Sci. USA 2012, 109, E788–E796. [Google Scholar] [CrossRef]
- Cortés, A.J. On the origin of the common bean (Phaseolus vulgaris L.). Am. J. Plant Sci. 2013, 4, 1998–2000. [Google Scholar]
- Gepts, P. Phaseolin as an evolutionary marker. In Genetic Resources of Phaseolus Beans; Gepts, P., Ed.; Kluwer: Dordrecht, The Netherlands, 1988; pp. 215–241. [Google Scholar]
- Koenig, R.; Gepts, P. Segregation and linkage of genes for seed proteins, isozymes, and morphological traits in common bean (Phaseolus vulgaris). J. Hered. 1989, 80, 455–456. [Google Scholar]
- Sonnante, G.; Stockton, T.; Nodari, R.O.; Becerra Velásquez, V.L.; Gepts, P. Evolution of genetic diversity during the domestication of common-bean (Phaseolus vulgaris L.). Theor. Appl. Genet. 1994, 89, 629–635. [Google Scholar] [CrossRef] [PubMed]
- Chacón, M.S.; Pickersgill, B.; Debouck, D.G. Domestication patterns in common bean (Phaseolus vulgaris L.) and the origin of the Mesoamerican and Andean cultivated races. Theor. Appl. Genet. 2005, 110, 432–444. [Google Scholar] [CrossRef] [PubMed]
- Blair, M.W.; Cortés, A.J.; Penmetsa, R.V.; Farmer, A.; Carrasquilla-Garcia, N.; Cook, D.R. A high-throughput SNP marker system for parental polymorphism screening and diversity analysis in common bean (Phaseolus vulgaris L.). Theor. Appl. Genet. 2013, 126, 535–548. [Google Scholar] [CrossRef] [PubMed]
- Cortés, A.J.; Chavarro, M.C.; Blair, M.W. SNP marker diversity in common bean (Phaseolus vulgaris L.). Theor. Appl. Genet. 2011, 123, 827–845. [Google Scholar] [CrossRef] [PubMed]
- Bitocchi, E.; Bellucci, E.; Giardini, A.; Rau, D.; Rodriguez, M.; Biagetti, E.; Santilocchi, R.; Spagnoletti Zeuli, P.; Gioia, T.; Logozzo, G.; et al. Molecular analysis of the parallel domestication of the common bean (Phaseolus vulgaris) in Mesoamerica and the Andes. New Phytol. 2013, 197, 300–313. [Google Scholar] [CrossRef] [PubMed]
- Rodriguez, M.; Rau, D.; Bitocchi, E.; Bellucci, E.; Biagetti, E.; Carboni, A.; Gepts, P.; Nanni, L.; Papa, R.; Attene, G. Landscape genetics, adaptive diversity and population structure in Phaseolus vulgaris. New Phytol. 2016, 209, 1781–1794. [Google Scholar] [CrossRef] [PubMed]
- Gepts, P.; Bliss, F.A. Dissemination pathways of common bean (Phaseolus vulgaris; Fabaceae) deduced from phaseolin electrophoretic variability. II Europe and Africa. Econ. Bot. 1988, 42, 86–104. [Google Scholar] [CrossRef]
- Lioi, L. Geographical variation of phaseolin patterns in an old world collection of Phaseolus vulgaris. Seed Sci. Technol. 1989, 17, 317–324. [Google Scholar]
- Ocampo, C.H.; Martin, J.P.; Sanchez-Yelamo, M.D.; Ortiz, J.M.; Toro, O. Tracing the origin of Spanish common bean cultivars using biochemical and molecular markers. Genet. Resour. Crop Evol. 2005, 52, 33–40. [Google Scholar] [CrossRef]
- Rodiño, A.P.; Santalla, M.; Montero, I.; Casquero, PA.; De Ron, A.M. Diversity of common bean (Phaseolus vulgaris L.) germplasm from Portugal. Genet. Resour. Crop Evol. 2001, 48, 409–417. [Google Scholar] [CrossRef]
- Escribano, M.R.; Santalla, M.; Casquero, P.A.; De Ron, A.M. Patterns of genetic diversity in landraces of common bean (Phaseolus vulgaris L.) from Galicia. Plant Breed. 1998, 117, 49–56. [Google Scholar] [CrossRef]
- Piergiovanni, A.R.; Taranto, G.; Losavio, F.P.; Pignone, D. Common bean (Phaseolus vulgaris L.) landraces from Abruzzo and Lazio regions (Central Italy). Genet. Resour. Crop Evol. 2006, 53, 313–322. [Google Scholar] [CrossRef]
- Lioi, L.; Nuzzi, A.; Campion, B.; Piergiovanni, A.R. Assessment of genetic variation in common bean (Phaseolus vulgaris L.) from Nebrodi mountains (Sicily, Italy). Genet. Resour. Crop Evol. 2012, 59, 455–464. [Google Scholar] [CrossRef]
- Angioi, S.A.; Rau, D.; Attene, G.; Nanni, L.; Bellucci, E.; Logozzo, G.; Negri, V.; Spagnoletti Zeuli, P.L.; Papa, R. Beans in Europe: Origin and structure of the European landraces of Phaseolus vulgaris L. Theor. Appl. Genet. 2010, 121, 829–843. [Google Scholar] [CrossRef] [PubMed]
- Gioia, T.; Logozzo, G.; Attene, G.; Bellucci, E.; Benedettelli, S.; Negri, V.; Papa, R.; Spagnoletti Zeuli, P. Evidence for introduction bottleneck and extensive inter-gene pool (Mesoamerica x Andes) hybridization in the European common bean (Phaseolus vulgaris L.) germplasm. PLoS ONE 2013, 8, e75974. [Google Scholar] [CrossRef] [PubMed]
- Negri, V. Landraces in central Italy: Where and why they are conserved and perspectives for their on-farm conservation. Genet. Resour. Crop Evol. 2003, 50, 871–885. [Google Scholar] [CrossRef]
- Dwivedi, S.L.; Ceccarelli, S.; Blair, M.W.; Upadhyaya, H.D.; Are, A.K.; Ortiz, R. Landrace germplasm for improving yield and abiotic stress adaptation. Trends Plant Sci. 2016, 21, 31–42. [Google Scholar] [CrossRef]
- Cortés, A.J.; Blair, M.W. Genotyping by sequencing and genome—Environment associations in wild common bean predict widespread divergent adaptation to drought. Front. Plant Sci. 2018, 9, 128. [Google Scholar] [CrossRef]
- Cortés, A.J.; Hurtado, P.; Blair, M.W.; Chacón-Sánchez, M.I. Does the genomic landscape of species divergence in Phaseolus beans coerce parallel signatures of adaptation and domestication? Front. Plant Sci. 2018, 9, 1816. [Google Scholar] [CrossRef]
- Baird, N.A.; Etter, P.D.; Atwood, T.S.; Currey, M.C.; Shiver, A.L.; Lewis, Z.A.; Selker, E.U.; Cresko, W.A.; Johnson, E.A. Rapid SNP discovery and genetic mapping using sequenced RAD markers. PLoS ONE 2008, 3, e3376. [Google Scholar]
- Elshire, R.J.; Glaubitz, J.C.; Sun, Q.; Poland, J.A.; Kawamoto, K.; Buckler, E.S.; Mitchell, S.E. A robust, simple genotyping-by-sequencing (GBS) approach for high diversity species. PLoS ONE 2011, 6, e19379. [Google Scholar]
- Sonah, H.; Bastien, M.; Iquira, E.; Tardivel, A.; Légaré, G.; Boyle, B.; Normandeau, É.; Laroche, J.; Larose, S.; Jean, M.; et al. An improved genotyping by sequencing (GBS) approach offering increased versatility and efficiency of SNP discovery and genotyping. PLoS ONE 2013, 8, e54603. [Google Scholar] [CrossRef] [PubMed]
- Etter, P.D.; Preston, J.L.; Bassham, S.; Cresko, W.A.; Johnson, E.A. Local de novo assembly of RAD paired-end contigs using short sequencing reads. PLoS ONE 2011, 6, e18561. [Google Scholar] [CrossRef] [PubMed]
- Peterson, B.K.; Weber, J.N.; Kay, E.H.; Fisher, H.S.; Hoekstra, H.E. Double digest RADseq: An inexpensive method for de novo SNP discovery and genotyping in model and non-model species. PLoS ONE 2012, 7, e37135. [Google Scholar] [CrossRef] [PubMed]
- Poland, J.A.; Brown, P.J.; Sorrells, M.E.; Jannink, J.L. Development of high-density genetic maps for barley and wheat using a novel two-enzyme genotyping-by-sequencing approach. PLoS ONE 2012, 7, e32253. [Google Scholar]
- Ariani, A.; Berny Mier y Teran, J.C.; Gepts, P. Genome-wide identification of SNPs and copy number variation in common bean (Phaseolus vulgaris L.) using genotyping-by-sequencing (GBS). Mol. Breed. 2016, 36, 87. [Google Scholar] [CrossRef]
- Schröder, S.; Mamidi, S.; Lee, R.; McKain, M.R.; McClean, P.E.; Osorno, J.M. Optimization of genotyping by sequencing (GBS) data in common bean (Phaseolus vulgaris L.). Mol. Breed. 2016, 36, 6. [Google Scholar]
- Campa, A.; Murube, E.; Ferreira, J.J. Genetic diversity, population structure, and linkage disequilibrium in a Spanish common bean diversity panel revealed through genotyping-by-sequencing. Genes 2018, 9, E518. [Google Scholar] [PubMed]
- Laemmli, U.K. Cleavage of structure proteins during assembly of the head of Bacteriophage T4. Nature 1970, 227, 680–685. [Google Scholar] [CrossRef]
- Li, H.; Durbin, R. Fast and accurate long-read alignment with Burrows-Wheeler transform. Bioinformatics 2010, 26, 589–595. [Google Scholar] [CrossRef] [PubMed]
- Catchen, J.; Amores, A.; Hohenlohe, P.; Cresko, W.; Postlethwait, J. Stacks: Building and genotyping loci de novo from short-read sequences. G3 Genes Genomes Genet. 2011, 1, 171–182. [Google Scholar]
- Bradbury, P.J.; Zhang, Z.; Kroon, D.E.; Casstevens, T.M.; Ramdoss, Y.; Buckler, E.S. TASSEL: Software for association mapping of complex traits in diverse samples. Bioinformatics 2007, 23, 2633–2635. [Google Scholar] [CrossRef] [PubMed]
- Berny Mier y Teran, J.C.B.; Konzen, E.R.V.; Palkovic, M.A.; Ariani, A.; Tsai, S.M.; Gilbert, M.E.; Gepts, P. Root and shoot variation in relation to potential intermittent drought adaptation of Mesoamerican wild common bean (Phaseolus vulgaris L.). Ann. Bot. 2018, 20, 1–16. [Google Scholar] [CrossRef] [PubMed]
- Pritchard, J.K.; Stephens, M.; Donnelly, P. Inference of population structure using multilocus genotype data. Genetics 2000, 155, 945–959. [Google Scholar] [PubMed]
- Evanno, G.; Regnaut, S.; Goudet, J. Detecting the number of clusters of individuals using the software STRUCTURE: A simulation study. Mol. Ecol. 2005, 14, 2611–2620. [Google Scholar] [CrossRef] [PubMed]
- Earl, D.A.; Vonholdt, B.M. Structure Harvester: A website and program for visualizing Structure output and implementing the Evanno method. Conserv. Genet. Resour. 2012, 4, 359–361. [Google Scholar] [CrossRef]
- Tamura, K.; Nei, M. Estimation of the number of nucleotide substitutions in the control region of mitochondrial-DNA in humans and chimpanzees. Mol. Biol. Evol. 1993, 10, 512–526. [Google Scholar] [PubMed]
- Kumar, S.; Stecher, G.; Tamura, K. MEGA7: molecular evolutionary genetics analysis version 7.0 for bigger datasets. Mol. Biol. Evol. 2016, 33, 1870–1874. [Google Scholar] [CrossRef] [PubMed]
- Weir, B.S.; Cockerham, C.C. Estimating F-statistics for the analysis of population structure. Evolution 1984, 38, 1358–1370. [Google Scholar]
- Raggi, L.; Tiranti, B.; Negri, V. Italian common bean landraces: Diversity and population structure. Genet. Resour. Crop Evol. 2013, 60, 1515–1530. [Google Scholar] [CrossRef]
- Waples, R.S.; Gaggiotti, O. What is a population? An empirical evaluation of some genetic methods for identifying the number of gene pools and their degree of connectivity. Mol. Ecol. 2006, 15, 1419–1439. [Google Scholar] [CrossRef] [PubMed]
- Tilman, D. Causes, consequences and ethics of biodiversity. Nature 2000, 405, 208–211. [Google Scholar] [CrossRef] [PubMed]
- Zimmerer, K.S. Conserving agrobiodiversity amid global change, migration, and nontraditional livelihood networks: The dynamic uses of cultural landscape knowledge. Ecol. Soc. 2014, 19, 1. [Google Scholar] [CrossRef]
- Blair, M.W.; Cortés, A.J.; This, D. Identification of an ERECTA gene and its drought adaptation associations with wild and cultivated common bean. Plant Sci. 2016, 242, 250–259. [Google Scholar] [CrossRef] [PubMed]
- Cortés, A.J.; Chavarro, M.C.; Madriñán, S.; This, D.; Blair, M.W. Molecular ecology and selection in the drought-related Asr gene polymorphisms in wild and cultivated common bean (Phaseolus vulgaris L.). BMC Genet. 2012, 13, 58. [Google Scholar] [CrossRef] [PubMed]
- Cortés, A.J.; This, D.; Chavarro, C.; Madriñán, S.; Blair, M.W. Nucleotide diversity patterns at the drought-related Dreb2 encoding genes in wild and cultivated common bean (Phaseolus vulgaris L.). Theor. Appl. Genet. 2012, 125, 1069–1085. [Google Scholar] [CrossRef]
- Logozzo, G.; Donnoli, R.; Macaluso, L.; Papa, R.; Knüpffer, H.; Spagnoletti Zeuli, P. Analysis of the contribution of Mesoamerican and Andean gene pools to European common bean (Phaseolus vulgaris L.) germplasm and strategies to establish a core collection. Genet. Resour. Crop Evol. 2007, 54, 1763–1779. [Google Scholar] [CrossRef]
- Blair, M.W.; Cortés, A.J.; Farmer, A.D.; Huang, W.; Ambachew, D.; Penmetsa, R.V.; Carrasquilla-Garcia, N.; Assefa, T.; Cannon, S.B. Uneven recombination rate and linkage disequilibrium across a reference SNP map for common bean (Phaseolus vulgaris L.). PLoS ONE 2018, 13, e0189597. [Google Scholar] [CrossRef]
- Singh, S.P.; Gepts, P.; Debouck, D.G. Races of common bean (Phaseolus vulgaris; Fabaceae). Econ. Bot. 1991, 45, 379–396. [Google Scholar] [CrossRef]
- Schmutz, J.; McClean, P.E.; Mamidi, S.; Wu, G.A.; Cannon, S.B.; Grimwood, J.; Jenkins, J.; Shu, S.; Song, Q.; Chavarro, C.; et al. A reference genome for common bean and genome-wide analysis of dual domestications. Nat. Genet. 2014, 46, 707–713. [Google Scholar] [CrossRef] [PubMed]
- Mercati, F.; Leone, M.; Lupini, A.; Sorgonà, A.; Bacchi, M.; Abenavoli, M.R.; Sunseri, F. Genetic diversity and population structure of a common bean (Phaseolus vulgaris L.) collection from Calabria (Italy). Genet. Resour. Crop. Evol. 2012, 60, 839–852. [Google Scholar] [CrossRef]
- Wallace, L.; Arkwazee, H.; Vining, K.; Myers, J.R. Genetic diversity within snap beans and their relation to dry beans. Genes 2018, 9, 587. [Google Scholar] [CrossRef] [PubMed]
- Lu, F.; Lipka, A.E.; Glaubitz, J.; Elshire, R.; Cherney, J.H.; Casler, M.D.; Buckler, E.S.; Costich, D.E. Switchgrass genomic diversity, ploidy, and evolution: Novel insights from a network-based SNP discovery protocol. PLoS Genet. 2013, 9, e1003215. [Google Scholar] [CrossRef] [PubMed]
- Alipour, H.; Bihamta, M.R.; Mohammadi, V.; Peyghambari, S.A.; Bai, G.; Zhang, G. Genotyping-by-Sequencing (GBS) revealed molecular genetic diversity of Iranian wheat landraces and cultivars. Front. Plant Sci. 2017, 8, 1293. [Google Scholar] [CrossRef] [PubMed]
- Pavan, S.; Lotti, C.; Marcotrigiano, A.R.; Mazzeo, R.; Bardaro, N.; Bracuto, V.; Ricciardi, F.; Taranto, F.; D’Agostino, N.; Schiavulli, A.; et al. A distinct genetic cluster in cultivated chickpea as revealed by genome-wide marker discovery and genotyping genome-wide marker discovery and genotyping. Plant Genome 2017, 10. [Google Scholar] [CrossRef] [PubMed]
- Pavan, S.; Curci, P.L.; Zuluaga, D.L.; Blanco, E.; Sonnante, G. Genotyping-by-sequencing highlights patterns of genetic structure and domestication in artichoke and cardoon. PLoS ONE 2018, 13, e0205988. [Google Scholar]
© 2019 by the authors. Licensee MDPI, Basel, Switzerland. This article is an open access article distributed under the terms and conditions of the Creative Commons Attribution (CC BY) license (http://creativecommons.org/licenses/by/4.0/).