Plant Part Age and Size Affect Sessile Macrobenthic Assemblages Associated with a Foliose Red Algae Phycodrys rubens in the White Sea


Abstract
1. Introduction
2. Materials and Methods
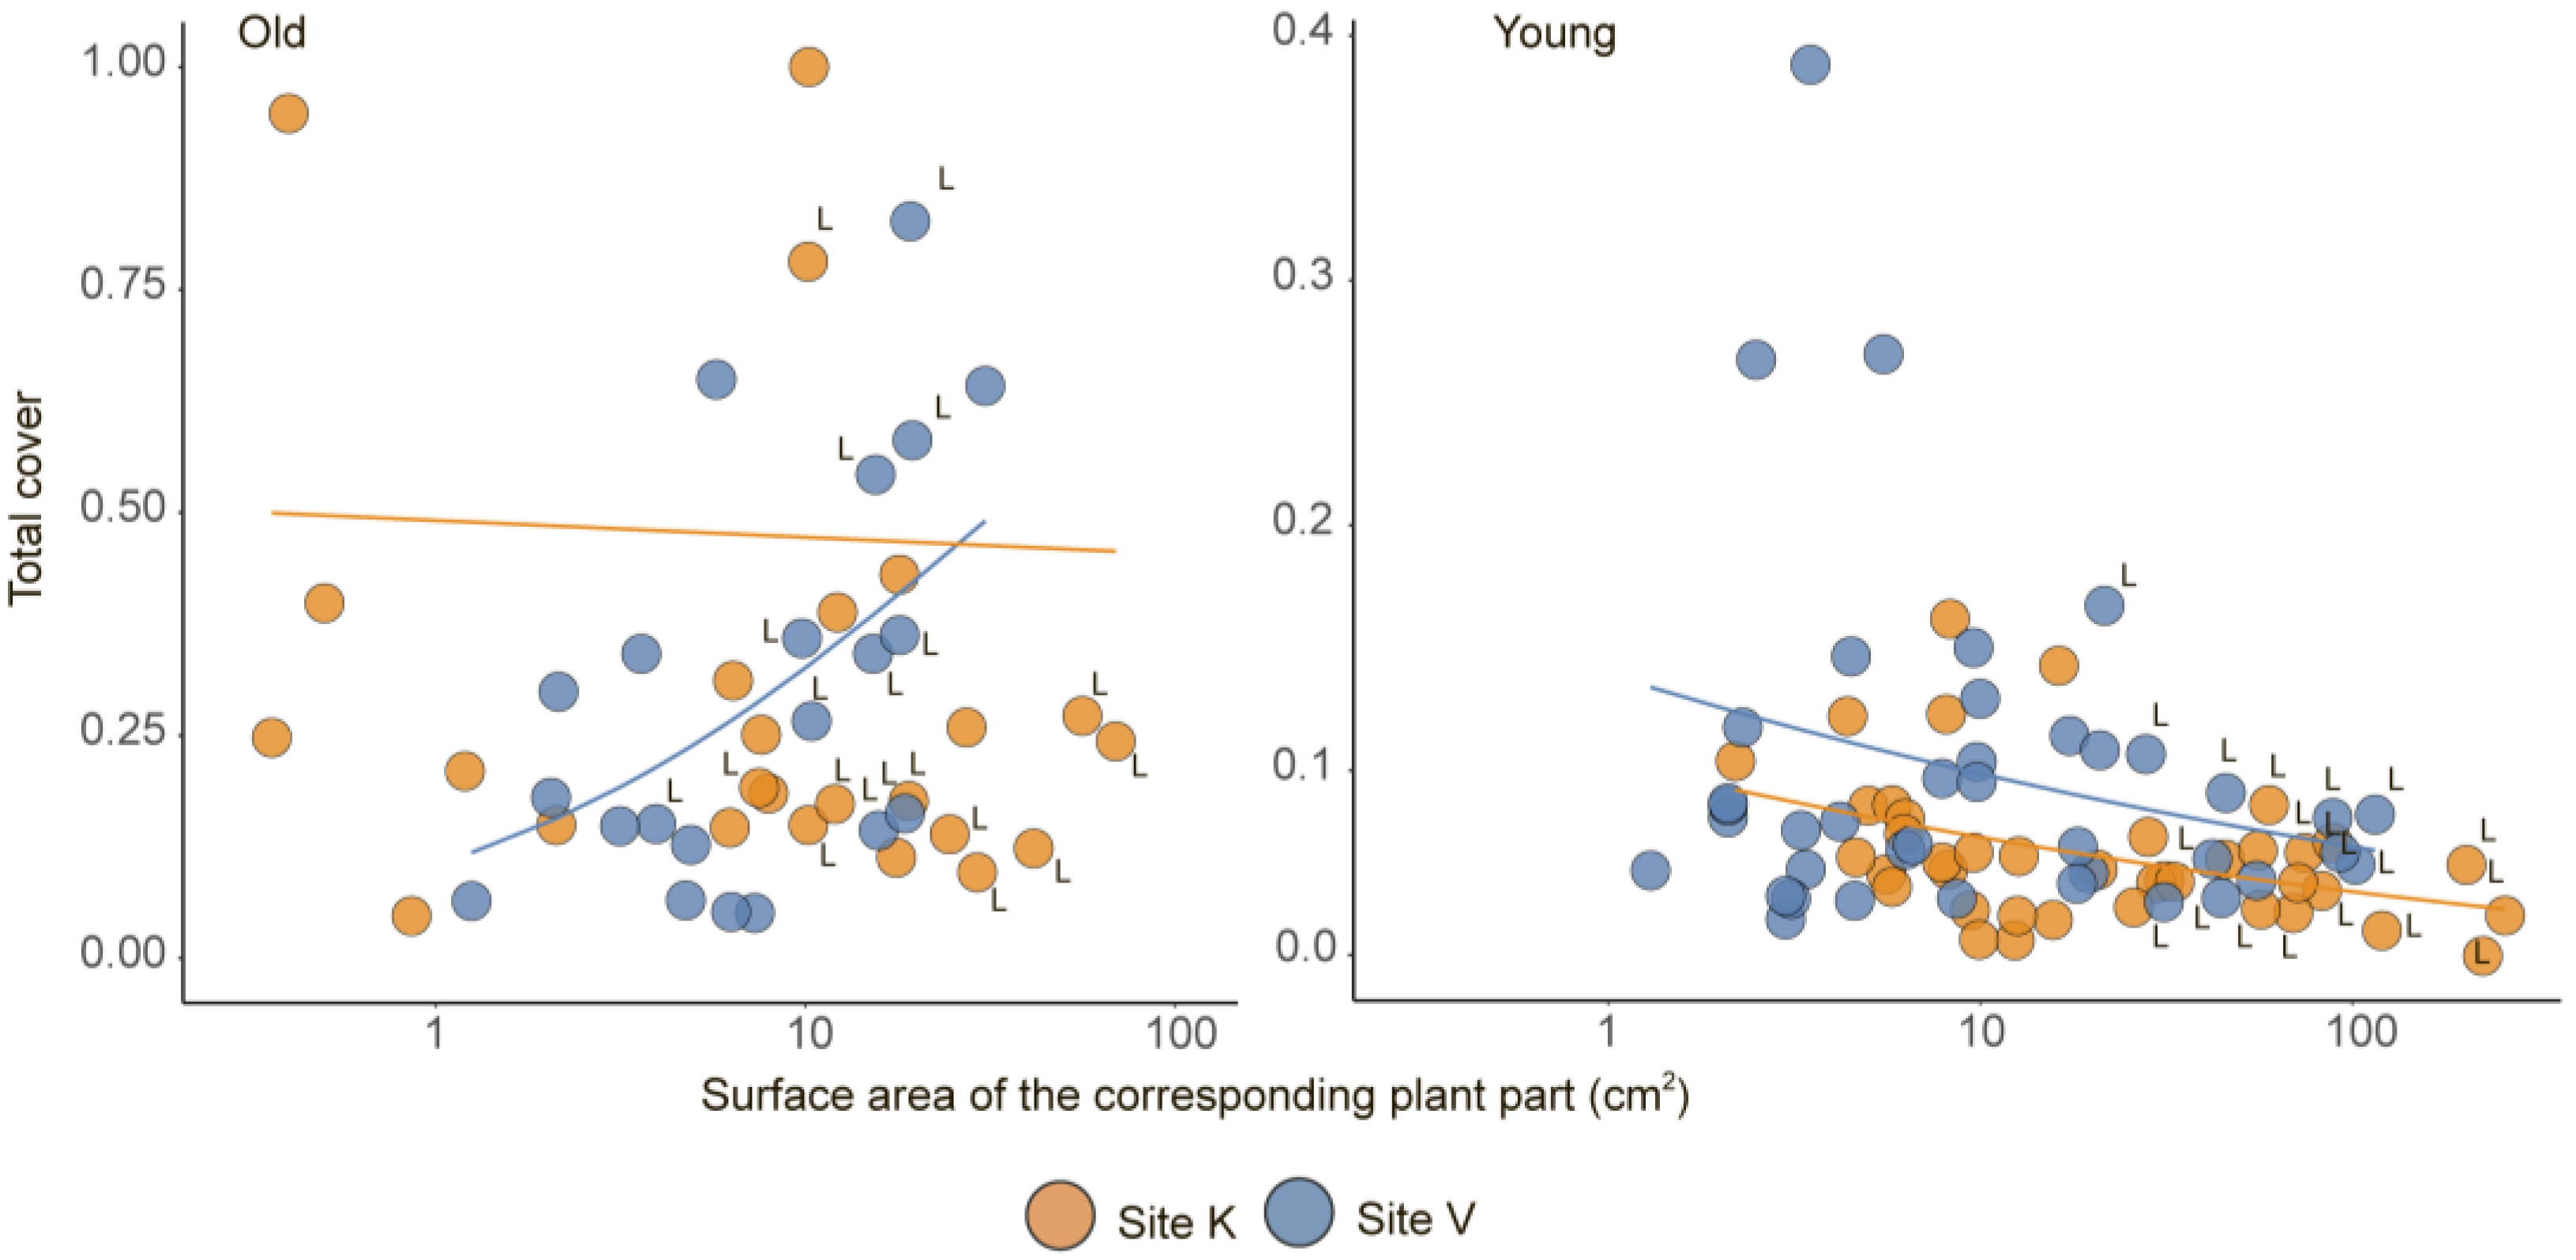
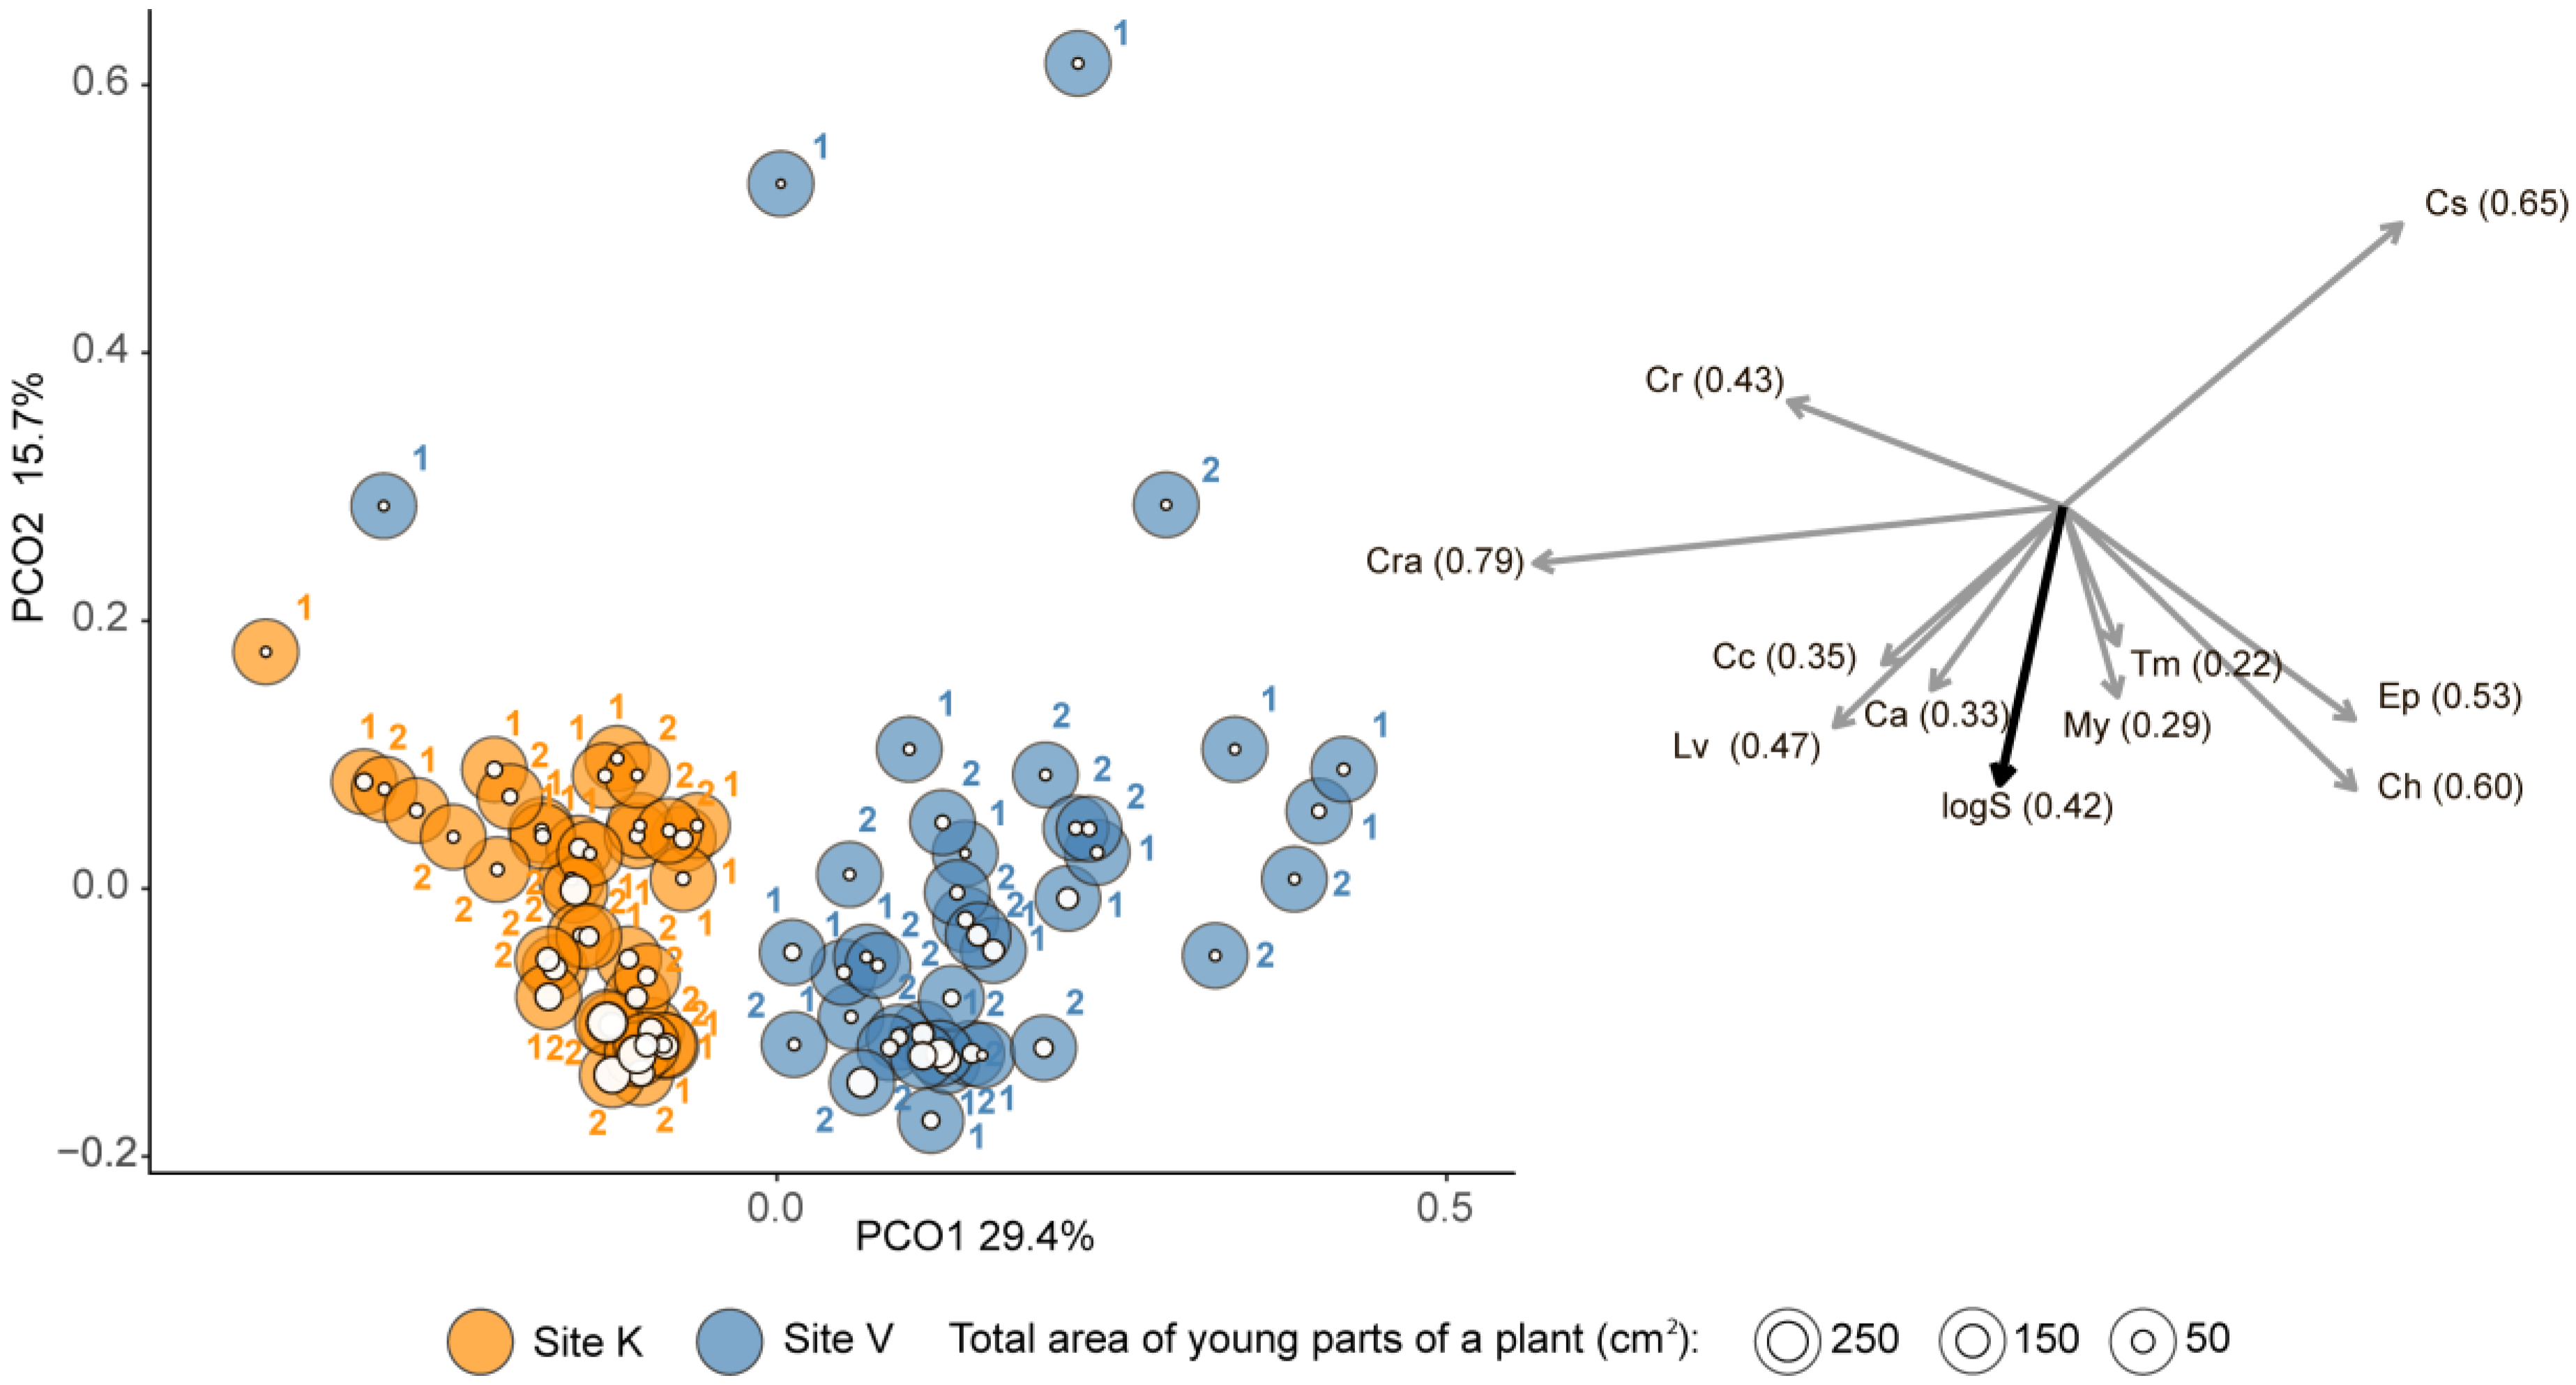
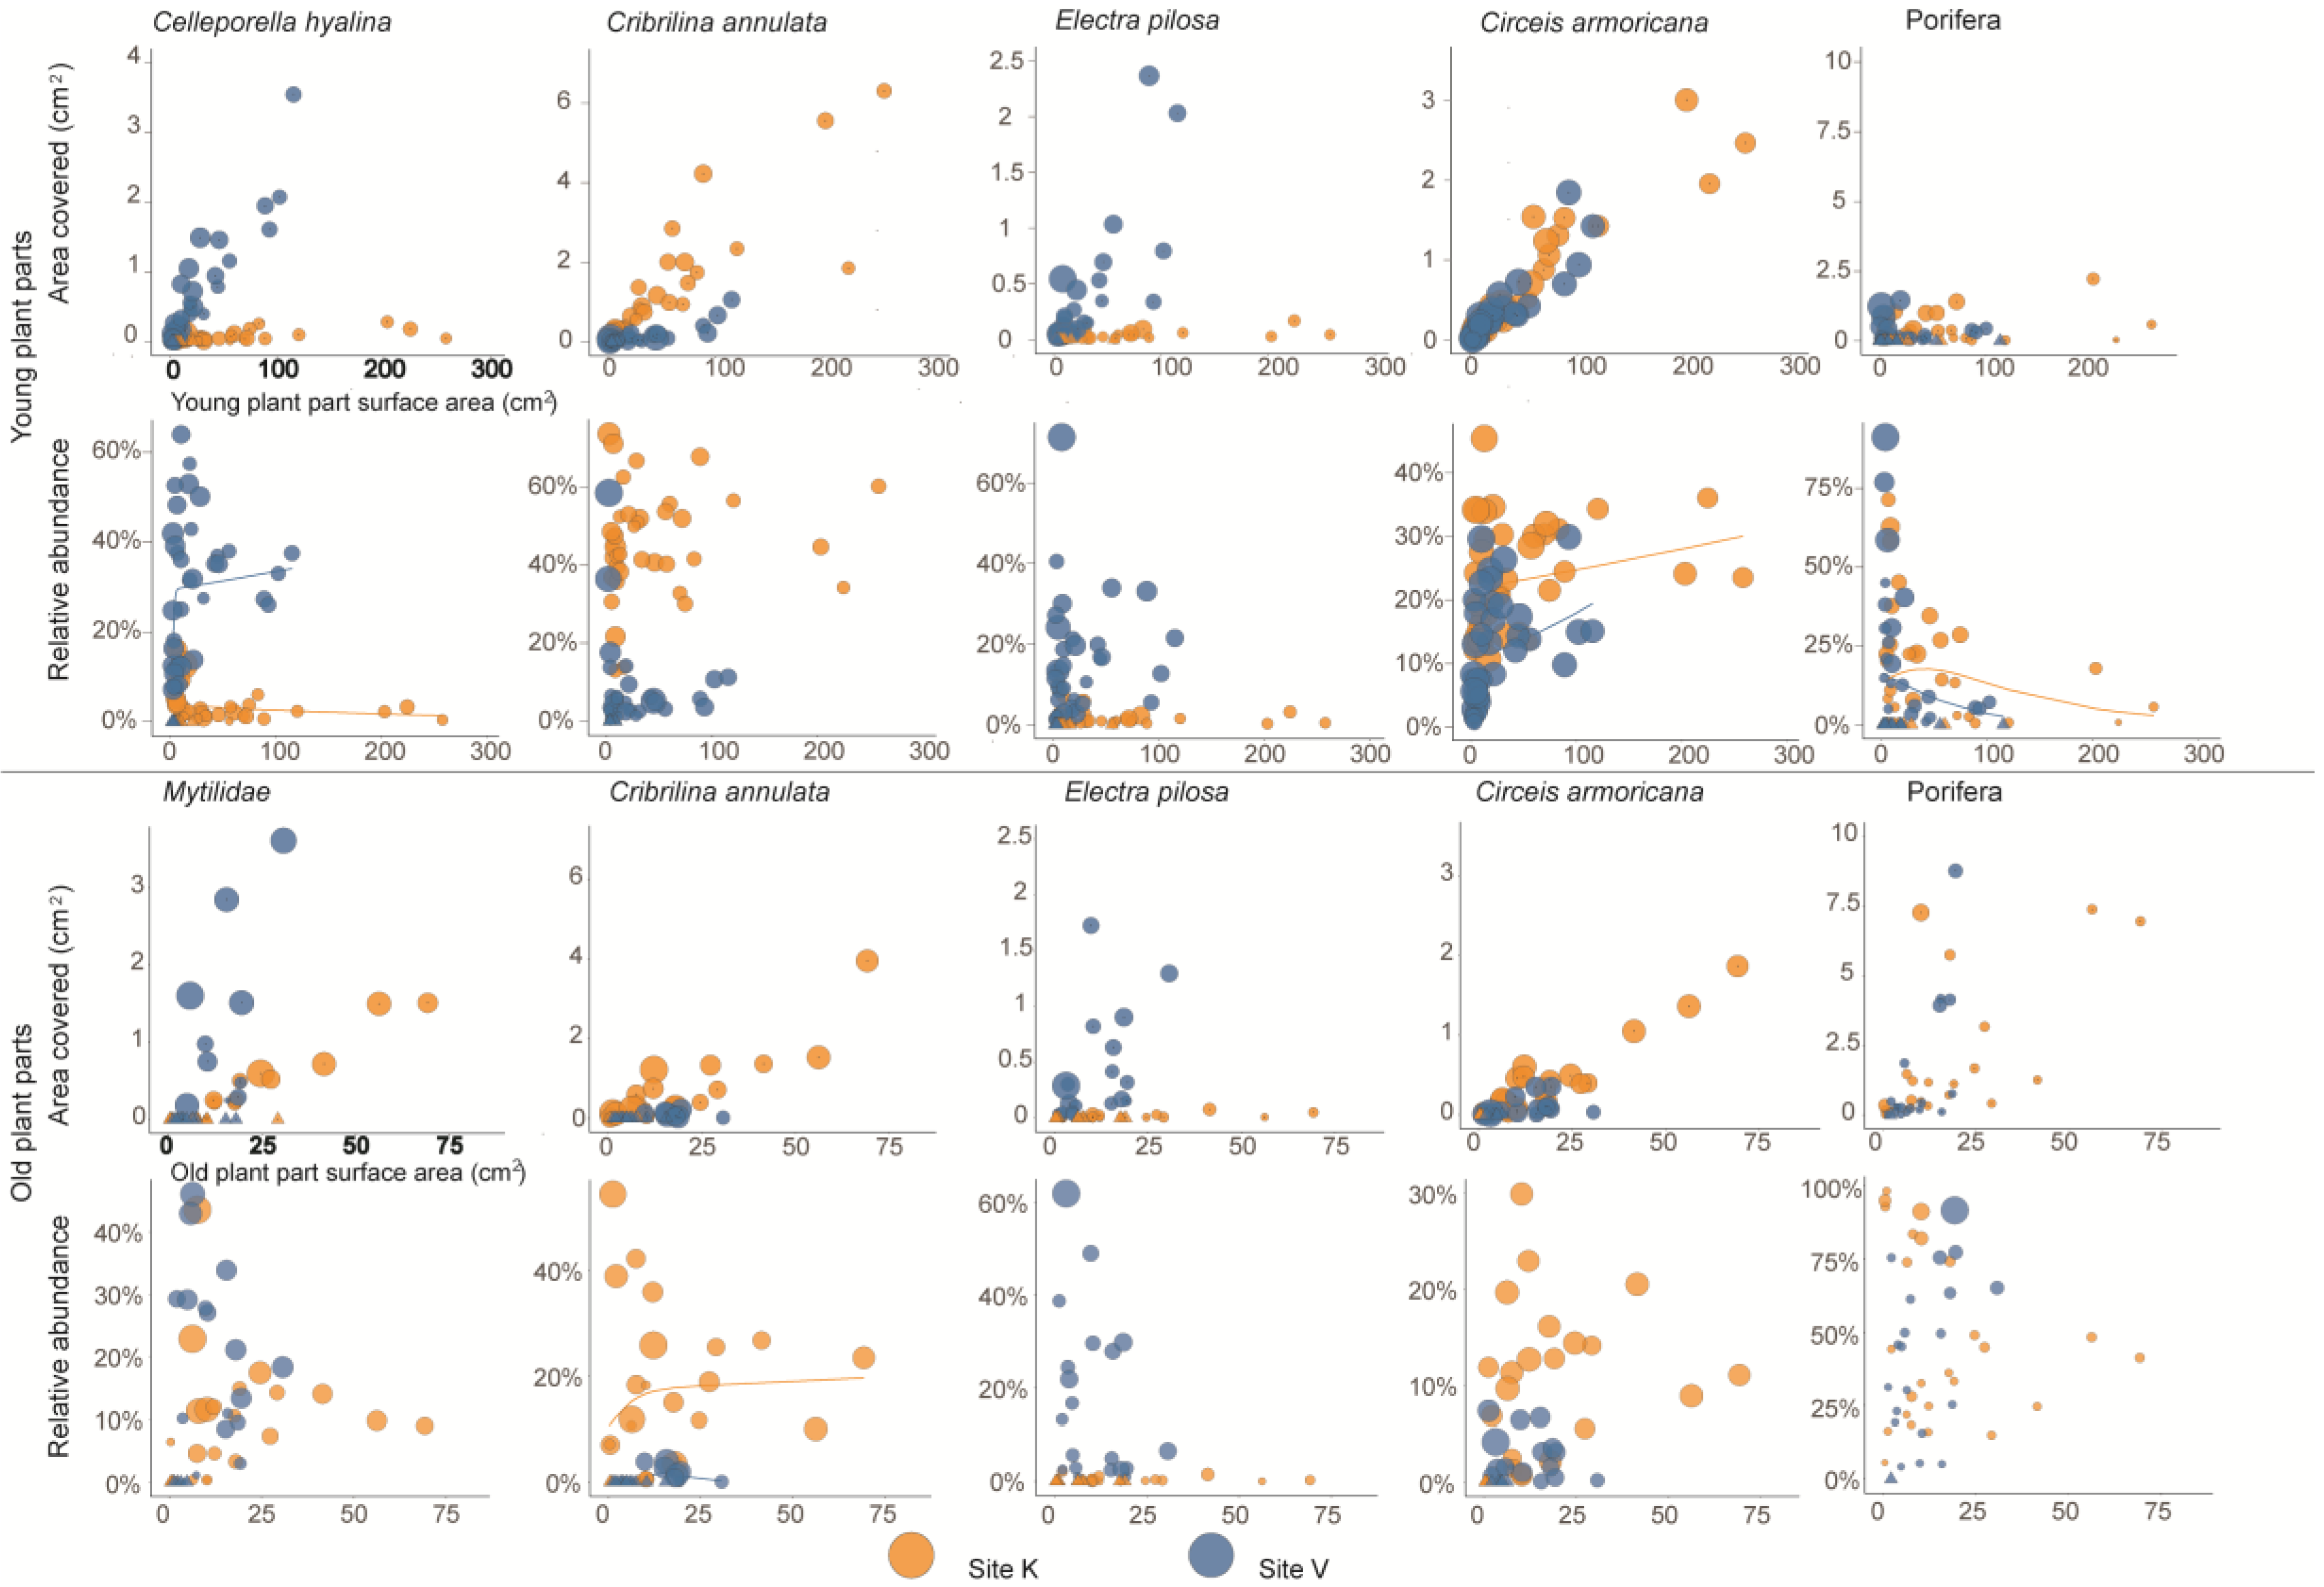
3. Results
4. Discussion
Supplementary Materials
Author Contributions
Funding
Acknowledgments
Conflicts of Interest
References
- Stachowicz, J.J. Mutualism, facilitation, and the structure of ecological communities: Positive interactions play a critical, but underappreciated, role in ecological communities by reducing physical or biotic stresses in existing habitats and by creating new habitats on which many species depend. AIBS Bull. 2001, 51, 235–246. [Google Scholar]
- Bruno, J.F.; Stachowicz, J.J.; Bertness, M.D. Inclusion of facilitation into ecological theory. Trends Ecol. Evol. 2003, 18, 119–125. [Google Scholar] [CrossRef]
- Dayton, P.K. Toward an understanding of community resilience and the potential effects of enrichments to the benthos at McMurdo Sound, Antarctica. In Proceedings of the Colloquium on Conservation Problems in Antarctica; Dayton, P., Parker, B.C., Eds.; Allen Press: Lawrence, KS, USA, 1972; pp. 81–96. [Google Scholar]
- Dayton, P.K. Competition, disturbance, and community organization: The provision and subsequent utilization of space in a rocky intertidal community. Ecol. Monogr. 1971, 41, 351–389. [Google Scholar] [CrossRef]
- Jones, C.G.; Lawton, J.H.; Shachak, M. Organisms as ecosystem engineers. Oikos 1994, 69, 373–386. [Google Scholar] [CrossRef]
- Thornber, C.S.; Jones, E.; Thomsen, M.S. Epibiont-marine macrophyte assemblages. In Marine Macrophytes As Foundation Species; Olafsson, E., Ed.; CRC Press: Boca Raton, FL, USA, 2016; pp. 43–65. [Google Scholar]
- Seed, R.; O’Connor, R.J. Community organization in marine algal epifaunas. Annu. Rev. Ecol. Syst. 1981, 12, 49–74. [Google Scholar] [CrossRef]
- Maximilien, R.; de Nys, R.; Holmström, C.; Gram, L.; Givskov, M.; Crass, K.; Kjelleberg, S.; Steinberg, P.D. Chemical mediation of bacterial surface colonisation by secondary metabolites from the red alga Delisea pulchra. Aquat. Microb. Ecol. 1998, 15, 233–246. [Google Scholar] [CrossRef]
- Nylund, G.M.; Pavia, H. Chemical versus mechanical inhibition of fouling in the red alga Dilsea carnosa. Mar. Ecol. Prog. Ser. 2005, 299, 111–121. [Google Scholar] [CrossRef]
- Paul, N.A.; de Nys, R.; Steinberg, P.D. Chemical defence against bacteria in the red alga Asparagopsis armata: Linking structure with function. Mar. Ecol. Prog. Ser. 2006, 306, 87–101. [Google Scholar] [CrossRef]
- Amado-Filho, G.M.; Maneveldt, G.; Pereira-Filho, G.H.; Manso, R.C.C.; Bahia, R. Seaweed diversity associated with a Brazilian tropical rhodolith bed. Cienc. Mar. 2010, 36, 371–391. [Google Scholar] [CrossRef]
- Peña, V.; Bárbara, I. Maërl community in the north-western Iberian Peninsula: A review of floristic studies and long-term changes. Aquat. Conserv. Mar. Freshw. Ecosyst. 2008, 18, 339–366. [Google Scholar] [CrossRef]
- Grishankov, A.V. Preliminary observation on the structure of macroepifaunal communities associated with the surface of Phycodrys rubens (Rhodophyta) from the White Sea. Vestnik Leningradskogo Universiteta 2000, 2, 101–104. [Google Scholar]
- D’Antonio, C. Epiphytes on the rocky intertidal red alga Rhodomela larix (Turner) C. Agardh: Negative effects on the host and food for herbivores? J. Exp. Mar. Biol. Ecol. 1985, 86, 197–218. [Google Scholar] [CrossRef]
- Olafsson, E. Marine Macrophytes as Foundation Species; CRC Press: Boca Raton, FL, USA, 2016; pp. 43–65. [Google Scholar]
- Searles, R.B. The strategy of the red algal life history. Am. Nat. 1980, 115, 113–120. [Google Scholar] [CrossRef]
- Markager, S.; Sand-Jensen, K. Light requirements and depth zonation of marine macroalgae. Mar. Ecol.-Prog. Ser. 1992, 88, 83. [Google Scholar] [CrossRef]
- Wiencke, C.; Clayton, M.N.; Gómez, I.; Iken, K.; Lüder, U.H.; Amsler, C.D.; Karsten, U.; Hanelt, D.; Bischof, K.; Dunton, K. Life strategy, ecophysiology and ecology of seaweeds in polar waters. Rev. Environ. Sci. Biotechnol. 2006, 6, 95–126. [Google Scholar] [CrossRef]
- Schemske, D.W.; Mittelbach, G.G.; Cornell, H.V.; Sobel, J.M.; Roy, K. Is there a latitudinal gradient in the importance of biotic interactions? Annu. Rev. Ecol. Evol. Syst. 2009, 40, 245–269. [Google Scholar] [CrossRef]
- Freestone, A.L.; Osman, R.W.; Ruiz, G.M.; Torchin, M.E. Stronger predation in the tropics shapes species richness patterns in marine communities. Ecology 2011, 92, 983–993. [Google Scholar] [CrossRef]
- Parker, J.D.; Duffy, J.E.; Orth, R.J. Plant species diversity and composition: Experimental effects on marine epifaunal assemblages. Mar. Ecol. Prog. Ser. 2001, 224, 55–67. [Google Scholar] [CrossRef]
- Schneider, F.I.; Mann, K.H. Species specific relationships of invertebrates to vegetation in a seagrass bed. I. Correlational studies. J. Exp. Mar. Biol. Ecol. 1991, 145, 101–117. [Google Scholar] [CrossRef]
- Lee, P.Y.; Rotenberry, J.T. Relationships between bird species and tree species assemblages in forested habitats of eastern North America. J. Biogeogr. 2005, 32, 1139–1150. [Google Scholar] [CrossRef]
- Lambais, M.R.; Crowley, D.E. Bacterial diversity in tree canopies of the Atlantic forest. In Encyclopedia of Metagenomics; Nelson, K.E., Ed.; Springer: New York, NY, USA, 2015; pp. 49–54. [Google Scholar]
- Yakovis, E.L.; Artemieva, A.V.; Shunatova, N.N.; Varfolomeeva, M.A. Multiple foundation species shape benthic habitat islands. Oecologia 2008, 155, 785–795. [Google Scholar] [CrossRef]
- Morrow, K.M.; Moss, A.G.; Chadwick, N.E.; Liles, M.R. Bacterial associates of two Caribbean coral species reveal species-specific distribution and geographic variability. Appl. Environ. Microbiol. 2012, 78, 6438–6449. [Google Scholar] [CrossRef]
- Whitham, T.G.; DiFazio, S.P.; Schweitzer, J.A.; Shuster, S.M.; Allan, G.J.; Bailey, J.K.; Woolbright, S.A. Extending genomics to natural communities and ecosystems. Science 2008, 320, 492–495. [Google Scholar] [CrossRef]
- Pruitt, J.N.; Modlmeier, A.P. Animal personality in a foundation species drives community divergence and collapse in the wild. J. Anim. Ecol. 2015, 84, 1461–1468. [Google Scholar] [CrossRef]
- Campos, R.I.; Vasconcelos, H.L.; Ribeiro, S.P.; Neves, F.S.; Soares, J.P. Relationship between tree size and insect assemblages associated with Anadenanthera macrocarpa. Ecography 2006, 29, 442–450. [Google Scholar] [CrossRef]
- Carlsen, B.P.; Johnsen, G.; Berge, J.; Kuklinski, P. Biodiversity patterns of macro-epifauna on different lamina parts of Laminaria digitata and Saccharina latissima collected during spring and summer 2004 in Kongsfjorden, Svalbard. Polar Biol. 2007, 30, 939–943. [Google Scholar] [CrossRef]
- Taylor, A.; Burns, K. Epiphyte community development throughout tree ontogeny: An island ontogeny framework. J. Veg. Sci. 2015, 26, 902–910. [Google Scholar] [CrossRef]
- Christie, H.; Jørgensen, N.M.; Norderhaug, K.M.; Waage-Nielsen, E. Species distribution and habitat exploitation of fauna associated with kelp (Laminaria hyperborea) along the Norwegian coast. J. Mar. Biol. Assoc. UK 2003, 83, 687–699. [Google Scholar] [CrossRef]
- Lund, S. The marine algae of East Greenland I. Taxonomic part. Meddr. Gronland 1959, 156, 1–247. [Google Scholar]
- Kain, J.M. The reproductive phenology of nine species of Rhodophyta in the subtidal region of the Isle of Man. Br. Phycol. J. 1982, 17, 321–331. [Google Scholar] [CrossRef]
- Kain, J.M. Plant size and reproductive phenology of six species of Rhodophyta in subtidal Isle of Man. Br. Phycol. J. 1986, 21, 129–138. [Google Scholar] [CrossRef]
- Voskoboinikov, G.M.; Breeman, A.M.; Van den Hoek, C.; Makarov, V.N.; Schoschina, E.V. Influence of temperature and photoperiod on survival and growth of North East Atlantic isolates of Phycodrys rubens (Rhodophyta) from different latitudes. Bot. Mar. 1996, 39, 341–346. [Google Scholar] [CrossRef]
- Makarov, V.N.; Makarov, M.V.; Schoschina, E.V. Seasonal dynamics of growth in the Barents Sea seaweeds: Endogenous and exogenous regulation. Bot. Mar. 1999, 42, 43–49. [Google Scholar] [CrossRef]
- Schoschina, E.V. Seasonal and age dynamics of growth and reproduction of Phycodrys rubens (Rhodophyta) in the Barents and White Seas. Aquat. Bot. 1996, 55, 13–30. [Google Scholar] [CrossRef]
- Mileikovsky, S.A. Seasonal and daily dynamics in pelagic larvae of marine shelf bottom invertebrates in nearshore waters of Kandalaksha Bay (White Sea). Mar. Biol. 1970, 5, 180–194. [Google Scholar] [CrossRef]
- Tikhonenkov, D.V.; Mazei, Y.A.; Mylnikov, A.P. Species diversity of heterotrophic flagellates in White Sea littoral sites. Eur. J. Protistol. 2006, 42, 191–200. [Google Scholar] [CrossRef] [PubMed]
- Anderson, M.J. Permutation tests for univariate or multivariate analysis of variance and regression. Can. J. Fish. Aquat. Sci. 2001, 58, 626–639. [Google Scholar] [CrossRef]
- Buuren, S.V.; Fredriks, M. Worm plot: A simple diagnostic device for modeling growth reference curves. Stat. Med. 2001, 20, 1259–1277. [Google Scholar] [CrossRef] [PubMed]
- Stasinopoulos, D.M.; Rigby, R.A. Generalized additive models for location scale and shape (GAMLSS) in R. J. Stat. Softw. 2007, 23, 1–46. [Google Scholar] [CrossRef]
- R Core Team. R: A Language and Environment for Statistical Computing; R Foundation for Statistical Computing: Vienna, Austria, 2017; Available online: https://www.R-project.org/ (accessed on 13 April 2019).
- Shunatova, N.; Nikishina, D.; Ivanov, M.; Berge, J.; Renaud, P.E.; Ivanova, T.; Granovitch, A. The longer the better: The effect of substrate on sessile biota in Arctic kelp forests. Polar Biol. 2018, 41, 993–1011. [Google Scholar] [CrossRef]
- Fredriksen, S.; Christie, H.; Andre Sæthre, B. Species richness in macroalgae and macrofauna assemblages on Fucus serratus L. (Phaeophyceae) and Zostera marina L.(Angiospermae) in Skagerrak, Norway. Mar. Biol. Res. 2005, 1, 2–19. [Google Scholar] [CrossRef]
- Lippert, H.; Iken, K.; Rachor, E.; Wiencke, C. Macrofauna associated with macroalgae in the Kongsfjord (Spitsbergen). Polar Biol. 2001, 24, 512–522. [Google Scholar]
- Mikhaylova, T.A.; Aristov, D.A.; Naumov, A.D.; Malavenda, S.S.; Savchenko, O.N.; Bijagov, K.L. Diversity and structure of epibenthic communities of the red algae zone at the White Sea. Polar Biol. 2019. [Google Scholar] [CrossRef]
- Wahl, M. Marine epibiosis. I. Fouling and antifouling: Some basic aspects. Mar. Ecol. Prog. Ser. 1989, 58, 175–189. [Google Scholar] [CrossRef]
- Sousa, W.P. Disturbance and patch dynamics on rocky intertidal shores. In The Ecology of Natural Disturbance and Patch Dynamics; White, P.S., Pickett, S.T.A., Eds.; Academic Press: New York, NY, USA, 1985; pp. 101–124. [Google Scholar]
- Keough, M.J. Effects of patch size on the abundance of sessile marine invertebrates. Ecology 1984, 65, 423–437. [Google Scholar] [CrossRef]
- Kendall, M.A.; Bowman, R.S.; Williamson, P.; Lewis, J.R. Annual variation in the recruitment of Semibalanus balanoides on the North Yorkshire coast 1969–1981. J. Mar. Biol. Assoc. UK 1985, 65, 1009–1030. [Google Scholar] [CrossRef]
- Yakovis, E.L.; Artemieva, A.V.; Fokin, M.V.; Varfolomeeva, M.A.; Shunatova, N.N. Synchronous annual recruitment variation in barnacles and ascidians in the White Sea shallow subtidal 1999–2010. Hydrobiologia 2013, 706, 69–79. [Google Scholar] [CrossRef]
- Shunkina, K.V. Reconstruction of the Life Cycle of Cheilostome Bryozoan Cribrilina Annulata (Gymnolaemata) Living on the Laminaria (The White Sea, Chupa Inlet). Master’s Thesis, St. Petersburg State University, Department of Invertebrate Zoology, St. Petersburg, Russia, 2010. [Google Scholar]
- Marcus, E. Beobachtungen und Versuche an lebeden Meeresbryozoen. Zool. Jahrb. Abt. Syst. Ökol. Geogr. Tiere. 1926, 52, 1–102. [Google Scholar]
- Ereskovsky, A.V. Reproduction cycles and strategies of the cold-water sponges Halisarca dujardini (Demospongiae, Halisarcida), Myxilla incrustans and Iophon piceus (Demospongiae, Poecilosclerida) from the White Sea. Biol. Bull. 2000, 198, 77–87. [Google Scholar] [CrossRef]
- Petralia, R.S.; Mattson, M.P.; Yao, P.J. Aging and longevity in the simplest animals and the quest for immortality. Ageing Res. Rev. 2014, 16, 66–82. [Google Scholar] [CrossRef]
- Thorson, G. Studies on the egg capsules and development of Arctic marine prosobranchs. Medd. Groenl. 1935, 100, 1–71. [Google Scholar]
- Anwar, N.A.; Richardson, C.A.; Seed, R. Age determination, growth rate and population structure of the horse mussel Modiolus modiolus. J. Mar. Biol. Assoc. UK 1990, 70, 441–457. [Google Scholar] [CrossRef]
- Bayne, B.L. Marine Mussels: Their Ecology and Physiology; Cambridge University Press: Cambridge, UK, 1976; 506p. [Google Scholar]
- Dobretsov, S.; Wahl, M. Larval recruitment of the blue mussel Mytilus edulis: The effect of flow and algae. J. Exp. Mar. Biol. Ecol. 2008, 355, 137–144. [Google Scholar] [CrossRef]
- Eggleston, D. Patterns of reproduction in the marine Ectoprocta of the Isle of Man. J. Nat. Hist. 1972, 6, 31–38. [Google Scholar] [CrossRef]
- Bergan, P. On the anatomy and reproduction biology in Spirorbis (Daudin). Nytt. Mag. Zool. 1953, 1, 1–26. [Google Scholar]
- Eckman, J.E.; Duggins, D.O. Life and death beneath macrophyte canopies: Effects of understory kelps on growth rates and survival of marine, benthic suspension feeders. Oecologia 1991, 87, 473–487. [Google Scholar] [CrossRef]
- Leichter, J.J.; Witman, J.D. Water flow over subtidal rock walls: Relation to distributions and growth rates of sessile suspension feeders in the Gulf of Maine Water flow and growth rates. J. Exp. Mar. Biol. Ecol. 1997, 209, 293–307. [Google Scholar] [CrossRef]
- Mullineaux, L.S.; Butman, C.A. Recruitment of encrusting benthic invertebrates in boundary-layer flows: A deep-water experiment on Cross Seamount. Limnol. Oceanogr. 1990, 35, 409–423. [Google Scholar] [CrossRef]
- Eckman, J.E.; Duggins, D.O. Larval settlement in turbulent pipe flows. J. Mar. Res. 1998, 56, 1285–1312. [Google Scholar] [CrossRef]
- Young, C.M.; Chia, F.S. Microhabitat-associated variability in survival and growth of subtidal solitary ascidians during the first 21 days after settlement. Mar. Biol. 1984, 81, 61–68. [Google Scholar] [CrossRef]
- Boaden, P.J.S.; O’Connor, R.J.; Seed, R. The composition and zonation of a Fucus serratus community in Strangford Lough, Co. Down. J. Exp. Mar. Biol. Ecol. 1975, 17, 111–136. [Google Scholar] [CrossRef]
- Gutiérrez, J.L.; Palomo, M.G. Increased algal fouling on mussels with barnacle epibionts: A fouling cascade. J. Sea Res. 2016, 112, 49–54. [Google Scholar] [CrossRef]
- Stebbing, A.R.D. Preferential settlement of a bryozoan and serpulid larvae on the younger parts of Laminaria fronds. J. Mar. Biol. Assoc. UK 1972, 52, 765–772. [Google Scholar] [CrossRef]
- Ryland, J.S. Physiology and ecology of marine bryozoans. Adv. Mar. Biol. 1977, 14, 285–443. [Google Scholar]
- Seed, R. Observations on the ecology of Membranipora (Bryozoa) and a major predator Doridella steinbergae (Nudibranchiata) along the fronds of Laminaria saccharina at Friday Harbor, Washington. J. Exp. Mar. Biol. Ecol. 1976, 24, 1–17. [Google Scholar] [CrossRef]
- Durante, K.M.; Chia, F.S. Epiphytism on Agarum fimbriatum: Can herbivore preferences explain distributions of epiphytic bryozoans? Mar. Ecol. Prog. Ser. Oldendorf 1991, 77, 279–287. [Google Scholar] [CrossRef]
- Hamamoto, K.; Mukai, H. Effects of larval settlement and post-settlement mortality on the distribution pattern and abundance of the spirorbid tube worm Neodexiospira brasiliensis (Grube)(Polychaeta) living on seagrass leaves. Mar. Ecol. 1999, 20, 251–272. [Google Scholar] [CrossRef]
- Jackson, J.B.C.; Buss, L.E.O. Alleopathy and spatial competition among coral reef invertebrates. Proc. Natl. Acad. Sci. USA 1975, 72, 5160–5163. [Google Scholar] [CrossRef]
- Buss, L.W.; Jackson, J.B.C. Competitive networks: Nontransitive competitive relationships in cryptic coral reef environments. Am. Nat. 1979, 113, 223–234. [Google Scholar] [CrossRef]
- McCook, L.; Jompa, J.; Diaz-Pulido, G. Competition between corals and algae on coral reefs: A review of evidence and mechanisms. Coral Reefs 2001, 19, 400–417. [Google Scholar] [CrossRef]
- Russ, G.R. Overgrowth in a marine epifaumal community: Competitive hierarchies and competitive networks. Oecologia 1982, 53, 12–19. [Google Scholar] [CrossRef]
- Jackson, J.B.C.; Winston, J.E. Ecology of cryptic coral reef communities. I. Distribution and abundance of major groups of encrusting organisms. J. Exp. Mar. Biol. Ecol. 1982, 57, 135–147. [Google Scholar] [CrossRef]
- Carballo, J.L. Effect of natural sedimentation on the structure of tropical rocky sponge assemblages. Ecoscience 2006, 13, 119–130. [Google Scholar] [CrossRef]
- Rützler, K. Impact of crustose clionid sponges on Caribbean reef corals. Acta Geol. Hisp. 2002, 37, 61–72. [Google Scholar]
- Porter, J.W.; Targett, N.M. Allelochemical interactions between sponges and corals. Biol. Bull. 1988, 175, 230–239. [Google Scholar] [CrossRef]
- De Voogd, N.J.; Becking, L.E.; Hoeksema, B.W.; Noor, A.; van Soest, R.W. Sponge interactions with spatial competitors in the Spermonde Archipelago. Bollettino Musei degli Istituti Biologici Universita Genova 2003, 68, 253–261. [Google Scholar]
- Fricke, A.; Titlyanova, T.V.; Nugues, M.M.; Bischof, K. Depth-related variation in epiphytic communities growing on the brown alga Lobophora variegata in a Caribbean coral reef. Coral Reefs 2011, 30, 967–973. [Google Scholar] [CrossRef]
- Jennings, J.G.; Steinberg, P.D. Phlorotannins versus other factors affecting epiphyte abundance on the kelp Ecklonia radiata. Oecologia 1997, 109, 461–473. [Google Scholar] [CrossRef]
- Arrontes, J. Composition, distribution on host, and seasonality of epiphytes on three intertidal algae. Bot. Mar. 1990, 33, 205–212. [Google Scholar] [CrossRef]
- Bernstein, B.B.; Jung, N. Selective pressures and coevolution in a kelp canopy community in southern California. Ecol. Monogr. 1979, 49, 335–355. [Google Scholar] [CrossRef]
- O’Connor, R.J.; Boaden, P.J.S.; Seed, R. Niche breadth in Bryozoa as a test of competition theory. Nature 1975, 256, 307. [Google Scholar] [CrossRef]
- Ryland, J.S. Observations on some epibionts of gulf-weed, Sargassum natans (L.) Meyen. J. Exp. Mar. Biol. Ecol. 1974, 14, 17–25. [Google Scholar] [CrossRef]
- Boaden, P.J.S.; O’Connor, R.J.; Seed, R. The fauna of a Fucus serratus L. community: Ecological isolation in sponges and tunicates. J. Exp. Mar. Biol. Ecol. 1976, 21, 249–267. [Google Scholar] [CrossRef]
- Matias, M.G.; Underwood, A.J.; Hochuli, D.F.; Coleman, R.A. Independent effects of patch size and structural complexity on diversity of benthic macroinvertebrates. Ecology 2010, 91, 1908–1915. [Google Scholar] [CrossRef]
- Johansson, P.; Rydin, H.; Thor, G. Tree age relationships with epiphytic lichen diversity and lichen life history traits on ash in southern Sweden. Ecoscience 2007, 14, 81–91. [Google Scholar] [CrossRef]
- Underwood, A.J.; Chapman, M.G.; Connell, S.D. Observations in ecology: You can’t make progress on processes without understanding the patterns. J. Exp. Mar. Biol. Ecol. 2000, 250, 97–115. [Google Scholar] [CrossRef]


| Plant Age | Model | Source of Variation | Estimate | SE | t-Value | p |
|---|---|---|---|---|---|---|
| Plants having both old and young parts (with Plant ID as a random blocking factor nested in Site × Month; n = 51 plants) | Mean (Mu) | Intercept | −4.2818 | 0.2837 | −15.091 | <0.001 |
| Site [level ‘K’] | −1.0815 | 0.5188 | −2.085 | 0.040 | ||
| Age [level ‘Old’] | 2.5756 | 0.3670 | 7.018 | <0.001 | ||
| Month [level ‘September’]) | 1.9248 | 0.3053 | 6.305 | <0.001 | ||
| Site × Age | 1.1447 | 0.6280 | 1.823 | 0.072 | ||
| Site × Month | 0.9185 | 0.5436 | 1.690 | 0.095 | ||
| Age×Month | −1.3377 | 0.4900 | −2.730 | 0.008 | ||
| Site × Age × Month | 0.3832 | 0.7951 | 0.482 | 0.631 | ||
| Variance (Sigma) | Intercept | −2.0056 | 0.2469 | −8.121 | <0.001 | |
| Site [level ‘K’] | −0.1687 | 0.3894 | −0.433 | 0.666 | ||
| Age [level ‘Old’] | 1.1752 | 0.3558 | 3.303 | 0.001 | ||
| Month [level ‘September’] | −0.1365 | 0.3419 | -−0.399 | 0.691 | ||
| Site × Age | 0.3449 | 0.5409 | 0.638 | 0.525 | ||
| Site × Month | 0.3068 | 0.4999 | 0.614 | 0.541 | ||
| Age × Month | 0.7307 | 0.5178 | 1.411 | 0.162 | ||
| Site × Age × Month | 0.9098 | 0.7330 | 1.241 | 0.218 | ||
| Plants having only young parts (n = 39 plants) | Mean (Mu) | Intercept | −4.4794 | 0.2277 | −19.674 | <0.001 |
| Site [level ‘K’] | 0.5679 | 0.8158 | 0.696 | 0.492 | ||
| Month [level ‘September’] | 2.4466 | 0.2839 | 8.618 | <0.001 | ||
| Site × Month | −1.1746 | 0.8399 | −1.398 | 0.172 | ||
| Variance (Sigma) | Intercept | −3.3497 | 0.5212 | −6.427 | <0.001 | |
| Site [level ‘K’] | 1.8791 | 0.8005 | 2.347 | 0.025 | ||
| Month [level ‘September’] | 2.1793 | 0.5594 | 3.896 | <0.001 | ||
| Site × Month | −2.8802 | 0.8503 | −3.387 | 0.002 |
| Parameter | Month | Site K | Site V | ||
|---|---|---|---|---|---|
| Young | Old | Young | Old | ||
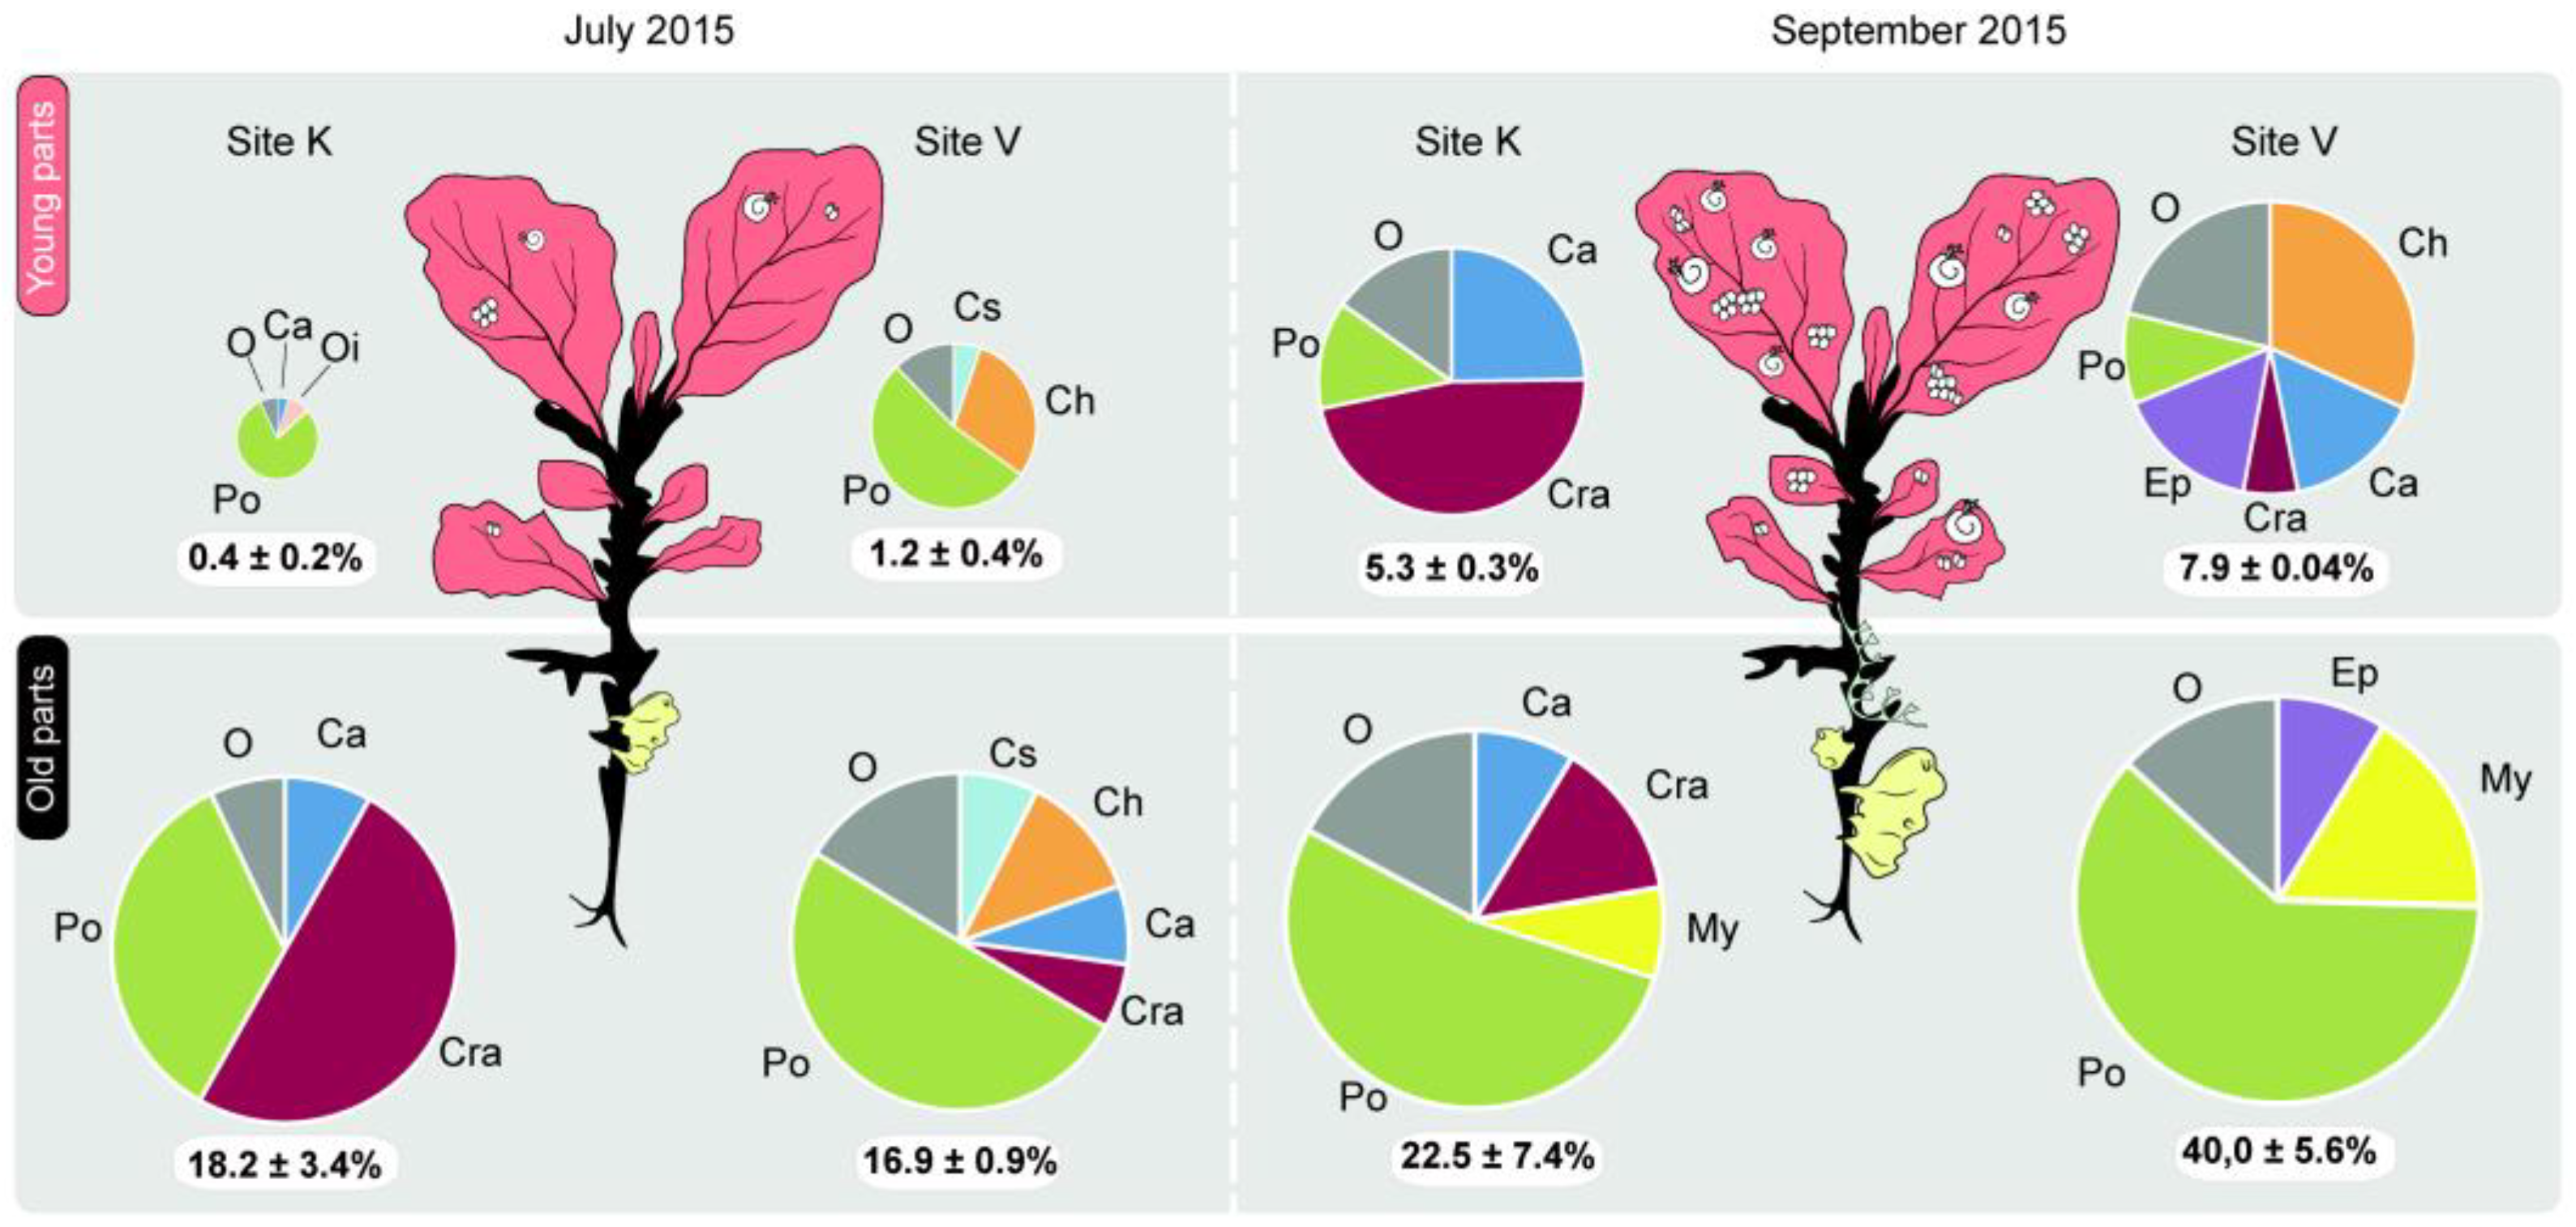
| Average total cover, % | July | 0.8 ± 0.4 | 16.2 ± 4.0 | 1.3 ± 0.4 | 15.4 ± 3.3 |
| September | 7.1 ± 0.6 | 35.9 ± 8.7 | 10.4 ± 1.4 | 23.8 ± 6.8 | |
| Total number of species (average number of species per plant) | July | 10 (3.9 ± 0.5) | 15 (4.8 ± 0.6) | 16 (6.7 ± 0.4) | 23 (7.1 ± 0.8) |
| September | 26 (9.8 ± 0.5) | 35 (11.3 ± 1.7) | 27 (8.5 ± 0.5) | 27 (8.8 ± 1.2) | |
| Total H’ (average H’ per plant) | July | 0.83 (0.67 ± 0.12) | 1.20 (0.73 ± 0.14) | 1.34 (0.86 ± 0.09) | 1.67 (1.16 ± 0.12) |
| September | 1.63 (1.33 ± 0.04) | 1.47 (1.08 ± 0.17) | 2.09 (1.36 ± 0.07) | 1.39 (1.29 ± 0.08) | |
| Plant Age | Source of Variation | df | SS | MS | Pseudo-F | p | Unique Permutations |
|---|---|---|---|---|---|---|---|
| Plants having both old and young parts | Site [f] | 1 | 27,411 | 27,411 | 18.56 | 0.0001 | 9941 |
| Month [f] | 1 | 31,635 | 31,635 | 21.42 | 0.0001 | 9945 | |
| Age [f] | 1 | 24,172 | 24,172 | 25.84 | 0.0001 | 9930 | |
| S×M [f] | 1 | 7183 | 7183 | 4.87 | 0.0001 | 9945 | |
| S×A [f] | 1 | 2921 | 2921 | 3.12 | 0.0076 | 9940 | |
| M×A [f] | 1 | 16,015 | 16,015 | 17.12 | 0.0001 | 9955 | |
| S × M × A [f] | 1 | 1416 | 1416 | 1.51 | 0.1850 | 9944 | |
| Plant ID (S×M) [r] | 47 | 69,389 | 1476 | 1.58 | 0.0002 | 9733 | |
| Error | 47 | 43,960 | 935 | ||||
| Plants having only young parts | Site [f] | 1 | 2779 | 2779 | 2.41 | 0.0361 | 9952 |
| Month [f] | 1 | 11,990 | 11,990 | 10.40 | 0.0001 | 9949 | |
| S×M [f] | 1 | 3906 | 3906 | 3.39 | 0.0055 | 9954 | |
| Error | 35 | 40,338 | 1153 |
| Mean Percent Cover, % | Individual Mean Area, mm2 | ||||||||||||||||
|---|---|---|---|---|---|---|---|---|---|---|---|---|---|---|---|---|---|
| Species | Site | Young parts | Old parts | P | N | Young parts | Old parts | P | N | ||||||||
| Circeis armoricana | K | 0.02 | ± | 0.01 | 1.01 | ± | 0.28 | 0.002 | 12 | 0.044 | ± | 0.005 | 0.534 | ± | 0.042 | 0.003 | 11 |
| V | 0.03 | ± | 0.01 | 1.06 | ± | 0.28 | 0.006 | 13 | 0.039 | ± | 0.001 | 0.512 | ± | 0.038 | 0.005 | 10 | |
| Cribrilina annulata | K | 0.00 | ± | 0.00 | 5.33 | ± | 2.17 | 0.004 | 12 | 0.127 | ± | 0.000 | 2.793 | ± | 0.420 | 0.018 | 7 |
| V | 0.01 | ± | 0.00 | 0.67 | ± | 0.52 | 0.508 | 13 | 0.140 | ± | 0.010 | 2.593 | ± | 0.313 | 0.068 | 4 | |
| Electra pilosa | K | 0.00 | ± | 0.00 | 0.00 | ± | 0.00 | n.v. | 12 | n.c. | 0 | ||||||
| V | 0.00 | ± | 0.00 | 0.17 | ± | 0.13 | 0.686 | 13 | n.c. | 0 | |||||||
| Celleporella hyalina | K | 0.00 | ± | 0.00 | 0.01 | ± | 0.01 | 0.686 | 12 | n.c. | 0 | ||||||
| V | 0.39 | ± | 0.07 | 1.83 | ± | 0.58 | 0.013 | 13 | 0.625 | ± | 0.055 | 2.133 | ± | 0.265 | 0.004 | 11 | |
| Porifera | K | 0.37 | ± | 0.35 | 8.72 | ± | 4.37 | 0.028 | 12 | 11.369 | ± | 8.069 | 20.981 | ± | 17.081 | n.v. | 2 |
| V | 0.61 | ± | 0.48 | 8.20 | ± | 3.27 | 0.017 | 13 | 41.056 | ± | 21.573 | 24.138 | ± | 7.306 | 0.465 | 4 | |
| Juvenile mytilids | K | 0.00 | ± | 0.00 | 0.28 | ± | 0.23 | 0.345 | 12 | 1.732 | 14.628 | n.v. | 1 | ||||
| V | 0.02 | ± | 0.01 | 0.68 | ± | 0.24 | 0.002 | 13 | 0.629 | ± | 0.118 | 1.086 | ± | 0.655 | 0.463 | 6 | |
| Circeis armoricana | K | 1.38 | ± | 0.09 | 1.79 | ± | 0.28 | 0.326 | 25 | 0.250 | ± | 0.014 | 0.578 | ± | 0.020 | 0.000 | 21 |
| V | 1.31 | ± | 0.14 | 0.55 | ± | 0.16 | 0.003 | 21 | 0.325 | ± | 0.011 | 0.451 | ± | 0.044 | 0.010 | 16 | |
| Cribrilina annulata | K | 2.78 | ± | 0.33 | 3.38 | ± | 0.62 | 0.300 | 25 | 1.005 | ± | 0.069 | 1.510 | ± | 0.152 | 0.002 | 22 |
| V | 0.38 | ± | 0.07 | 0.22 | ± | 0.09 | 0.099 | 21 | 1.229 | ± | 0.238 | 1.463 | ± | 0.196 | 0.208 | 8 | |
| Electra pilosa | K | 0.05 | ± | 0.02 | 0.06 | ± | 0.02 | 0.664 | 25 | 0.639 | ± | 0.173 | 0.722 | ± | 0.147 | 0.508 | 11 |
| V | 1.50 | ± | 0.33 | 3.61 | ± | 0.91 | 0.016 | 21 | 1.923 | ± | 0.287 | 2.755 | ± | 0.651 | 0.063 | 21 | |
| Celleporella hyalina | K | 0.17 | ± | 0.05 | 0.27 | ± | 0.07 | 0.092 | 25 | 0.697 | ± | 0.066 | 1.620 | ± | 0.289 | 0.015 | 17 |
| V | 2.92 | ± | 0.40 | 0.82 | ± | 0.14 | 0.000 | 21 | 1.408 | ± | 0.152 | 1.599 | ± | 0.144 | 0.287 | 17 | |
| Porifera | K | 1.34 | ± | 0.42 | 19.14 | ± | 5.68 | 0.000 | 25 | 8.216 | ± | 1.309 | 18.355 | ± | 6.490 | 0.147 | 19 |
| V | 0.72 | ± | 0.33 | 15.92 | ± | 4.33 | 0.000 | 21 | 8.683 | ± | 1.842 | 53.231 | ± | 36.658 | 0.279 | 13 | |
| Juvenile mytilids | K | 0.19 | ± | 0.11 | 2.23 | ± | 0.69 | 0.000 | 25 | 1.955 | ± | 0.548 | 7.417 | ± | 1.472 | 0.002 | 16 |
| V | 0.12 | ± | 0.05 | 5.43 | ± | 1.53 | 0.001 | 21 | 2.170 | ± | 0.873 | 5.808 | ± | 1.277 | 0.060 | 12 | |
| Age | Model | Source of Variation | Estimate | SE | t-Value | p |
|---|---|---|---|---|---|---|
| Young parts (n = 80) | Mean (Mu) | Intercept | −2.1837 | 0.1084 | −20.15 | <0.001 |
| Site [level ‘K’] | −0.3542 | 0.1330 | −2.66 | 0.009 | ||
| Area | −0.0035 | 0.0014 | −2.59 | 0.012 | ||
| Site × Area | 0.0005 | 0.0016 | 0.36 | 0.718 | ||
| Variance (Sigma) | Intercept | −1.2891 | 0.1561 | −8.26 | <0.001 | |
| Site [level ‘K’] | −0.7823 | 0.2157 | −3.63 | 0.001 | ||
| Area | −0.0182 | 0.0040 | −4.52 | <0.001 | ||
| Site × Area | 0.0150 | 0.0045 | 3.40 | 0.001 | ||
| Old parts (n = 46) | Mean (Mu) | Intercept | −1.6614 | 0.3020 | −5.50 | <0.001 |
| Site [level ‘K’] | 1.5420 | 0.4281 | 3.60 | 0.001 | ||
| Area | 0.0754 | 0.0236 | 3.20 | 0.003 | ||
| Site × Area | −0.0908 | 0.0241 | −3.76 | 0.001 | ||
| Variance (Sigma) | Intercept | −0.6186 | 0.3181 | −1.95 | 0.059 | |
| Site [level ‘K’] | 2.0841 | 0.4057 | 5.14 | <0.001 | ||
| Area | 0.0118 | 0.0252 | 0.47 | 0.642 | ||
| Site × Area | −0.0710 | 0.0269 | −2.63 | 0.012 |
| Age | Parameter | Source of Variation | df | Sum of Squares | F-Value | p | Sign |
|---|---|---|---|---|---|---|---|
| Young parts | H’ (based on % cover) | Site | 1 | 0.0022 | 0.024 | 0.877 | |
| Area | 1 | 1.7838 | 19.375 | <0.001 | ↑ | ||
| Site×Area | 1 | 1.1779 | 12.794 | 0.001 | K↑ V↑ | ||
| Error | 76 | 6.9969 | |||||
| Number of species | Site | 1 | 19.2 | 2.9658 | 0.089 | ||
| Area | 1 | 671.4 | 103.8066 | <0.001 | ↑ | ||
| Site × Area | 1 | 71.3 | 11.0285 | 0.001 | K↑ V↑ | ||
| Error | 76 | 491.5 | |||||
| Old parts | H’ (based on % cover) | Site | 1 | 0.4989 | 1.9486 | 0.170 | |
| Area | 1 | 0.2183 | 0.8526 | 0.361 | |||
| Site × Area | 1 | 0.6183 | 2.4152 | 0.128 | |||
| Error | 42 | 10.752 | |||||
| Number of species | Site | 1 | 36.1 | 2.8909 | 0.096 | ||
| Area | 1 | 551.8 | 44.1654 | <0.001 | ↑ | ||
| Site × Area | 1 | 8.9 | 0.7151 | 0.403 | |||
| Error | 42 | 524.7 |
| Age | Source of Variation | df | SS | MS | Pseudo-F | p | Unique Permutations |
|---|---|---|---|---|---|---|---|
| Young parts | Area | 1 | 5498 | 5498 | 6.62 | 0.0001 | 9952 |
| Site | 1 | 13,841 | 13,841 | 16.69 | 0.0001 | 9936 | |
| Site × Area | 1 | 1593 | 1593 | 1.92 | 0.0651 | 9937 | |
| Error | 76 | 63,026 | 829 | ||||
| Old parts | Area | 1 | 4709 | 4708 | 3.97 | 0.0001 | 9948 |
| Site | 1 | 9780 | 9780 | 8.25 | 0.0001 | 9936 | |
| Site × Area | 1 | 2043 | 2043 | 1.72 | 0.0782 | 9946 | |
| Error | 42 | 49,782 | 1185 |
| Species | Mean Model (Mu) | Variance Model (Sigma) | Zeros Model (Nu) | ||||
|---|---|---|---|---|---|---|---|
| Estimate (SE) | p | Estimate (SE) | p | Estimate (SE) | p | ||
| Young Parts (n = 80) | |||||||
| Cribrilina annulata | I | −2.4951 (0.1870) | <0.001 | 2.0878 (0.2763) | <0.001 | −0.1898 (0.7094) | 0.790 |
| S | 2.1997 (0.2236) | <0.001 | −0.0523 (0.3811) | 0.892 | −21.2419 (5354.2603) | 0.997 | |
| A | 0.0007 (0.0028) | 0.806 | 0.0238 (0.0075) | 0.002 | −0.1596 (0.1069) | 0.140 | |
| S × A | 0.0006 (0.0030) | 0.842 | −0.0180 (0.0083) | 0.033 | −0.1596 (71.9445) | 0.998 | |
| Electra pilosa | I | −1.7665 (0.1845) | <0.001 | 1.6823 (0.2641) | <0.001 | 2.0963 (2.0629) | 0.313 |
| S | −1.9029 (0.2571) | <0.001 | 2.0667 (0.3928) | <0.001 | −2.3008 (2.1404) | 0.286 | |
| A | 0.0030 (0.0035) | 0.3958 | 0.0125 (0.0073) | 0.089 | −1.1162 (0.7365) | 0.134 | |
| S × A | −0.0073 (0.0040) | 0.0756 | −0.0075 (0.0081) | 0.359 | 1.0704 (0.7370) | 0.151 | |
| Celleporella hyalina | I | −0.8769 (0.1452) | <0.001 | 1.5891 (0.2785) | <0.001 | 1.9564 (2.0067) | 0.333 |
| S | −2.3326 (0.2234) | <0.001 | 1.7150 (0.3971) | <0.001 | −1.6762 (2.1876) | 0.446 | |
| A | 0.0019 (0.0017) | 0.271 | 0.0334 (0.0076) | <0.001 | −1.0639 (0.7096) | 0.138 | |
| S × A | −0.0059 (0.0025) | 0.019 | −0.0264 (0.0084) | 0.002 | 0.9373 (0.7146) | 0.194 | |
| Circeis armoricana | I | −2.1489 (0.1509) | <0.001 | −0.8095 (0.1605) | <0.001 | no zeros | |
| S | 0.8676 (0.1785) | <0.001 | −0.4126 (0.2279) | 0.074 | |||
| A | 0.0063 (0.0024) | 0.012 | −0.0098 (0.0043) | 0.025 | |||
| S × A | −0.0046 (0.0026) | 0.077 | 0.0065 (0.0048) | 0.180 | |||
| Porifera | I | −0.8429 (0.2670) | 0.002 | 0.6823 (0.3210) | 0.037 | −0.1903 (0.4041) | 0.639 |
| S | 0.0421 (0.3471) | 0.904 | 0.8275 (0.4501) | 0.070 | 0.4485 (0.6518) | 0.494 | |
| A | −0.0221 (0.0049) | <0.001 | 0.0341 (0.0089) | <0.001 | −0.0103 (0.0123) | 0.405 | |
| S × A | 0.0116 (0.0056) | 0.040 | −0.0303 (0.0095) | 0.002 | −0.0272 (0.0232) | 0.244 | |
| Old Parts (n = 46) | |||||||
| Cribrilina annulata | I | −1.5135 (0.7367) | 0.046 | 4.3858 (1.5457) | 0.007 | 6.0933 (2.6097) | 0.024 |
| S | −0.0450 (0.7783) | 0.954 | −3.0769 (1.5904) | 0.060 | −6.4730 (2.7646) | 0.024 | |
| A | −0.1484 (0.0434) | 0.001 | 0.0246 (0.0779) | 0.754 | −0.4881 (0.1982) | 0.018 | |
| S×A | 0.1505 (0.0439) | 0.001 | 0.0137 (0.0796) | 0.865 | 0.2536 (0.2567) | 0.329 | |
| Electra pilosa (separate models for the two sites) | Site V: I | −1.1564 (0.4217) | 0.014 | 0.1092 (0.4254) | 0.801 | no zeros | |
| Site V: A | −0.0509 (0.0290) | 0.117 | −0.0420 (0.0343) | 0.237 | |||
| Site K: I | −4.9332 (0.4195) | <0.001 | 4.9017 (0.6593) | <0.001 | 1.5588 (0.8440) | 0.080 | |
| Site K: A | −0.0132 (0.0134) | 0.339 | 0.0141 (0.0213) | 0.514 | −0.1572 (0.074) | 0.048 | |
| Juvenile mytilids | I | −1.4250 (0.3840) | <0.001 | 0.5747 (0.5548) | 0.306 | 2.5499 (1.9499) | 0.198 |
| S | −0.2370 (0.4135) | 0.570 | −0.5368 (0.6891) | 0.440 | −0.2620 (2.3573) | 0.912 | |
| A | −0.0089 (0.0195) | 0.650 | 0.1132 (0.0412) | 0.009 | −0.8268 (0.5108) | 0.113 | |
| S × A | −0.0006 (0.0196) | 0.977 | 0.0372 (0.0447) | 0.410 | −0.0138 (0.6892) | 0.984 | |
| Circeis armoricana | I | −3.2273 (0.3373) | <0.001 | 3.7427 (0.5848) | <0.001 | 0.7101 (1.0069) | 0.485 |
| S | 1.2267 (0.4094) | 0.005 | −2.1756 (0.7120) | 0.004 | 51.2633 (299.8967) | 0.865 | |
| A | −0.0327 (0.0247) | 0.192 | 0.0015 (0.0392) | 0.970 | −0.2601 (0.1598) | 0.111 | |
| S × A | 0.0317 (0.0251) | 0.214 | 0.0577 (0.0428) | 0.185 | −50.1948 (286.5729) | 0.862 | |
| Porifera | I | −0.7947 (0.3675) | 0.036 | 1.3691 (0.4779) | 0.007 | 1.0340 (2.8280) | 0.716 |
| S | 0.7172 (0.4500) | 0.119 | −1.2206 (0.5771) | 0.040 | −15.466 (225.1950) | 0.946 | |
| A | 0.0426 (0.0294) | 0.155 | −0.0216 (0.0355) | 0.546 | −1.1330 (1.1680) | 0.338 | |
| S × A | −0.0469 (0.0298) | 0.123 | 0.0883 (0.0387) | 0.028 | 1.1330 (9.672) | 0.907 | |
© 2019 by the authors. Licensee MDPI, Basel, Switzerland. This article is an open access article distributed under the terms and conditions of the Creative Commons Attribution (CC BY) license (http://creativecommons.org/licenses/by/4.0/).
Share and Cite
Chava, A.; Artemieva, A.; Yakovis, E. Plant Part Age and Size Affect Sessile Macrobenthic Assemblages Associated with a Foliose Red Algae Phycodrys rubens in the White Sea. Diversity 2019, 11, 80. https://doi.org/10.3390/d11050080
Chava A, Artemieva A, Yakovis E. Plant Part Age and Size Affect Sessile Macrobenthic Assemblages Associated with a Foliose Red Algae Phycodrys rubens in the White Sea. Diversity. 2019; 11(5):80. https://doi.org/10.3390/d11050080
Chicago/Turabian StyleChava, Alexandra, Anna Artemieva, and Eugeniy Yakovis. 2019. "Plant Part Age and Size Affect Sessile Macrobenthic Assemblages Associated with a Foliose Red Algae Phycodrys rubens in the White Sea" Diversity 11, no. 5: 80. https://doi.org/10.3390/d11050080
APA StyleChava, A., Artemieva, A., & Yakovis, E. (2019). Plant Part Age and Size Affect Sessile Macrobenthic Assemblages Associated with a Foliose Red Algae Phycodrys rubens in the White Sea. Diversity, 11(5), 80. https://doi.org/10.3390/d11050080