Bat Pass Duration Measurement: An Indirect Measure of Distance of Detection

 , ,
, ,
Abstract
:1. Introduction
2. Materials and Methods
2.1. Bat Sampling
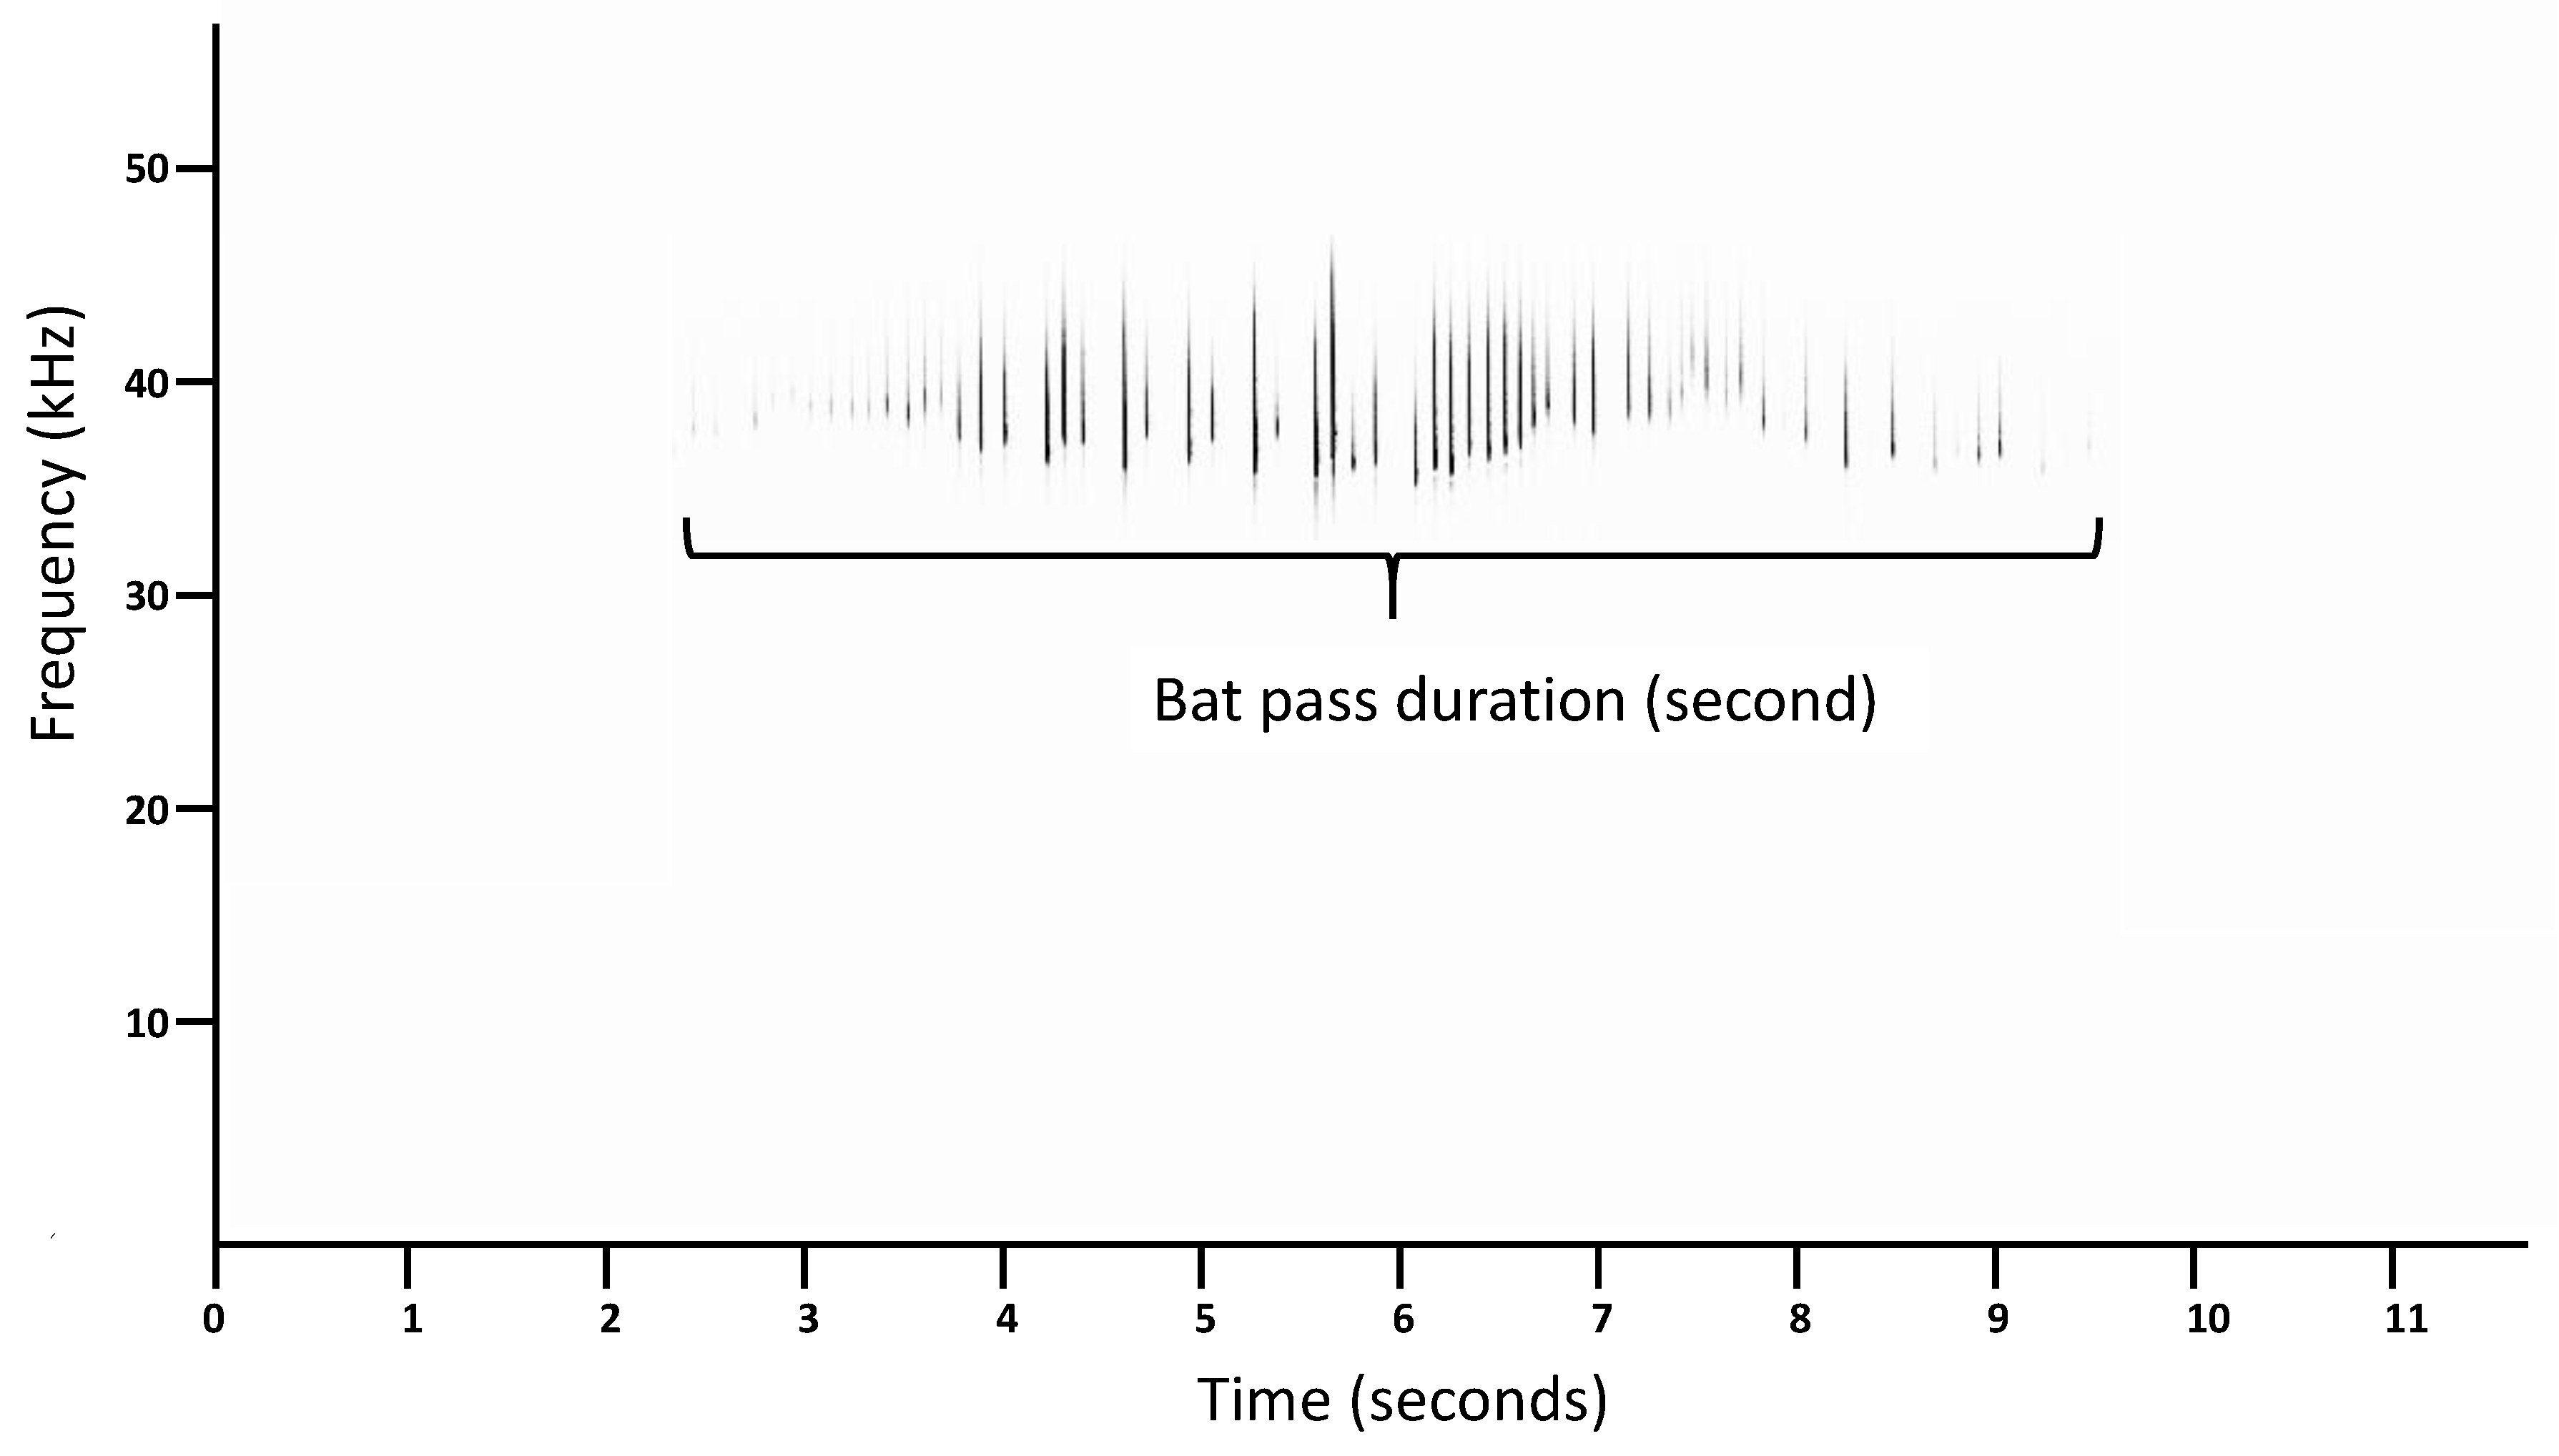
2.2. Species Identification and Measurement of Bat-Pass Duration
2.3. Statistical Analysis
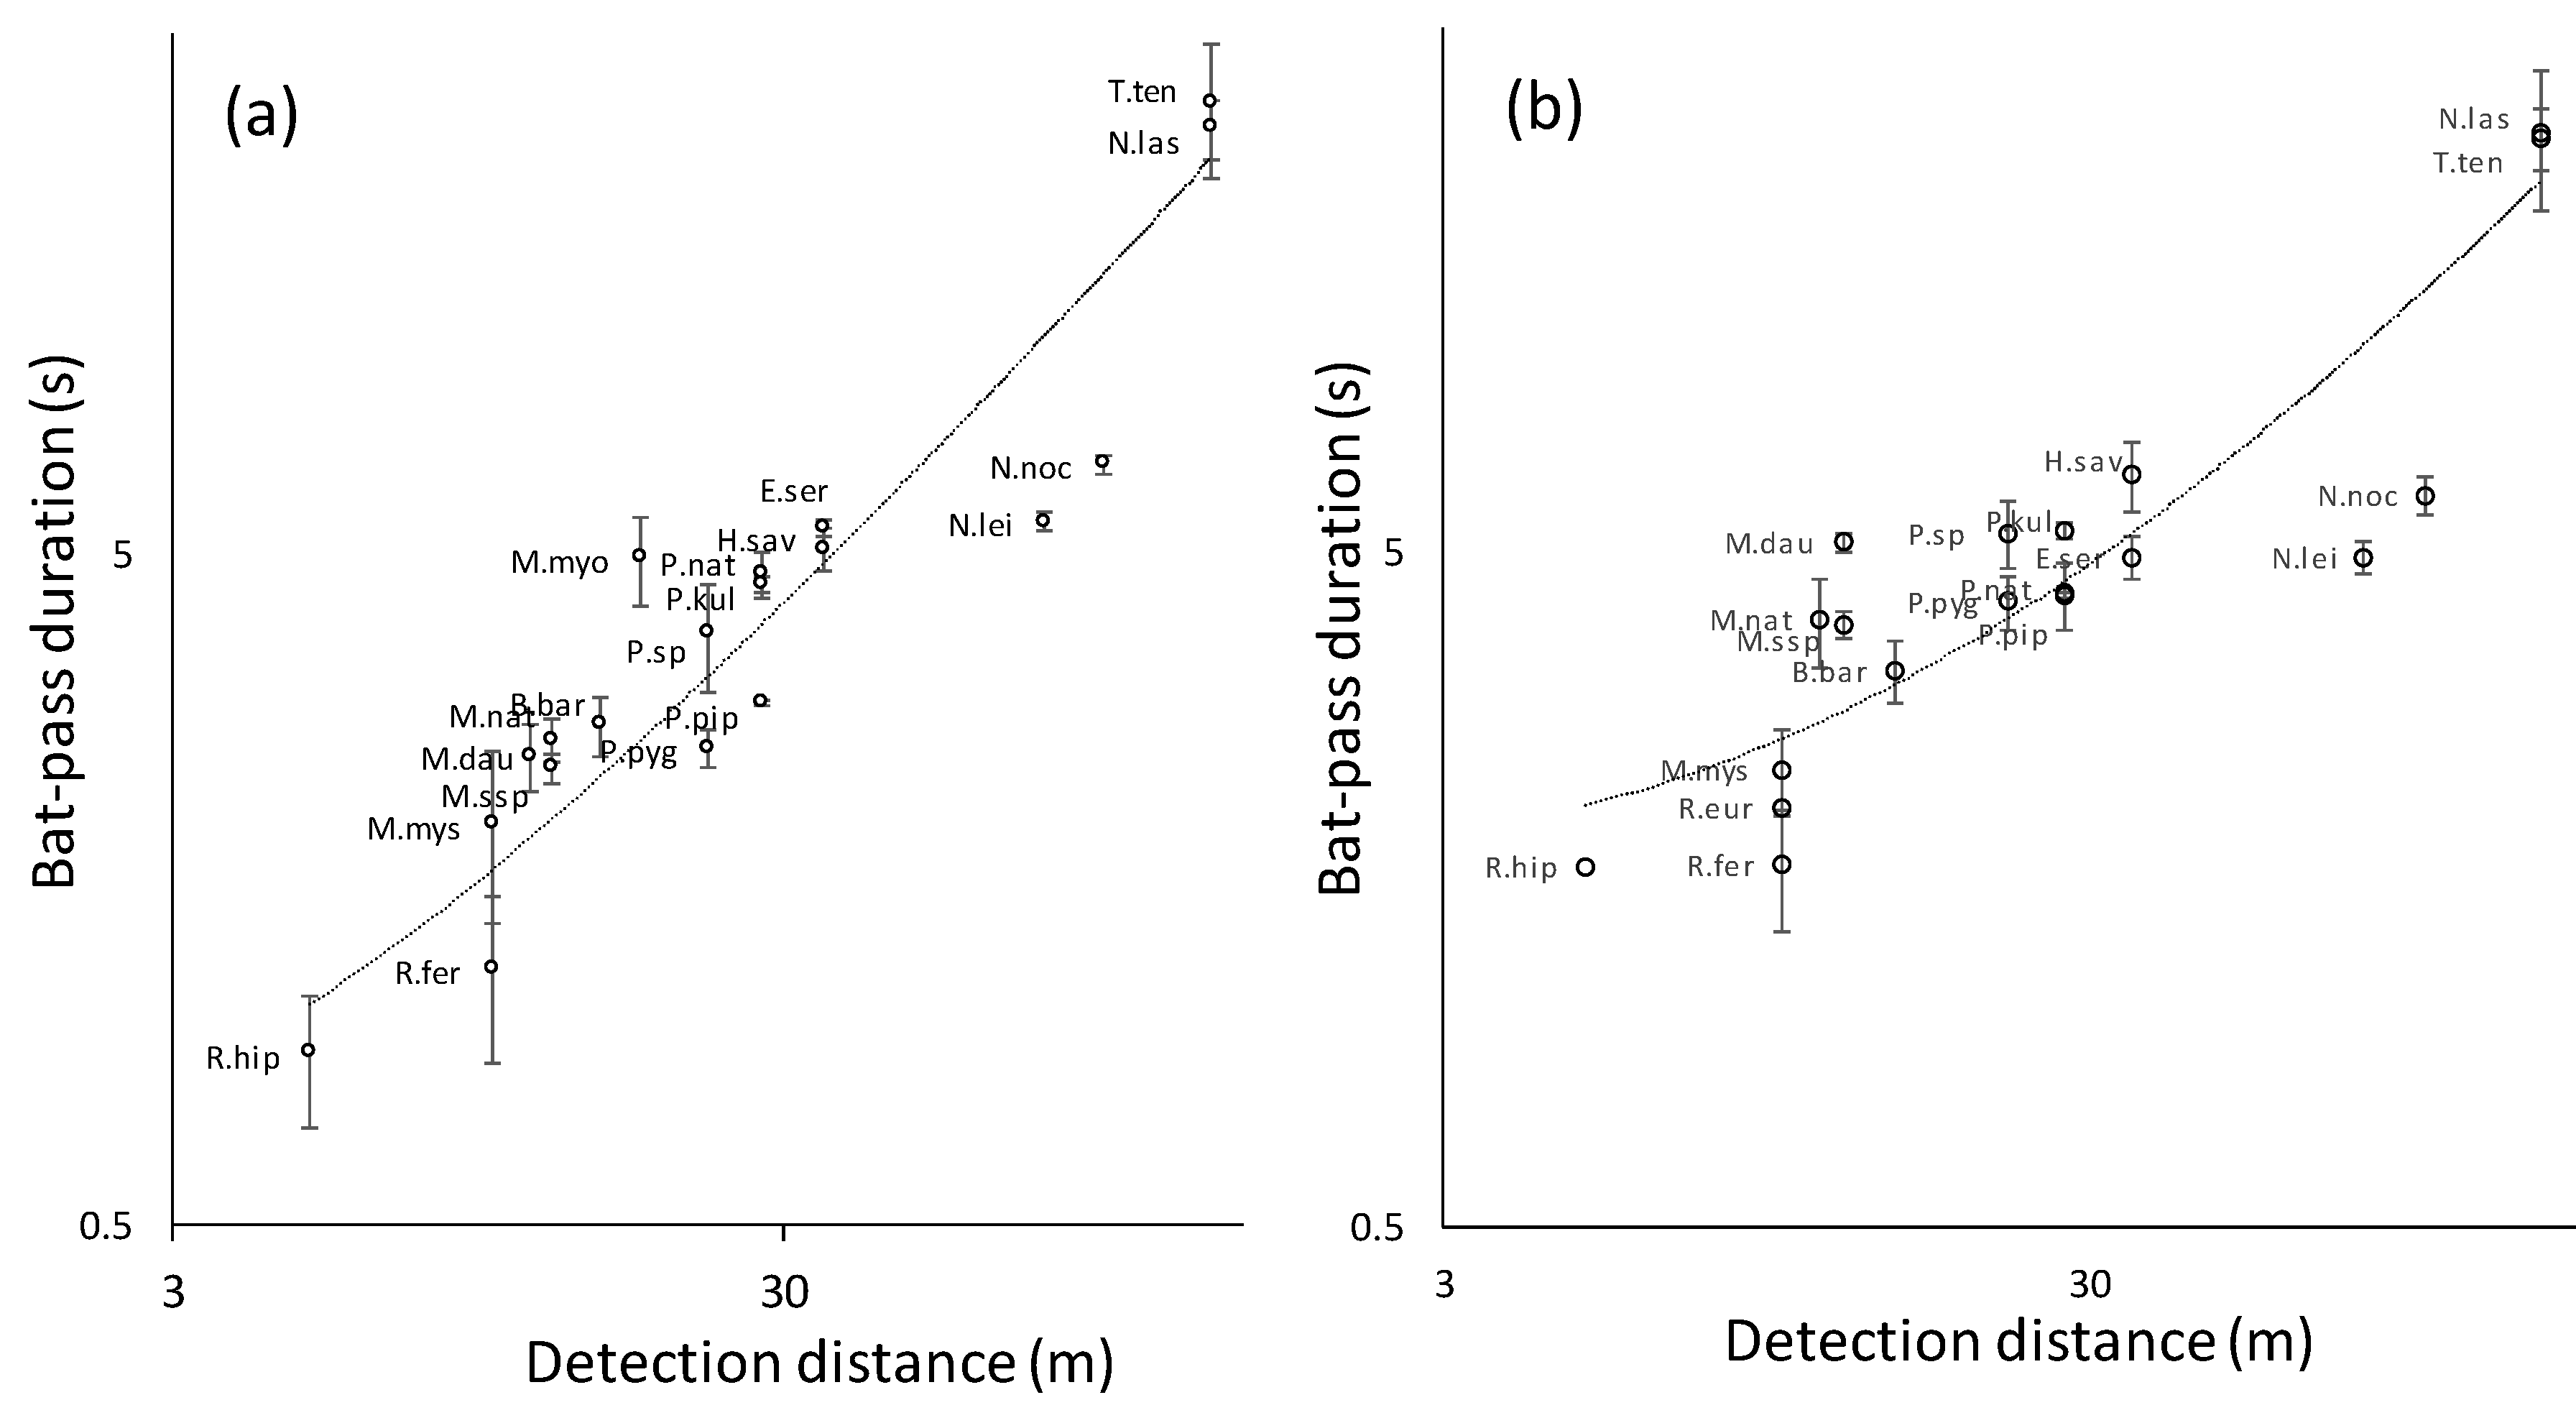
3. Results
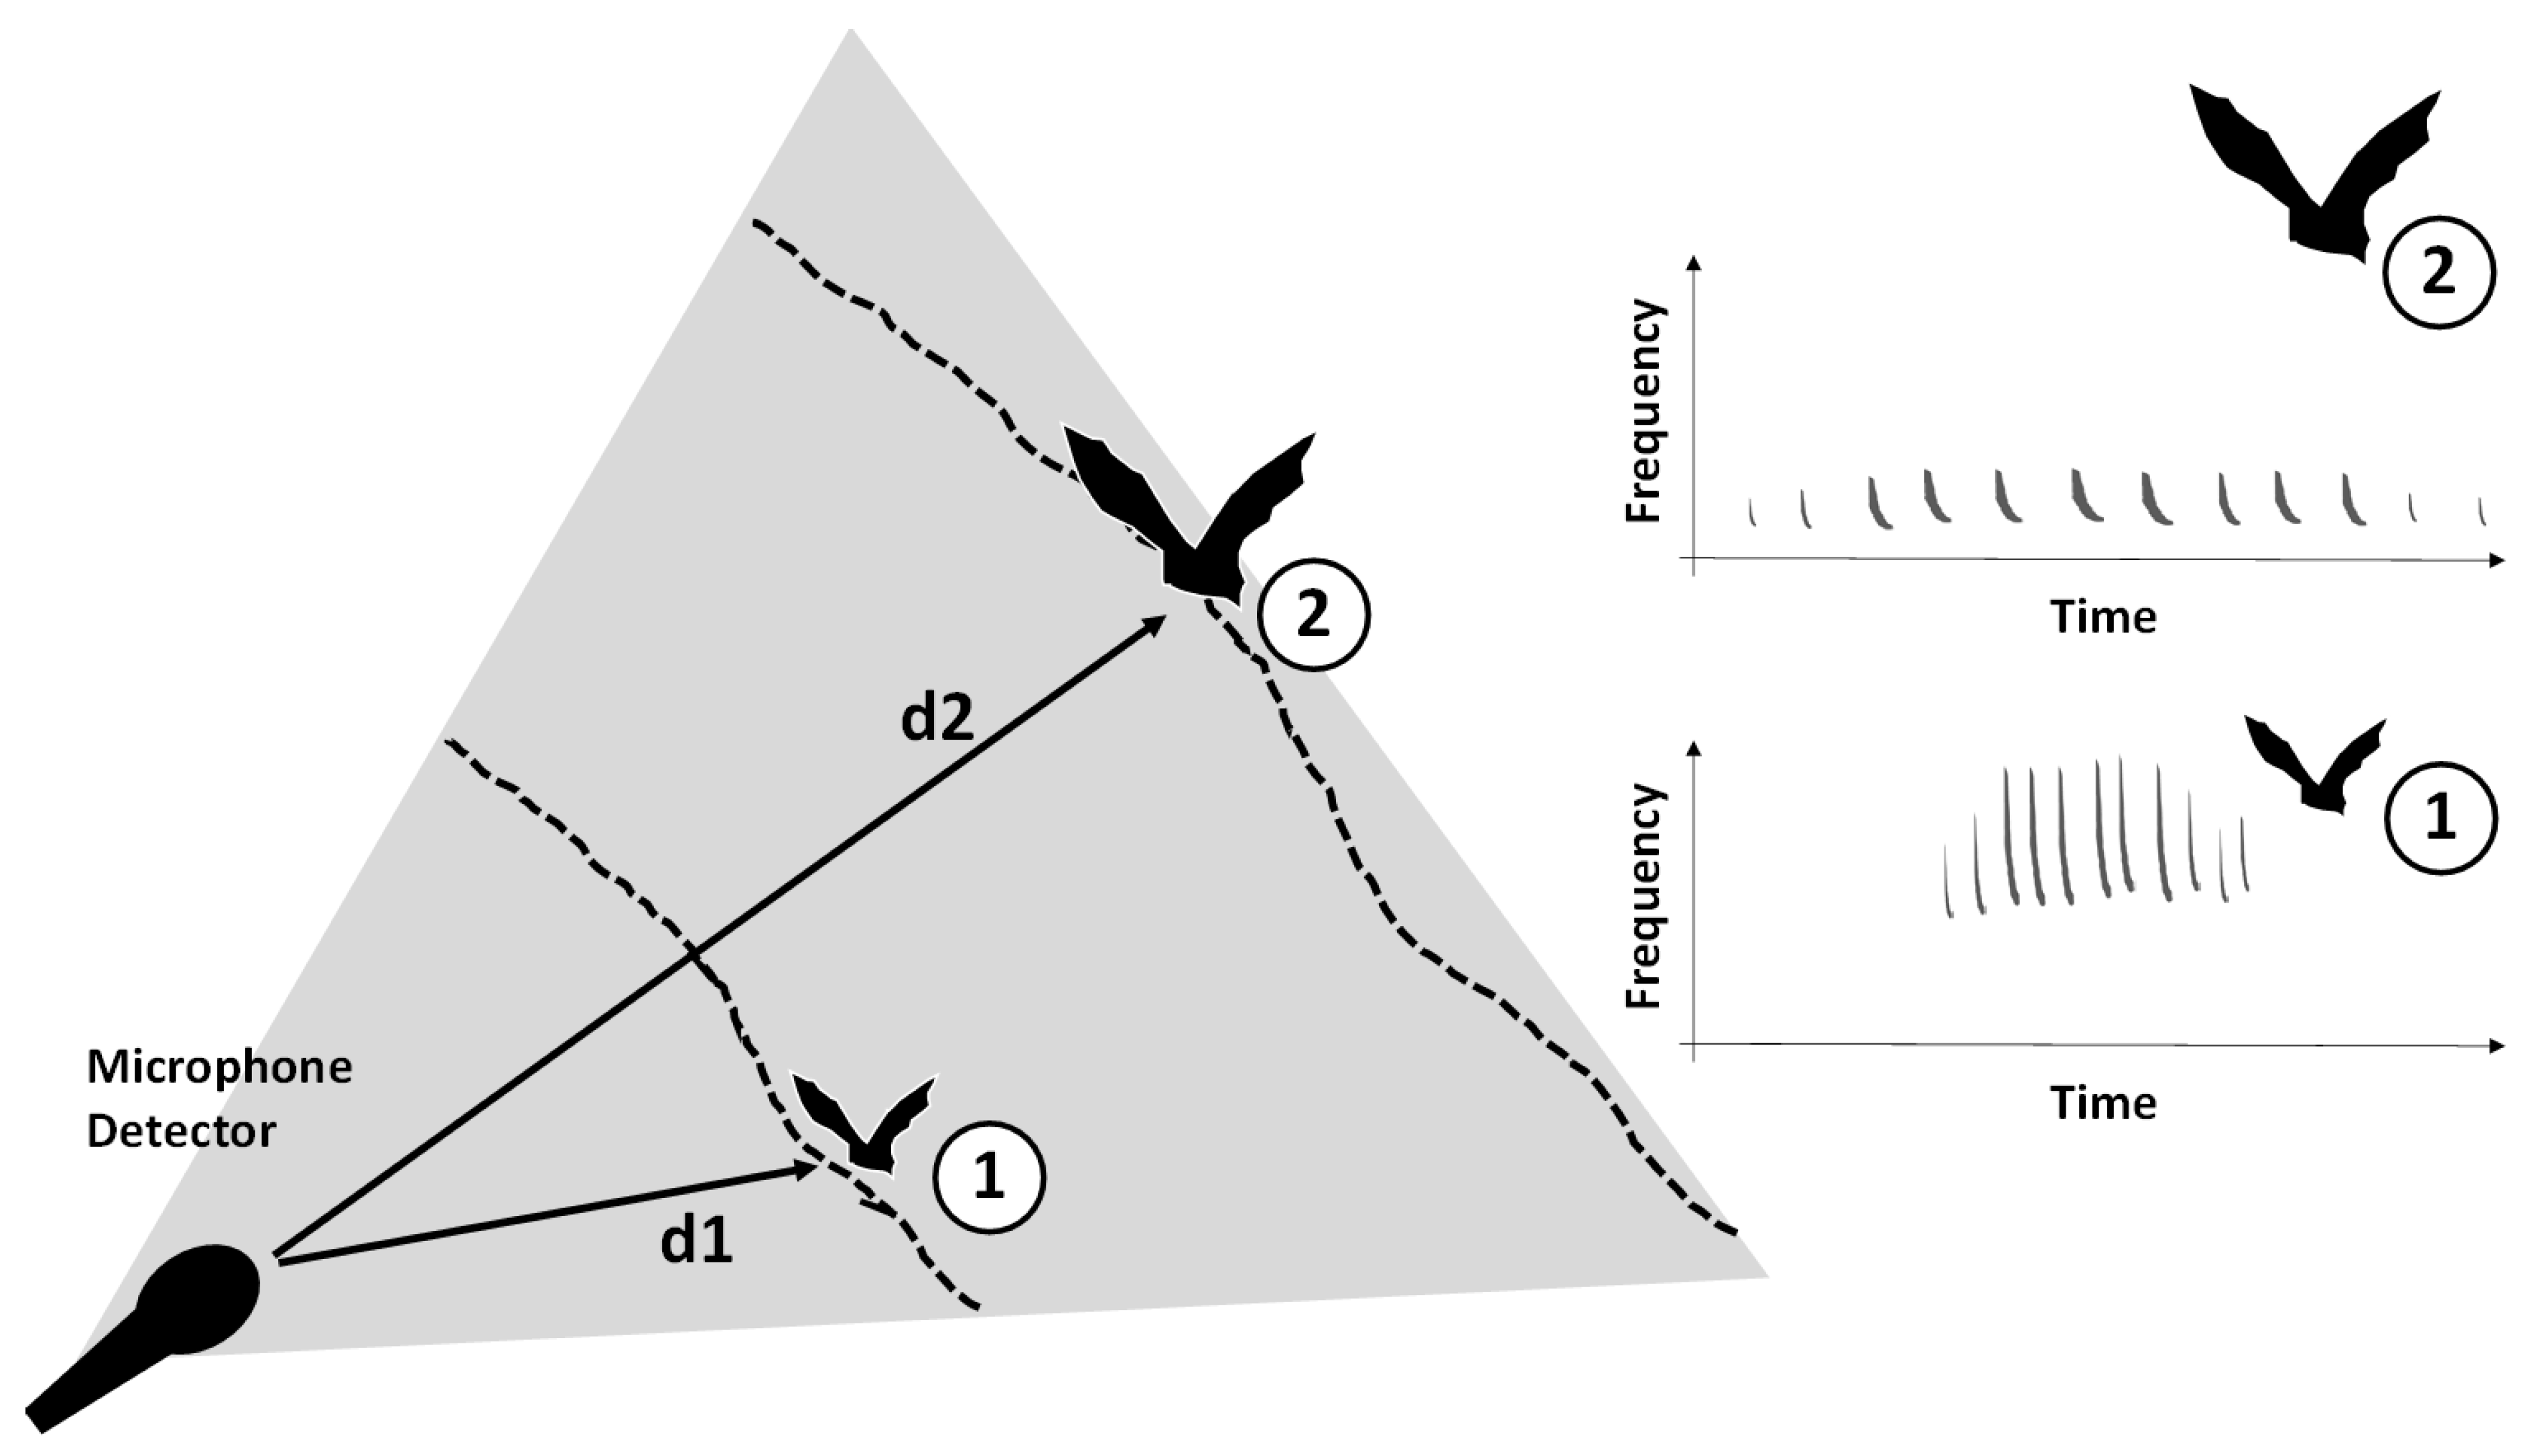
4. Discussion
Supplementary Materials
Author Contributions
Funding
Acknowledgments
Conflicts of Interest
References
- Ahlen, I.; Baagøe, H.J. Use of ultrasound detectors for bat studies in Europe, experiences from field identification, surveys, and monitoring. Acta Chiropterol. 1999, 1, 137–150. [Google Scholar]
- Russo, D.; Jones, G. Identification of twenty-two bat species (Mammalia, Chiroptera) from Italy by analysis of time-expanded recordings of echolocation calls. J. Zool. 2002, 258, 91–103. [Google Scholar] [CrossRef]
- Barataud, M. Acoustic Ecology of European Bats, Species Identification, Study of Their Habitats and Foraging Behaviour; Muséum National d’Histoire Naturelle: Paris, France, 2015. [Google Scholar]
- Obrist, M.K.; Boesch, R.; Flückiger, P.F. Variability in echolocation call design of 26 Swiss bat species, consequences, limits and options for automated field identification with a synergetic pattern recognition approach. Mammalia 2004, 68, 307–322. [Google Scholar] [CrossRef]
- Parsons, S.; Jones, G. Acoustic identification of twelve species of echolocating bat by discriminant function analysis and artificial neural networks. J. Exp. Biol. 2000, 203, 2641–2656. [Google Scholar] [PubMed]
- Adams, M.D.; Law, B.S.; Gibson, M.S. Reliable Automation of Bat Call Identification for Eastern New South Wales, Australia, Using Classification Trees and AnaScheme Software. Acta Chiropterol. 2010, 12, 231–245. [Google Scholar] [CrossRef]
- Britzke, E.R.; Duchamp, J.E.; Murray, K.L.; Swihart, R.K.; Robbins, L.W. Acoustic identification of bats in the eastern United States, A comparison of parametric and nonparametric methods. J. Wildl. Manag. 2011, 75, 660–667. [Google Scholar] [CrossRef]
- Bas, Y.; Bas, D.; Julien, J.-F. Tadarida: A Toolbox for Animal Detection on Acoustic Recordings. J. Open Res. Softw. 2017, 5, 6. [Google Scholar] [CrossRef]
- Sherwin, R.E.; Gannon, W.L.; Haymond, S. The efficacy of acoustic techniques to infer differential. Use of habitat by bats. Acta Chiropterol. 2000, 2, 145–153. [Google Scholar]
- Russo, D.; Jones, G. Use of foraging habitats by bats in a Mediterranean area determined by acoustic surveys, conservation implications. Ecography 2003, 26, 197–209. [Google Scholar] [CrossRef]
- Wickramasinghe, L.P.; Harris, S.; Jones, G.; Vaughan, N. Bat activity and species richness on organic and conventional farms, impact of agricultural intensification. J. Appl. Ecol. 2003, 40, 984–993. [Google Scholar] [CrossRef]
- Barré, K.; Le Viol, I.; Julliard, R.; Chiron, F.; Kerbiriou, C. Tillage and herbicide reduction mitigate the gap between conventional and organic farming effects on foraging activity of insectivorous bats. Ecol. Evol. 2018, 8, 1496–1506. [Google Scholar] [CrossRef] [PubMed]
- Tibbels, A.E.; Kurta, A. Bat activity is low in thinned and unthinned stands of red pine. Can. J. For. Res. 2003, 33, 2436–2442. [Google Scholar] [CrossRef]
- Charbonnier, Y.; Barbaro, L.; Theillout, A.; Jactel, H. Numerical and Functional Responses of Forest Bats to a Major Insect Pest in Pine Plantations. PLoS ONE 2014, 9, e109488. [Google Scholar] [CrossRef] [PubMed]
- Law, B.S.; Anderson, J.; Chidel, M. Bat communities in a fragmented forest landscape on the south-west slopes of New South Wales, Australia. Biol. Conserv. 1999, 88, 333–345. [Google Scholar] [CrossRef]
- Hötker, H.; Thomsen, K.-M.; Jeromin, H. Impacts on Biodiversity of Exploitation of Renewable Energy Sources, the Example of Birds and Bats—Facts, Gaps in Knowledge, Demands for Further Research, and Ornithological Guidelines for the Development of Renewable Energy Exploitation; Michael-Otto-Institut im NABU: Bergenhusen, Germany, 2006; Available online: http://www.proj6.turbo.pl/upload/file/389.pdf (accessed on 21 January 2019).
- Millon, L.; Colin, C.; Brescia, F.; Kerbiriou, C. Wind turbines impact bat activity, leading to high losses of habitat use in a biodiversity hotspot. Ecol. Eng. 2018, 112, 51–54. [Google Scholar] [CrossRef]
- Barré, K.; Le Viol, I.; Bas, Y.; Julliard, R.; Kerbiriou, C. Estimating habitat loss due to wind turbine avoidance by bats, implications for European siting guidance. Biol. Conserv. 2018, 226, 205–214. [Google Scholar] [CrossRef]
- Bunkley, J.P.; McClure, C.J.W.; Kleist, N.J.; Francis, C.D.; Barber, J.R. Anthropogenic noise alters bat activity levels and echolocation calls. Glob. Ecol. Conserv. 2015, 3, 62–71. [Google Scholar] [CrossRef]
- Stone, E.L.; Jones, G.; Harris, S. Street lighting disturbs commuting bats. Curr. Biol. 2009, 19, 1123–1127. [Google Scholar] [CrossRef]
- Azam, C.; Le Viol, I.; Julien, J.-F.; Bas, Y.; Kerbiriou, C. Disentangling the relative effect of light pollution, impervious surfaces and intensive agriculture on bat activity with a national-scale monitoring program. Landsc. Ecol. 2016, 31, 2471–2483. [Google Scholar] [CrossRef]
- Hayes, J.P. Temporal variation in activity of bats and the design of echolocation-monitoring studies. J. Mammal. 1997, 78, 21. [Google Scholar] [CrossRef]
- Roche, N.; Langton, S.; Aughney, T.; Russ, J.M.; Marnell, F.; Lynn, D.; Catto, C. A car-based monitoring method reveals new information on bat populations and distributions in Ireland. Anin. Conserv. 2011, 14, 642–651. [Google Scholar] [CrossRef]
- Lacoeuilhe, A.; Machon, N.; Julien, J.-F.; Kerbiriou, C. Effects of hedgerows on bats and bush crickets at different spatial scales. Acta Oecol. 2016, 71, 61–72. [Google Scholar] [CrossRef]
- Kerbiriou, C.; Azam, C.; Touroult, J.; Marmet, J.; Julien, J.F.; Pellissier, V. Common bats are more abundant within Natura 2000 areas. Biol. Conserv. 2018, 217, 66–74. [Google Scholar] [CrossRef]
- Millon, L.; Julien, J.F.; Julliard, R.; Kerbiriou, C. Bat activity in intensively farmed landscapes with wind turbines and offset measures. Ecol. Eng. 2015, 75, 250–257. [Google Scholar] [CrossRef]
- Schnitzler, H.U.; Grinnell, A.D. Directional sensitivity of echolocation in the horseshoe bat, Rhinolophus ferrumequinum. J. Comp. Physiol. 1977, 116, 51–61. [Google Scholar] [CrossRef]
- Arditi, G.; Weiss, A.J.; Yovel, Y. Object localization using a biosonar beam, how opening your mouth improves localization. R. Soc. Open Sci. 2015, 2, 150225. [Google Scholar] [CrossRef]
- Kounitsky, P.; Rydell, J.; Amichai, E.; Boonman, A.; Eitan, O.; Weiss, A.J.; Yovel, Y. Bats adjust their mouth gape to zoom in their biosonar ‘field of view’. Proc. Natl. Acad. Sci. USA 2015, 112, 6724–6729. [Google Scholar] [CrossRef]
- Forrest, T.G. From sender to receiver, propagation and environmental effects on acoustic signals. Ann. Zool. 1994, 34, 644–654. [Google Scholar] [CrossRef]
- Darras, K.; Fahrurrozi, P.P.; Rembold, K.; Tscharntke, T. Measuring sound detection spaces for acoustic animal sampling and monitoring. Biol. Conserv. 2016, 201, 29–37. [Google Scholar] [CrossRef]
- Holderied, M.W.; Korine, C.; Fenton, M.; Parsons, S.; Robson, S.; Jones, G. Echolocation call intensity in the aerial hawking bat Eptesicus bottae (Vespertilionidae) studied using stereo videogrammetry. J. Exp. Biol. 2005, 208, 1321–1327. [Google Scholar] [CrossRef]
- Forbes, B.; Newhook, E.M. A comparision of the performance of three models of bat detectors. J. Mammal. 1990, 71, 108–110. [Google Scholar] [CrossRef]
- Monadjem, A.; Shapiro, J.T.; Mtsetfwa, F.; Reside, A.E.; Mccleery, R.A. Acoustic call library and detection distances for bats of Swaziland. Acta Chiropterol. 2017, 19, 175–187. [Google Scholar] [CrossRef]
- Surlykke, A.; Pedersen, S.B.; Jakobsen, L. Echolocating bats emit a highly directional sonar sound beam in the field. Proc. R. Soc. B 2009, 276, 853–860. [Google Scholar] [CrossRef] [PubMed]
- Papadatou, E.; Butlin, R.K.; Altringham, J.D. Identification of bat species in Greece from their echolocation calls. Acta Chiropterol. 2008, 10, 127–143. [Google Scholar] [CrossRef]
- Barataud, M. L’activité crépusculaire et nocturne de 18 espèces de chiroptères, révélée par marquage luminescent et suivi acoustique. Le Rhinolophe 1992, 9, 23–58. [Google Scholar]
- Barataud, M. Méthode D’identification Acoustique des Chiroptères de France; Sittelle: Mens, France, 2002. [Google Scholar]
- Hovorka, M.D.; Marks, C.S.; Muller, E. An Improved Chemiluminescent Tag for Bats. Wildl. Soc. Bull. 1996, 24, 709–712. [Google Scholar]
- Blumstein, D.T.; Mennill, D.J.; Clemins, P.; Girod, L.; Yao, K.; Patricelli, G.; Deppe, J.L.; Krakauer, A.H.; Clark, C.; Cortopassi, K.A.; et al. Acoustic monitoring in terrestrial environments using microphone arrays, applications, technological considerations and prospectus. J. Appl. Ecol. 2011, 48, 758–767. [Google Scholar] [CrossRef]
- Holderied, M.W.; Von Helversen, O. Echolocation range and wingbeat period match in aerial-hawking bats. Proc. R. Soc. B 2003, 270, 2293–2299. [Google Scholar] [CrossRef]
- Bas, Y.; Charbonnier, M.; Kiri Ing, R.; Julien, J.-F. Using acoustic flight path reconstruction to distinguish foraging and commuting behaviour, then predicting it a posteriori from call features. In Proceedings of the 4th Berlin Bat meeting, Movement Ecology of Bats, Berlin, Germany, 13–15 March 2015. [Google Scholar]
- Kunz, T.H.; Arnett, A.E.; Erickson, W.P.; Hoar, A.R.; Johnson, G.D.; Larkin, R.P.; Strickland, M.D.; Thresher, R.W.; Tuttle, M.D. Ecological impacts of wind energy developments on bats, questions, research needs, and hypotheses. Front. Ecol. Environ. 2007, 5, 315–324. [Google Scholar] [CrossRef]
- Roemer, C.; Bas, Y.; Devos, S. Assessment of bat mortality risks around human activities using unattended recordings for flight path reconstruction, an affordable method for bat behavioural and conservation studies. In Proceedings of the 13th European Bat Research Symposium 2014, Sibenik, Croatia, 1–5 September 2014. [Google Scholar]
- Adams, A.; Jantzen, M.; Hamilton, M.K.; Fenton, M.B. Do you hear what I hear? Implications of detector selection for acoustic monitoring of bats. Methods Ecol. Evol. 2012, 3, 992–998. [Google Scholar] [CrossRef]
- Turgeon, P.J.; Van Wilgenburg, S.L.; Drake, K.L. Microphone variability and degradation, implications for monitoring programs employing autonomous recording units. Avian Conserv. Ecol. 2017, 12, 9. [Google Scholar] [CrossRef]
- Waters, D.A.; Jones, G. Echolocation call structure and intensity in five species of insectivorous bats. J. Exp. Biol. 1995, 198, 475–489. [Google Scholar]
- Jakobsen, L.; Ratcliffe, J.M.; Surlykke, A. Convergent acoustic field of view in echolocating bats. Nature 2013, 493, 93–96. [Google Scholar] [CrossRef]
- Jacobs, D.S.; Barclay, R.M.R.; Walker, M.H. The allometry of echolocation call frequencies of insectivorous bats, why do some species deviate from the pattern? Oecologia 2007, 152, 583–594. [Google Scholar] [CrossRef]
- French Bat Monitoring Program (FBMP). Available online: http://www.vigienature.fr/fr/chauves-souris (accessed on 21 January 2019).
- Stahlschmidt, P.; Brühl, C.A. Bats as bioindicators—The need of a standardized method for acoustic bat activity surveys. Methods Ecol. Evol. 2012, 3, 503–508. [Google Scholar] [CrossRef]
- Roche, N.; Catto, C.; Langton, S.; Aughney, T.; Russ, J. Development of a Car-Based Bat Monitoring Protocol for the Republic of Ireland; Irish Wildlife Manuals, No 19. Dublin (Ireland); National Parks and Wildlife Service, Department of Environment, Heritage and Local Government: Dublin, Ireland, 2005.
- Azam, C.; Kerbiriou, C.; Vernet, A.; Julien, J.-F.; Bas, Y.; Plichard, L.; Maratrat, J.; Le Viol, I. Is part-night lighting an effective measure to limit the impacts of artificial lighting on bats? Glob. Chang. Biol. 2015, 21, 4333–4341. [Google Scholar] [CrossRef] [PubMed]
- Burt, J. Syrinx a Software for Real Time Spectrographic Recording, Analysis and Playback of Sound. 2006. Seattle, US. Available online: http://vigienature.jardindesplantes.net/fr/documentations-logiciel-2908 (accessed on 21 January 2019).
- Burnham, K.P.; Anderson, D.R.; Huyvaert, K.P. AIC model selection and multimodel inference in behavioral ecology: Some background, observations, and comparisons. Behav. Ecol. Sociobiol. 2011, 65, 23–35. [Google Scholar] [CrossRef]
- Russo, D.; Jones, G.; Mucedda, M. Influence of age, sex and body size on echolocation calls of Mediterranean and Mehely’s horseshoe bats, Rhinolophus euryale and R. mehelyi (Chiroptera, Rhinolophidae). Mammalia 2001, 65, 429–436. [Google Scholar] [CrossRef]
- Schnitzler, H.-U.; Kalko, E.K.V. Echolocation by insect-eating bats. Bioscience 2001, 51, 557–569. [Google Scholar] [CrossRef]
- Downes, C.M.A. Comparison of Sensitivities of Three Bat Detectors. J. Mammal. 1982, 63, 343–345. [Google Scholar] [CrossRef]
- Limpens, H.J.G.A.; McCracken, G.F. Choosing a bat detector, theoretical and practical aspects. In Bat Echolocation Research, Tools, Techniques, and Analysis; Bat Conservation International: Austin, TX, USA, 2004. [Google Scholar]
- Russo, D.; Voigt, C.C. The use of automated identification of bat echolocation calls in acoustic monitoring: A cautionary note for a sound analysis. Ecol. Indic. 2016, 66, 598–602. [Google Scholar] [CrossRef]
- Barré, K.; Le Viol, I.; Julliard, R.; Pauwels, J.; Newson, S.E.; Julien, J.F.; Claireau, F.; Kerbiriou, C.; Bas, Y. Accounting for automated identification errors in acoustic surveys. Methods Ecol. Evol. 2019, in press. [Google Scholar]
- Barlow, K.E.; Briggs, P.A.; Haysom, K.A.; Hutson, A.M.; Lechiara, N.L.; Racey, P.A.; Walsh, A.L.; Langton, S.D. Citizen science reveals trends in bat populations, The National Bat Monitoring Programme in Great Britain. Biol. Conserv. 2015, 182, 14–26. [Google Scholar] [CrossRef]


| Species | Abbreviations | Point-Count Survey | Car-Transect Survey | ||
|---|---|---|---|---|---|
| Mean BPD | N | Mean BDP | N | ||
| Barbastella barbastellus (Schreber, 1774) | (B.bar) | 3.342 ± 0.343 | 45 | 2.788 ± 0.263 | 132 |
| Hypsugo savii (Bonaparte, 1837) | (H.sav) | 6.525 ± 0.755 | 16 | 5.114 ± 0.366 | 182 |
| Pipistrellus kuhlii (Kuhl, 1817) | (P.kuh) | 5.397 ± 0.151 | 805 | 4.523 ± 0.112 | 981 |
| Pipistrellus nathusii (Keyserling & Blasius, 1839) | (P.nat) | 4.346 ± 0.490 | 72 | 4.695 ± 0.365 | 66 |
| Pipistrellus pipistrellus (Schreber, 1774) | (P.pip) | 4.340 ± 0.042 | 8116 | 3.013 ± 0.025 | 11,132 |
| Pipistrellus_pygmaeus (Leach, 1825) | (P.pyg) | 4.228 ± 0.400 | 92 | 2.577 ± 0.162 | 260 |
| Eptesicus serotinus (Schreber, 1774) | (E.ser) | 4.921 ± 0.359 | 130 | 5.502 ± 0.145 | 713 |
| Nyctalus lasiopterus (Schreber, 1780) | (N.las) | 21.013 ± 4.841 | 8 | 21.683 ± 2.189 | 15 |
| Nyctalus leisleri (Kuhl, 1817) | (N.lei) | 4.924 ± 0.284 | 226 | 5.606 ± 0.168 | 531 |
| Nyctalus noctula (Schreber, 1774) | (N.noc) | 6.093 ± 0.411 | 143 | 6.832 ± 0.221 | 414 |
| Myotis ssp. | (M.spp) | 3.905 ± 0.183 | 493 | 2.401 ± 0.123 | 274 |
| Myotis daubentoni (Kuhl, 1817) | (M.dau) | 5.178 ± 0.163 | 604 | 2.654 ± 0.199 | 54 |
| Myotis mystacinus (Kuhl, 1817) | (M.mys) | 2.387 ± 0.349 | 15 | 1.978 ± 0.573 | 9 |
| Myotis myotis (Borkhausen, 1797) | (M.myo) | - | 0 | 4.943 ± 0.761 | 28 |
| Myotis nattereri (Kuhl, 1817) | (M.nat) | 3.989 ± 0.599 | 27 | 2.503 ± 0.285 | 31 |
| Plecotus ssp. | (P.spp) | 5.340 ± 0.606 | 35 | 3.830 ± 0.651 | 57 |
| Tadarida teniotis (Rafinesque, 1814) | (T.ten) | 20.970 ± 2.134 | 44 | 23.564 ± 5.350 | 11 |
| Rhinolophus euryale (Blasius, 1853) | (R.eur) | 2.100 ± 0.280 | 2 | - | 0 |
| Rhinolophus ferrumequinum (Schreber, 1774) | (R.fer) | 1.725 ± 0.354 | 8 | 1.206 ± 0.337 | 9 |
| Rhinolophus hipposideros (Bechstein, 1800) | (R.hip) | 1.717 ± 0.224 | 3 | 0.900 ± 0.200 | 3 |
| Species | Survey-Type Effect | Detector-Type Effect | ||
|---|---|---|---|---|
| Effect | p-Value | Effect | p-Value | |
| Barbastella barbastellus (Schreber, 1774) | - | p = 0.07 | - | p = 0.97 |
| Hypsugo savi (Bonaparte, 1837) | - | p = 0.06 | - | p = 0.13 |
| Pipistrellus kuhlii (Kuhl, 1817) | CTS < PCS | p = 0.001 | TT < D240x | p = 0.002 |
| Pipistrellus nathusii (Keyserling & Blasius, 1839) | - | p = 0.11 | - | p = 0.07 |
| Pipistrellus pipistrellus (Schreber, 1774) | CTS < PCS | p < 0.001 | TT < D240x | p < 0.001 |
| Pipistrellus_pygmaeus (Leach, 1825) | CTS < PCS | p < 0.001 | - | p = 0.14 |
| Eptesicus serotinus (Schreber, 1774) | - | p = 0.21 | - | p = 0.05 |
| Nyctalus leisleri (Kuhl, 1817) | - | p = 0.05 | - | p = 0.44 |
| Nyctalus noctula (Schreber, 1774) | - | p = 0.16 | - | p = 0.52 |
| Myotis ssp. | CTS < PCS | p < 0.001 | TT < D240x | p < 0.001 |
| Myotis daubentoni (Kuhl, 1817) | CTS < PCS | p < 0.001 | TT < D240x | p < 0.001 |
© 2019 by the authors. Licensee MDPI, Basel, Switzerland. This article is an open access article distributed under the terms and conditions of the Creative Commons Attribution (CC BY) license (http://creativecommons.org/licenses/by/4.0/).
Share and Cite
Kerbiriou, C.; Bas, Y.; Le Viol, I.; Lorrillière, R.; Mougnot, J.; Julien, J.-F. Bat Pass Duration Measurement: An Indirect Measure of Distance of Detection. Diversity 2019, 11, 47. https://doi.org/10.3390/d11030047
Kerbiriou C, Bas Y, Le Viol I, Lorrillière R, Mougnot J, Julien J-F. Bat Pass Duration Measurement: An Indirect Measure of Distance of Detection. Diversity. 2019; 11(3):47. https://doi.org/10.3390/d11030047
Chicago/Turabian StyleKerbiriou, Christian, Yves Bas, Isabelle Le Viol, Romain Lorrillière, Justine Mougnot, and Jean-François Julien. 2019. "Bat Pass Duration Measurement: An Indirect Measure of Distance of Detection" Diversity 11, no. 3: 47. https://doi.org/10.3390/d11030047
APA StyleKerbiriou, C., Bas, Y., Le Viol, I., Lorrillière, R., Mougnot, J., & Julien, J.-F. (2019). Bat Pass Duration Measurement: An Indirect Measure of Distance of Detection. Diversity, 11(3), 47. https://doi.org/10.3390/d11030047