Genome-Wide Scan of the Gene Expression Kinetics of Salmonella enterica Serovar Typhi during Hyperosmotic Stress

Abstract
:1. Introduction
2. Materials and Methods
2.1 Bacterial cultures
2.2 Preparation of Salmonella oligo microarray and treatment of slides
2.3 RNA extraction and cDNA probe labeling
2.4 Hybridization and scanning
2.5 Data analysis
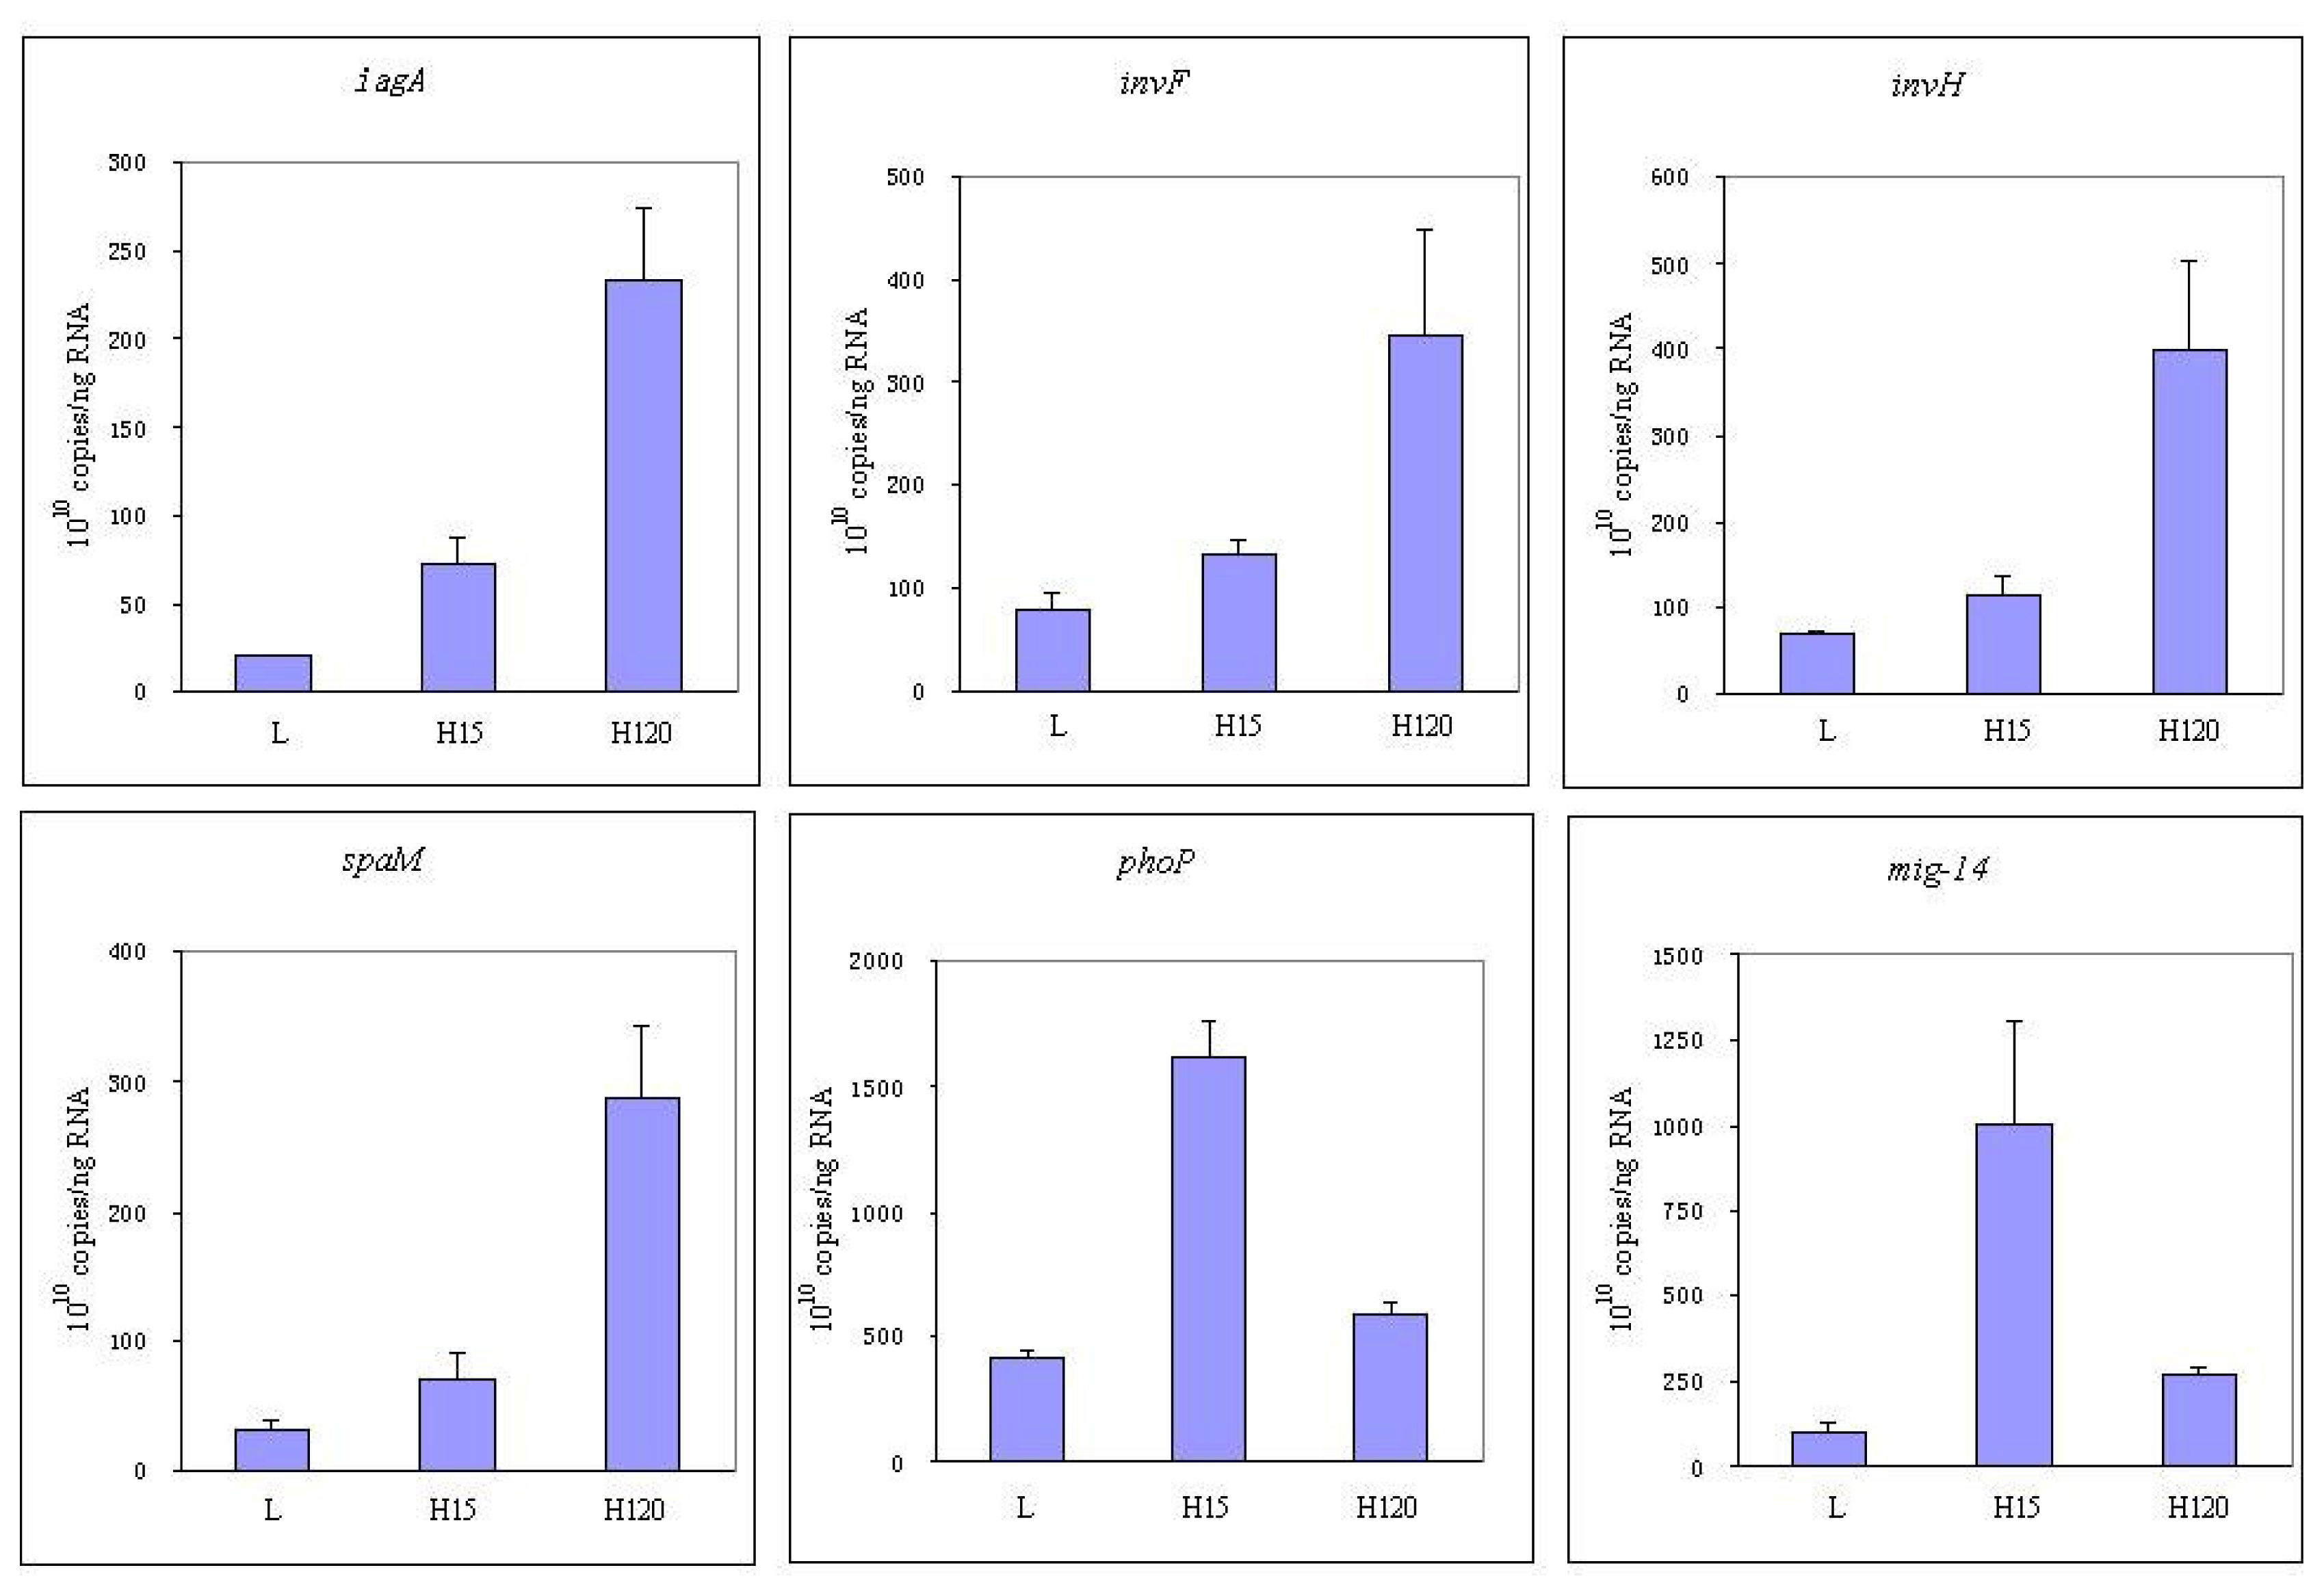
2.6 RT-PCR
3. Results
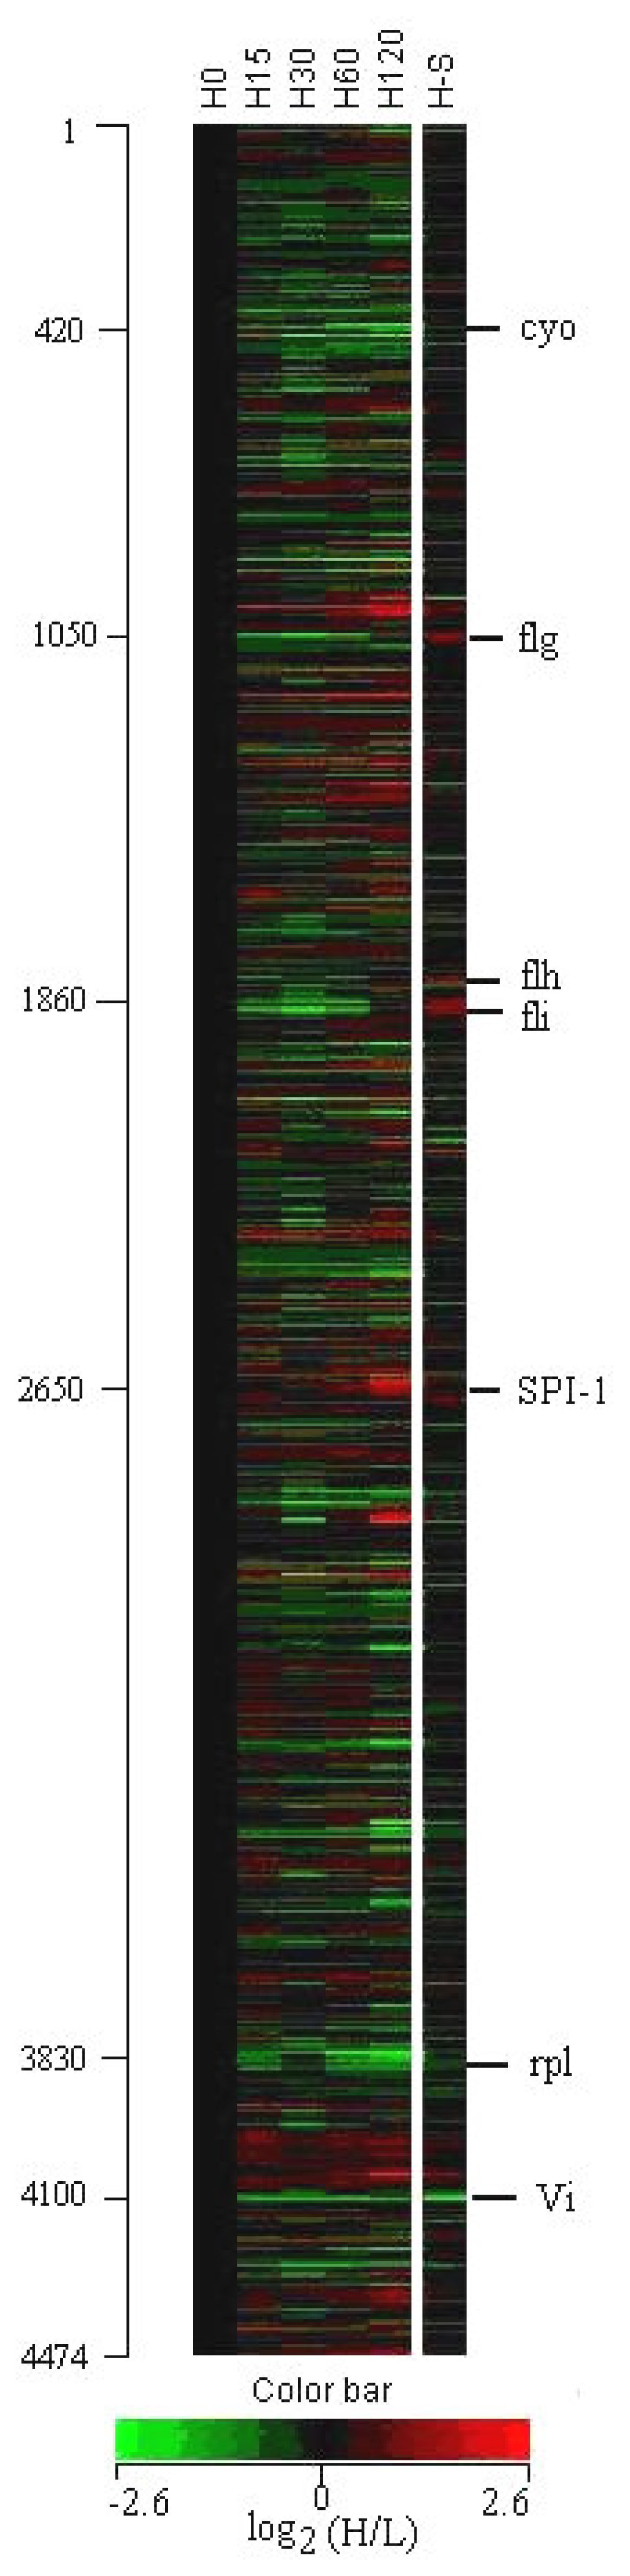
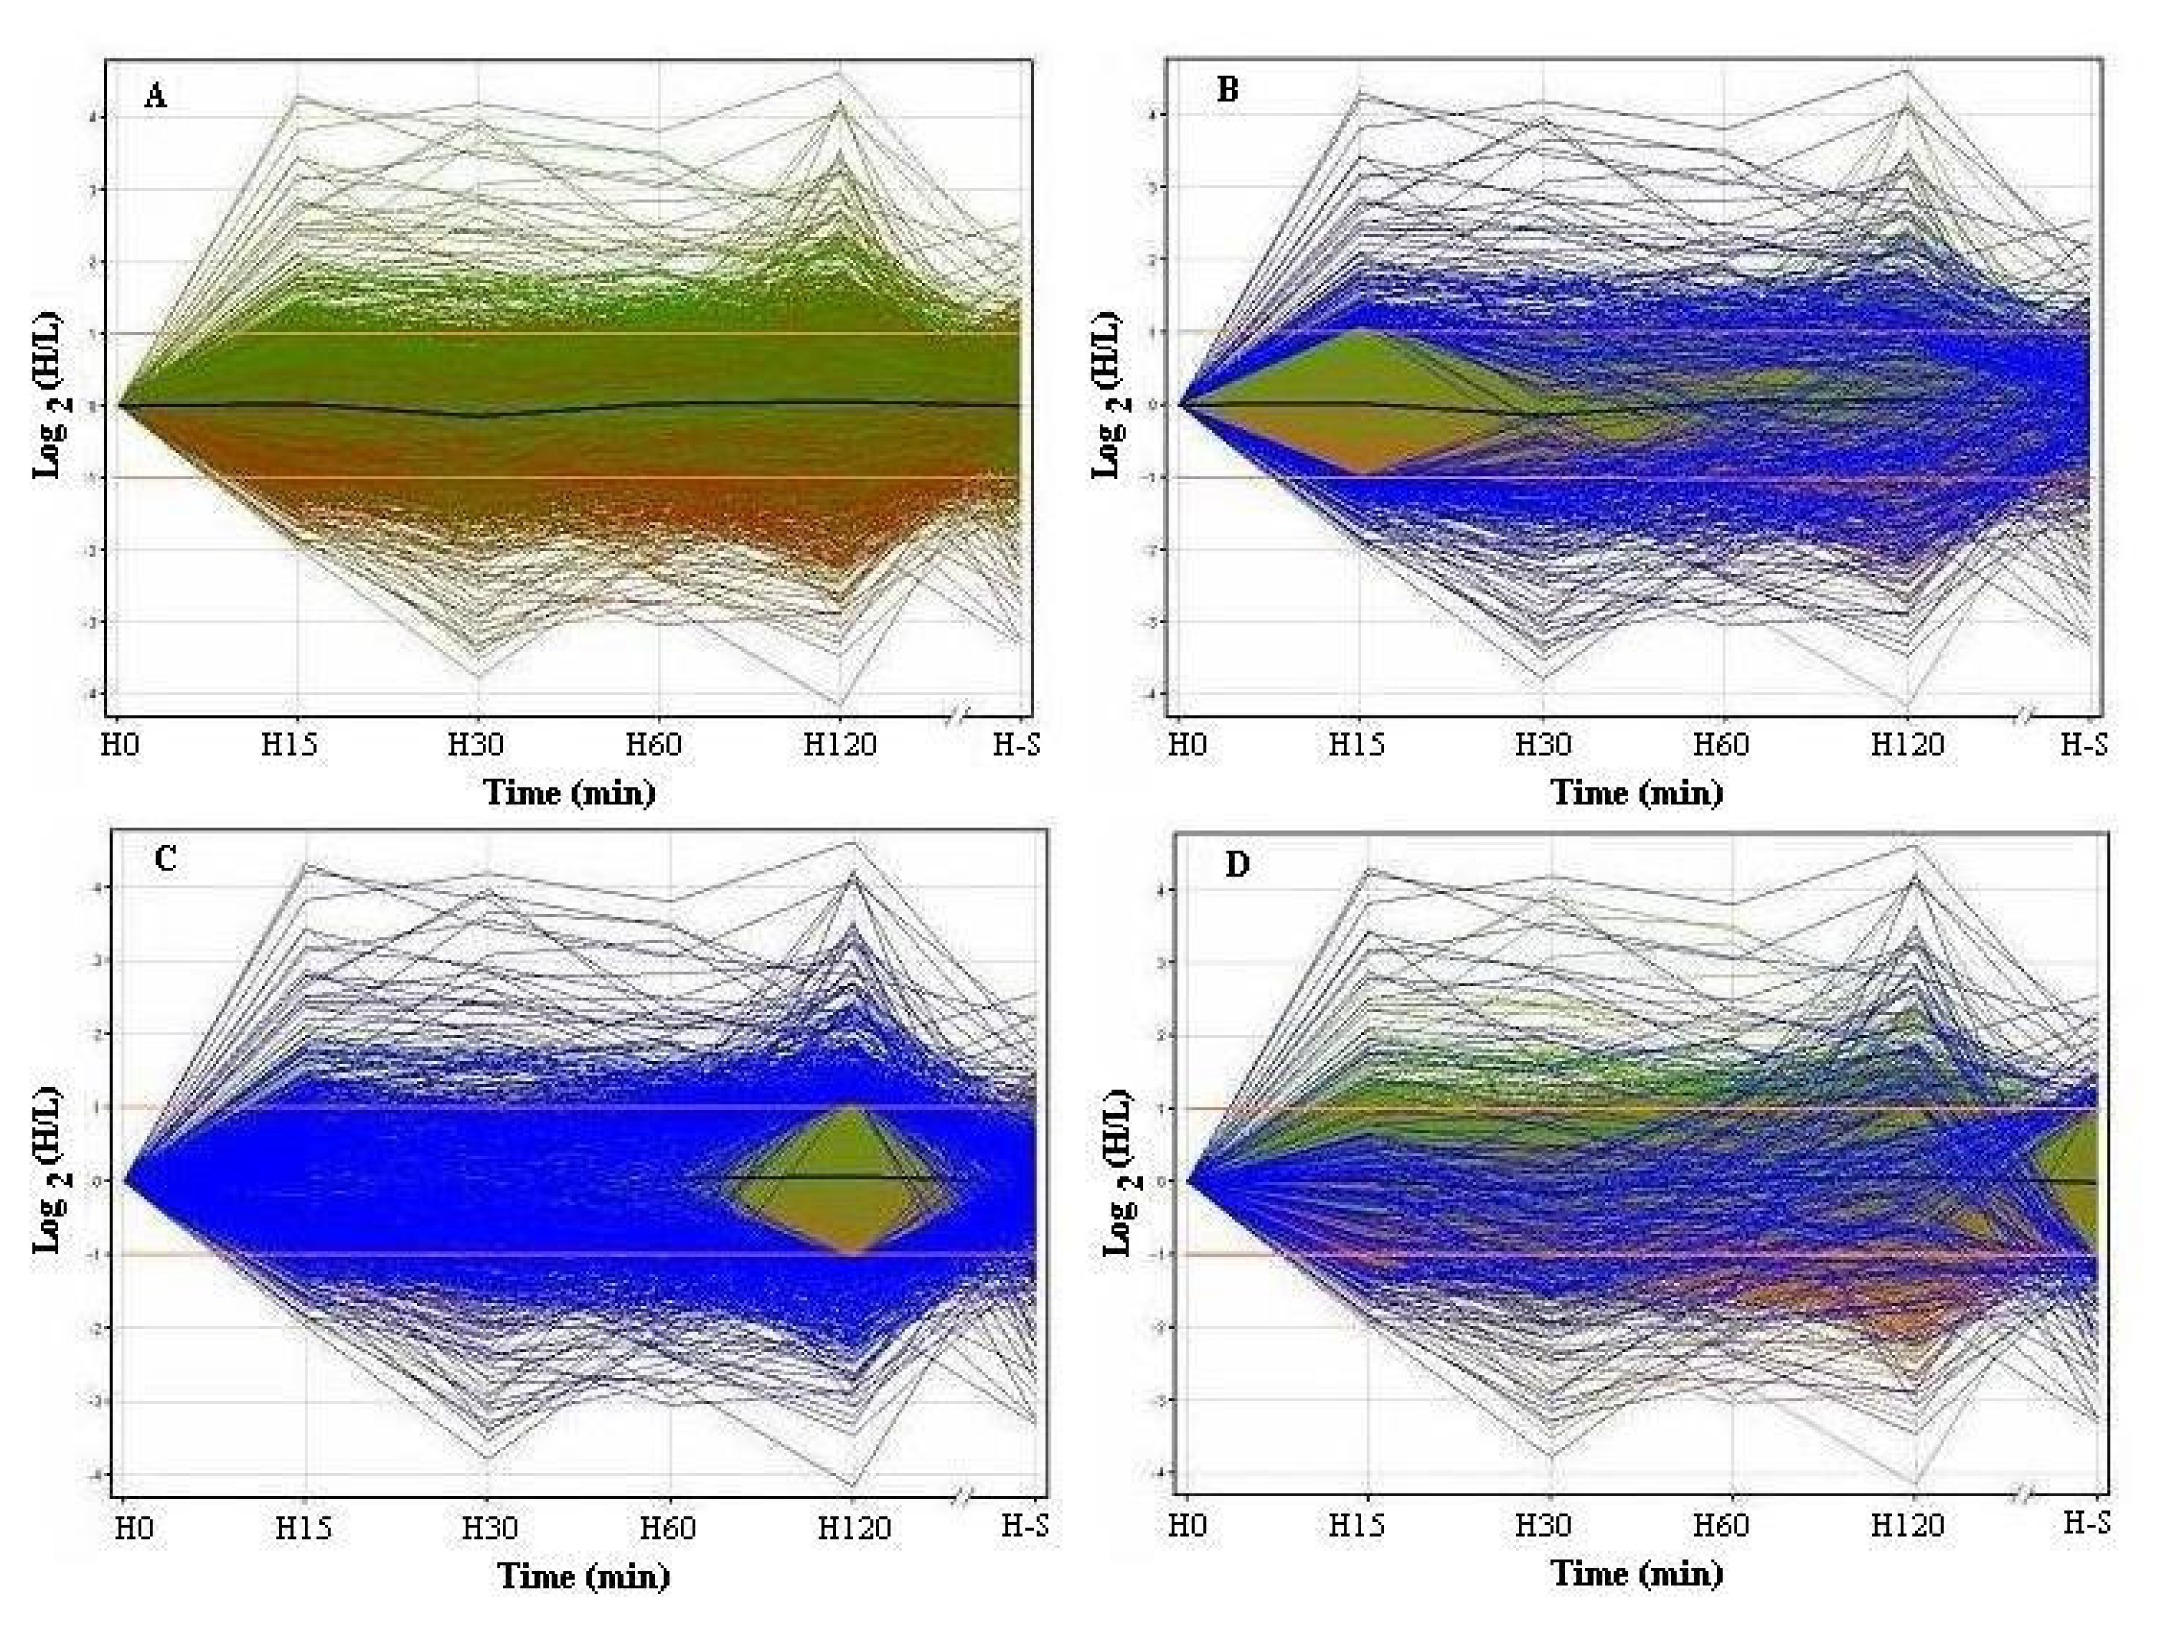
3.1 Profiles of genome-wide expression kinetics under osmotic up-shift conditions
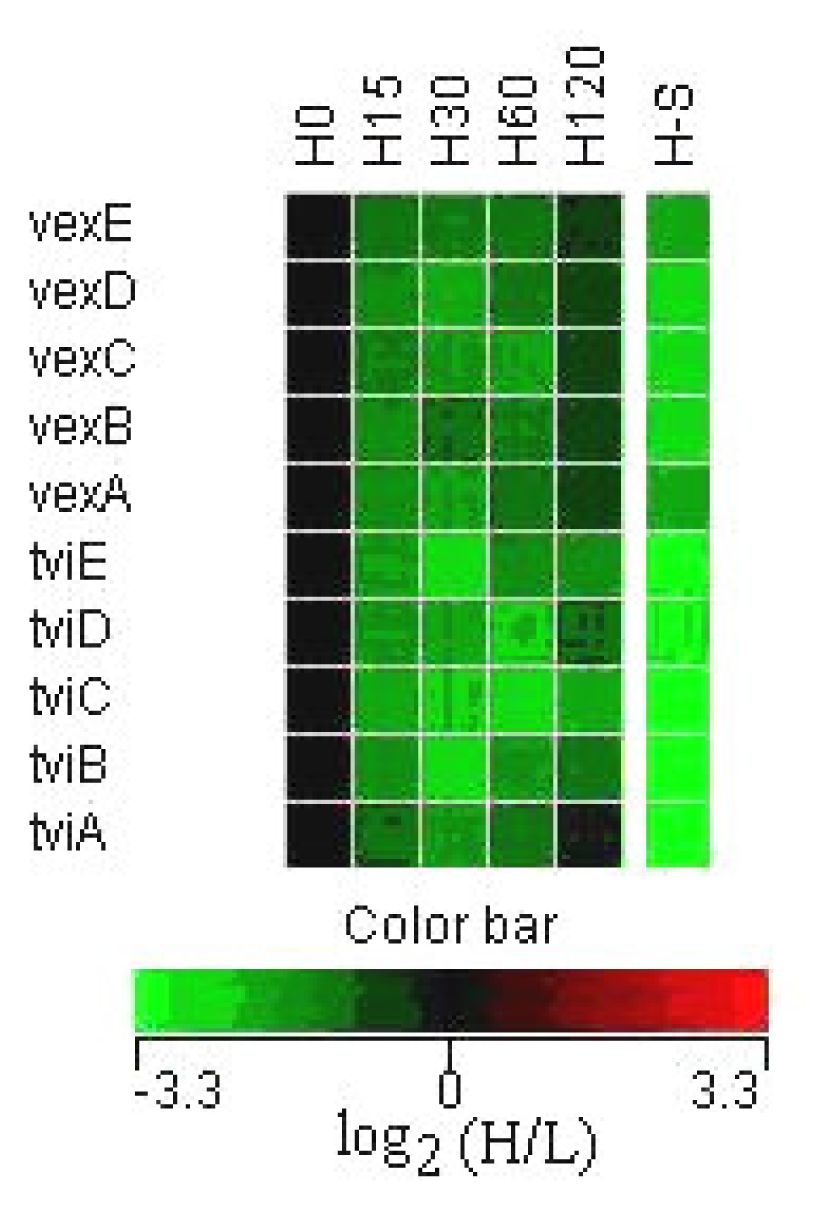
3.2 Expression of Vi capsular antigen genes
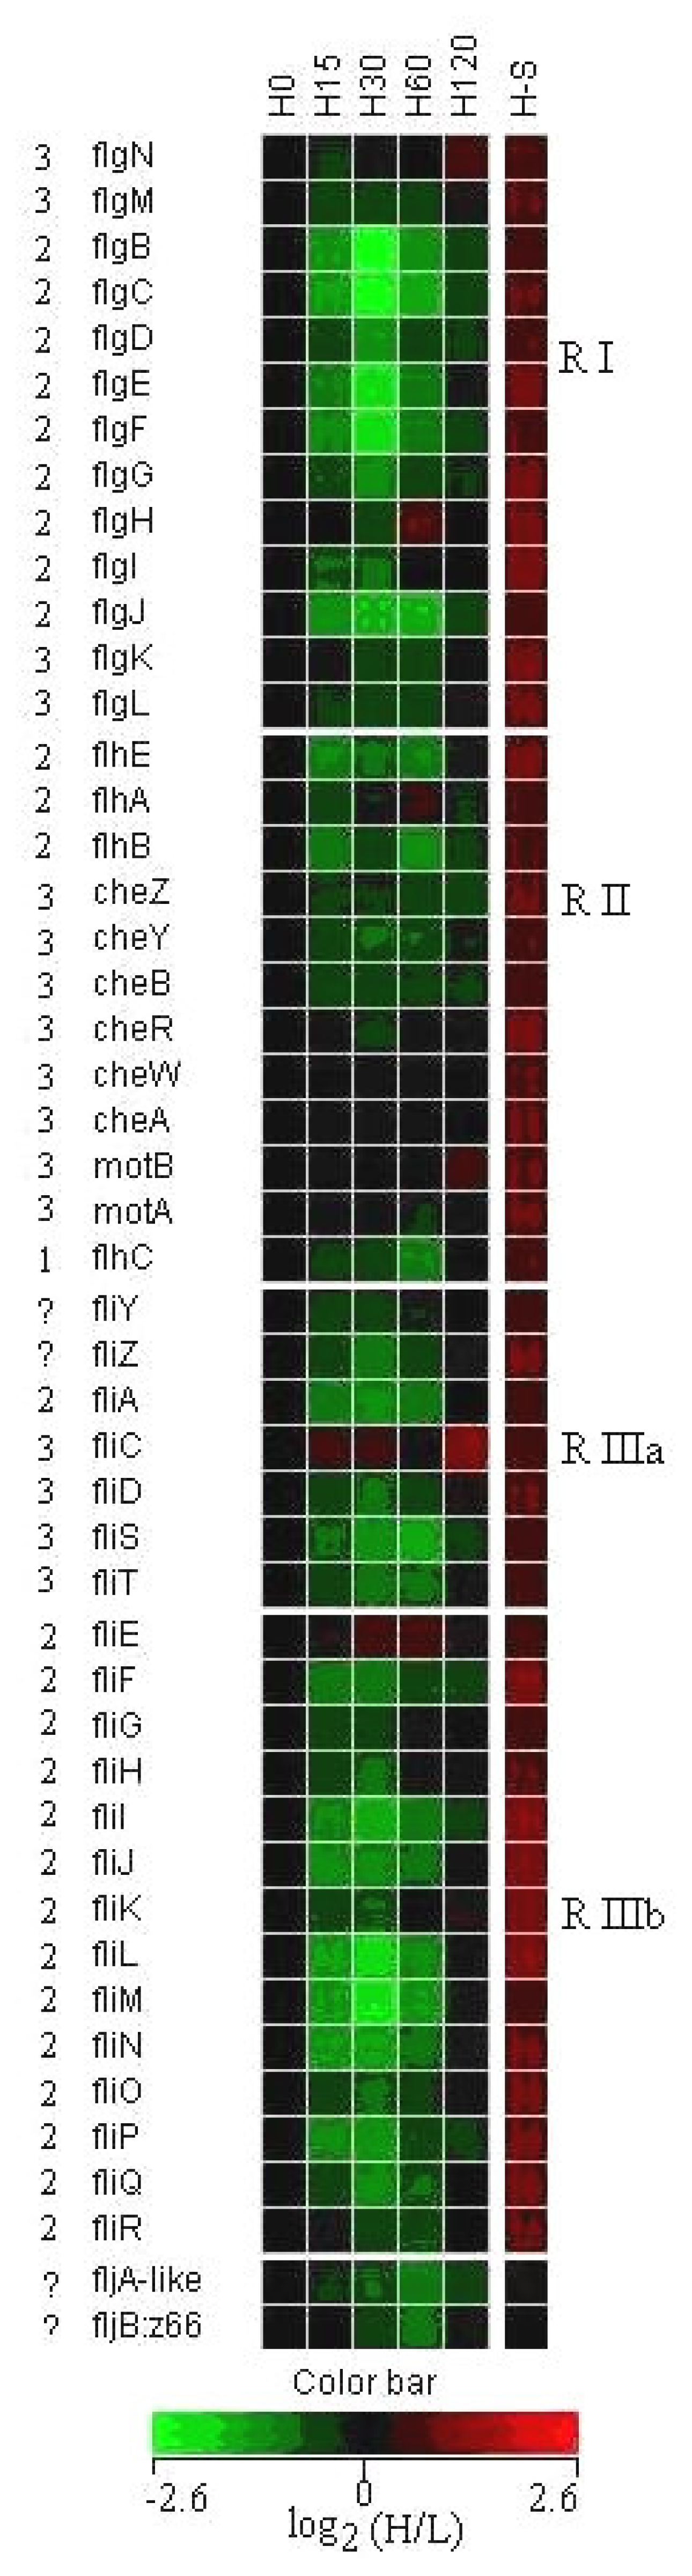
3.3 Expression of flagella and chemotaxis genes
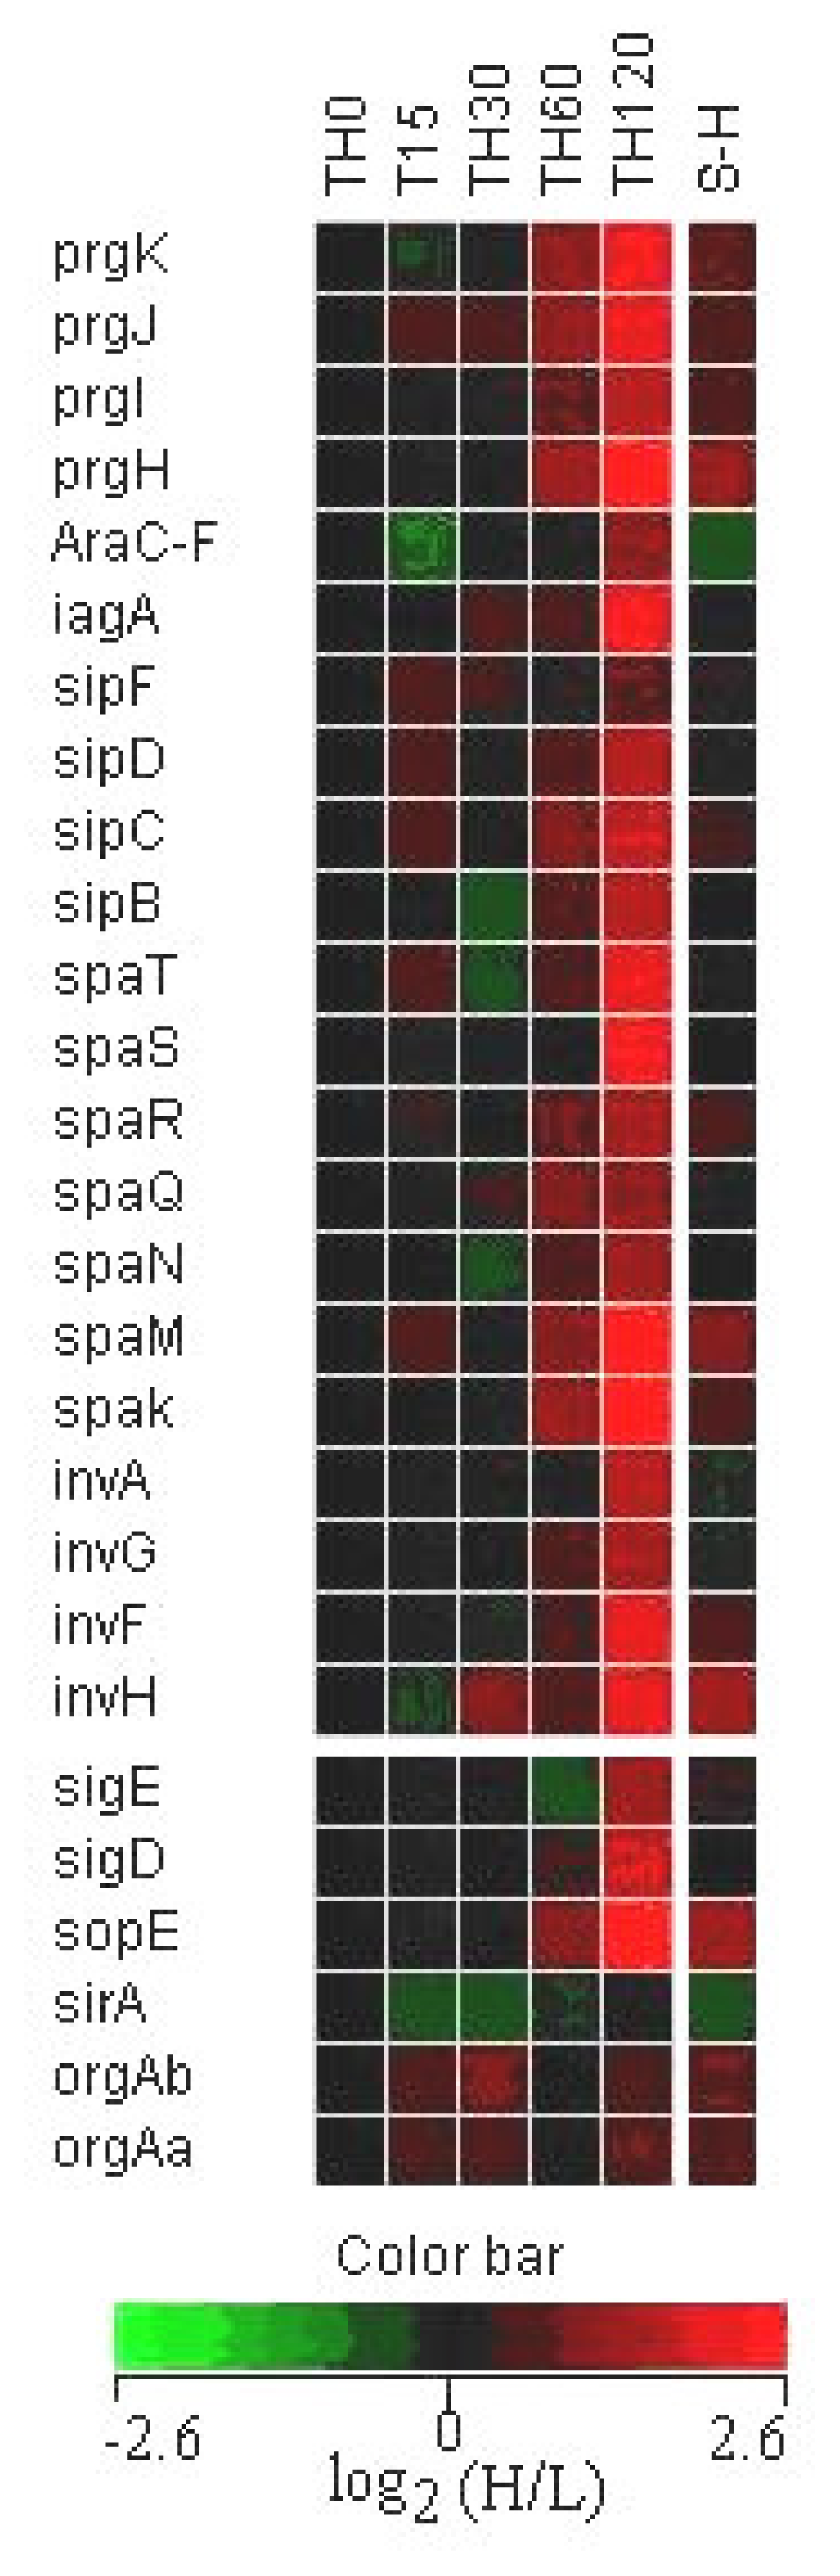
3.4 Expression of invasion relative genes
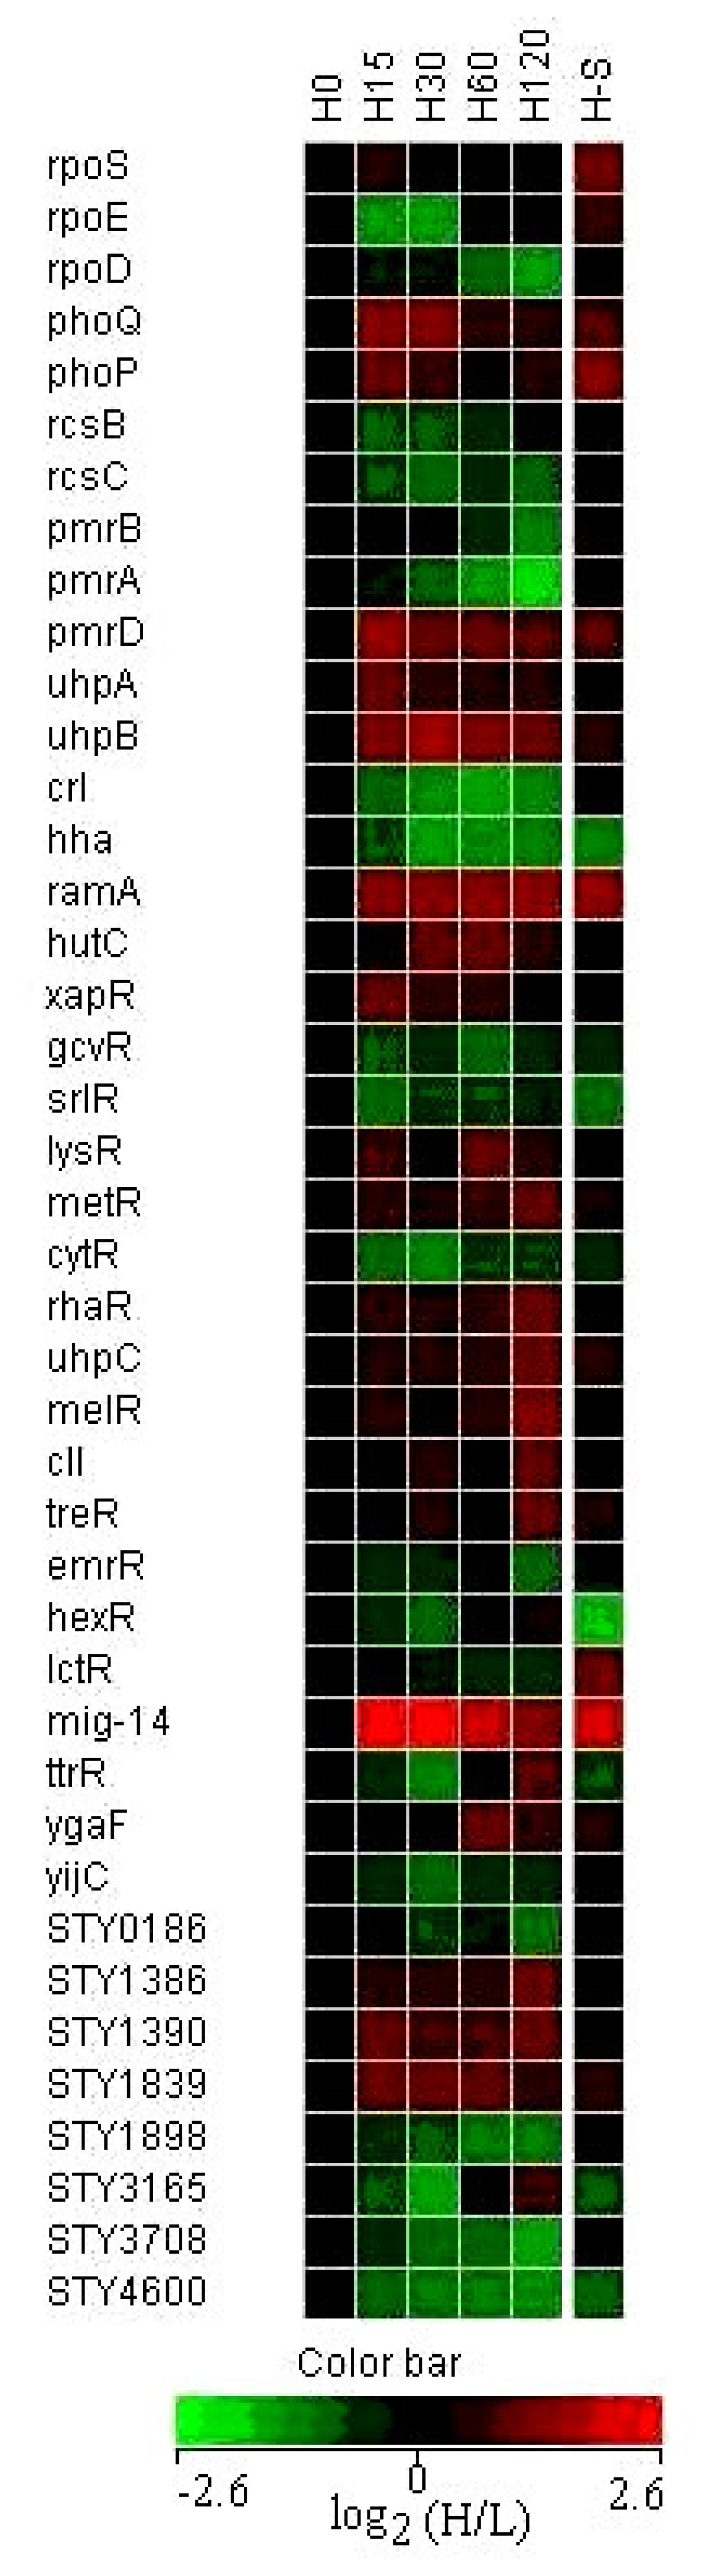
3.5 Expression of regulatory genes
4. Discussion
References and Notes
- Everest, P.; Wain, J.; Roberts, M.; Rook, G.; Dougan, G. The molecular mechanisms of severe typhoid fever. Trends Microbiol 2001, 9, 316–320. [Google Scholar]
- House, D.; Bishop, A.; Parry, C.; Dougan, G.; Wain, J. Typhoid fever: pathogenesis and disease. Curr. Opin. Infect. Dis 2001, 14, 573–578. [Google Scholar]
- Jones, B.D.; Falkow, S. Salmonellosis: host immune responses and bacterial virulence determinants. Annu. Rev. Immunol 1996, 14, 533–5361. [Google Scholar]
- Jones, B.D.; Lee, C.A.; Falkow, S. Invasion by Salmonella typhimurium is affected by the direction of flagellar rotation. Infect. Immun 1992, 60, 2475–2480. [Google Scholar]
- Liu, S.L.; Ezaki, T.; Miura, H.; Matsui, K.; Yabuuchi, E. Intact motility as a Salmonella typhi invasion-related factor. Infect. Immun 1988, 56, 1967–1973. [Google Scholar]
- Darwin, K.H.; Miller, V.L. Molecular basis of the interaction of Salmonella with the intestinal mucosa. Clin. Microbiol. Rev 1999, 12, 405–428. [Google Scholar]
- Zhao, L.; Ezak, T.; Li, Z.Y.; Kawamura, Y.; Hirose, K.; Watanabe, H. Vi-Suppressed wild strain Salmonella typhi cultured in high osmolarity is hyperinvasive toward epithelial cells and destructive of Peyer’s patches. Microbiol. Immunol 2001, 45, 149–158. [Google Scholar]
- Leclerc, G.J.; Tartera, C.; Metcalf, E.S. Environmental regulation of Salmonella typhi invasion-defective mutants. Infect. Immun 1998, 66, 682–691. [Google Scholar]
- Tartera, C.; Metcalf, E.S. Osmolarity and growth phase overlap in regulation of Salmonella typhi adherence to and invasion of human intestinal cells. Infect. Immun 1993, 61, 3084–3089. [Google Scholar]
- Bijlsma, J.J.; Groisman, E.A. Making informed decisions: regulatory interactions between two-component systems. Trends Microbiol 2003, 11, 359–366. [Google Scholar]
- Eguchi, Y.; Utsumi, R. A novel mechanism for connecting bacterial two-component signal-transduction systems. Trends Biochem. Sci 2005, 30, 70–72. [Google Scholar]
- Han, Y.; Zhou, D.; Pang, X.; Zhang, L.; Song, Y.; Tong, Z.; Bao, J.; Dai, E.; Wang, J.; Guo, Z.; Zhai, J.; Du, Z.; Wang, X.; Wang, J.; Huang, P.; Yang, R. Comparative transcriptome analysis of Yersinia pestis in response to hyperosmotic and high-salinity stress. Res. Microbiol 2005, 156, 403–415. [Google Scholar]
- Ruberg, S.; Tian, Z.X.; Krol, E.; Linke, B.; Meyer, F.; Wang, Y.; Puhler, A.; Weidner, S.; Becker, A. Construction and validation of a Sinorhizobium meliloti whole genome DNA microarray: genome-wide profiling of osmoadaptive gene expression. J. Biotechnol 2003, 106, 255–268. [Google Scholar]
- Kohbata, S.; Yokoyama, H.; Yabuuchi, E. Cytopathogenic effect of Salmonella typhi GIFU 10007 on M cells of murine ileal Peyer’s patches in ligated ileal loops: an ultrastructural study. Microbiol. Immunol 1986, 30, 1225–1237. [Google Scholar]
- Huang, X.; Phung, L.V.; Dejsirilert, S.; Tishyadhigama, P.; Li, Y.; Liu, H.; Hirose, K.; Kawamura, Y.; Ezaki, T. Cloning and characterization of the gene encoding the z66 antigen of Salmonella enterica serovar Typhi. FEMS Microbiol. Lett 2004, 234, 239–246. [Google Scholar]
- Conway, T.; Kraus, B.; Tucker, D.L.; Smalley, D.J.; Dorman, A.F.; McKibben, L. DNA array analysis in a Microsoft Windows environment. Biotechniques 2002, 32, 110–119. [Google Scholar]
- Brooks, C.S.; Hefty, P.S.; Jolliff, S.E.; Akins, D.R. Global analysis of Borrelia burgdorferi genes regulated by mammalian host-specific signals. Infect. Immun 2003, 71, 3371–3383. [Google Scholar]
- Hirose, K.; Ezaki, T.; Miyake, M.; Li, T.; Khan, A.; Kawamura, Y.; Yokoyama, H.; Takami, T. Survival of Vi-capsulated and Vi-deleted Salmonella typhi strains in cultured macrophage expressing different levels of CD14 antigen. FEMS Microbiol. Lett 1997, 147, 259–265. [Google Scholar]
- Daigle, F.; Graham, J.E.; Curtiss, R., 3rd. Identification of Salmonella typhi genes expressed within macrophages by selective capture of transcribed sequences (SCOTS). Mol. Microbiol 2001, 41, 1211–1222. [Google Scholar]
- Pickard, D.; Li, J.; Roberts, M.; Maskell, D.; Hone, D.; Levine, M.; Dougan, G.; Chatfield, S. Characterization of defined ompR mutants of Salmonella typhi: ompR is involved in the regulation of Vi polysaccharide expression. Infect. Immun 1994, 62, 3984–3993. [Google Scholar]
- Kutsukake, K.; Ohya, Y.; Iino, T. Transcriptional analysis of the flagellar regulon of Salmonella Typhimurium. J. Bacteriol 1990, 172, 741–747. [Google Scholar]
- Kutsukake, K.; Iino, T. Role of the FliA-FlgM regulatory system on the transcriptional control of the flagellar regulon and flagellar formation in Salmonella Typhimurium. J. Bacteriol 1994, 176, 3598–3605. [Google Scholar]
- Macnab, R.M. Flagella and motility. In Escherichia coli and Salmonella: cellular and molecular biology, 2nd ed; ASM Press: Washington DC, 1996; pp. 123–141. [Google Scholar]
- Wood, M.W.; Rosqvist, R.; Mullan, P.B.; Edwards, M.H.; Galyov, E.E. SopE, a secreted protein of Salmonella dublin, is translocated into the target eukaryotic cell via a sip-dependent mechanism and promotes bacterial entry. Mol. Microbiol 1996, 22, 327–338. [Google Scholar]
- Schlumberger, M.C.; Muller, A.J.; Ehrbar, K.; Winnen, B.; Duss, I.; Stecher, B.; Hardt, W.D. Real-time imaging of type III secretion: Salmonella SipA injection into host cells. Proc. Natl. Acad. Sci. USA 2005, 102, 12548–12553. [Google Scholar]
- Darwin, K.H.; Miller, V.L. The putative invasion protein chaperone SicA acts together with InvF to activate the expression of Salmonella typhimurium virulence genes. Mol. Microbiol 2000, 35, 949– 960. [Google Scholar]
- Groisman, E.A. The pleiotropic two-component regulatory system PhoP-PhoQ. J. Bacteriol 2001, 183, 1835–1842. [Google Scholar]
- Virlogeux, I.; Waxin, H.; Ecobichon, C.; Lee, J.O.; Popoff, M.Y. Characterization of the rcsA and rcsB genes from Salmonella typhi: rcsB through tviA is involved in regulation of Vi antigen synthesis. J. Bacteriol 1996, 178, 1691–1698. [Google Scholar]
- Hashimoto, Y.; Li, N.; Yokoyama, H.; Ezaki, T. Complete nucleotide sequence and molecular characterization of ViaB region encoding Vi antigen in Salmonella typhi. J. Bacteriol 1993, 175, 4456–4465. [Google Scholar]
- Teplitski, M.; Goodier, R.I.; Ahmer, B.M. Pathways leading from BarA/SirA to motility and virulence gene expression in Salmonella. J. Bacteriol 2003, 185, 7257–7265. [Google Scholar]
- Francez-Charlot, A.; Laugel, B.; Gemert, A.V.; Dubarry, N.; Wiorowski, F.; Castanie-Cornet, M.P.; Gutierrez, C.; Cam, K. RcsCDB His-Asp phosphorelay system negatively regulates the flhDC operon in Escherichia coli. Mol. Microbiol 2003, 49, 823–832. [Google Scholar]
- Arricau, N.; Hermant, D.; Waxin, H.; Ecobichon, C.; Duffey, P.S.; Popoff, M.Y. The RcsB-RcsC regulatory system of Salmonella typhi differentially modulates the expression of invasion proteins, flagellin and Vi antigen in response to osmolarity. Mol. Microbiol 1998, 29, 835–850. [Google Scholar]
- Ohnishi, K.; Kutsukake, K.; Suzuki, H.; Iino, T. Gene fliA encodes an alternative sigma factor specific for flagellar operons in Salmonella Typhimurium. Mol. Gen. Genet 1990, 221, 139–147. [Google Scholar]
- Chadsey, M.S.; Karlinsey, J.E.; Hughes, K.T. The flagellar anti-sigma factor FlgM actively dissociates Salmonella typhimurium sigma28 RNA polymerase holoenzyme. Genes. Dev 1998, 12, 3123–3136. [Google Scholar]
- Shin, S.; Park, C. Modulation of flagellar expression in Escherichia coli by acetyl phosphate and the osmoregulator OmpR. J. Bacteriol 1995, 177, 4696–4702. [Google Scholar]
- Adams, P.; Fowler, R.; Kinsella, N.; Howell, G.; Farris, M.; Coote, P.; O’Connor, C.D. Proteomic detection of PhoPQ- and acid-mediated repression of Salmonella motility. Proteomics 2001, 1, 597–607. [Google Scholar]
- Yamamoto, S.; Kutsukake, K. FljA-mediated posttranscriptional control of phase 1 flagellin expression in flagellar phase variation of Salmonella enterica serovar Typhimurium. J Bacteriol 2006, 188, 958–967. [Google Scholar]
- Johnston, C.; Pegues, D.A.; Hueck, C.J.; Lee, A.; Miller, S.I. Transcriptional activation of Salmonella typhimurium invasion genes by a member of the phosphorylated response-regulator superfamily. Mol. Microbiol 1996, 22, 715–727. [Google Scholar]
- Ahmer, B.M.; van Reeuwijk, J.; Watson, P.R.; Wallis, T.S.; Heffron, F. Salmonella SirA is a global regulator of genes mediating enteropathogenesis. Mol. Microbiol 1999, 31, 971–982. [Google Scholar]
- Goodier, R.I.; Ahmer, B.M. SirA orthologs affect both motility and virulence. J. Bacteriol 2001, 183, 2249–2258. [Google Scholar]
- Darwin, K.H.; Miller, V.L. InvF is required for expression of genes encoding proteins secreted by the SPI1 type III secretion apparatus in Salmonella Typhimurium. J. Bacteriol 1999, 181, 4949– 4954. [Google Scholar]
- Darwin, K.H.; Miller, V.L. The putative invasion protein chaperone SicA acts together with InvF to activate the expression of Salmonella typhimurium virulence genes. Mol. Microbiol 2000, 35, 949– 960. [Google Scholar]
- Munro, P.M.; Flatau, G.N.; Clement, R.L.; Gauthier, M.J. Influence of the RpoS (KatF) sigma factor on maintenance of viability and culturability of Escherichia coli and Salmonella typhimurium in seawater. Appl. Environ. Microbiol 1995, 61, 1853–1858. [Google Scholar]
- Eisenstark, A.; Calcutt, M.J.; Becker-Hapak, M.; Ivanova, A. Role of Escherichia coli rpoS and associated genes in defense against oxidative damage. Free Radic. Biol. Med 1996, 21, 975–993. [Google Scholar]
- Khan, A.Q.; Zhao, L.; Hirose, K.; Miyake, M.; Li, T.; Hashimoto, Y.; Kawamura, Y.; Ezaki, T. Salmonella typhi rpoS mutant is less cytotoxic than the parent strain but survives inside resting THP-1 macrophages. FEMS Microbiol. Lett 1998, 161, 201–208. [Google Scholar]
- Kenyon, W.J.; Sayers, D.G.; Humphreys, S.; Roberts, M.; Spector, M.P. The starvation-stress response of Salmonella enterica serovar Typhimurium requires σE-, but not CpxR-regulated extracytoplasmic functions. Microbiology 2002, 148, 113–122. [Google Scholar]
- Hiratsu, K.; Amemura, M.; Nashimoto, H.; Shinagawa, H.; Makino, K. The rpoE gene of Escherichia coli, which encodes sigma E, is essential for bacterial growth at high temperature. J. Bacteriol 1995, 177, 2918–2922. [Google Scholar]
- Testerman, T.L.; Vazquez-Torres, A.; Xu, Y.; Jones-Carson, J.; Libby, S.J.; Fang, F.C. The alternative sigma factor sigmaE controls antioxidant defences required for Salmonella virulence and stationary-phase survival. Mol. Microbiol 2002, 43, 771–782. [Google Scholar]
- Miticka, H.; Rowley, G.; Rezuchova, B.; Homerova, D.; Humphreys, S.; Farn, J.; Roberts, M.; Kormanec, J. Transcriptional analysis of the rpoE gene encoding extracytoplasmic stress response sigma factor sigmaE in Salmonella enterica serovar Typhimurium. FEMS Microbiol. Lett 2003, 226, 307–314. [Google Scholar]
- Missiakas, D.; Mayer, M.P.; Lemaire, M.; Georgopoulos, C.; Raina, S. Modulation of the Escherichia coli sigmaE (RpoE) heat-shock transcription-factor activity by the RseA, RseB and RseC proteins. Mol. Microbiol 1997, 24, 355–371. [Google Scholar]
- Dougherty, M.J.; Downs, D.M. A mutant allele of rpoD results in increased conversion of aminoimidazole ribotide to hydroxymethyl pyrimidine in Salmonella enterica. J. Bacteriol 2004, 186, 4034–4037. [Google Scholar]
- Caslake, L.F.; Ashraf, S.I.; Summers, A.O. Mutations in the alpha and sigma-70 subunits of RNA polymerase affect expression of the mer operon. J. Bacteriol 1997, 179, 1787–1795. [Google Scholar]
- Wick, L.M.; Egli, T. Molecular components of physiological stress responses in Escherichia coli. Adv. Biochem. Eng. Biotechnol 2004, 89, 1–45. [Google Scholar]
- Miller, S.I.; Kukral, A.M.; Mekalanos, J.J. A two-component regulatory system (phoP phoQ) controls Salmonella typhimurium virulence. Proc. Natl. Acad. Sci. USA 1989, 86, 5054–5058. [Google Scholar]
- Bearson, B.L.; Wilson, L.; Foster, J.W. A low pH-inducible, PhoPQ-dependent acid tolerance response protects Salmonella typhimurium against inorganic acid stress. J. Bacteriol 1998, 180, 2409–2417. [Google Scholar]
- van Velkinburgh, J.C.; Gunn, J.S. PhoP-PhoQ-regulated loci are required for enhanced bile resistance in Salmonella spp. Infect. Immun 1999, 67, 1614–1622. [Google Scholar]
- Hagiwara, D.; Sugiura, M.; Oshima, T.; Mori, H.; Aiba, H.; Yamashino, T.; Mizuno, T. Genome-wide analyses revealing a signaling network of the RcsC-YojN-RcsB phosphorelay system in Escherichia coli. J. Bacteriol 2003, 185, 5735–5746. [Google Scholar]
- Zwir, I.; Shin, D.; Kato, A.; Nishino, K.; Latifi, T.; Solomon, F.; Hare, J.M.; Huang, H.; Groisman, E.A. Dissecting the PhoP regulatory network of Escherichia coli and Salmonella enterica. Proc. Natl. Acad. Sci. USA 2005, 102, 2862–2867. [Google Scholar]
- Lee, A.K.; Detweiler, C.S.; Falkow, S. OmpR regulates the two-component system SsrA-SsrB in Salmonella pathogenicity island 2. J. Bacteriol 2000, 182, 771–781. [Google Scholar]
- Feng, X.; Oropeza, R.; Kenney, L.J. Dual regulation by phospho-OmpR of ssrA/B gene expression in Salmonella pathogenicity island 2. Mol. Microbiol 2003, 48, 1131–1143. [Google Scholar]
- Bernardini, M.L.; Fontaine, A.; Sansonetti, P.J. The two-component regulatory system ompR-envZ controls the virulence of Shigella flexneri. J. Bacteriol 1990, 172, 6274–6281. [Google Scholar]
- Gibson, M.M.; Ellis, E.M.; Graeme-Cook, K.A.; Higgins, C.F. OmpR and EnvZ are pleiotropic regulatory proteins,ppabcxyzpppositive regulation of the tripeptide permease (tppB) of Salmonella typhimurium. Mol. Gen. Genet 1987, 207, 120–129. [Google Scholar]
- Lucas, R.L.; Lostroh, C.P.; DiRusso, C.C.; Spector, M.P.; Wanner, B.L.; Lee, C.A. Multiple factors independently regulate hilA and invasion gene expression in Salmonella enterica serovar Typhimurium. J. Bacteriol 2000, 182, 1872–1882. [Google Scholar]
- Rampersaud, A.; Harlocker, S.L.; Inouye, M. The OmpR protein of Escherichia coli binds to sites in the ompF promoter region in a hierarchical manner determined by its degree of phosphorylation. J. Biol. Chem 1994, 269, 12559–12566. [Google Scholar]


| Genes | Forward primers | Reverse Primers |
|---|---|---|
| iagA | 5′-TTCATGGCTGGTCAGTTG | 5′-GGGATCCTGTTTCCATCTT |
| invF | 5′-TGTGAAGGCGATGAGTAA | 5′-CGTTGTCGCACCAGTATC |
| invH | 5′-TTTTACTGATCGGCTGTG | 5′-TAAGGCTTGCAGTCTTTCAT |
| spaM | 5′-CTCCTCTGACTCGGCCTCT | 5′-ATTCGCTGACCAGAATTA |
| phoP | 5′-GAAGGCTGGCAGGATAAAGT | 5′-CCGTGAGTTTGATGACCTCT |
| mig-14 | 5′-AACCTTCCCGCTATCTTC | 5′-AGTGGCCTGCATTCATTT |
| Functional kinds | Up-shift 15 min | Up-shift 120 min | Steady Hyperosmotics | |||
|---|---|---|---|---|---|---|
| decreased | induced | decreased | induced | decreased | induced | |
| Total number | 170 | 212 | 400 | 489 | 112 | 85 |
| Regulators and putative regulators | 4 | 12 | 17 | 22 | 5 | 6 |
| Virulence and putative virulence proteins | 4 | 1 | 1 | 15 | 8 | |
| Flagella and chemotaxis cluster proteins | 15 | 1 | 26 | |||
| Secreted and putative secreted proteins | 1 | 5 | 2 | 20 | 1 | 1 |
| Membrane and putative membrane proteins | 6 | 24 | 18 | 45 | 5 | 3 |
| Vi antigen relative proteins | 9 | 3 | 10 | |||
| Fimbrial relative proteins | 4 | 1 | ||||
| Ribosomal proteins | 11 | 1 | 46 | 1 | ||
| DNA replication related proteins | 1 | 7 | 1 | |||
| drug resistance proteins | 2 | 6 | 1 | 1 | ||
| Metabolic enzymes and putative enzymes | 57 | 51 | 136 | 147 | 38 | 15 |
| Heat shock and cold shock proteins | 5 | 1 | 1 | 1 | ||
| Other functional proteins | 31 | 30 | 83 | 58 | 18 | 10 |
| Unknown function proteins | 30 | 78 | 80 | 177 | 34 | 14 |
© 2007 by MDPI Reproduction is permitted for noncommercial purposes.
Share and Cite
Huang, X.; Xu, H.; Sun, X.; Ohkusu, K.; Kawamura, Y.; Ezaki, T. Genome-Wide Scan of the Gene Expression Kinetics of Salmonella enterica Serovar Typhi during Hyperosmotic Stress. Int. J. Mol. Sci. 2007, 8, 116-135. https://doi.org/10.3390/i8020116
Huang X, Xu H, Sun X, Ohkusu K, Kawamura Y, Ezaki T. Genome-Wide Scan of the Gene Expression Kinetics of Salmonella enterica Serovar Typhi during Hyperosmotic Stress. International Journal of Molecular Sciences. 2007; 8(2):116-135. https://doi.org/10.3390/i8020116
Chicago/Turabian StyleHuang, Xinxiang, Huaxi Xu, Xiaosong Sun, Kiyofumi Ohkusu, Yoshiaki Kawamura, and Takayuki Ezaki. 2007. "Genome-Wide Scan of the Gene Expression Kinetics of Salmonella enterica Serovar Typhi during Hyperosmotic Stress" International Journal of Molecular Sciences 8, no. 2: 116-135. https://doi.org/10.3390/i8020116
APA StyleHuang, X., Xu, H., Sun, X., Ohkusu, K., Kawamura, Y., & Ezaki, T. (2007). Genome-Wide Scan of the Gene Expression Kinetics of Salmonella enterica Serovar Typhi during Hyperosmotic Stress. International Journal of Molecular Sciences, 8(2), 116-135. https://doi.org/10.3390/i8020116