Effect of Antioxidant (Turmeric, Turmerin and Curcumin) on Human Immunodeficiency Virus

Abstract
:Introduction
Materials and Methods
Results

| Drug Treatment | (-) AZT | (+) AZT |
| T (100µg/ml) | 5.2 | 21.1 |
| T (10 µg/ml) | 201.7 | 10.5 |
| Cu (100µg/ml) | 46.6 | 63.2 |
| Cu (10µg/ml) | 184.5 | 5.3 |
| Tm (800ng/ml) | 63.8 | -36.8 |
| Tm (80ng/ml) | 115.5 | -26.3 |
| Drug Treatment | (-) AZT | (+) AZT |
| T (100µg/ml) | -50.0 | -20.0 |
| T (10 µg/ml) | -38.9 | 50.0 |
| Cu (100µg/ml) | -22.2 | -10.0 |
| Cu (10µg/ml) | -11.1 | 50.0 |
| Tm (800ng/ml) | -11.1 | 30.0 |
| Tm (80ng/ml) | -16.7 | 60.0 |
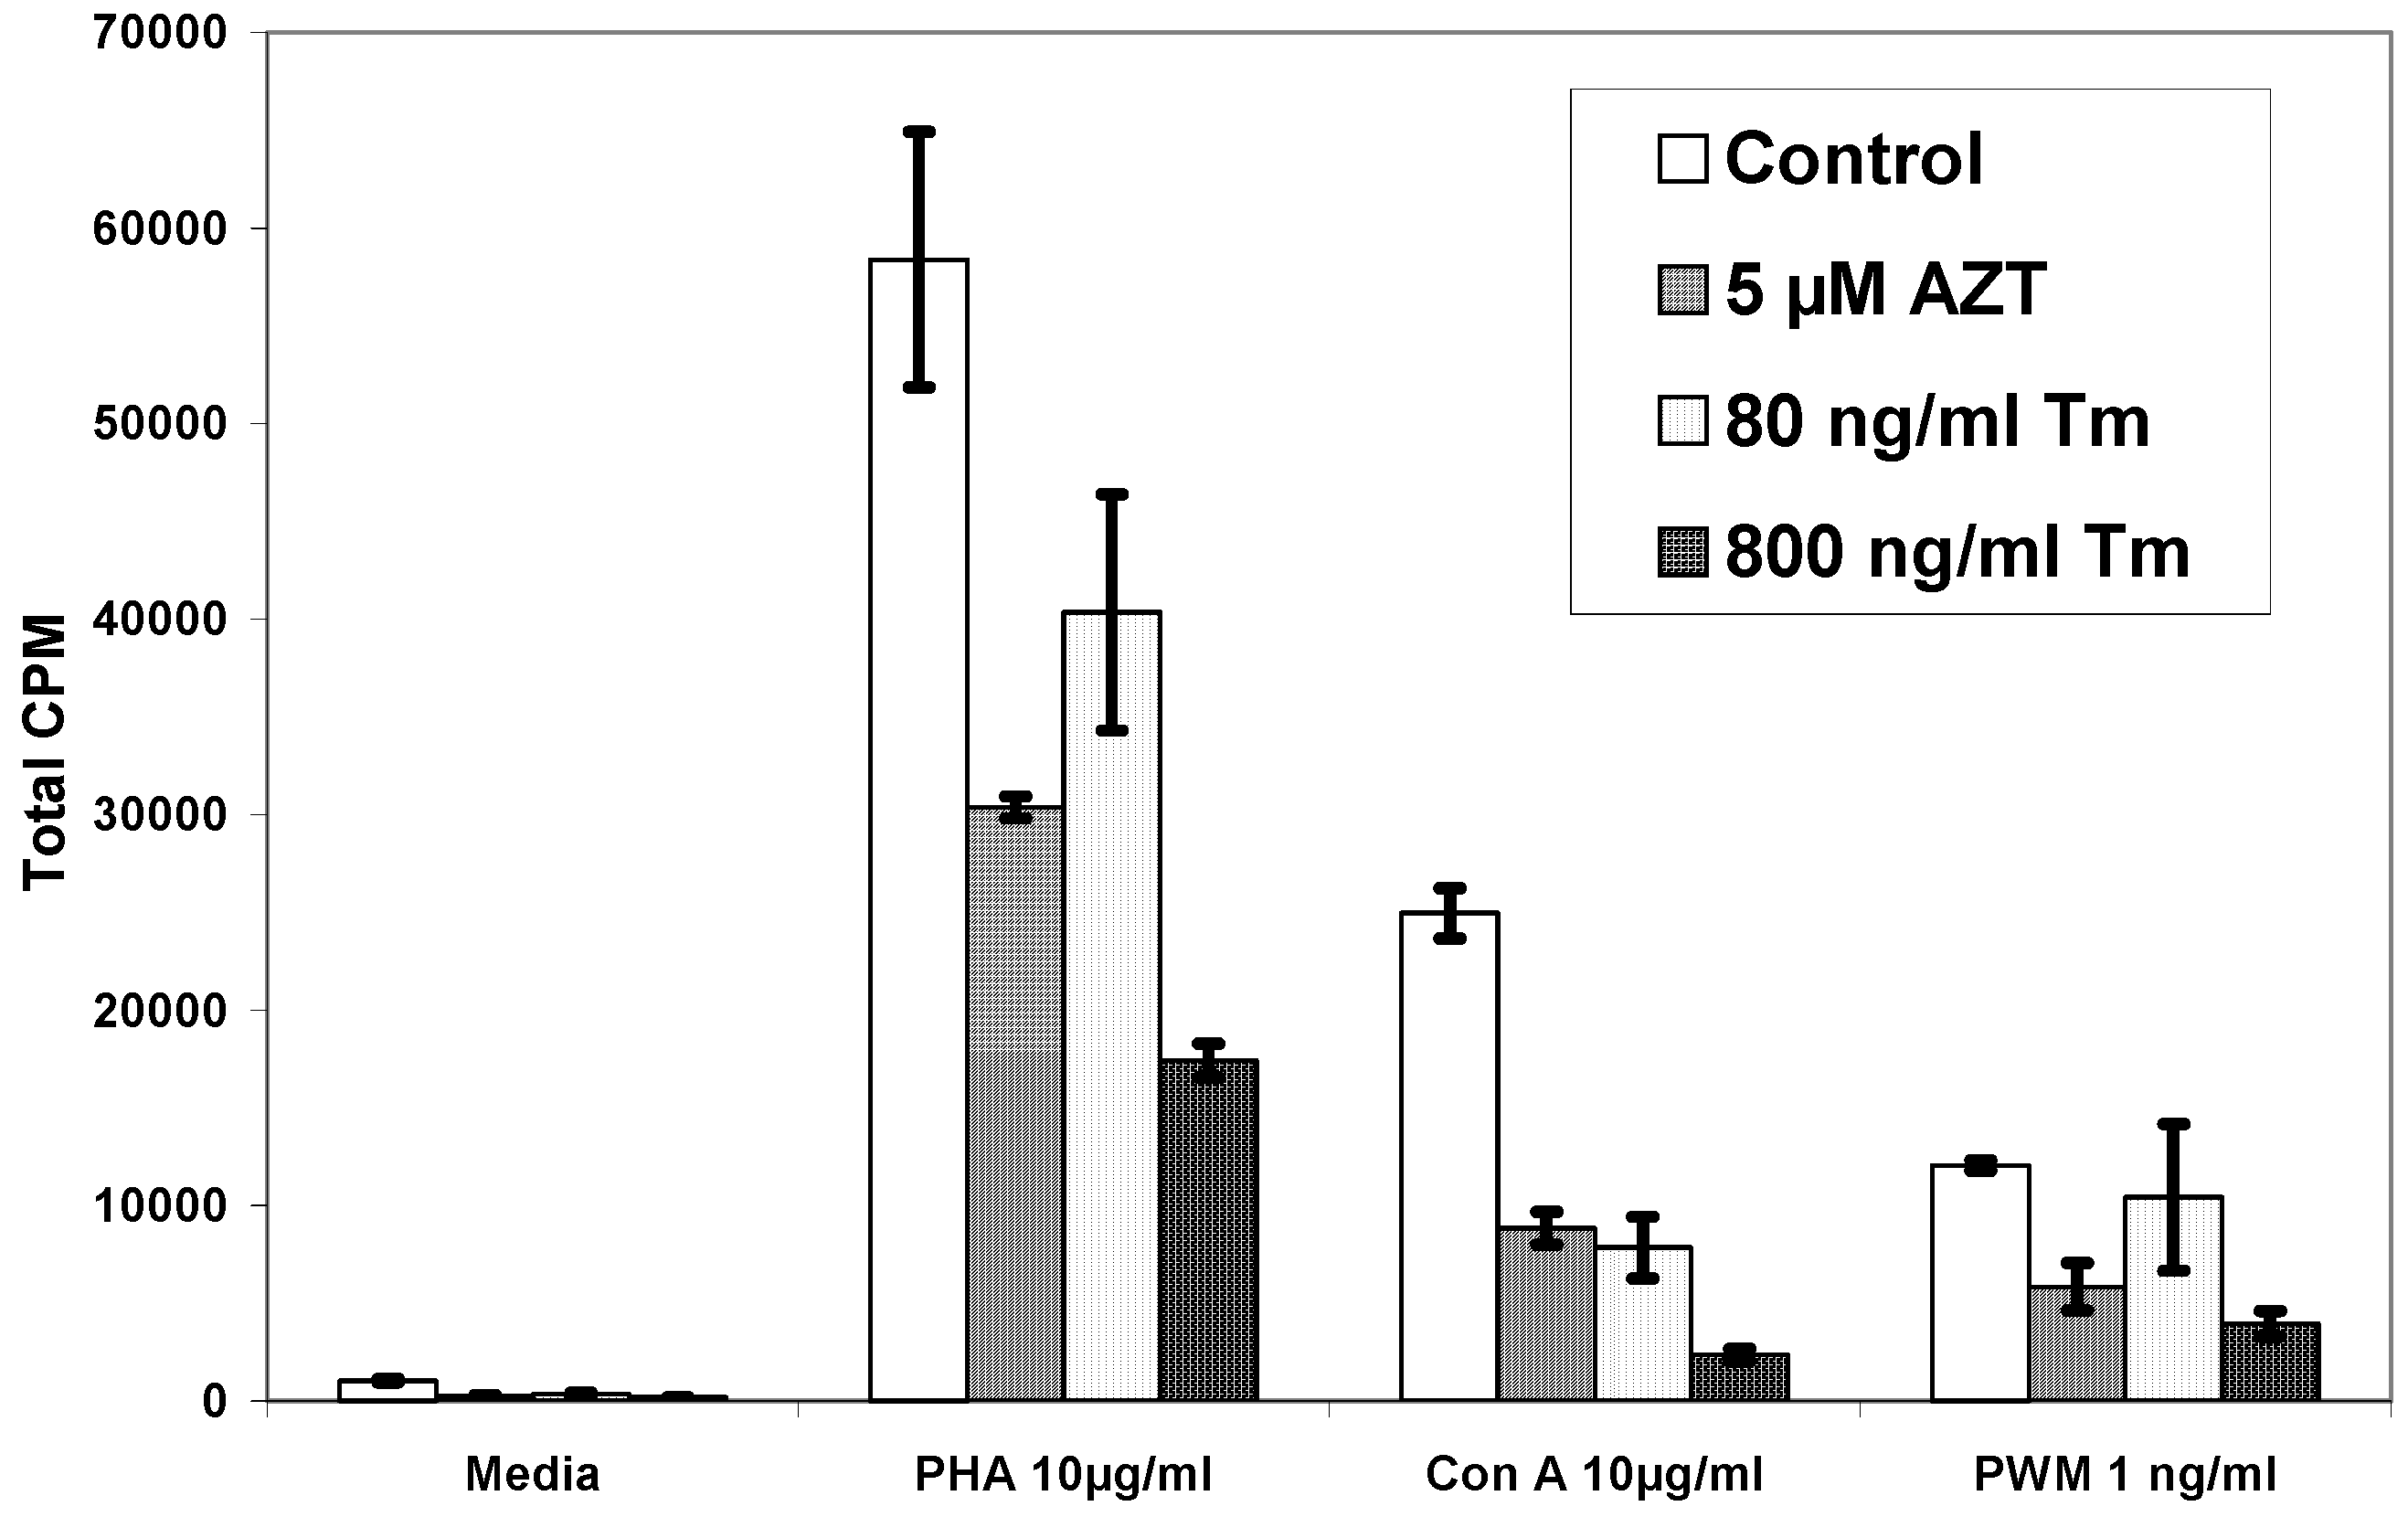
| Pt# | Media | PHA | PHA+AZT 5µM | PHA+Tm80ng/ml | PHA+Tm 800ng/ml |
| 1 | 1,048±69 | 58,377±6,534 | 30,373±561 | 40,388±6,041 | 17,431±870 |
| 2 | 235±98 | 28,727±1,815 | 15,050±3,597 | 32,170±1,496 | N.D. |
| 3 | 1,603±417 | 323,061±43,362 | 229,133±11,376 | 367,124±35,117 | N.D. |
| 4 | 1,307±313 | 44,758±9,154 | 33,552±4,370 | 41,579±4,969 | 25,476±3,745 |
| 5 | 474±140 | 284,041±12,721 | N.D. | 129,729±2,465 | 22,643±3,754 |
| 6 | 973±152 | 56,5021±1,602 | N.D. | 227,385±16,031 | 30,503±5,964 |
| 7 | 847±190 | 43,725±3,197 | N.D. | 38,530±2,443 | 1,218±130 |
| 8 | 767±92 | 28,988±97 | N.D. | 26,305±1,206 | 2,245±655 |
| 9 | 1,690±615 | 24,191±394 | N.D. | 20,145±470 | 3,612±970 |
| 10 | 1,422±64 | 59,369±971 | N.D. | 46,999±2,112 | 3,207±390 |
| Pt# | Media | Con A | Con A+AZT 5µM | Con A+Tm80ng/ml | Con A+Tm 800ng/ml |
| 1 | 1,048±69 | 24,962±1,286 | 8,849±833 | 7,862±1,584 | 2,364±305 |
| 2 | 235±98 | 1,099±747 | 499±101 | 233±120 | N.D. |
| 3 | 1,603±417 | 261,903±16,282 | 145,582±7,796 | 147,782±1,759 | N.D. |
| 4 | 1,307±313 | 25,130±148 | 17,163±5,742 | 15,157±4,345 | 5,530±1,192 |
| 5 | 474±140 | 132,930±16,300 | N.D. | 37,777±6,429 | 9,530±1,198 |
| 6 | 973±152 | 265,056±26,172 | N.D. | 130,535±20,361 | 29,437±11,618 |
| 7 | 847±190 | 26,001±2,772 | N.D. | 17,535±2,736 | 372±72 |
| 8 | 767±92 | 14,638±154 | N.D. | 12,244±165 | 1,560±599 |
| 9 | 1,690±615 | 8,236±54 | N.D. | 7,463±1,171 | 3,714±552 |
| 10 | 1,422±64 | 20,456±1,120 | N.D. | 14,164±1,654 | 1,921±471 |
| Pt# | Media | PWM | PWM+AZT 5µM | PWM+Tm80ng/ml | PWM+Tm 800ng/ml |
| 1 | 1,048±69 | 12,056±276 | 5,851±1,203 | 10,427±3,763 | 3,967±663 |
| 2 | 235±98 | 4,503±1,365 | 2,396±538 | 4,886±654 | N.D. |
| 3 | 1,603±417 | 82,535±18,509 | 50,016±8,365 | 72,954±6,993 | N.D. |
| 4 | 1,307±313 | 14,148±5,056 | 9,795±1,322 | 15,485±1,544 | 9,736±624 |
| 5 | 474±140 | 123,251±2,597 | N.D. | 63,382±6,358 | 11,847±1,809 |
| 6 | 973±152 | 202,760±21,170 | N.D. | 81,732±2,815 | 4,816±192 |
| 7 | 847±190 | 22,593±3,419 | N.D. | 17,625±992 | 14,529±884 |
| 8 | 767±92 | 5,166±165 | N.D. | 4,772±259 | 1,361±83 |
| 9 | 1,690±615 | 3,662±187 | N.D. | 4,816±192 | 3,454±600 |
| 10 | 1,422±64 | 16,382±694 | N.D. | 14,529±884 | 1,376±260 |

Discussion
Acknowledgements
References
- Shalini, V. K.; Srinivas, L. Lipid peroxide-induced DNA damage: protection by turmeric (Curcuma longa). Mol. Cell. Biochem. 1987, 77, 3–10. [Google Scholar] [CrossRef] [PubMed]
- Shalini, V. K.; Srinivas, L. Fuel smoke condensate-induced DNA damage in human lymphocytes and protection by turmeric (Curcuma longa). Mol. Cell. Biochem. 1990, 95, 21–30. [Google Scholar] [CrossRef] [PubMed]
- Srinivas, L.; Shalini, V. K.; Shylaja, M. Turmerin: a water soluble antioxidant peptide from turmeric [Curcuma longa]. Arch. Biochem. Biophys. 1992, 292, 617–623. [Google Scholar] [CrossRef] [PubMed]
- Srinivas, L.; Shalini, V. K. DNA damage by smoke: protection by turmeric and other inhibitors of ROS. Free Radic. Biol. Med. 1991, 11, 277–283. [Google Scholar] [CrossRef] [PubMed]
- Mazumder, A.; Raghavan, K.; Weinstein, J.; Kohn, K. W.; Pommier, Y. Inhibition of human immunodeficiency virus type-1 integrase by curcumin. Biochem. Pharm. 1995, 49, 1165–1170. [Google Scholar] [CrossRef] [PubMed]
- Burke, T. R., Jr.; Fesen, M. R.; Mazumder, A.; Wang, J.; Carothers, A. M.; Grunberger, D.; Driscoll, J.; Kohn, K.; Pommier, Y. Hydroxylated aromatic inhibitors of HIV-1 integrase. J. Med. Chem. 1995, 38, 4171–4178. [Google Scholar] [CrossRef] [PubMed]
- Sui, Z.; Salto, R.; Li, J.; Craik, C.; Ortiz de Montellano, P. R. Inhibition of the HIV-1 and HIV-2 proteases by curcumin and curcumin boron complexes. Bioorg. Med. Chem. 1993, 1, 415–422. [Google Scholar] [CrossRef] [PubMed]
- Li, C. J.; Zhang, L. J.; Dezube, B. J.; Crumpacker, C. S.; Pardee, A. B. Three inhibitors of type 1 human immunodeficiency virus long terminal repeat-directed gene expression and virus replication. Proc. Natl. Acad. Sci. U. S. A. 1993, 90, 1839–1842. [Google Scholar] [CrossRef] [PubMed]
- Chan, M. M. Inhibition of tumor necrosis factor by curcumin, a phytochemical. Biochem. Pharm. 1995, 49, 1551–1556. [Google Scholar] [CrossRef] [PubMed]
- James, J. S. Curcumin: clinical trial finds no antiviral effect. AIDS Treat. News 1996, 1(no 242), 1–2. [Google Scholar]
- Favier, A.; Sappey, C.; Leclerc, P.; Faure, P.; Micoud, M. Antioxidant status and lipid peroxidation in patients infected with HIV. Chem.-Biol. Interact. 1994, 91, 165–180. [Google Scholar] [CrossRef] [PubMed]
- Jaruga, P.; Jaruga, B.; Gackowski, D.; Olczak, A.; Halota, W.; Pawlowska, M.; Olinski, R. Supplementation with antioxidant vitamins prevents oxidative modification of DNA in lymphocytes of HIV-infected patients. Free Radic. Biol. Med. 2002, 32, 414–420. [Google Scholar] [CrossRef] [PubMed]
- Ferlat, S.; Favier, A. [Tumor necrosis factor (TNF) and oxygen free radicals: potential effects for immunity]. C. R. Sean. Soc. Biol. Fil. 1993, 187, 296–307. [Google Scholar]
- Kameoka, M.; Kimura, T.; Ikuta, K. Superoxide enhances the spread of HIV-1 infection by cell-to-cell transmission. FEBS Lett. 1993, 331, 182–186. [Google Scholar] [CrossRef] [PubMed]
- Pace, G. W.; Leaf, C. D. The role of oxidative stress in HIV disease. Free Radic. Biol. Med. 1995, 19, 523–528. [Google Scholar] [CrossRef] [PubMed]
- Buttke, T. M.; Sandstrom, P. A. Redox regulation of programmed cell death in lymphocytes. Free Radic. Res. 1995, 22, 389–397. [Google Scholar] [CrossRef] [PubMed]
- Batterham, M.; Gold, J.; Naidoo, D.; Lux, O.; Sadler, S.; Bridle, S.; Ewing, M.; Oliver, C. A. Preliminary open label dose comparison using an antioxidant regimen to determine the effect on viral load and oxidative stress in men with HIV/AIDS. Eur. J. Clin. Nutr. 2001, 55, 107–114. [Google Scholar] [CrossRef] [PubMed]
- Skowron, G.; Merigan, T. C. Alternating and intermittent regimens of zidovudine (3'-azido-3'-deoxythymidine) and dideoxycytidine (2',3'-dideoxycytidine) in the treatment of patients with acquired immunodeficiency syndrome (AIDS) and AIDS-related complex. Am. J. Med. 1990, 88, 20S–23S. [Google Scholar]
- Furmanski, P.; Bourguignon, G. J.; Bolles, C. S.; Corombos, J. D.; Das, M. R. Inhibition by 2',3'-dideoxythymidine of retroviral infection of mouse and human cells. Cancer Lett. 1980, 8, 307–315. [Google Scholar] [CrossRef] [PubMed]
- Faras, A. J.; Taylor, J. M.; Levinson, W. E.; Goodman, H. M.; Bishop, J.M. RNA-directed DNA polymerase of Rous sarcoma virus: initiation of synthesis with 70 S viral RNA as template. J. Mol. Biol. 1973, 79, 163–183. [Google Scholar] [CrossRef] [PubMed]
- Richman, D. D.; Andrews, J. Results of continued monitoring of participants in the placebo-controlled trial of zidovudine for serious human immunodeficiency virus infection. Am. J. Med. 1988, 85, 208–213. [Google Scholar] [PubMed]
- Merigan, T. C.; Skowron, G.; Bozzette, S. A.; Richman, D.; Uttamchandani, R.; Fischl, M.; Schooley, R.; Hirsch, M.; Soo, W.; Pettinelli, C.; et al. Circulating p24 antigen levels and responses to dideoxycytidine in human immunodeficiency virus (HIV) infections. A phase I and II study. Ann. Intern. Med. 1989, 110, 189–194. [Google Scholar] [CrossRef] [PubMed]
- Fischl, M. A.; Parker, C. B.; Pettinelli, C.; Wulfsohn, M.; Hirsch, M. S.; Collier, A. C.; Antoniskis, D.; Ho, M.; Richman, D. D.; Fuchs, E.; et al. A randomized controlled trial of a reduced daily dose of zidovudine in patients with the acquired immunodeficiency syndrome. The AIDS Clinical Trials Group. N. Engl. J. Med. 1990, 323, 1009–1014. [Google Scholar] [CrossRef] [PubMed]
- Eron, J. J., Jr.; Johnson, V. A.; Merrill, D. P.; Chou, T. C.; Hirsch, M. S. Synergistic inhibition of replication of human immunodeficiency virus type 1, including that of a zidovudine-resistant isolate, by zidovudine and 2',3'-dideoxycytidine in-vitro. Antimicrob. Agents Chemother. 1992, 36, 1559–1562. [Google Scholar] [CrossRef] [PubMed]
- Meng, T. C.; Fischl, M. A.; Boota, A. M.; Spector, S. A.; Bennett, D.; Bassiakos, Y.; Lai, S. H.; Wright, B.; Richman, D. D. Combination therapy with zidovudine and dideoxycytidine in patients with advanced human immunodeficiency virus infection. A phase I/II study. Ann. Intern. Med. 1992, 116, 13–20. [Google Scholar] [CrossRef] [PubMed]
- Cohly, H. H.P.; Taylor, A.; Angel, M. F.; Salahudeen, A. K. Effect of turmeric, turmerin and curcumin on H2O2-induced renal epithelial (LLC-PK1) cell injury. Free Radic. Biol. Med. 1998, 24, 49–54. [Google Scholar] [CrossRef] [PubMed]
- Greenspan, H. C.; Aruoma, O. I. Could oxidative stress initiate programmed cell death in HIV infection? A role for plant derived metabolites having synergistic antioxidant activity. Chem.-Biol. Interact. 1994, 91, 187–197. [Google Scholar] [CrossRef] [PubMed]
- Lane, H. C.; Depper, J. M.; Greene, W. C.; Whalen, G.; Waldmann, T. A.; Fauci, A. S. Qualitative analysis of immune function in patients with the acquired immunodeficiency syndrome. Evidence for a selective defect in soluble antigen recognition. N. Engl. J. Med. 1985, 313, 79–84. [Google Scholar] [CrossRef] [PubMed]
- Bentin, J.; Tsoukas, C. D.; McCutchan, J. A.; Spector, S. A.; Richman, D. D.; Vaughan, J.H. Impairment in T lymphocyte responses during early infection with the human immunodeficiency virus. J. Clin. Immunol. 1989, 9, 159–168. [Google Scholar] [CrossRef] [PubMed]
- Gruters, R. A.; Terpstra, F. G.; De Jong, R.; Van Noesel, C. J.; Van Lier, R. A.; Miedema, F. Selective loss of T cell functions in different stages of HIV infection. Early loss of anti-CD3-induced T cell proliferation followed by decreased anti-CD3-induced cytotoxic T lymphocyte generation in AIDS-related complex and AIDS. Eur. J. Immunol. 1990, 20, 1039–1044. [Google Scholar] [CrossRef] [PubMed]
- Roos, M. T.; Miedema, F.; Meinesz, A. P.; De Leeuw, N. A.; Pakker, N. G.; Lange, J. M.; Coutinho, R. A.; Schellekens, P. T. Low T cell reactivity to combined CD3 plus CD28 stimulation is predictive for progression to AIDS:correlation with decreased CD28 expression. Clin. Exp. Immunol. 1996, 105, 409–415. [Google Scholar] [CrossRef] [PubMed]
- McCloskey, T. W.; Cavaliere, T.; Bakshi, S.; Harper, R.; Fagin, J.; Kohn, N.; Pahwa, S. Immunophenotyping of T lymphocytes by three-color flow cytometry in healthy newborns, children, and adults. Clin. Immunol. Immunopathol. 1997, 84, 46–55. [Google Scholar] [CrossRef] [PubMed]
- Kovacs, J. A.; Lempicki, R. A.; Sidorov, I. A.; Adelsberger, J. W.; Herpin, B.; Metcalf, J. A.; Sereti, I.; Polis, M. A.; Davey, R. T.; Tavel, J.; Falloon, J.; Stevens, R.; Lambert, L.; Dewar, R.; Schwartzentruber, D. J.; Anver, M. R.; Baseler, M. W.; Masur, H.; Dimitrov, D. S.; Lane, H. C. Identification of dynamically distinct subpopulations of T lymphocytes that are differentially affected by HIV. J. Exp. Med. 2001, 194, 1731–1741. [Google Scholar] [CrossRef] [PubMed]
- Mohri, H.; Perelson, A. S.; Tung, K.; Ribeiro, R. M.; Ramratnam, B.; Markowitz, M.; Kost, R.; Hurley, A.; Weinberger, L.; Cesar, D.; Hellerstein, M. K.; Ho, D. D. Increased turnover of T lymphocytes in HIV-1 infection and its reduction by antiretroviral therapy. J. Exp. Med. 2001, 194, 1277–1287. [Google Scholar] [CrossRef] [PubMed]
- Roos, M. T.; Miedema, F.; Koot, M.; Tersmette, M.; Schaasberg, W. P.; Coutinho, R. A.; Schellekens, P. T. T cell function in vitro is an independent progression marker for AIDS in human immunodeficiency virus-infected asymptomatic subjects. J. Infect. Dis. 1995, 171, 531–536. [Google Scholar] [CrossRef] [PubMed]
- Schellekens, P. T.; Roos, M. T.; De Wolf, F.; Lange, J. M.; Miedema, F. Low T cell responsiveness to activation via CD3/TCR is a prognostic marker for acquired immunodeficiency syndrome (AIDS) in human immunodeficiency virus-1 (HIV-1)-infected men. J. Clin. Immunol. 1990, 10, 121–127. [Google Scholar] [CrossRef] [PubMed]
- Autran, B.; Carcelain, G.; Li, T. S.; Blanc, C.; Mathez, D.; Tubiana, R.; Katlama, C.; Debre, P.; Leibowitch, J. Positive effects of combined antiretroviral therapy on CD4+ T cell homeostasis and function in advanced HIV disease. Science 1997, 277, 112–116. [Google Scholar] [CrossRef] [PubMed]
- Pakker, N. G.; Roos, M. T.; van Leeuwen, R.; de Jong, M. D.; Koot, M.; Reiss, P.; Lange, J. M.; Miedema, F.; Danner, S. A.; Schellekens, P. T. Patterns of T-cell repopulation, virus load reduction, and restoration of T-cell function in HIV-infected persons during therapy with different antiretroviral agents. J. Acquir. Immune Defic. Syndr. Hum. Retrovirol. 1997, 16, 318–326. [Google Scholar] [CrossRef] [PubMed]
- Ballet, J. J.; Couderc, L. J.; Rabian-Herzog, C.; Duval-Roy, C.; Janier, M.; Danon, F.; Clauvel, J. P.; Seligmann, M. Impaired T-lymphocyte-dependent immune responses to microbial antigens in patients with HIV-1-associated persistent generalized lymphadenopathy. AIDS 1988, 2, 291–297. [Google Scholar] [CrossRef] [PubMed]
- Shearer, G. M.; Bernstein, D. C.; Tung, K. S.; Via, C. S.; Redfield, R.; Salahuddin, S. Z.; Gallo, R. C. A model for the selective loss of major histocompatibility complex self-restricted T cell immune responses during the development of acquired immune deficiency syndrome (AIDS). J. Immunol. 1986, 137, 2514–2521. [Google Scholar] [PubMed]
- Blazevic, V.; Sahgal, N.; Kessler, H. A.; Landay, A. L.; Shearer, G. M. T cell responses to recall antigens, alloantigen, and mitogen of HIV-infected patients receiving long-term combined antiretroviral therapy. AIDS Res. Hum. Retroviruses 2000, 16, 1887–1893. [Google Scholar] [CrossRef] [PubMed]
- Schellekens, P. T.; Roos, M. T.; De Wolf, F.; Lange, J. M.; Miedema, F. Low T-cell responsiveness to activation via CD3/TCR is a prognostic marker for acquired immunodeficiency syndrome (AIDS) in human immunodeficiency virus-1 (HIV-1)-infected men. J. Clin. Immunol. 1990, 10, 121–127. [Google Scholar] [CrossRef] [PubMed]
- Messele, T.; Roos, M. T.; Hamann, D.; Koot, M.; Fontanet, A. L.; Miedema, F.; Schellekens, P. T.; Rinke de Wit, T. F. Nonradioactive techniques for measurement of in-vitro T-cell proliferation: alternatives to the [(3)H]thymidine incorporation assay. Clin. Diagn. Lab. Immunol. 2000, 7, 687–692. [Google Scholar] [PubMed]
- Clerici, M.; Stocks, N. I.; Zajac, R. A.; Boswell, R. N.; Lucey, D. R.; Via, C. S.; Shearer, G. M. Detection of three distinct patterns of T helper cell dysfunction in asymptomatic, human immunodeficiency virus-seropositive patients. Independence of CD4+ cell numbers and clinical staging. J. Clin. Invest. 1989, 84, 1892–1899. [Google Scholar] [CrossRef] [PubMed]
- Hofmann, B.; Jakobsen, K. D.; Odum, N.; Dickmeiss, E.; Platz, P.; Ryder, L. P.; Pedersen, C.; Mathiesen, L.; Bygbjerg, I. B.; Faber, V.; et al. HIV-induced immunodeficiency. Relatively preserved phytohemagglutinin as opposed to decreased pokeweed mitogen responses may be due to possibly preserved responses via CD2/phytohemagglutinin pathway. J. Immunol. 1989, 142, 1874–1880. [Google Scholar] [PubMed]
- Rosenberg, Z. F.; Fauci, A.S. Immunopathogenic mechanisms of HIV infection: cytokine induction of HIV expression. Immunol. Today 1990, 11, 176–180. [Google Scholar] [CrossRef] [PubMed]
© 2003 by MDPI (http://www.mdpi.org).
Share and Cite
Cohly, H.H.P.; Asad, S.; Das, S.K.; Angel, M.F.; Rao, M. Effect of Antioxidant (Turmeric, Turmerin and Curcumin) on Human Immunodeficiency Virus. Int. J. Mol. Sci. 2003, 4, 22-33. https://doi.org/10.3390/i4020022
Cohly HHP, Asad S, Das SK, Angel MF, Rao M. Effect of Antioxidant (Turmeric, Turmerin and Curcumin) on Human Immunodeficiency Virus. International Journal of Molecular Sciences. 2003; 4(2):22-33. https://doi.org/10.3390/i4020022
Chicago/Turabian StyleCohly, H. H. P., S. Asad, S. K. Das, M. F. Angel, and M. Rao. 2003. "Effect of Antioxidant (Turmeric, Turmerin and Curcumin) on Human Immunodeficiency Virus" International Journal of Molecular Sciences 4, no. 2: 22-33. https://doi.org/10.3390/i4020022
APA StyleCohly, H. H. P., Asad, S., Das, S. K., Angel, M. F., & Rao, M. (2003). Effect of Antioxidant (Turmeric, Turmerin and Curcumin) on Human Immunodeficiency Virus. International Journal of Molecular Sciences, 4(2), 22-33. https://doi.org/10.3390/i4020022