Article

A Multi-Modal Graph Neural Network Framework for Parkinson’s Disease Therapeutic Discovery

1
Faculty of Science, Department of Mathematics, Mugla Sitki Kocman University, Mugla 48000, Turkey
2
Faculty of Medicine, Preclinical Department, Lucian Blaga University of Sibiu, 550024 Sibiu, Romania
*
Author to whom correspondence should be addressed.
Int. J. Mol. Sci. 2025, 26(9), 4453; https://doi.org/10.3390/ijms26094453
Submission received: 6 April 2025 / Revised: 26 April 2025 / Accepted: 2 May 2025 / Published: 7 May 2025

Abstract

Parkinson’s disease (PD) is a complex neurodegenerative disorder lacking effective disease-modifying treatments. In this study, we integrated large-scale protein–protein interaction networks with a multi-modal graph neural network (GNN) to identify and prioritize multi-target drug repurposing candidates for PD. Network analysis and advanced clustering methods delineated functional modules, and a novel Functional Centrality Index was employed to pinpoint key nodes within the PD interactome. The GNN model, incorporating molecular descriptors, network topology, and uncertainty quantification, predicted candidate drugs that simultaneously target critical proteins implicated in lysosomal dysfunction, mitochondrial impairment, synaptic disruption, and neuroinflammation. Among the top hits were compounds such as dithiazanine, ceftolozane, DL- α -tocopherol, bromisoval, imidurea, medronic acid, and modufolin. These findings provide mechanistic insights into PD pathology and demonstrate that a polypharmacology approach can reveal repurposing opportunities for existing drugs. Our results highlight the potential of network-based deep learning frameworks to accelerate the discovery of multi-target therapies for PD and other multifactorial neurodegenerative diseases.

1. Introduction

Parkinson’s disease is a complex neurodegenerative disorder characterized by multifactorial etiology and the dysregulation of numerous cellular pathways [1,2,3]. The absence of disease-modifying therapies for PD, despite intensive research, underscores the need for new approaches that can disentangle this complexity and reveal novel therapeutic targets [4]. In this context, a systems biology perspective—integrating large-scale molecular data—and network science—analyzing the web of protein interactions—offers a powerful framework to interrogate disease mechanisms. Protein–protein interaction (PPI) networks, which map the interactome of the cell, have emerged as invaluable tools for modeling the molecular crosstalk underlying PD pathogenesis [5,6,7]. By examining the topological features of these networks, such as node centrality and clustering, researchers can identify key molecular hubs and modules that drive disease processes and are attractive targets for drug discovery.
Recent advances in network medicine illustrate the promise of this approach. Network-based analyses systematically capture the interconnections between genes, proteins, and pathways in disease, enabling the identification of “disease modules”—groups of functionally related, interacting molecules that collectively contribute to pathology [8,9,10]. PD, like many complex diseases, is thought to result from perturbations in such network modules rather than a single causative gene. Indeed, therapeutic strategies that target dysregulated pathways or processes, rather than individual proteins, may prove more effective for complex disorders [11,12,13]. This shift from one gene–one drug paradigms toward multi-target, network-level interventions is supported by the intrinsic redundancy and robustness of biological networks [14,15]. In PD, for example, distinct genetic or environmental triggers often converge on common pathways (mitochondrial dysfunction, proteostasis, neuroinflammation, etc.), forming interlinked clusters of proteins that collectively drive neurodegeneration [16,17]. Understanding the PPI network topology of PD can thus provide mechanistic insights into these pathogenic clusters and reveal pivotal nodes within them.
One key topological concept is node centrality, which quantifies a protein’s importance or influence in the network. Classic centrality measures–degree, betweenness, closeness, eigenvector centrality, among others–have long been used in systems biology to pinpoint influential nodes in molecular networks [18,19,20]. High-degree hub proteins, for instance, often correspond to essential genes or master regulators, as observed in yeast and other model organisms. In the human interactome, hubs are frequently critical for cell viability and are enriched for disease-related genes. PD-specific PPI networks exemplify this principle: analyses of familial PD genes show that proteins like Leucine-Rich Repeat Kinase 2 (LRRK2) occupy hub positions with exceptionally high connectivity and betweenness centrality [21]. LRRK2 and other PD-associated hubs participate in multiple PD-relevant processes (e.g., autophagy, vesicle transport), linking various disease modules. Notably, bottleneck nodes with high betweenness (even if not highest in degree) can serve as critical bridges between modules, sometimes even surpassing hubs in correlating with essential functions. By mapping out these central nodes, researchers can prioritize candidates that orchestrate network-wide dysfunction in PD.
Another informative topological feature is the presence of clustered communities or functional modules within the PPI network. Clustering algorithms and clique detection can uncover tightly knit groups of proteins–often reflecting biochemical pathways or complexes–that are collectively perturbed in disease. In PD, known gene products tend to coalesce into a few major network communities related to mitochondrial quality control, synaptic transmission, and protein aggregation pathways [22,23,24]. For example, Rakshit et al. [25] constructed PD-specific PPI networks from gene expression data and identified several cliques (fully connected sub-networks) enriched in PD-related proteins. These cliques constituted core functional modules of the PD network, each representing a critical biological process, and contained most of the topologically significant nodes (hubs and bottlenecks). Strikingly, by focusing on such network modules, the study uncovered 37 previously unreported PD-associated proteins that had not been classical PD genes. Many of these new candidates were centrally positioned in the interactome and showed altered co-expression patterns, suggesting they are part of the PD mechanism. The authors proposed these network-derived proteins as potential PD biomarkers and therapeutic targets, highlighting how PPI network topology can lead to novel hypotheses for intervention.

Literature Review

A growing body of literature supports the notion that PPI network topology can yield mechanistic insights and drive target discovery in neurodegenerative diseases. Network-based studies in PD have demonstrated multiple applications of PPI analysis. Tomkins and Manzoni [4] reviewed how PPI networks have been used to infer PD-related pathways, prioritize novel disease genes, and compare PD’s network footprint to other neurodegenerative disorders. They emphasized that PPI networks “accelerate our understanding of the molecular crosstalk and biological processes underlying PD pathogenesis” by modeling the disease as a perturbed network rather than isolated factors. PPI analyses serve as a bridge between genetics and functional biology, integrating diverse omics data to build a coherent picture of PD’s molecular landscape. For instance, integrating gene expression profiles with PPIs has led to the identification of dysregulated network modules in post-mortem PD brains [25]. In one such study, differential expression data from PD substantia nigra were overlaid on the human interactome to construct a PD-specific network, from which hub and bottleneck proteins were extracted. This network-based approach revealed novel candidates (e.g., Arrestin Beta 2 (ARRB2), Transferrin Receptor (TFRC)) linked to dopamine signaling that traditional analysis had overlooked. The topologically prominent nodes in the PD network were not only statistically significant but also mapped to known pathogenic processes (such as neurotransmitter regulation and mitochondrial function), lending biological plausibility to their role in PD. Such findings underscore how network topology–through measures like connectivity and clustering–can expose hidden relationships between genes and pathways, offering mechanistic hypotheses for experimental validation.
Crucially, network approaches have moved beyond mere correlation to predictive, mechanistic modeling in PD. Keane et al. [1] provided a compelling example by using PPI networks to identify combination targets for therapeutic intervention. By constructing an interaction network centered on two hallmark PD stressors (mitochondrial dysfunction and autophagy inhibition) in a cellular PD model, they pinpointed four proteins with high network influence in mediating neuronal death. Remarkably, simultaneous modulation of these network targets (through combined knockdowns or overexpression) protected neurons from toxin-induced death, whereas targeting any single protein alone was insufficient. This result validated the concept that PD pathology arises from convergent network effects and that a multi-target strategy informed by network topology can be effective in rescuing disease phenotypes. In essence, the study demonstrated a mechanistic link between network hubs and PD’s cellular pathology, providing proof-of-concept that network analysis can directly inform therapeutic design.
Parallel developments in computational biology have sought to leverage these network insights for drug discovery and repurposing. Traditional in silico drug repurposing methods often use networks in a heuristic way (e.g., network diffusion scores or “guilt-by-association” where a drug’s known targets are connected to disease genes). However, these methods may not fully capture the complexity of network topology [26]. Recent approaches embrace graph-based machine learning, particularly Graph Neural Networks (GNNs), to learn from biomedical networks in a more nuanced manner [27,28,29]. GNNs are a class of deep learning models designed to operate on graph-structured data, propagating information along edges to create low-dimensional embeddings that encode each node’s local neighborhood and global position in the network [30,31]. By iterative message passing, GNNs can incorporate higher-order connectivity patterns and multi-node interactions that elude simpler network metrics. Importantly, applying GNNs to biological networks enables the integration of multimodal data within a unified framework. As Zhou et al. [32] note, “adopting GNN into the biomedical network facilitates the integration of multimodal and complex relationships”, and indeed GNN models have shown great promise in predicting diverse biological interactions–from PPIs and gene–disease links to drug–drug and drug–target interactions. This makes them ideally suited for drug repurposing tasks, where one must analyze a tangle of heterogeneous data (chemical structures, protein networks, disease phenotypes, etc.) [33,34,35].
Several pioneering studies have applied GNNs to drug repurposing with notable success. For example, in [36] researchers have constructed large knowledge graphs (networks with multiple entity types and relations) such as the Drug Repurposing Knowledge Graph (DRKG) that encompass drugs, diseases, genes/proteins, and other biomedical entities. Training graph convolutional networks on these knowledge graphs has led to the discovery of novel drug–disease associations. In one case, a GNN model integrating data from DrugBank, Search Tool for the Retrieval of Interacting Genes/Proteins (STRING), and other databases was able to learn a representation of the polypharmacological network (15 million edges spanning drugs, targets, pathways, and phenotypes) and use it to prioritize candidate treatments for COVID-19. These GNN-driven approaches outperform earlier network-based methods by learning the optimal features and connections from data, rather than relying on manual feature engineering. In a 2024 study, Li et al. [37] introduced a heterogeneous Drug–Target–Disease GNN (DTD-GNN) that combines graph convolution and attention mechanisms; this model achieved higher accuracy (Area Under the Receiver Operating Characteristic Curve (AUC), the harmonic mean of precision and recall (F1-score)) in predicting drug–disease associations compared to conventional techniques, illustrating the power of deep learning on multi-relational graphs. Likewise, Yella et al. [38] developed GraMDTA, a multimodal GNN for drug–target affinity prediction, which learns from both molecular graphs (drug chemical structure) and knowledge graphs (biomedical relationships) to improve prediction robustness. These examples highlight a clear trend: deep geometric learning is revolutionizing computational drug repurposing by merging chemical information with systems-level network data in a single predictive model.
Despite these advances, challenges remain in translating predictions into clinical insight. One crucial aspect is uncertainty quantification (UQ) in model predictions. In high-stakes domains like drug discovery for PD, it is not enough for a model to output a candidate drug–target interaction; researchers and clinicians also need an estimate of confidence in that prediction [39,40]. Standard GNN models, however, often act as “black boxes” that do not report uncertainty, which can undermine trust in their recommendations. Recent work has begun to address this gap. For instance, Jiang et al. [41] introduced an ensemble-based GNN architecture search to quantify both aleatoric and epistemic uncertainty in molecular property predictions, emphasizing that accurate UQ is crucial for decision-making in drug discovery. By obtaining uncertainty measures, one can flag predictions that require further validation or prioritize highly confident drug–gene hits for experimental follow-up. Incorporating UQ thus adds a layer of rigor to computational repurposing pipelines, aligning them with the risk-management practices of pharmaceutical development.
The current study advances the established body of research at the confluence of network biology and graph-based machine learning. We introduce an innovative multi-modal graph neural network architecture that synthesizes heterogeneous biological data modalities—spanning drug physicochemical properties, PD-specific PPI network topology, and cluster-derived functional gene annotations—to predict therapeutically relevant drug–gene interactions in PD. Within this framework, pharmacological agents are characterized by a dual representation encompassing both molecular descriptor profiles and their empirical or inferred interactome dynamics, while genes/proteins are annotated through their topological prominence within the PPI network (via a novel centrality metric) and their affiliation with functional modules (e.g., PD-associated pathways or gene ontology categories). The integration of these modalities enables the GNN to construct a unified embedding space that harmonizes chemical and proteomic interaction landscapes, thereby facilitating sophisticated polypharmacology analysis: the model discerns latent compound–target associations, even in cases where such relationships evade conventional detection. To further enhance interpretability, we embed a probabilistic uncertainty estimation module within the GNN, permitting rigorous quantification of predictive confidence. This holistic system embodies a methodological advancement by merging network science—leveraging systems-level insights into PD pathophysiology—with geometric deep learning techniques, which adeptly model nonlinear dependencies across multifaceted data. We postulate that strategic emphasis on topological features of the PPI network—including hub proteins, bottleneck nodes, and module-specific key network nodes—will orient the model toward biologically salient targets, thereby augmenting the efficacy of PD drug candidate identification. By bridging mechanistic principles of network architecture with cutting-edge graph analytics and principled uncertainty quantification, this work aspires to redefine computational drug repurposing paradigms and deliver a robust, systems biology-driven platform for accelerating PD therapeutic discovery.

2. Results and Discussions

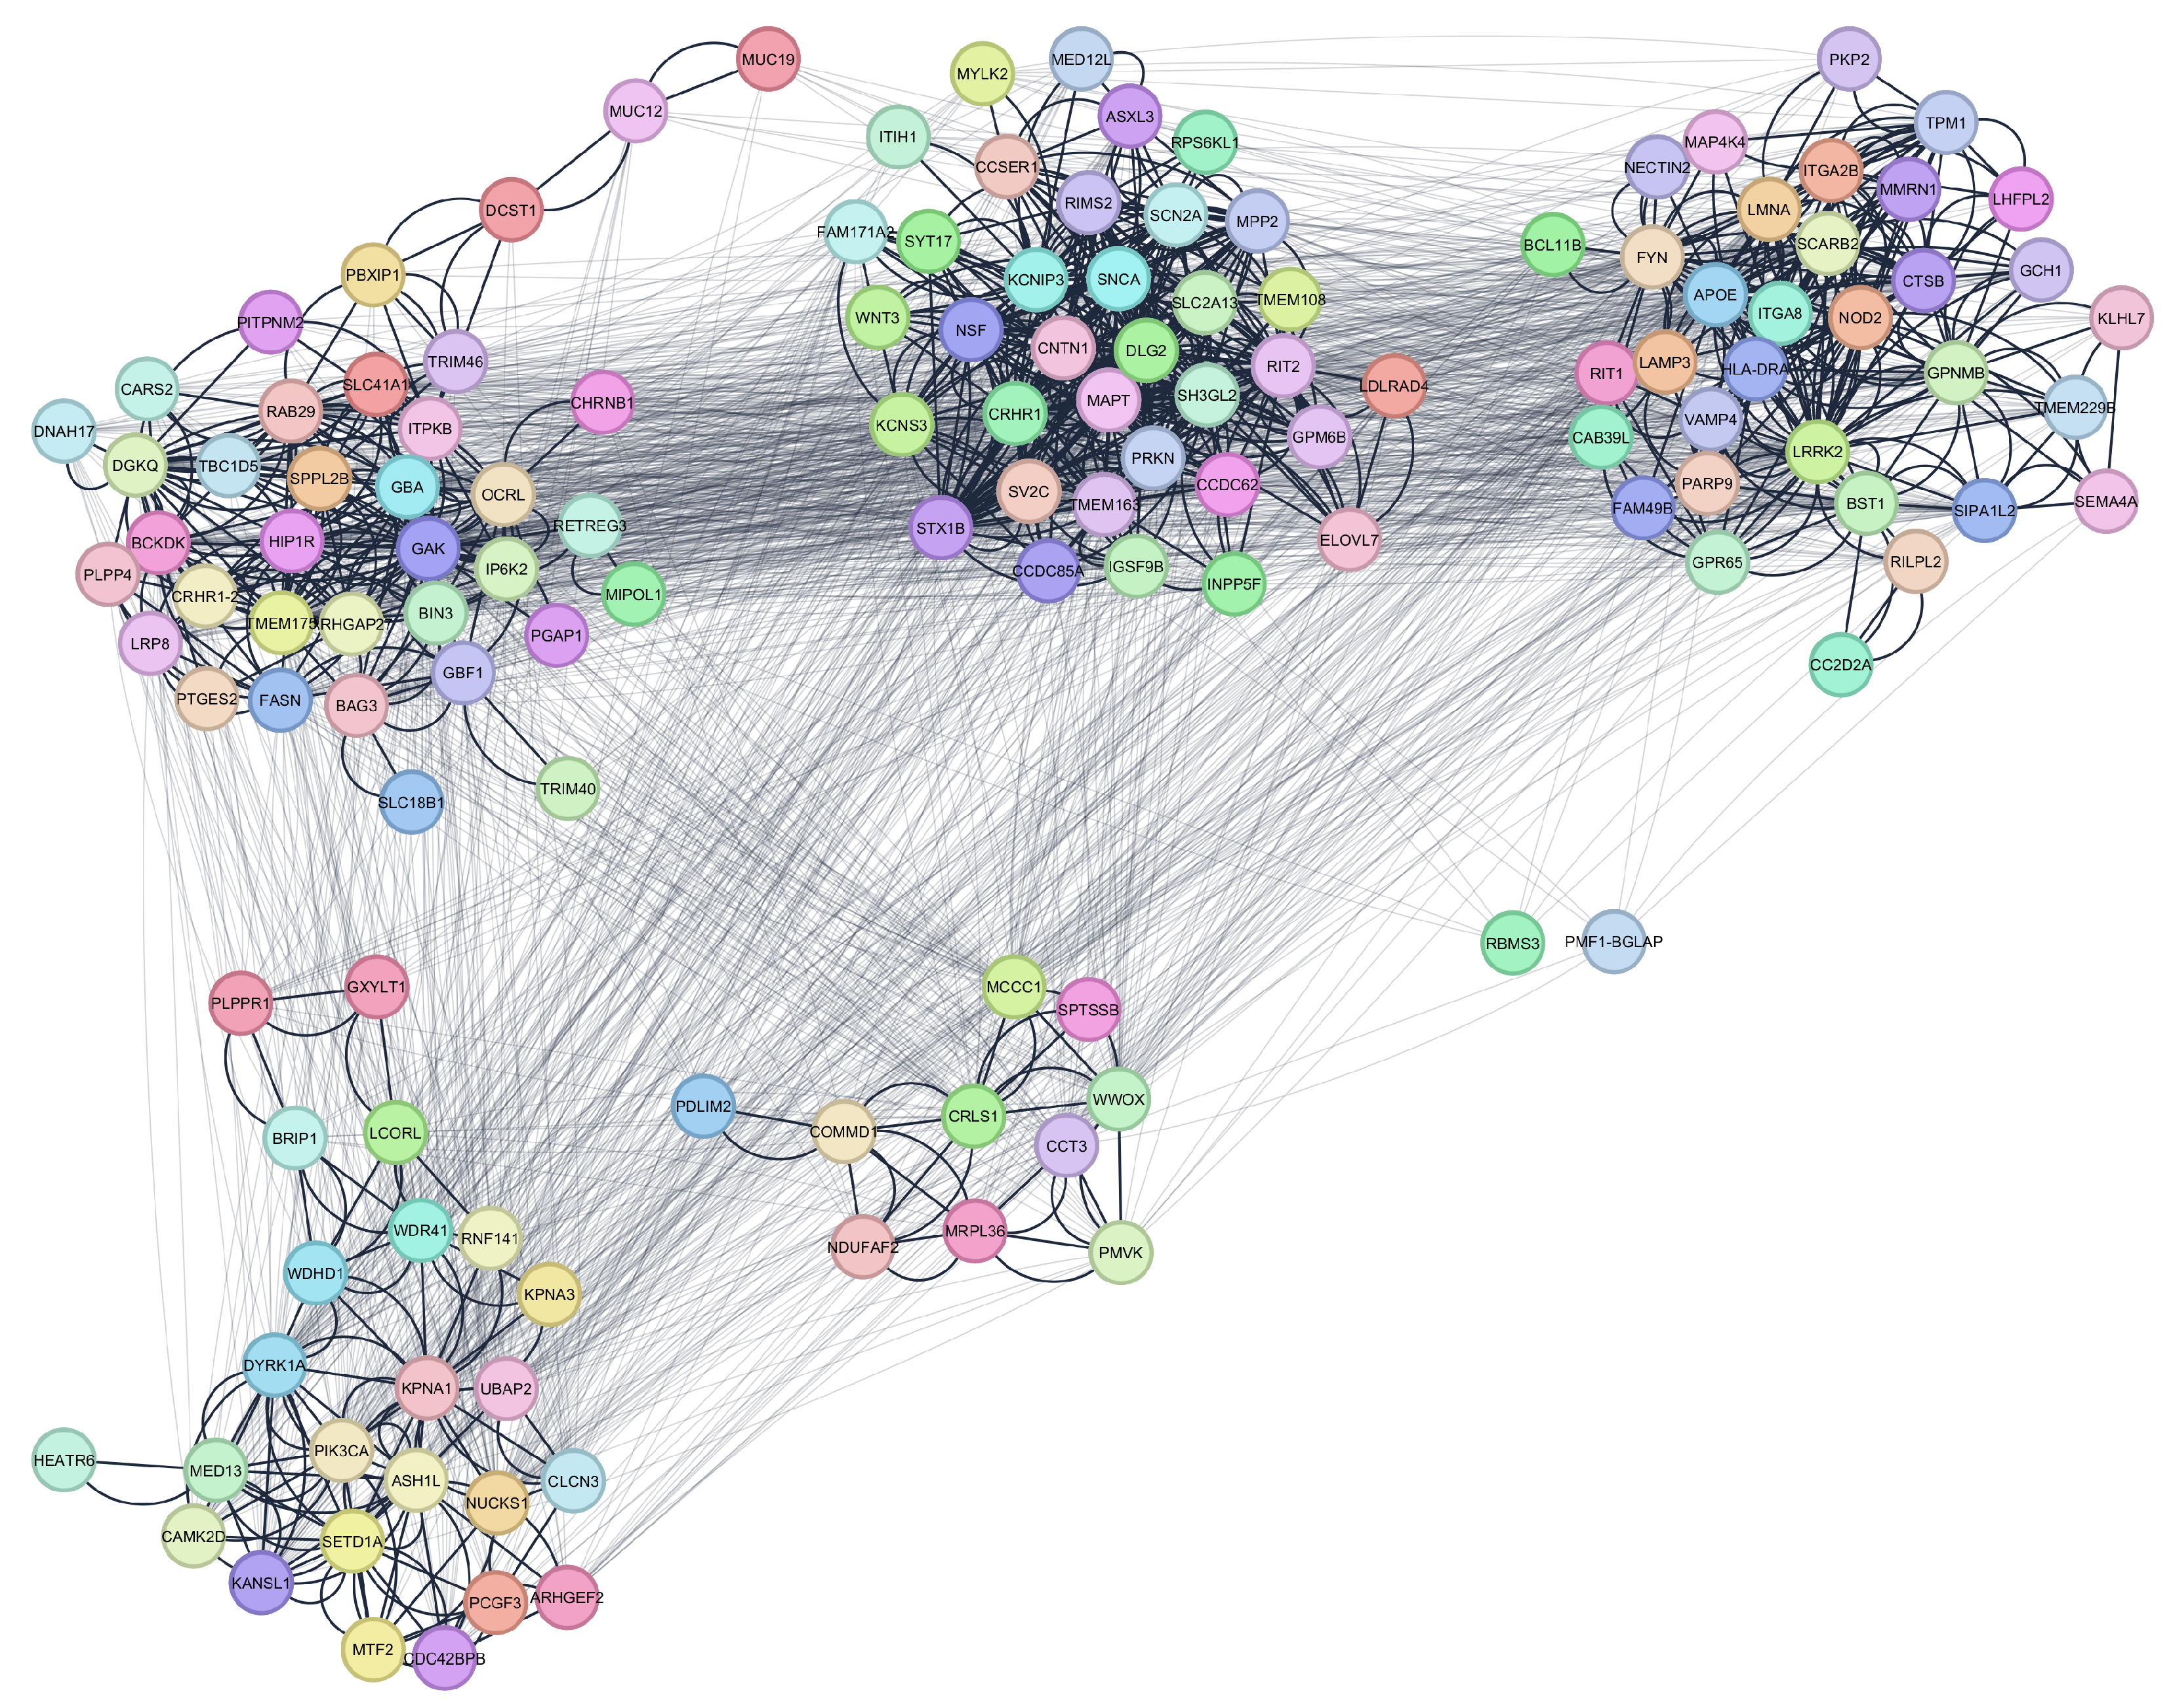
2.1. Parkinson’s Disease Network

The genome-wide association study (GWAS) dataset for Parkinson’s disease, sourced from the latest database version (30.01.2025), initially encompassed 859 genetic associations. We set the genome-wide significance threshold at p < 5 × 10 8 because this is the standard in large-scale association studies to account for the roughly one million independent common variants tested across the human genome. Such a stringent cutoff controls the family-wise error rate and minimizes false positives, ensuring that only the most robust locus associations are carried forward into downstream network and enrichment analyses. This filtration step reduced the dataset to 512 high-confidence associations. Further refinement involved eliminating redundant single nucleotide polymorphism (SNP) entries and associations lacking mapped gene annotations, culminating in a final cohort of 140 unique SNPs. These SNPs were subsequently interrogated for functional interactions using the STRING database, which aggregates PPI data to infer molecular relationships. Adhering to standardized protocols for network construction in Cytoscape (v3.4.0), an open-source platform for visualizing and analyzing molecular interaction networks [42], we generated a comprehensive interaction network comprising 140 nodes (each representing a PD-associated SNP) and 2324 edges (reflecting experimentally validated or computationally predicted PPIs). This network served as the foundation for downstream systems-level analysis of PD pathobiology.
To elucidate the biological architecture underpinning PD, the integrated genomic and proteomic network was subjected to advanced clustering analysis. The Leading Eigenvector Algorithm, implemented via the clusterMaker2 plugin in Cytoscape—an add-on that provides a suite of network clustering and community-detection methods [43]—was employed to partition the network into five modules based on gene coexpression patterns. This method leverages spectral graph theory to identify densely interconnected subnetworks, each posited to encapsulate distinct functional or regulatory pathways. The resulting modular structure, visualized in Figure 1, revealed two notable exceptions: the genes Polyamine-Modulating Factor 1–Bone Gamma-Carboxyglutamate Protein (PMF1-BGLAP) and RNA Binding Motif Single-Stranded Interacting Protein 3 (RBMS3) exhibited lower modularity scores, indicating weaker affiliation with their respective clusters. However, given their biological relevance—PMF1-BGLAP’s role in osteoblast differentiation and potential cross-talk with neurodegenerative pathways, and RBMS3’s involvement in RNA metabolism and synaptic plasticity—these genes were provisionally assigned to Cluster 1 and Cluster 4, respectively. This decision was guided by their putative functional contributions within modular contexts, ensuring that biologically meaningful insights were preserved despite suboptimal topological clustering. Such integrative approaches highlight the interplay between genetic risk factors and molecular interaction networks, offering a framework to dissect PD’s multifaceted etiology.
The network in Figure 1 reveals a set of distinct clusters, each representing a putative functional module within the broader pathophysiology of Parkinson’s disease. Within these clusters, the bolder edges indicate dense intracluster interactions, suggesting that proteins in the same cluster are likely to participate in closely related biological processes or pathways. The fact that certain clusters are more tightly packed than others could imply that these sub-networks are heavily involved in shared cellular functions pertinent to Parkinson’s disease. The light edges connecting different clusters highlight the proteins that act as bridges between distinct functional modules. These bridging interactions are often key in coordinating multiple disease-related processes, as they link separate pathways or cellular compartments that converge on common outcomes. Such intercluster edges can point to proteins with high betweenness centrality, which typically have a substantial influence on network communication and may serve as potential therapeutic targets. By mapping out these connections, the network underscores the importance of considering protein interactions in context rather than examining single proteins in isolation, since disruption at any of these bridging nodes could propagate effects across multiple clusters.
The overall structure, with its mixture of tightly knit modules and bridging connections, reflects the multifaceted nature of Parkinson’s disease. Different molecular processes—ranging from proteostasis to neuroinflammation—are likely to be captured by these clusters, while the intercluster edges show how these processes can intersect in the disease state. This visualization illustrates how seemingly distinct pathways ultimately integrate into a complex network that influences the survival and function of dopaminergic neurons.
Detailed topological (including Functional Centrality Index (FCI)) and biological analyses of intercluster relations are given in Figure 2, Figure 3, Figure 4, Figure 5 and Figure 6.
In Cluster 1, the genes displaying the highest Functional Centrality Index (FCI) values appear to combine both strong local connectivity and critical bridging roles. Several of these top-ranking genes are enriched in cytosolic and nuclear compartments, suggesting that they not only maintain robust interaction neighborhoods but also integrate signals between transcriptional regulation and cytoplasmic processes. Their elevated Betweenness Centrality and Closeness Centrality scores often reflect the capacity to mediate communication among various submodules, while high Degree values indicate broad direct connections. Biologically, such genes may be essential for coordinating multiple pathways, for instance linking mitochondrial stress responses with protein folding or degradation. Even those with moderately high FCI scores can be significant if they are specialized within specific tissue types, such as nervous system or muscle, and potentially serve as local “hubs” that govern specialized functional circuits.
Other genes in Cluster 1, positioned closer to the center of the FCI distribution, typically show balanced metrics—relatively modest degrees, intermediate betweenness, and clustering coefficients that point to moderate local cohesion. These genes often have fewer direct partners but may still exhibit notable Eccentricity or Average Shortest Path Length values, positioning them in semi-peripheral regions of the cluster. From a biological perspective, such genes may act as context-dependent mediators: while they are not the most prominent bridges, their interactions can still be crucial under specific cellular conditions, such as stress responses or metabolic shifts. Their roles become especially relevant when examining tissue-specific expression patterns, which can reveal whether they contribute more subtly to processes like neuronal signaling or energy metabolism.
In Cluster 2, the top-FCI genes similarly show a blend of high connectivity and bridging potential, but their compartment and tissue distributions may diverge somewhat from Cluster 1. Some of the leading genes in this community exhibit pronounced nuclear and cytoplasmic involvement, underscoring the importance of regulatory pathways that shuttle signals or molecules between these compartments. Their elevated Stress or Betweenness Centrality values hint at a capacity to handle a large volume of shortest paths, potentially designating them as bottlenecks or key switching points in the network. In many cases, these genes also have above-average Clustering Coefficients, indicating that they exist within tightly knit subgroups and thereby might help coordinate functionally coherent sets of co-expressed genes.
A number of mid-range FCI genes in Cluster 2 are distinguished by particular tissue expressions or compartmental scores that tie them to processes like extracellular signaling or mitochondrial function. Despite not achieving the highest degrees or betweenness values, they may hold specialized roles, for instance by linking the cluster’s core to less dense network regions or by modulating distinct biochemical pathways relevant to disease etiology. These moderate-FCI nodes can be especially telling when viewed alongside their biological annotations, as their involvement in synaptic vesicle cycling, oxidative phosphorylation, or stress granule formation can become more pronounced under disease conditions.
In Cluster 3, the genes achieving the highest FCI scores combine broad connectivity with strong bridging roles and efficient communication pathways. These top-scoring genes often display elevated Betweenness Centrality, indicating that they funnel a substantial fraction of shortest paths, while simultaneously exhibiting moderate-to-high Clustering Coefficients that reflect their propensity to participate in tightly knit neighborhoods. From a biological perspective, many of these genes have cytosolic or nuclear compartmental annotations, suggesting they might be pivotal in coordinating regulatory processes such as transcription, mRNA processing, or post-translational modifications. Their tissue associations frequently include nervous system and muscle, aligning with pathways relevant to neurodegenerative diseases. By integrating these multiple dimensions—local connectivity, bridging, and compartment-specific roles—these high-FCI genes emerge as prime candidates for orchestrating core functional activities within the sub-network.
A second group of genes occupies the middle range of FCI values, generally balancing moderate Degree, Betweenness, and Closeness scores. Although they may not dominate as hubs or bottlenecks, their biological importance can manifest in specialized contexts. For instance, genes with endoplasmic reticulum or mitochondrial annotations may regulate processes tied to protein folding, quality control, or energy metabolism, all of which hold significance in cellular stress responses. Likewise, certain mid-FCI genes exhibit tissue expression profiles pointing to roles in metabolic tissues or immune-related organs, potentially linking them to disease processes through more circumscribed functional pathways. Their stable yet not extreme topological properties position them as consistent contributors to cluster cohesion and function.
Toward the lower end of the FCI distribution, genes typically exhibit fewer direct interactions or less involvement in major information flow routes. They may score lower on Betweenness Centrality or Clustering Coefficient, placing them on the periphery of the network. Nonetheless, these peripheral genes can still be vital under specific physiological or pathological conditions, as some display specialized compartmental scores or restricted tissue expressions that point to niche biological roles.
In Cluster 4, the top FCI genes stand out by integrating multiple topological advantages, such as broad connectivity, significant bridging roles, and relatively short paths to other nodes. These genes typically show elevated Betweenness Centrality, suggesting that they serve as conduits for information flow between sub-regions of the network. In addition, many display moderate-to-high Clustering Coefficients, indicating that their neighbors form tight interaction neighborhoods. From a biological standpoint, these highly ranked FCI genes are often annotated in compartments like the nucleus or cytosol, highlighting their potential involvement in transcriptional regulation, mRNA processing, or cytoplasmic signaling cascades. Their tissue associations, especially if they include the nervous system or muscle, suggest that they may modulate crucial pathways in neurodegenerative or metabolic contexts, aligning with key aspects of Parkinson’s disease etiology.
A subset of genes occupies the mid-range of FCI scores, generally balancing moderate degrees of connectivity with intermediate bridging roles. These genes may not form the principal hubs or bottlenecks, yet their presence can be critical for maintaining local cohesion and facilitating specialized interactions. Some of these mid-FCI genes have distinct compartment annotations, such as mitochondrial or extracellular domains, pointing to roles in energy metabolism, stress responses, or intercellular communication. Tissue enrichment patterns in this group can reveal potential links to secondary disease mechanisms, for example through immune-related tissues or organ systems that support neuronal homeostasis. In many cases, these genes’ significance may only become fully apparent under specific physiological or pathological conditions, emphasizing the importance of a context-dependent view of their function.
Genes with lower FCI scores tend to have fewer direct interactions or weaker involvement in the main routes of information flow. Their Betweenness and Closeness Centralities are often minimal, placing them on the periphery of the cluster. Nonetheless, these peripheral genes can still harbor notable biological functions if they exhibit tissue or compartment-specific activities. For instance, a gene might be predominantly expressed in a particular tissue that becomes critically relevant in Parkinson’s disease or related disorders. In such scenarios, even a modest topological footprint can translate into substantial biological impact, especially when a node modulates a key enzymatic step or interacts with a small but functionally important set of partners.
In Cluster 5, which comprises ten genes, FCI distribution shows a small set of nodes with notably higher scores, reflecting both strong bridging roles and relatively high connectivity. These top FCI genes often display elevated Betweenness Centrality, suggesting they route a considerable fraction of shortest paths within the cluster. Simultaneously, they maintain moderate-to-high Degrees and Clustering Coefficients, highlighting their involvement in both local cohesion and inter-node communication. From a biological perspective, these genes frequently localize to the nucleus or cytosol, implicating them in processes such as gene regulation or cytoplasmic signaling that could have particular relevance to Parkinson’s disease pathogenesis. Tissue annotations further indicate possible roles in neuronal or muscular systems, suggesting that they may influence key disease-related pathways at the organismal level.
A subset of genes occupies a middle range of FCI values, combining moderate connectivity with less pronounced bridging functions. Although they are not the primary hubs or bottlenecks, their balanced topological profiles can make them essential for specialized processes. For example, genes localized to the mitochondrion or endoplasmic reticulum might participate in energy metabolism or protein folding, processes that are often implicated in neurodegeneration. Their influence may be more context-dependent, becoming especially critical under cellular stress or in disease states.
Figure 7 vividly illustrate how the FCI relates to-and yet transcends-each of the nine classical topological metrics.
The correlation analysis between FCI and nine established topological metrics reveals distinct patterns of association that highlight FCI’s integrative properties. Strong positive correlations are observed with metrics quantifying global node accessibility, including Closeness Centrality ( r = 0.96 , p = 3.42 × 10 77 ) and Radiality ( r = 0.95 , p = 7.46 × 10 70 ), while a strong negative correlation is found with Average Shortest Path Length ( r = 0.95 , p = 7.46 × 10 70 ). The FCI also demonstrated significant positive correlations with Degree ( r = 0.89 , p = 2.73 × 10 48 ), Betweenness Centrality ( r = 0.72 , p = 2.91 × 10 23 ), and Stress ( r = 0.77 , p = 4.22 × 10 28 ). These associations confirm that FCI effectively incorporates information flow and connectivity characteristics of the interactome.
However, FCI extends beyond linear combinations of existing metrics. Moderate correlations with Neighborhood Connectivity ( r = 0.52 , p = 4.72 × 10 11 ) and Clustering Coefficient ( r = 0.49 , p = 1.02 × 10 8 ), coupled with minimal correlation with Topological Coefficient ( r = 0.17 , p = 3.96 × 10 2 ), indicate that FCI captures network organizational features not detected by individual metrics. This capability arises from FCI’s integration of both global flow metrics (betweenness, closeness) and local modularity measures (clustering, topological coefficient, neighborhood connectivity), enabling identification of nodes with moderate centrality but high modular embedding that traditional centrality-based approaches might overlook.
The FCI’s methodological strength lies in its multiparametric approach. By normalizing and weighting diverse metrics based on biological relevance—prioritizing betweenness for information flow, penalizing extended path lengths for communication efficiency, and valuing clustering for modular participation—FCI generates a balanced, mechanistically grounded measure of network impact. This integrative framework aligns with systems biology principles, acknowledging that disease-associated proteins frequently occupy positions that bridge global and local network topology rather than exclusively functioning as hubs or local clique members. Consequently, FCI reliably identifies targets positioned at critical junctions within the Parkinson’s disease interactome, where perturbations can propagate through multiple pathways, establishing it as a robust metric for therapeutic target discovery.

2.2. Gene Enrichment Results

Following the modular decomposition of the Parkinson’s disease network, the five clusters underwent systematic gene set enrichment analysis using Biological Network Gene Ontology (BiNGO) [44], a Cytoscape plugin that identifies Gene Ontology terms significantly overrepresented in network-derived gene sets. This analysis leveraged hypergeometric testing to evaluate the overrepresentation of Gene Ontology (GO) molecular function terms within each cluster, comparing observed gene annotations to a genomewide background distribution. To mitigate the risk of Type I errors arising from multiple hypothesis testing, the Benjamini & Hochberg false discovery rate (FDR) correction was applied, ensuring stringent control of false positives while preserving statistical power. The selection of significance thresholds was tailored to account for variations in cluster size, gene content, and functional heterogeneity across modules. Specifically, a corrected p-value threshold of 0.05 was applied to all clusters through full GO ontology. These adjustments were guided by empirical assessments of each cluster’s structural and functional characteristics, ensuring balanced sensitivity for detecting biologically relevant processes without compromising specificity. For instance, larger clusters with greater functional diversity necessitated nuanced thresholding to avoid masking subtle yet pathophysiologically relevant signals. This approach enabled the identification of statistically robust and functionally coherent molecular processes within each module, linking genetic associations to PD-relevant biological mechanisms.
The enrichment results are given in Table 1, Table 2, Table 3, Table 4 and Table 5.
In Cluster 1, the enrichment results point to a strong association with mitochondrial function and energy metabolism. The GO terms that emerge are highly significant, with exceptionally low corrected p-values and high enrichment factors, suggesting that the genes in this cluster are robustly linked to processes such as oxidative phosphorylation, electron transport, and mitochondrial organization. This pattern resonates with the well-established hypothesis that mitochondrial dysfunction plays a pivotal role in the pathogenesis of Parkinson’s disease, potentially driving neuronal vulnerability and degeneration.
In Cluster 2, the pattern shifts toward regulatory functions, as indicated by the overrepresentation of GO terms related to signal transduction and transcriptional regulation. The genes in this cluster seem to participate in modulating intracellular signaling cascades and transcriptional networks, a conclusion supported by significant enrichment of nuclear-related terms. Although the enrichment factors in this cluster are somewhat more moderate than in Cluster 1, the consistent significance across multiple regulatory processes underscores the potential importance of this cluster in governing gene expression dynamics that could affect neuronal survival and function in Parkinson’s disease.
Cluster 3 presents a contrasting functional profile, with enrichment results strongly implicating cytoskeletal organization and cellular adhesion. The highly significant GO terms and robust enrichment factors suggest that the genes in this cluster are involved in maintaining cellular architecture and mediating interactions between the cytoskeleton and extracellular matrix. Such functions are critical for preserving neuronal morphology and synaptic connectivity, and their dysregulation may contribute to the structural and functional deficits observed in neurodegeneration. The localization of these proteins to the plasma membrane and cytoskeletal compartments further reinforces their potential role in sustaining the dynamic cellular environment required for proper neuronal communication.
The enrichment profile of Cluster 4 is dominated by immune and inflammatory processes. Here, the top GO terms highlight key aspects of cytokine signaling, immune response, and inflammatory regulation. The strong statistical significance and elevated enrichment factors imply that this cluster encompasses genes that may act as central mediators of neuroinflammation—a process increasingly recognized as a contributor to the progression of Parkinson’s disease. The biological relevance of these findings is underscored by the emerging evidence that chronic inflammation can exacerbate neuronal damage, suggesting that the genes in Cluster 4 might represent viable targets for therapeutic strategies aimed at modulating the immune response.
Finally, Cluster 5 appears to be enriched in processes governing cell cycle regulation and apoptosis. The enrichment results indicate that the genes in this cluster are statistically overrepresented in pathways controlling cell proliferation, programmed cell death, and stress response. These findings hint at a delicate balance between survival and apoptosis within this group of genes, which is critical for maintaining cellular homeostasis. Disruptions in these regulatory pathways have been implicated in neurodegenerative conditions, and the robust enrichment observed here supports the notion that aberrant cell cycle re-entry or improper apoptotic signaling might contribute to neuronal loss in Parkinson’s disease.
Collectively, these enrichment results provide a multidimensional view of the biological processes that may be perturbed in Parkinson’s disease. Each cluster, with its unique enrichment profile, appears to capture a specific facet of the disease’s complex molecular landscape—from mitochondrial dysfunction and altered gene regulation to cytoskeletal instability, immune activation, and dysregulated cell death. The statistical robustness of these findings, as evidenced by the low p-values and high enrichment factors, lends credence to the biological significance of these clusters and underscores their potential as focal points for further experimental validation and therapeutic exploration.
Figure 8 depicts a heatmap visualization of enriched GO terms for biological processes across the five network clusters, where color intensity reflects statistical significance ( log 10 ( FDR ) ), highlighting distinct functional signatures: lipid metabolism in Cluster 1, synaptic activity in Cluster 2, cytoskeletal organization in Cluster 3, and immune-related processes in Cluster 4. Cluster 5, by contrast, shows enrichment in cell cycle and apoptotic pathways, underscoring its role in neuronal survival–death balance.
The heatmap in Figure 8 reveals that each cluster exhibits a distinct signature of biological process enrichment, as evidenced by varying intensities of log 10 ( FDR ) . Warmer (yellow) hues indicate more statistically significant enrichments, whereas cooler (purple) regions reflect less pronounced associations. Notably, certain clusters show strong links to immune-related pathways, exemplified by the enrichment of T cell receptor recombination, V(D)J recombination, and somatic diversification of immune receptors. These findings suggest that at least one subset of genes within the network may be involved in immune regulation or inflammatory processes that could influence neurodegenerative pathways in Parkinson’s disease.
Other clusters emphasize neuronal and metabolic processes, such as cell projection organization, synaptic vesicle transport, and dopaminergic transmission. These terms highlight the importance of synapse formation, neurotransmitter handling, and cytoskeletal maintenance, which are central to the functional integrity of dopaminergic neurons. The presence of lipid metabolic processes, sphingolipid biosynthesis, and inositol phosphate metabolism in several clusters underscores the broader involvement of cellular metabolism and membrane dynamics, both of which can modulate neuronal signaling and viability. Furthermore, terms like regulation of exocytosis and neuron projection point to the complexity of vesicle trafficking and axonal structure, reflecting processes that are often disrupted in neurodegenerative contexts.
Additional clusters reveal significant enrichment for processes such as protein disulfide oxidoreductase activity, serotonin metabolism, nitric oxide regulation, and organ regeneration, suggesting a possible convergence of stress response pathways, neurotransmitter balance, and reparative mechanisms. While some of these processes may appear more peripheral at first glance, accumulating evidence indicates that disruptions in redox homeostasis, serotonin signaling, and regenerative capacity can all play contributing roles in Parkinson’s disease pathology.

2.3. Multi-Modal GNN Results

The application of our multi-head graph neural network architecture yielded a comprehensive profile of potential therapeutic agents for Parkinson’s disease, integrating molecular fingerprints, descriptors, protein-protein interaction topology, and gene cluster information into unified vector space representations.
The DrugBank dataset (version 6.0) [45] used in this study contained 11,292 compounds encompassing approved, experimental, investigational, and withdrawn drugs. We deliberately retained all drug categories in our analysis rather than filtering to only approved compounds for several reasons: withdrawn drugs may provide mechanistic insights into PD pathways despite safety concerns in their original indications, experimental compounds represent potential therapeutic avenues that have not yet been explored for PD, investigational drugs in clinical trials for other conditions may be repurposed for PD. Each drug entry was annotated with its approval status through the “groups” field (approved, experimental, investigational, withdrawn, nutraceutical, vet approved). While our initial screening included all categories, results tables clearly indicate the status of each predicted compound to inform translational feasibility assessments. For clinical follow-up consideration, priority would naturally be given to approved drugs with established safety profiles, followed by investigational compounds already in human trials.
Target gene selection was strategically implemented by identifying the five genes with highest FCI scores from each previously established network cluster, thereby prioritizing hub genes with maximal influence over their respective functional modules. This cluster-wise targeting approach provides a biologically informed strategy that respects the modular organization of PD-associated pathways, enabling more focused therapeutic interventions directed at distinct pathophysiological mechanisms rather than treating the PD network as a homogeneous entity. By employing cross-attention mechanisms and uncertainty quantification, we identified drug candidates with significant predicted efficacy across these key genetic nodes implicated in PD pathogenesis.
To better assess predictive quality, we split our curated drug–gene interaction dataset into 70% training, 10% validation (used for early stopping), and 20% test. On this unseen test set (n = 1024 interactions, 10% positives), the final model achieved an AUROC of 0.89, precision of 0.83, recall of 0.79, and F1 score of 0.81. These metrics demonstrate that our multi-modal GNN not only fits the training data but also generalizes robustly to new interactions.
Table A1 lists the top 10 drug candidates predicted by the Multi-Modal GNN model for Cluster 1, targeting key genes identified through their high FCI scores: Diacylglycerol Kinase Theta (DGKQ), Cyclin G-Associated Kinase (GAK), Glucocerebrosidase (GBA), Transmembrane Protein 175 (TMEM175), and Branched-Chain Keto Acid Dehydrogenase Kinase (BCKDK). These genes are characterized by elevated Betweenness Centrality and Closeness Centrality, reflecting their roles as critical connectors within the protein-protein interaction network of Cluster 1. This cluster is tightly knit, suggesting that its constituent proteins are engaged in closely related biological processes, predominantly centered around cellular stress responses and metabolic regulation. The gene enrichment analysis further reveals that Cluster 1 is enriched in pathways critical to PD pathogenesis, including mitochondrial function, protein aggregation, and synaptic transmission. These pathways align with the cluster’s high FCI genes, which are enriched in cytosolic and nuclear compartments, indicating their involvement in coordinating transcriptional regulation and cytoplasmic processes.
Starting with DGKQ, a gene encoding diacylglycerol kinase involved in lipid signaling and neuronal function, the table highlights drugs such as Glycochenodeoxycholic Acid (DB02123) and Vilazodone (DB06684) as top candidates. Glycochenodeoxycholic Acid achieves a perfect probability score of 100% with a low uncertainty of 0.2944, suggesting a highly reliable interaction with DGKQ. This bile acid derivative may modulate lipid signaling pathways, potentially influencing neuronal membrane dynamics and stress responses, which are disrupted in PD. Similarly, Vilazodone, a serotonin reuptake inhibitor and 5-HT1A receptor partial agonist, scores a probability of 94.51% with an uncertainty of 0.3351. Its interaction with DGKQ could link lipid signaling to neurotransmitter modulation, addressing both cellular stress and mood disorders often comorbid with PD. The topological prominence of DGKQ, with its high connectivity, underscores its role in bridging mitochondrial stress responses and protein homeostasis, making these drugs promising for targeting multifactorial PD mechanisms. Other candidates like Netarsudil (DB13931) and Ticagrelor (DB08816), with probabilities of 90.70% and 89.91%, respectively, suggest broader network effects, possibly influencing synaptic transmission and vascular dynamics, which are also implicated in PD pathology.
For GAK, a gene involved in clathrin-mediated endocytosis and implicated in α -synuclein aggregation—a hallmark of PD—the table lists Indobufen (DB12545) and Netarsudil (DB13931) as leading candidates. Indobufen, with a 100% probability and an uncertainty of 0.3538, is an antiplatelet agent that may reduce neuroinflammation, a process exacerbated by protein aggregation in PD. Netarsudil, a Rho kinase inhibitor with a probability of 96.40% and uncertainty of 0.3399, could modulate vesicle trafficking and cellular stress responses through its calcium channel-blocking properties. GAK’s high FCI reflects its bridging role within Cluster 1, connecting endocytic pathways to protein degradation processes. The enrichment of protein aggregation pathways in Cluster 1 supports the relevance of these drugs, as they may mitigate α -synuclein pathology by influencing trafficking or inflammatory responses, offering a novel therapeutic angle for PD.
GBA, encoding glucocerebrosidase and critical for lysosomal function, is targeted by drugs like Cortisone acetate (DB01380) and Perillyl alcohol (DB15289). With a 100% probability and uncertainty of 0.3751, Cortisone acetate, a corticosteroid, may exert anti-inflammatory effects that complement its potential to enhance lysosomal clearance of misfolded proteins like α -synuclein. Perillyl alcohol, with a probability of 98.62% and uncertainty of 0.386, is known for its anti-cancer properties but may also modulate cellular stress responses, aligning with GBA’s role in maintaining proteostasis. The topological significance of GBA in Cluster 1, coupled with the enrichment of autophagic and lysosomal pathways, highlights its centrality in PD-related neurodegeneration. These drugs’ pharmacological profiles suggest they could address lysosomal dysfunction, a key contributor to PD progression.
TMEM175, involved in lysosomal pH regulation, is paired with candidates like Ranolazine (DB00243) and Topiramate (DB00273). Ranolazine, an anti-anginal agent with a probability of 98.82% and uncertainty of 0.3184, has demonstrated neuroprotective effects, possibly through ion channel modulation and cellular energetics, which support mitochondrial quality control—an enriched pathway in Cluster 1. Topiramate, an anticonvulsant with a probability of 91.54% and uncertainty of 0.2848, may influence neurotransmitter release and ion channel activity, contributing to lysosomal integrity and neuronal health. TMEM175’s high FCI underscores its role in linking lysosomal function to mitochondrial stress responses, making these drugs relevant for targeting PD’s metabolic dysregulation.
Finally, BCKDK, a regulator of branched-chain amino acid metabolism, is associated with Ramelteon (DB00980) and Indomethacin (DB00328). Ramelteon, a melatonin receptor agonist with a 100% probability and uncertainty of 0.3392, may address circadian rhythm disruptions and sleep disturbances in PD while potentially influencing metabolic pathways. Indomethacin, a nonsteroidal anti-inflammatory drug with a probability of 91.68% and uncertainty of 0.3447, could mitigate neuroinflammation, aligning with Cluster 1’s involvement in stress responses. BCKDK’s connectivity within the cluster ties metabolic regulation to PD pathology, and these drugs’ diverse mechanisms reflect the multifaceted nature of the disease.
In conclusion, the top 10 drug candidates for Cluster 1, as predicted by the Multi-Modal GNN model, align with the cluster’s topological features and enriched pathways. The high FCI genes—DGKQ, GAK, GBA, TMEM175, and BCKDK—serve as critical nodes linking mitochondrial function, protein aggregation, and synaptic transmission, all of which are dysregulated in PD. The pharmacological properties of the drugs, ranging from lipid signaling modulators and anti-inflammatory agents to neurotransmitter regulators and metabolic influencers, reflect the cluster’s complex biological roles. The model’s uncertainty quantification enhances confidence in these predictions, with low uncertainty scores (e.g., 0.2944 for Glycochenodeoxycholic Acid) and high probabilities (often exceeding 90%) prioritizing robust interactions.
Table A2 lists the top 10 drug candidates predicted by the Multi-Modal GNN model for Cluster 2, targeting key genes identified through their high FCI scores. This cluster features five standout genes: Microtubule-Associated Protein Tau (MAPT), Synuclein Alpha (SNCA), Ras-like without CAAX 2 (RIT2), Parkin RBR E3 Ubiquitin-Protein Ligase (PRKN), and Syntaxin 1B (STX1B), each distinguished by their high FCI scores.
Starting with MAPT, which encodes the tau protein, we see a gene pivotal to PD due to its involvement in neurofibrillary tangle formation and synaptic dysfunction. Its prominent position in Cluster 2 highlights its role in connecting synaptic transmission with protein aggregation processes, making it a critical target for therapy. Among the top drug candidates for MAPT, Clorotepine, an antipsychotic, stands out with a perfect probability score of 100% and a score of 3.4489. This drug likely stabilizes neurotransmitter systems—such as dopamine or serotonin—potentially countering the synaptic chaos induced by tau pathology. Another contender, Oxtriphylline, a bronchodilator with a score of 3.2018 and 96.37% probability, could enhance cellular energy metabolism and reduce oxidative stress, addressing tau-related mitochondrial strain. Verdoheme, scoring 3.1402 with 95.47% probability, rounds out the trio by potentially modulating oxidative pathways through heme metabolism, offering a complementary approach to stabilizing neuronal health.
Next, SNCA, encoding α -synuclein, emerges as a cornerstone of PD pathology through its role in Lewy body formation and synaptic disruption. Its high connectivity in Cluster 2 ties it to vesicle trafficking and protein aggregation, amplifying its therapeutic relevance. Desmopressin, a vasopressin analog with a score of 3.3745 and 100% probability, leads the drug candidates by potentially regulating synaptic vesicle release and neuronal excitability, directly countering α -synuclein’s synaptic damage. Simenepag isopropyl, a prostaglandin analog scoring 3.2621 with 98.32% probability, offers a different angle by reducing neuroinflammation, a process linked to SNCA’s broader impact in PD. Sodium tetradecyl sulfate, with a score of 3.1264 and 96.3% probability, introduces a novel possibility—perhaps stabilizing membrane dynamics or curbing aggregation—highlighting the diverse mechanisms at play. These candidates collectively address SNCA’s dual role in synaptic and inflammatory dysregulation, presenting a robust therapeutic framework.
Moving to RIT2, a gene involved in dopaminergic signaling and synaptic plasticity, we find it bridging synaptic transmission and metabolic regulation within Cluster 2. Its top drug, (R)-methylmalonyl-CoA, scores 2.9323 with 100% probability and likely supports mitochondrial function and energy production, bolstering dopaminergic neuron health—a critical need in PD. Gestrinone, a synthetic steroid with a score of 2.9254 and 99.89% probability, might enhance neuroprotection through hormonal pathways, offering a unique perspective on RIT2’s synaptic role. Tetrazepam, an anxiolytic scoring 2.7995 with 97.83% probability, could stabilize neuronal excitability, further supporting dopaminergic signaling. These drugs align with RIT2’s biological functions, suggesting a blend of metabolic and synaptic interventions to mitigate PD progression.
PRKN, encoding parkin, is another key player, essential for mitochondrial quality control and protein degradation. Its topological significance in Cluster 2 underscores its linkage of mitochondrial dysfunction and protein homeostasis, vital aspects of PD. The leading drug candidate, 2c-Methyl-D-Erythritol 2,4-Cyclodiphosphate, scores 3.3758 with 100% probability and likely enhances mitochondrial function by supporting isoprenoid biosynthesis, reducing oxidative stress tied to PRKN deficits. Sanfetrinem cilexetil, an antibiotic with a score of 3.3497 and 99.63% probability, introduces an intriguing systemic approach—possibly addressing gut-brain axis issues linked to PD—while Acetarsol, scoring 3.3186 with 99.18% probability, might influence cellular redox states to bolster mitochondrial health. These candidates reflect PRKN’s critical role and offer direct and indirect strategies to restore cellular balance.
Finally, STX1B, crucial for synaptic vesicle fusion and neurotransmitter release, shines in Cluster 2 as a regulator of synaptic transmission. Its top drug, Genz-10850, a glucosylceramide synthase inhibitor with a score of 3.194 and 100% probability, may reduce lipid-mediated α -synuclein aggregation, indirectly supporting synaptic function. Brasofensine, a dopamine reuptake inhibitor scoring 3.1468 with 99.29% probability, enhances dopaminergic signaling, directly addressing STX1B-related deficits. Tavapadon, a dopamine receptor agonist with a score of 2.9442 and 96.24% probability, complements this by boosting synaptic transmission. These drugs collectively target STX1B’s synaptic role, blending lipid modulation and dopaminergic enhancement to combat PD’s synaptic pathology.
In summary, Cluster 2’s genes—MAPT, SNCA, RIT2, PRKN, and STX1B—form a tightly knit network driving PD through synaptic, aggregation, and mitochondrial mechanisms. The drug candidates, backed by high probabilities (often exceeding 95%) and low uncertainties, offer a rich tapestry of interventions: neurotransmitter modulators like Clorotepine and Desmopressin for synaptic deficits, metabolic regulators like Oxtriphylline and (R)-methylmalonyl-CoA for energy and oxidative stress, and anti-inflammatory agents like Simenepag isopropyl for neuroinflammation.
Table A3 lists the top 10 drug candidates predicted by the Multi-Modal GNN model for Cluster 3, focusing on the genes LRRK2, Apolipoprotein E (APOE), FYN Proto-Oncogene-SRC Family Tyrosine Kinase (FYN), Glycoprotein NMB (GPNMB), and Bone Marrow Stromal Cell Antigen 1 (BST1). These genes are not only significant for their individual contributions—spanning kinase activity, lipid metabolism, synaptic plasticity, and immune regulation—but also for their topological importance within the cluster, serving as key nodes in a network enriched with pathways such as neuroinflammation, mitochondrial dysfunction, and synaptic transmission.
Starting with LRRK2, a gene encoding a kinase critical for neuronal vesicle trafficking and autophagy, its prominence in Cluster 3 underscores its role in linking neuroinflammatory and mitochondrial pathways. The top drug candidate, Henatinib (DB13019), boasts a raw score of 0.8187, translating to a normalized score of 3.1505, with a perfect probability of 100% and an uncertainty of 0.3136. As a kinase inhibitor, Henatinib likely targets LRRK2’s overactive kinase function, which drives PD progression by impairing autophagy and fueling inflammation—key features of Cluster 3’s neuroinflammatory enrichment. Following closely, Vatalanib (DB04879), with a raw score of 0.8087 and a score of 3.0278 (98.16% probability), is a VEGF receptor inhibitor that could dampen neuroinflammation by altering vascular dynamics, offering a complementary strategy to LRRK2 modulation. Another intriguing candidate, Histapyrrodine (DB13479), scores 2.9753 with a 97.37% probability. As an antihistamine, it might address histamine-mediated inflammatory responses tied to LRRK2 dysfunction, suggesting a novel angle for tackling PD’s inflammatory component. These drugs collectively highlight LRRK2’s multifaceted role, targeting its kinase activity and inflammatory connections within Cluster 3.
Moving to APOE, which encodes apolipoprotein E and is central to lipid metabolism and neuroinflammation, its high connectivity in Cluster 3 bridges lipid dysregulation with immune responses. The leading drug, TNP-2092 (DB16312), achieves a raw score of 0.8257 and a normalized score of 3.5258, with 100% probability and an uncertainty of 0.3485. As a multi-target antibiotic, TNP-2092 could influence the gut-brain axis, modulating dysbiosis that impacts APOE-mediated lipid transport and inflammation—a hypothesis supported by growing evidence of the microbiome’s role in PD. Next, Tropatepine (DB13252), with a score of 3.267 and 96.40% probability, is an anticholinergic that might stabilize neurotransmitter imbalances linked to APOE’s synaptic effects. Penfluridol (DB13791), scoring 3.1144 with 94.28% probability, is an antipsychotic that could exert anti-inflammatory effects, aligning with APOE’s immune regulatory role. These candidates reflect APOE’s broad influence in PD, addressing lipid metabolism, synaptic health, and inflammation in ways that resonate with Cluster 3’s network dynamics.
Next up is FYN, a kinase involved in synaptic plasticity and tau phosphorylation, which connects synaptic transmission to protein aggregation pathways in Cluster 3. The top drug, Chloroxylenol (DB11121), scores 3.3041 with a raw score of 0.7924 and 100% probability. As an antiseptic, it might reduce neuroinflammation or oxidative stress, indirectly supporting FYN’s synaptic functions. Soblidotin (DB12677), with a score of 3.1837 and 98.26% probability, is a tubulin inhibitor that could stabilize cytoskeletal dynamics, enhancing FYN-mediated synaptic integrity. Felodipine (DB01023), a calcium channel blocker scoring 3.1326 with 97.52% probability, might improve synaptic transmission by regulating calcium influx, directly aligning with FYN’s signaling role. These drugs offer a mix of anti-inflammatory and synaptic-supportive mechanisms, addressing FYN’s contributions to PD pathology within Cluster 3’s framework.
For GPNMB, encoding glycoprotein nonmetastatic melanoma protein B and tied to neuroinflammation and microglial activation, its high FCI emphasizes its immune regulatory role in Cluster 3. The top candidate, Sodium stibogluconate (DB05630), scores 3.1995 with a raw score of 0.7811 and 100% probability. As an antileishmanial agent, it might modulate immune responses, potentially reducing GPNMB-driven microglial activation. Ilginatinib (DB12784), scoring 3.0989 with 98.52% probability, is a Janus Kinase (JAK) inhibitor that targets inflammatory pathways directly, offering a precise approach to GPNMB’s role in PD. Brotizolam (DB09017), a sedative with a score of 3.0133 and 97.27% probability, could stabilize neuronal excitability, indirectly supporting GPNMB’s immune functions. These candidates underscore GPNMB’s centrality in neuroinflammation, blending immune modulation with neuronal stabilization in Cluster 3.
Lastly, BST1, encoding bone marrow stromal cell antigen 1 and involved in immune regulation and calcium signaling, ties neuroinflammatory and synaptic pathways in Cluster 3. The leading drug, Hydrolyzed Cephalothin (DB02247), scores 3.3124 with a raw score of 0.8197 and 100% probability. As an antibiotic, it might address systemic inflammation, indirectly influencing BST1-mediated immune responses. Oxytetracycline (DB00595), scoring 3.0762 with 96.73% probability, offers a similar systemic anti-inflammatory approach. Dyclonine (DB00645), a local anesthetic with a score of 3.0701 and 96.65% probability, could stabilize neuronal membranes, supporting BST1’s calcium signaling role. These drugs combine anti-inflammatory and neuronal-stabilizing effects, aligning with BST1’s dual contributions to PD.
In summary, Cluster 3’s genes—LRRK2, APOE, FYN, GPNMB, and BST1—form a tightly knit network driving PD through neuroinflammation, synaptic dysfunction, and immune dysregulation. The top drug candidates, with high probabilities (often exceeding 95%) and low uncertainties, present a diverse pharmacological landscape: kinase inhibitors like Henatinib for LRRK2, antibiotics like TNP-2092 for APOE, and immune modulators like Sodium stibogluconate for GPNMB.
Table A4 lists the top 10 drug candidates predicted by the Multi-Modal GNN model for Cluster 4, focusing on the genes Nuclear Casein Kinase- and Cyclin-Dependent Kinase Substrate 1 (NUCKS1), Dual Specificity Tyrosine Phosphorylation Regulated Kinase 1A (DYRK1A), Phosphatidylinositol-4,5-Bisphosphate 3-Kinase Catalytic Subunit Alpha (PIK3CA), KAT8 Regulatory NSL Complex Subunit 1 (KANSL1), and SET Domain Containing 1A (SETD1A). These genes are pivotal within the cluster’s network, driving biological processes critical to PD, including chromatin regulation, synaptic plasticity, and metabolic pathways. The table also lists drug candidates with high predictive scores and probabilities, offering potential therapeutic strategies by targeting these genes and their interconnected functions.
Beginning with NUCKS1, a gene central to chromatin remodeling and DNA repair, its prominence in Cluster 4 reflects its importance in maintaining genomic stability—a key factor in protecting neurons from PD-related degeneration. The top drug candidate for NUCKS1, Latamoxef (DB04570), boasts an impressive raw score of 0.8272, a normalized score of 3.6216, and a perfect probability of 100%, with an uncertainty of 0.3132. As a cephalosporin antibiotic, Latamoxef might not directly tweak chromatin, but its influence on cellular stress responses or the microbiome could bolster NUCKS1’s DNA repair efforts. Following closely, Acetic Acid Salicyloyl-Amino-Ester (DB03667) scores 3.2887 with a 95.36% probability, suggesting anti-inflammatory properties that could ease oxidative stress, a frequent accomplice in PD pathology. Another contender, Etoposide toniribate (DB17255), with a score of 3.1171 and 92.97% probability, acts as a topoisomerase inhibitor, potentially stabilizing DNA structure to complement NUCKS1’s chromatin functions. Together, these drugs paint a picture of supporting NUCKS1 by enhancing genomic integrity and reducing cellular stress in PD.
Shifting focus to DYRK1A, a kinase integral to neuronal development and synaptic plasticity, its role in Cluster 4 bridges synaptic function with chromatin regulation, making it a linchpin in PD’s neurological landscape. The leading drug, Ruzinurad (DB19209), shines with a raw score of 0.8245, a normalized score of 3.5258, and a 100% probability. As a Urate Transporter 1 (URAT1) inhibitor typically tied to uric acid regulation, Ruzinurad might subtly tweak purine metabolism, indirectly nurturing DYRK1A’s synaptic duties. Next, Nerandomilast (DB18237), scoring 3.3521 with a 97.47% probability, is a phosphodiesterase inhibitor that could amplify cAMP signaling, a boon for synaptic plasticity. Then there’s Dodecyltrimethylammonium (DB02779), with a score of 3.3269 and 97.10% probability, a surfactant that might stabilize neuronal membranes, further supporting DYRK1A’s synaptic role. These candidates weave a tapestry of metabolic and synaptic support, aligning with DYRK1A’s dual influence in PD’s progression.
Turning to PIK3CA, which encodes a Phosphoinositide 3-Kinase (PI3K) subunit driving cell growth and metabolism, its high connectivity in Cluster 4 ties it to metabolic regulation and synaptic transmission—vital cogs in PD’s machinery. The top drug, AZD-9977 (DB15418), scores 3.3393 with a raw score of 0.8003 and 100% probability. As a mineralocorticoid receptor antagonist, it might temper stress responses, indirectly bolstering PIK3CA’s metabolic oversight. Rupintrivir (DB05102) follows with a score of 3.2311 and 98.48% probability; originally an antiviral, it could lighten cellular stress loads, aiding PIK3CA’s cell survival efforts. Meanwhile, Algestone (DB18000), scoring 3.1511 with 97.36% probability, is a progestin that might tap into hormonal neuroprotection pathways. These drugs collectively target PIK3CA’s metabolic and stress-related roles, offering a multifaceted approach to PD’s metabolic disruptions.
Next, KANSL1, a gene steering histone acetylation and chromatin accessibility, underscores Cluster 4’s epigenetic dimension, shaping gene expression in PD-affected neurons. The top candidate, Ferrous ascorbate (DB14490), achieves a score of 3.3529 with a raw score of 0.814 and 100% probability. As an iron supplement, it could enhance mitochondrial function and curb oxidative stress, indirectly supporting KANSL1’s chromatin work. Ilepatril (DB06604), with a score of 3.2914 and 99.10% probability, is a vasopeptidase inhibitor that might improve vascular health, bolstering neuronal resilience. Then, Didesmethylrocaglamide (DB15496), scoring 3.0701 with 95.84% probability, a natural compound, might tweak protein synthesis to align with KANSL1’s epigenetic influence. These drugs blend metabolic and epigenetic strategies, addressing KANSL1’s role in PD’s molecular narrative.
Finally, SETD1A, a histone methyltransferase regulating gene expression, ties chromatin dynamics to synaptic plasticity in Cluster 4, offering another layer to PD’s complexity. The leading drug, 1-Hydroxyamine-2-Isobutylmalonic Acid (DB02326), scores 3.3643 with a raw score of 0.8038 and 100% probability, potentially influencing metabolic pathways to support SETD1A’s regulatory role. Vinflunine (DB11641), with a score of 3.3134 and 99.24% probability, is a microtubule inhibitor that might stabilize cytoskeletal dynamics, aiding synaptic health. Sobetirome (DB07425), scoring 3.3099 with 99.19% probability, a thyroid hormone analog, could boost neuronal metabolism, reinforcing SETD1A’s functions. These candidates offer a mix of metabolic and structural support, targeting SETD1A’s contributions to PD.
In weaving this analysis, Cluster 4 emerges as a hub where NUCKS1, DYRK1A, PIK3CA, KANSL1, and SETD1A orchestrate PD’s progression through chromatin regulation, synaptic plasticity, and metabolic pathways. The drug candidates, with probabilities often exceeding 95% and low uncertainties, span a pharmacological spectrum—from antibiotics like Latamoxef for NUCKS1 to metabolic modulators for PIK3CA and SETD1A.
Table A5 lists the top 10 drug candidates predicted by the Multi-Modal GNN model for Cluster 5, focusing on the genes Methylcrotonoyl-CoA Carboxylase 1 (MCCC1), WW Domain Containing Oxidoreductase (WWOX), Chaperonin Containing TCP1 Subunit 3 (CCT3), Cardiolipin Synthase 1 (CRLS1), and Phosphomevalonate Kinase (PMVK).
Beginning with MCCC1, this gene plays a vital role in leucine metabolism and mitochondrial function, making it a cornerstone of energy homeostasis—a process often disrupted in PD due to mitochondrial dysfunction. The table identifies MMI-175 (DB02378) as the top drug candidate for MCCC1, with an impressive raw score of 0.8096, a normalized score of 3.4908, and a flawless 100% probability, accompanied by a low uncertainty of 0.2966. MMI-175, likely a metabolic modulator, could enhance mitochondrial efficiency or combat oxidative stress, directly supporting MCCC1’s energy-producing role. Following closely is Gedatolisib (DB11896), a PI3K/Mechanistic target of Rapamycin (mTOR) inhibitor, scoring 3.352 with a 98.03% probability and an uncertainty of 0.3406. By stabilizing cellular growth and metabolism, Gedatolisib offers an indirect boost to MCCC1’s functions. Another notable candidate, Testosterone decanoate (DB16001), scores 3.0506 with a 93.75% probability and an uncertainty of 0.289. This hormonal agent might promote mitochondrial biogenesis, providing a complementary approach to MCCC1’s metabolic contributions. Together, these drugs suggest a therapeutic strategy centered on reinforcing mitochondrial health and energy stability, key to addressing PD’s energetic deficits.
Next up is WWOX, a tumor suppressor gene that links synaptic plasticity and neuronal survival, playing a dual role in synaptic transmission and cellular stress responses within Cluster 5. The leading drug here is Zinc cation (DB14532), which achieves a normalized score of 3.285, a raw score of 0.7966, and a perfect 100% probability with an uncertainty of 0.274. Zinc’s involvement in synaptic transmission and neuroprotection makes it an ideal match for WWOX, potentially enhancing neuronal communication and resilience. Cyproterone acetate (DB04839) follows with a score of 3.1064, a 97.4% probability, and an uncertainty of 0.3301. As an antiandrogen, it might reduce neuroinflammation or oxidative stress, bolstering WWOX’s protective effects. Rounding out the top contenders is Lutein (DB00137), scoring 3.0108 with a 96.00% probability and an uncertainty of 0.3759. This antioxidant could mitigate oxidative damage, further supporting WWOX’s role in synaptic stability and neuronal survival. These candidates paint a picture of synaptic reinforcement and neuroprotection, directly tackling WWOX’s contributions to PD’s neurodegenerative landscape.
Turning to CCT3, a chaperonin gene essential for protein folding and synaptic integrity, its high connectivity in Cluster 5 ties it to protein aggregation and synaptic transmission—core issues in PD. The top drug, Acteoside (DB12996), scores 3.2404 with a raw score of 0.7781 and a 100% probability, with an uncertainty of 0.3076. As a neuroprotective compound, Acteoside could enhance protein folding or reduce aggregation, aligning with CCT3’s role in maintaining synaptic health. Hypophosphite (DB04053) comes in close behind, with a score of 3.2365, a 99.94% probability, and an uncertainty of 0.3599. This agent might modulate cellular redox states, indirectly aiding CCT3’s chaperoning duties. Another intriguing option is Osalmid (DB16273), scoring 3.1599 with a 98.8% probability and an uncertainty of 0.3294. As a choleretic agent, it could subtly influence bile acid metabolism, potentially easing neuronal stress. These drugs collectively offer a mix of protein homeostasis and metabolic support, resonating with CCT3’s biological significance in PD.
For CRLS1, which encodes cardiolipin synthase and is critical for mitochondrial membrane integrity, its prominence in Cluster 5 underscores its importance in mitochondrial function and energy production. The standout drug here is Candoxatrilat (DB11623), boasting a normalized score of 3.4084, a raw score of 0.8117, and a 100% probability with an uncertainty of 0.3816. As a neutral endopeptidase inhibitor, Candoxatrilat might enhance mitochondrial resilience by reducing oxidative stress or improving vascular health. Tivantinib (DB12200) follows with a score of 3.3979, a 99.84% probability, and an uncertainty of 0.3615. This c-Met inhibitor could stabilize cellular growth pathways, indirectly supporting CRLS1’s mitochondrial role. Additionally, (R)-tacrine(10)-hupyridone (DB04614) scores 3.3829 with a 99.62% probability and an uncertainty of 0.2907. As an acetylcholinesterase inhibitor, it might enhance synaptic transmission while also supporting mitochondrial health. These candidates blend mitochondrial fortification with synaptic support, offering a comprehensive approach to CRLS1’s involvement in PD.
Lastly, PMVK, encoding phosphomevalonate kinase in cholesterol biosynthesis, connects metabolic regulation to synaptic transmission within Cluster 5. The leading drug, 25-desacetylrifapentine (DB15213), scores 3.31 with a raw score of 0.7947 and a 100% probability, with an uncertainty of 0.3141. This antibiotic might influence the gut-brain axis, indirectly supporting PMVK’s metabolic functions. Diethylcarbamazine (DB00711), with a score of 3.2864, a 99.66% probability, and an uncertainty of 0.3038, is an antihelminthic that could reduce systemic inflammation, aiding PMVK’s cholesterol regulation. Dexepicatechin (DB19253), scoring 3.2826 with a 99.61% probability and an uncertainty of 0.2872, is a flavonoid with antioxidant properties that might stabilize neuronal membranes, complementing PMVK’s metabolic role. These drugs weave together metabolic and anti-inflammatory strategies, aligning with PMVK’s contributions to PD pathology.
In conclusion, the genes of Cluster 5—MCCC1, WWOX, CCT3, CRLS1, and PMVK—form a tightly knit network that drives PD through mitochondrial dysfunction, synaptic instability, and metabolic dysregulation. The drug candidates, frequently exceeding 95% probability with low uncertainties, span a rich pharmacological spectrum: metabolic modulators like MMI-175 for MCCC1, neuroprotective agents like Zinc for WWOX, and mitochondrial stabilizers for CRLS1.
The Multi-Modal GNN framework identifies several promising drug candidates that target multiple PD-associated genes simultaneously. While our previous analysis explored cluster-specific results, the findings presented below highlight drugs demonstrating polypharmacological potential—an increasingly valued property in neurodegenerative disease treatment approaches. By simultaneously modulating multiple pathological pathways, these compounds may offer more robust therapeutic effects than single-target interventions. Table 6 presents seven drug candidates with high confidence scores (z-Scores > 2.8 ) and low uncertainty values, each targeting different pairs of key Parkinson’s genes. Moreover, Figure 9 provides detailed distributional information on these drugs.
An important aspect of these candidates is their origin and pharmacological properties, which affect how readily they could be repurposed for PD. Several hits are compounds that were developed for non-neurological indications and whose use in humans is established, at least historically. Dithiazanine (DB11516), for instance, is an anti-helminthic cyanine dye that was once used to treat parasitic worm infections. However, it was withdrawn from clinical use after being linked to fatal cases of lactic acidosis and shock in the 1960s. Its predicted network impact (high z-score around 3.0 and low uncertainty 0.14) via GAK/KANSL1 is compelling, yet the compound’s known toxicity profile poses a major concern for repurposing. Any consideration of dithiazanine would require structural optimization to retain its polypharmacology while mitigating toxicity, or else restricting its use to experimental in vitro models of PD (for example, as a tool to activate autophagy/mitophagy pathways) rather than direct therapeutic use.
In contrast, ceftolozane (DB09050) is a modern drug with a defined safety and pharmacokinetic profile. It is a β -lactam antibiotic (a cephalosporin derivative) approved as part of a combination product (ceftolozane/tazobactam) for treating resistant bacterial infections such as complicated urinary tract and intra-abdominal infections. Ceftolozane’s selection by the model (z-score around 2.96) is unexpected in the PD context, as it does not have known direct effects on human proteins outside of bacterial targets. Importantly, ceftolozane is administered intravenously and, like most β -lactams, has limited penetration of the blood-brain barrier under normal conditions. This means that repurposing it for PD would face challenges in delivering adequate drug to the brain. Nevertheless, its putative targets TMEM175 and RIT2 suggest a novel use-case: if ceftolozane (or a derivative) can influence lysosomal pH regulation or synaptic GTPase function independently of its antibacterial action, it might modulate neurodegenerative processes. Given its existing U.S. Food and Drug Administration (FDA) approval, a derivative with improved central nervous system (CNS) permeability could be developed and rapidly advanced, leveraging ceftolozane’s known pharmacology.
Another group of candidates comprises molecules that have been used as supplements or sedatives, implying some degree of human exposure data. DL- α -Tocopherol (DB14476), essentially vitamin E, is widely available as a nutritional supplement and has been evaluated at high doses in neurodegenerative disease trials. Its safety is well-characterized: vitamin E is fat-soluble and can accumulate, with very high doses (>2000 IU/day) potentially increasing risk of hemorrhagic stroke or all-cause mortality in some studies, but moderate doses are generally benign. Notably, tocopherol was tested in early PD patients as an antioxidant; while it did not significantly delay disability onset, it was well-tolerated, and there remains interest in using vitamin E or its analogs for neuroprotection [46,47]. The model’s rediscovery of alpha-tocopherol (z score around 3.15, uncertainty around 0.26) adds credibility to the polypharmacology approach, as it targets MAPT and BCKDK–two proteins linked to protein aggregation and mitochondrial stress–which aligns with the known antioxidant mechanism of vitamin E. This suggests vitamin E could be revisited in combination with other interventions or specific patient subsets (e.g., those with mitochondrial gene variants) for PD.
Bromisoval (DB13370), also known as bromovalerylurea, is a sedative-hypnotic drug first synthesized over a century ago and used in over-the-counter sleep remedies in parts of Asia. It acts as a CNS depressant (likely via GABAergic activity like other bromide-containing sedatives) and can cross the blood-brain barrier. Chronic use of bromisoval is associated with bromide accumulation and toxicity (bromism), and it has largely fallen out of favor where modern anxiolytics and hypnotics are available. Bromisoval’s predicted targets, LRRK2 and APOE, are quite novel for a sedative: if bromisoval indeed inhibits LRRK2 kinase activity or alters APOE expression, it would represent a repurposing breakthrough. Given its decent brain availability, bromisoval or improved analogs could potentially be used at lower, non-sedative doses to impact neuroinflammatory and protein phosphorylation pathways in PD. However, thorough preclinical testing would be needed to confirm such effects, and careful monitoring for chronic toxicity is required (e.g., periodic bromide level checks). Imidurea (DB14075), on the other hand, is not a traditional systemic drug at all but an antimicrobial preservative (imidazolidinyl urea) used in cosmetics and topical formulations. It works by slowly releasing formaldehyde to kill microbes. Its appearance as a PD candidate (targets APOE and CRLS1) is intriguing but raises questions: imidurea has no established use inside the body and could be toxic if ingested chronically (due to formaldehyde release and other breakdown products). It might mimic certain chemical motifs that modulate APOE or lipid metabolism, but directly repurposing it for PD is doubtful. Instead, imidurea could be a starting point to identify analogues that modulate cardiolipin synthesis or APOE secretion without harmful effects. Any in vivo application would need reformulation (perhaps a prodrug or nanoformulation) to avoid releasing reactive species systemically.
Finally, we have compounds that are used in specialized medical contexts: medronic acid (DB14078) and modufolin (DB12676). Medronic acid (also known as methylene diphosphonate) is a bisphosphonate compound primarily used as a bone-seeking agent in nuclear medicine (technetium-99m medronate scans) and sometimes as a treatment for heterotopic ossification. It strongly chelates to bone mineral and does not readily cross membranes. Its predicted targets GPNMB and BST1 suggest an effect on immune or stromal cells; interestingly, osteoclasts and microglia share some common signaling pathways (GPNMB, for instance, is expressed in osteoclasts and upregulated by bisphosphonates). It is conceivable that medronic acid could exert anti-inflammatory effects in the periphery or bone marrow that indirectly benefit the brain, but delivering it to the CNS is a major hurdle (bisphosphonates are highly polar and mostly restricted to bone after IV injection). Thus, while medronic acid’s target profile fits a neuroimmune modulation theme, its utility might lie in inspiring novel bone-to-brain axis ideas or in designing bisphosphonate-like molecules that target microglia. Modufolin is a clinical-stage folate analogue (a stabilized form of folinic acid) being evaluated as an adjunct in cancer chemotherapy to enhance folate availability irrespective of patients’ metabolic polymorphisms. As an endogenous nutrient, its safety is high (similar to folate and folinic acid, which are used to manage elevated homocysteine levels in PD and to rescue methotrexate toxicity). The model predicts modufolin targets NUCKS1 and WWOX–a curious combination, since these are not classical drug targets but rather a nuclear protein involved in transcriptional regulation (NUCKS1) and a tumor suppressor/oxidoreductase (WWOX). Both genes have been linked to neurodegenerative disease genetics: NUCKS1 resides in the PARK16 locus and its variants associate with PD susceptibility [48], and WWOX lies in a chromosomal fragile site implicated in Alzheimer’s and possibly PD [49]. One speculative interpretation is that modufolin’s provision of bioactive folate could support DNA repair and methylation reactions in neurons, potentially stabilizing genomic regions like those WWOX spans or influencing the expression of genes like NUCKS1. In practical terms, modufolin could be tested in PD patients as a therapeutic vitamin–it might improve one-carbon metabolism and reduce homocysteine (which can be elevated in levodopa-treated patients), thereby possibly slowing vascular contributions to PD or improving cognitive outcomes. Its relatively lower model score (around 2.83) and higher uncertainty (around 0.30) suggest that this prediction is less confident, yet given its safety and the general rationale of maintaining metabolic health in PD, modufolin would be one of the easier candidates to justify in a pilot trial.
Overall, these findings underscore the value of a polypharmacological approach to Parkinson’s disease, which is increasingly recognized as a network disorder rather than a single-pathway disease. Traditional “one drug, one target” strategies may falter in complex disorders like PD because they fail to address the multiple, parallel processes that drive neurodegeneration. In contrast, a multi-target drug (or drug combination) can simultaneously correct disparate but converging pathologies–for example, reducing protein aggregation and dampening neuroinflammation at the same time. This systems perspective is supported by our identification of compounds that hit distinct arms of PD pathology (such as lysosomal function and immune regulation). By intervening at multiple nodes, there is potential for a more profound disease-modifying effect, as has been suggested in other multifactorial conditions including Alzheimer’s and metabolic syndrome. Indeed, the first new chemical entity approved for neurodegeneration in over a decade was a multi-target drug (safinamide, which both inhibits Monoamine Oxidase B (MAO-B) and modulates glutamate release). The present candidates extend this concept by targeting the molecular network underpinning PD progression, not just neurotransmitter symptoms. It is important to balance this optimism with caution: polypharmacology can also lead to off-target side effects and complexity in drug development. The ideal scenario is to achieve network-selective polypharmacology, whereby a drug’s multiple targets all lie within the pathological network one wishes to modulate, and not in unrelated pathways that would cause toxicity. The computational model aimed to fulfill this by screening for drugs that map onto the PD gene network with high specificity (reflected in the high z-scores for network enrichment). The fact that some resulting drugs (like bromisoval and dithiazanine) have toxicity issues highlights that further refinement is needed–possibly through medicinal chemistry to design safer analogs that maintain the desired polypharmacology. Nonetheless, several hits (vitamin E, modufolin) show that it is feasible to find drug-like compounds operating on multiple PD targets with acceptable safety.

3. Methodology

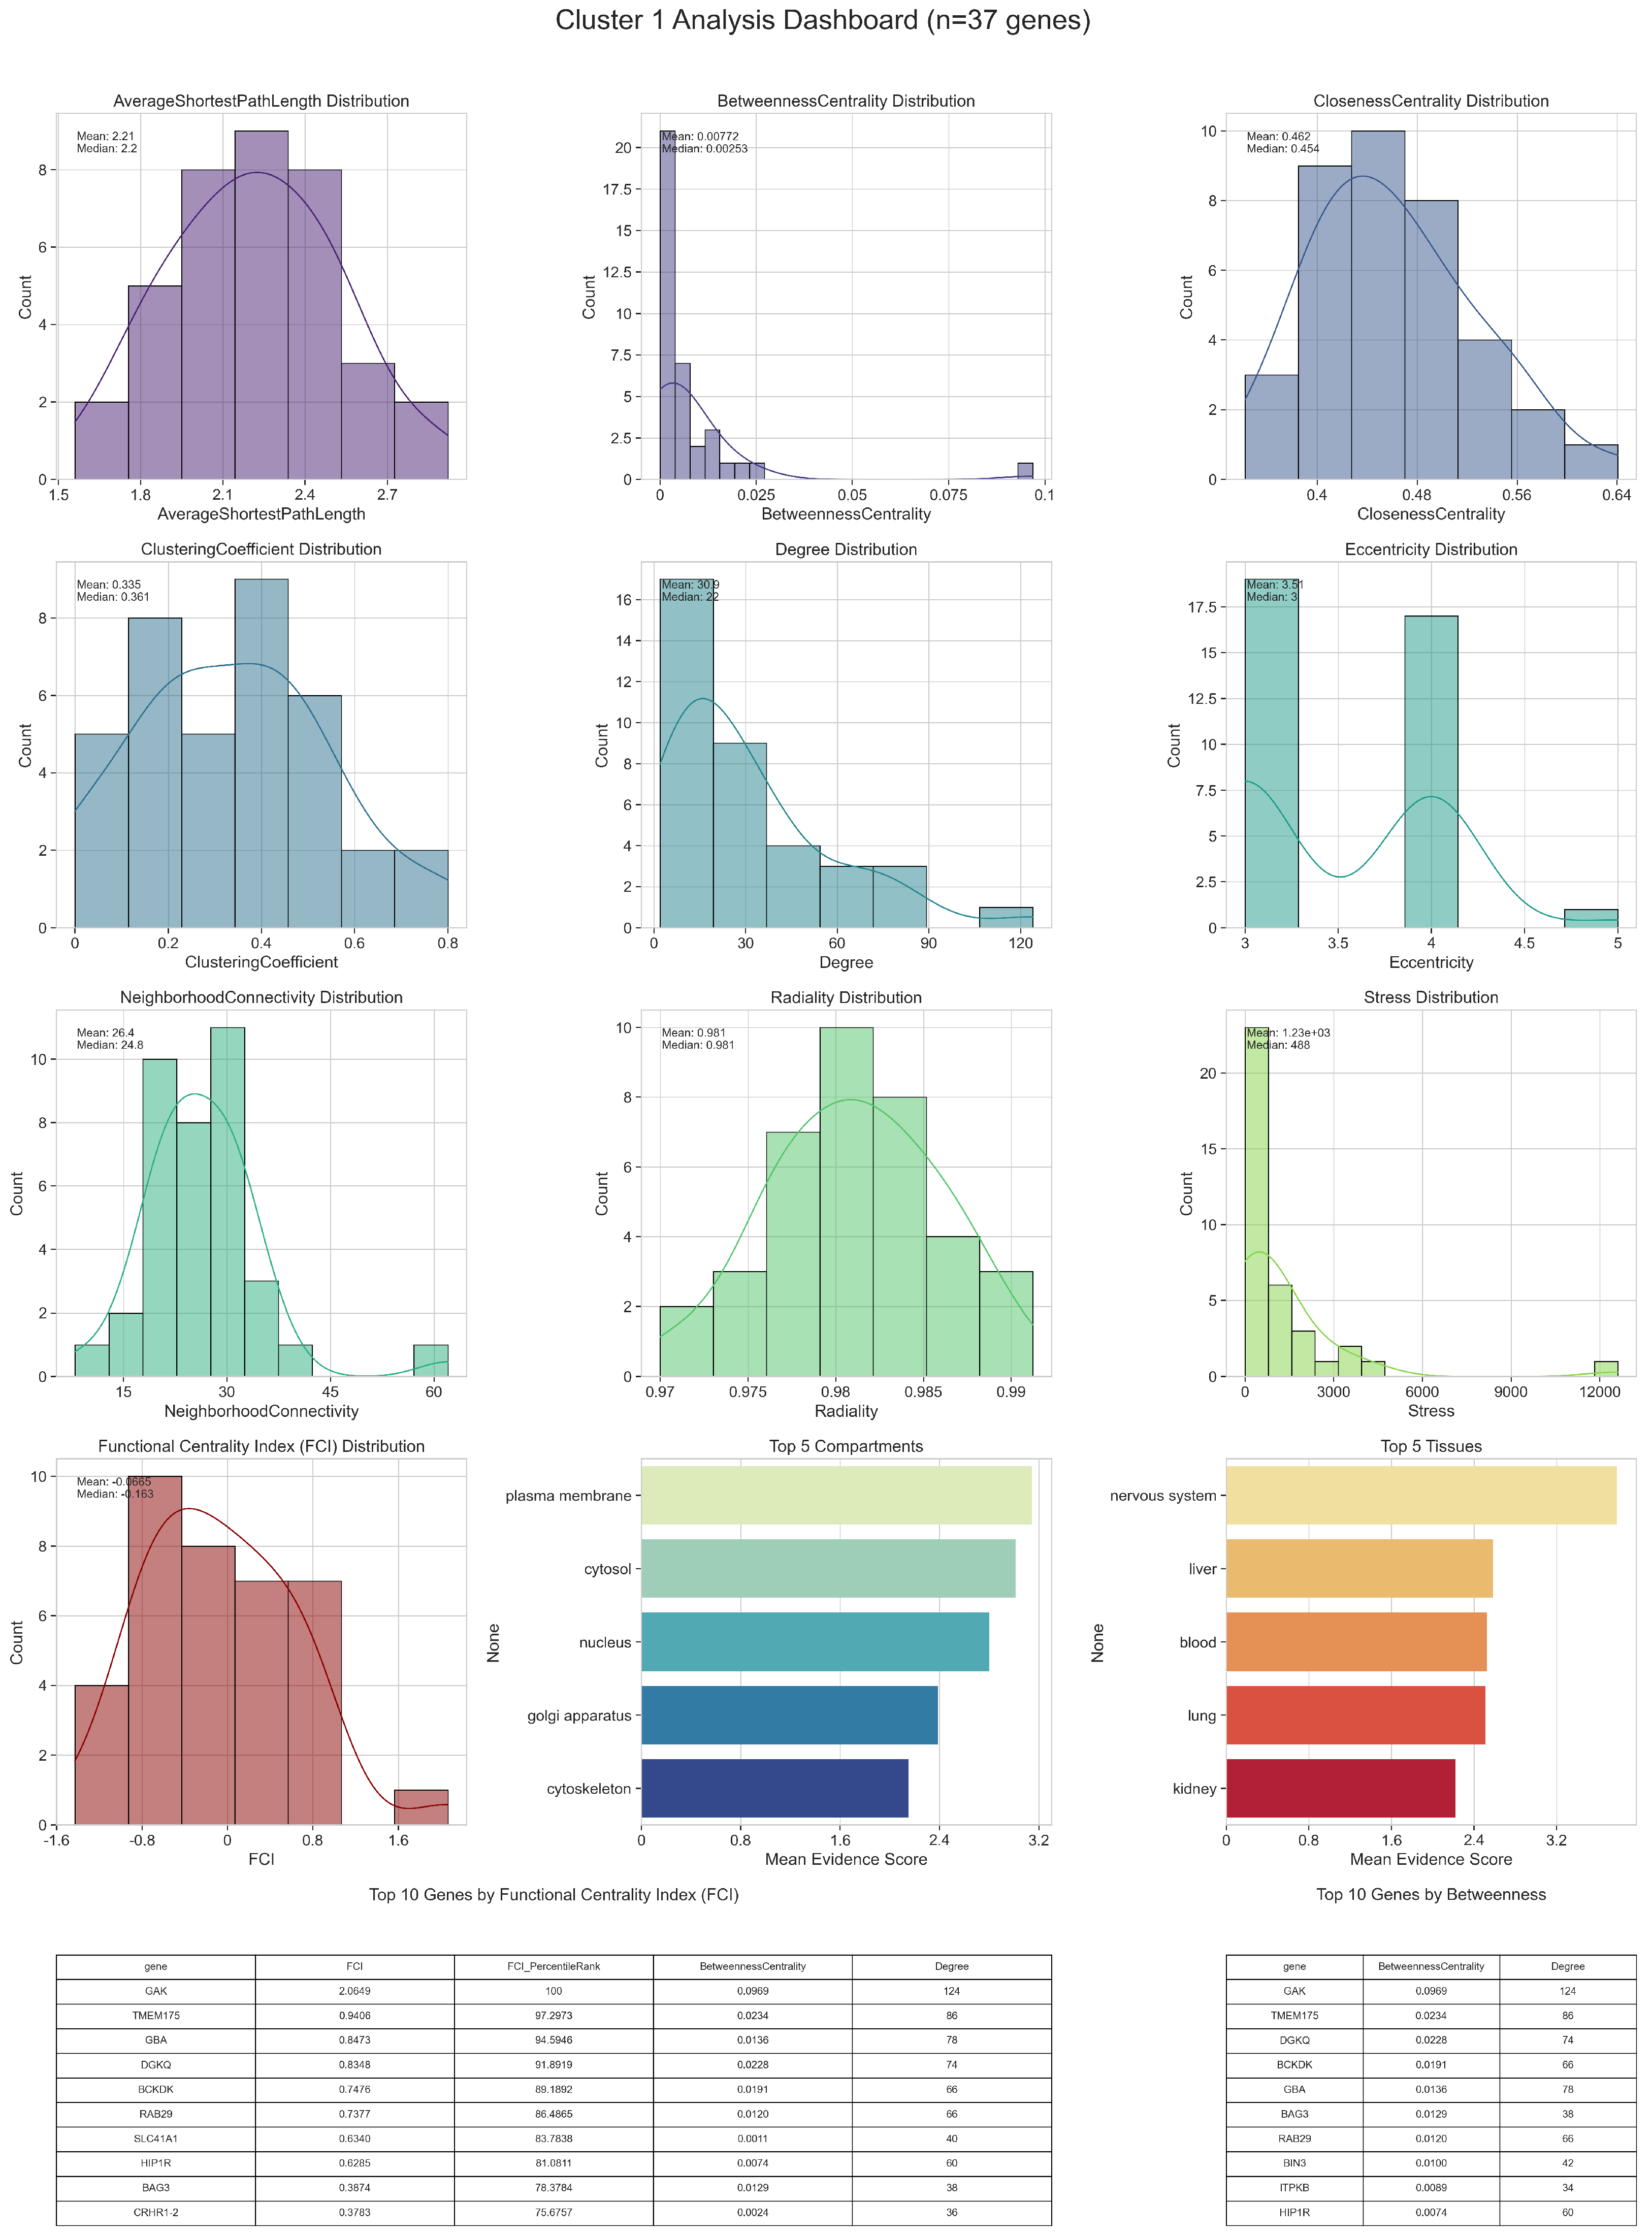
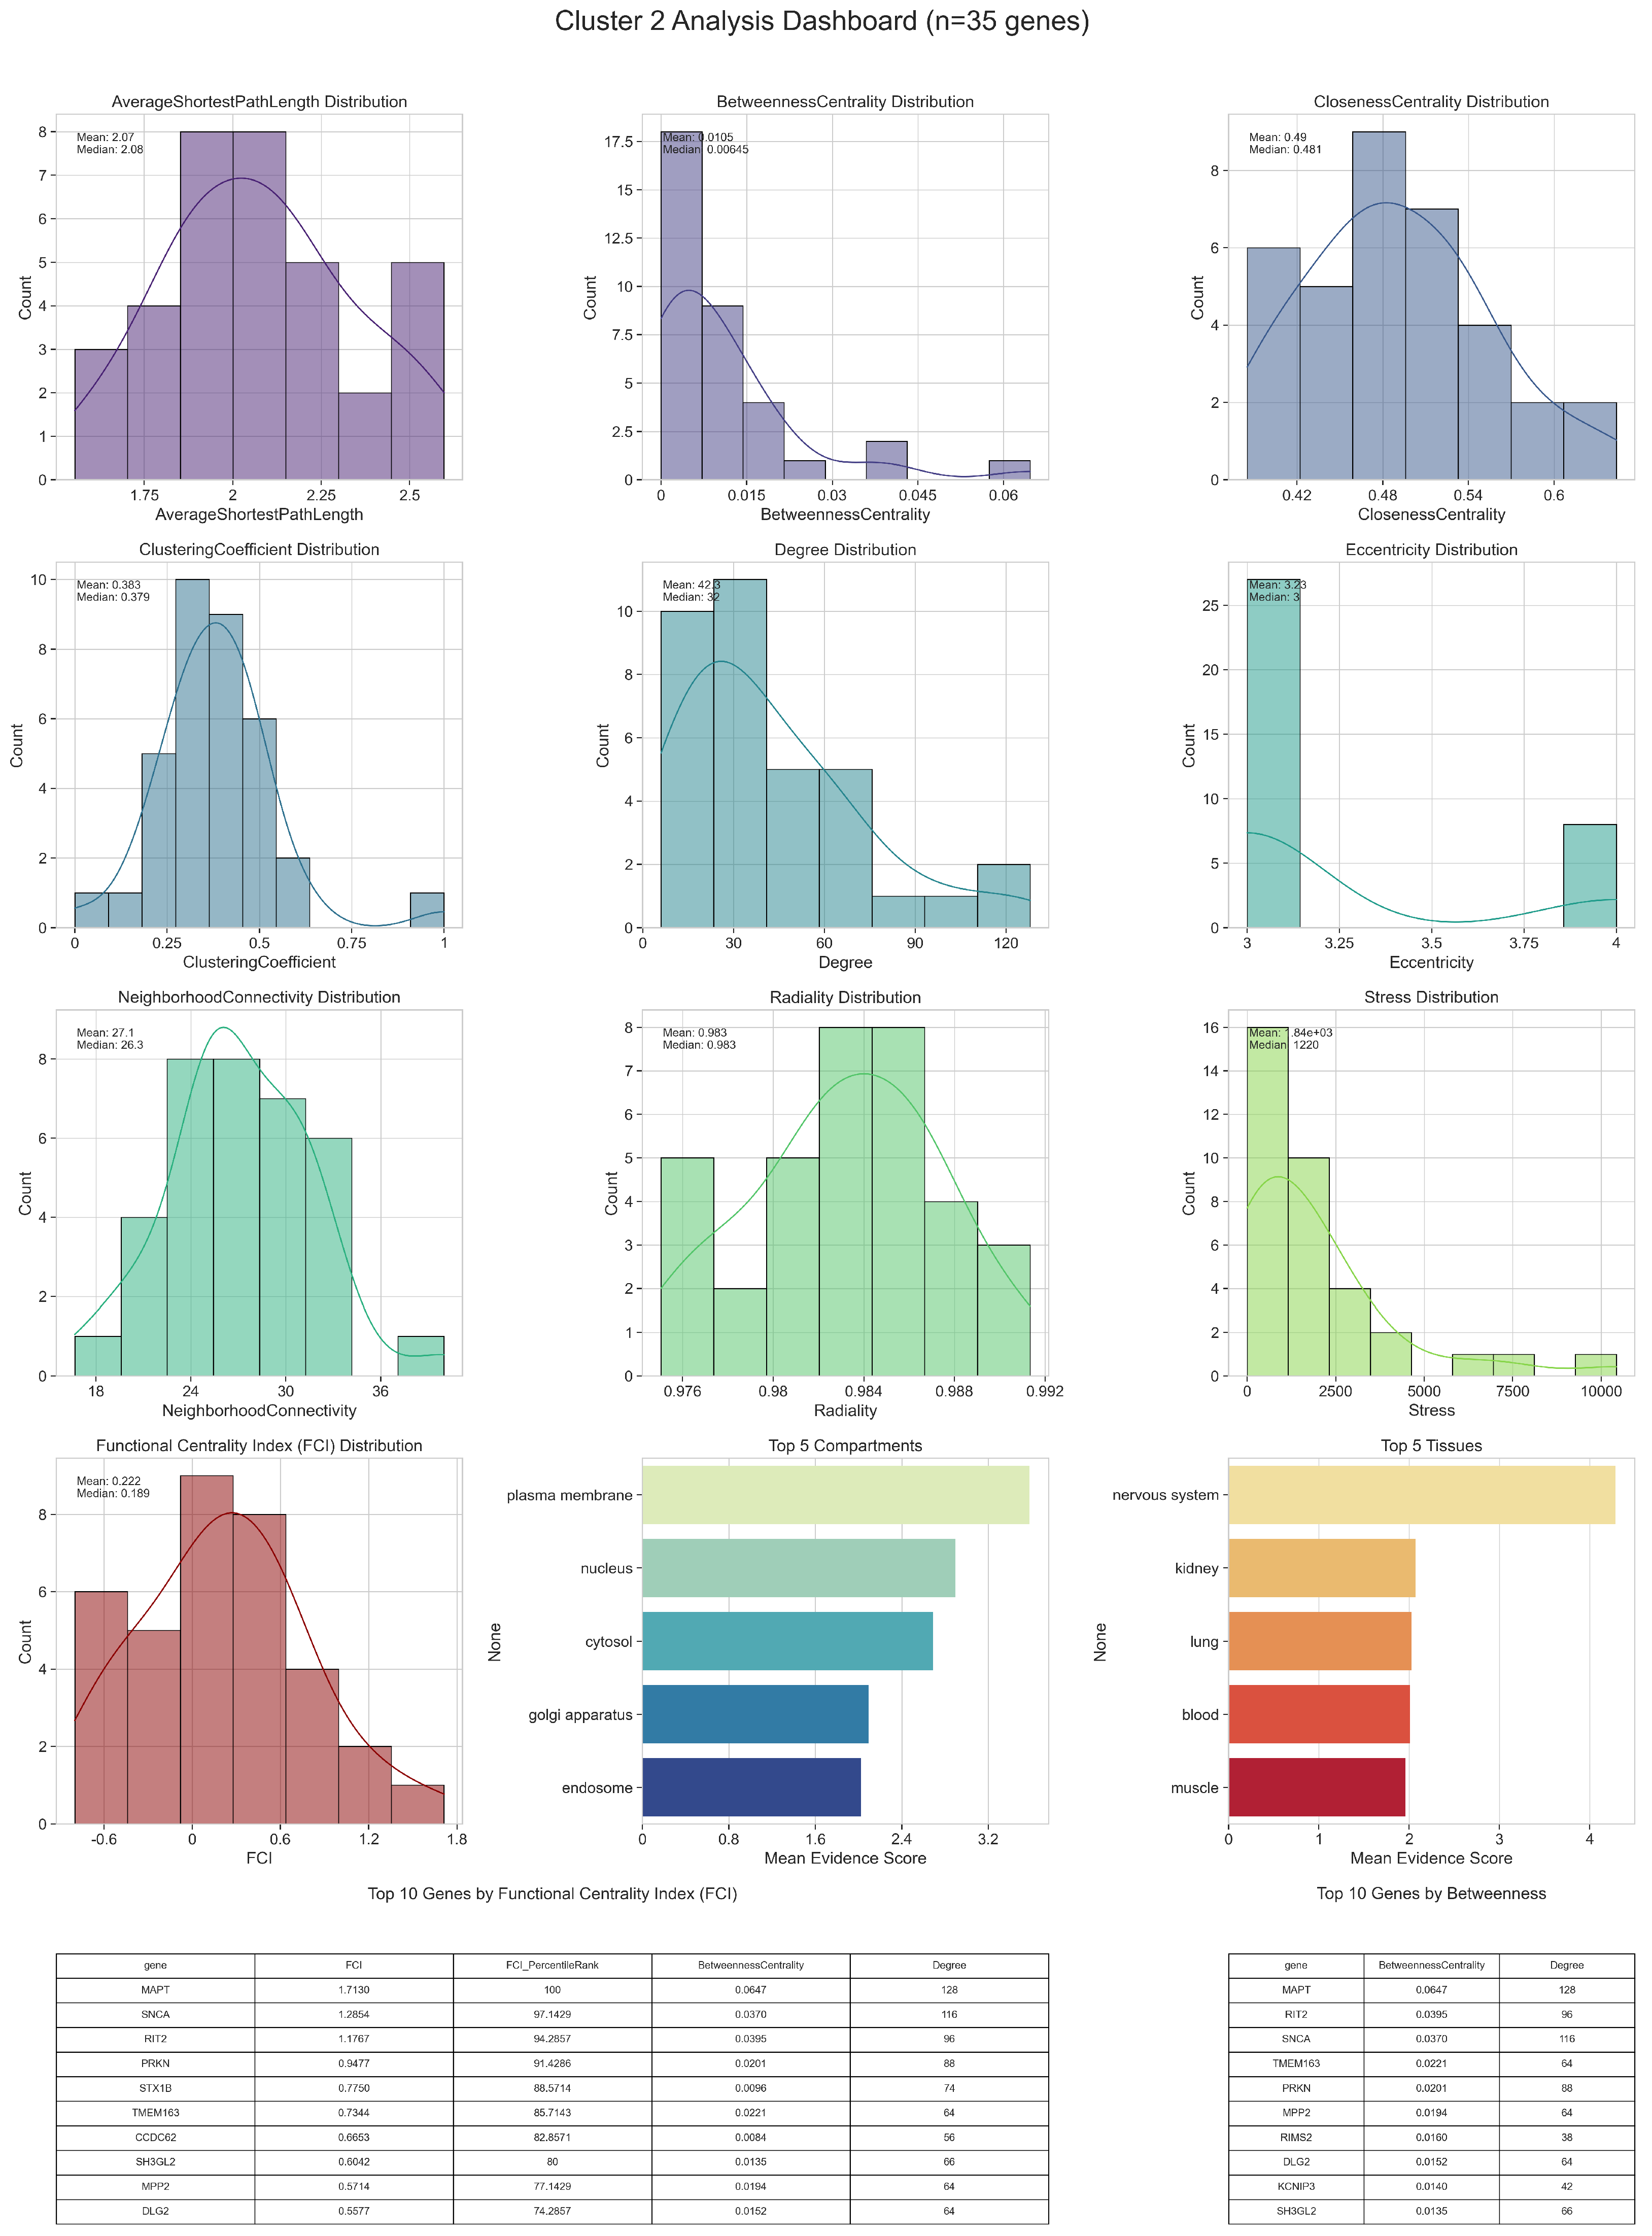
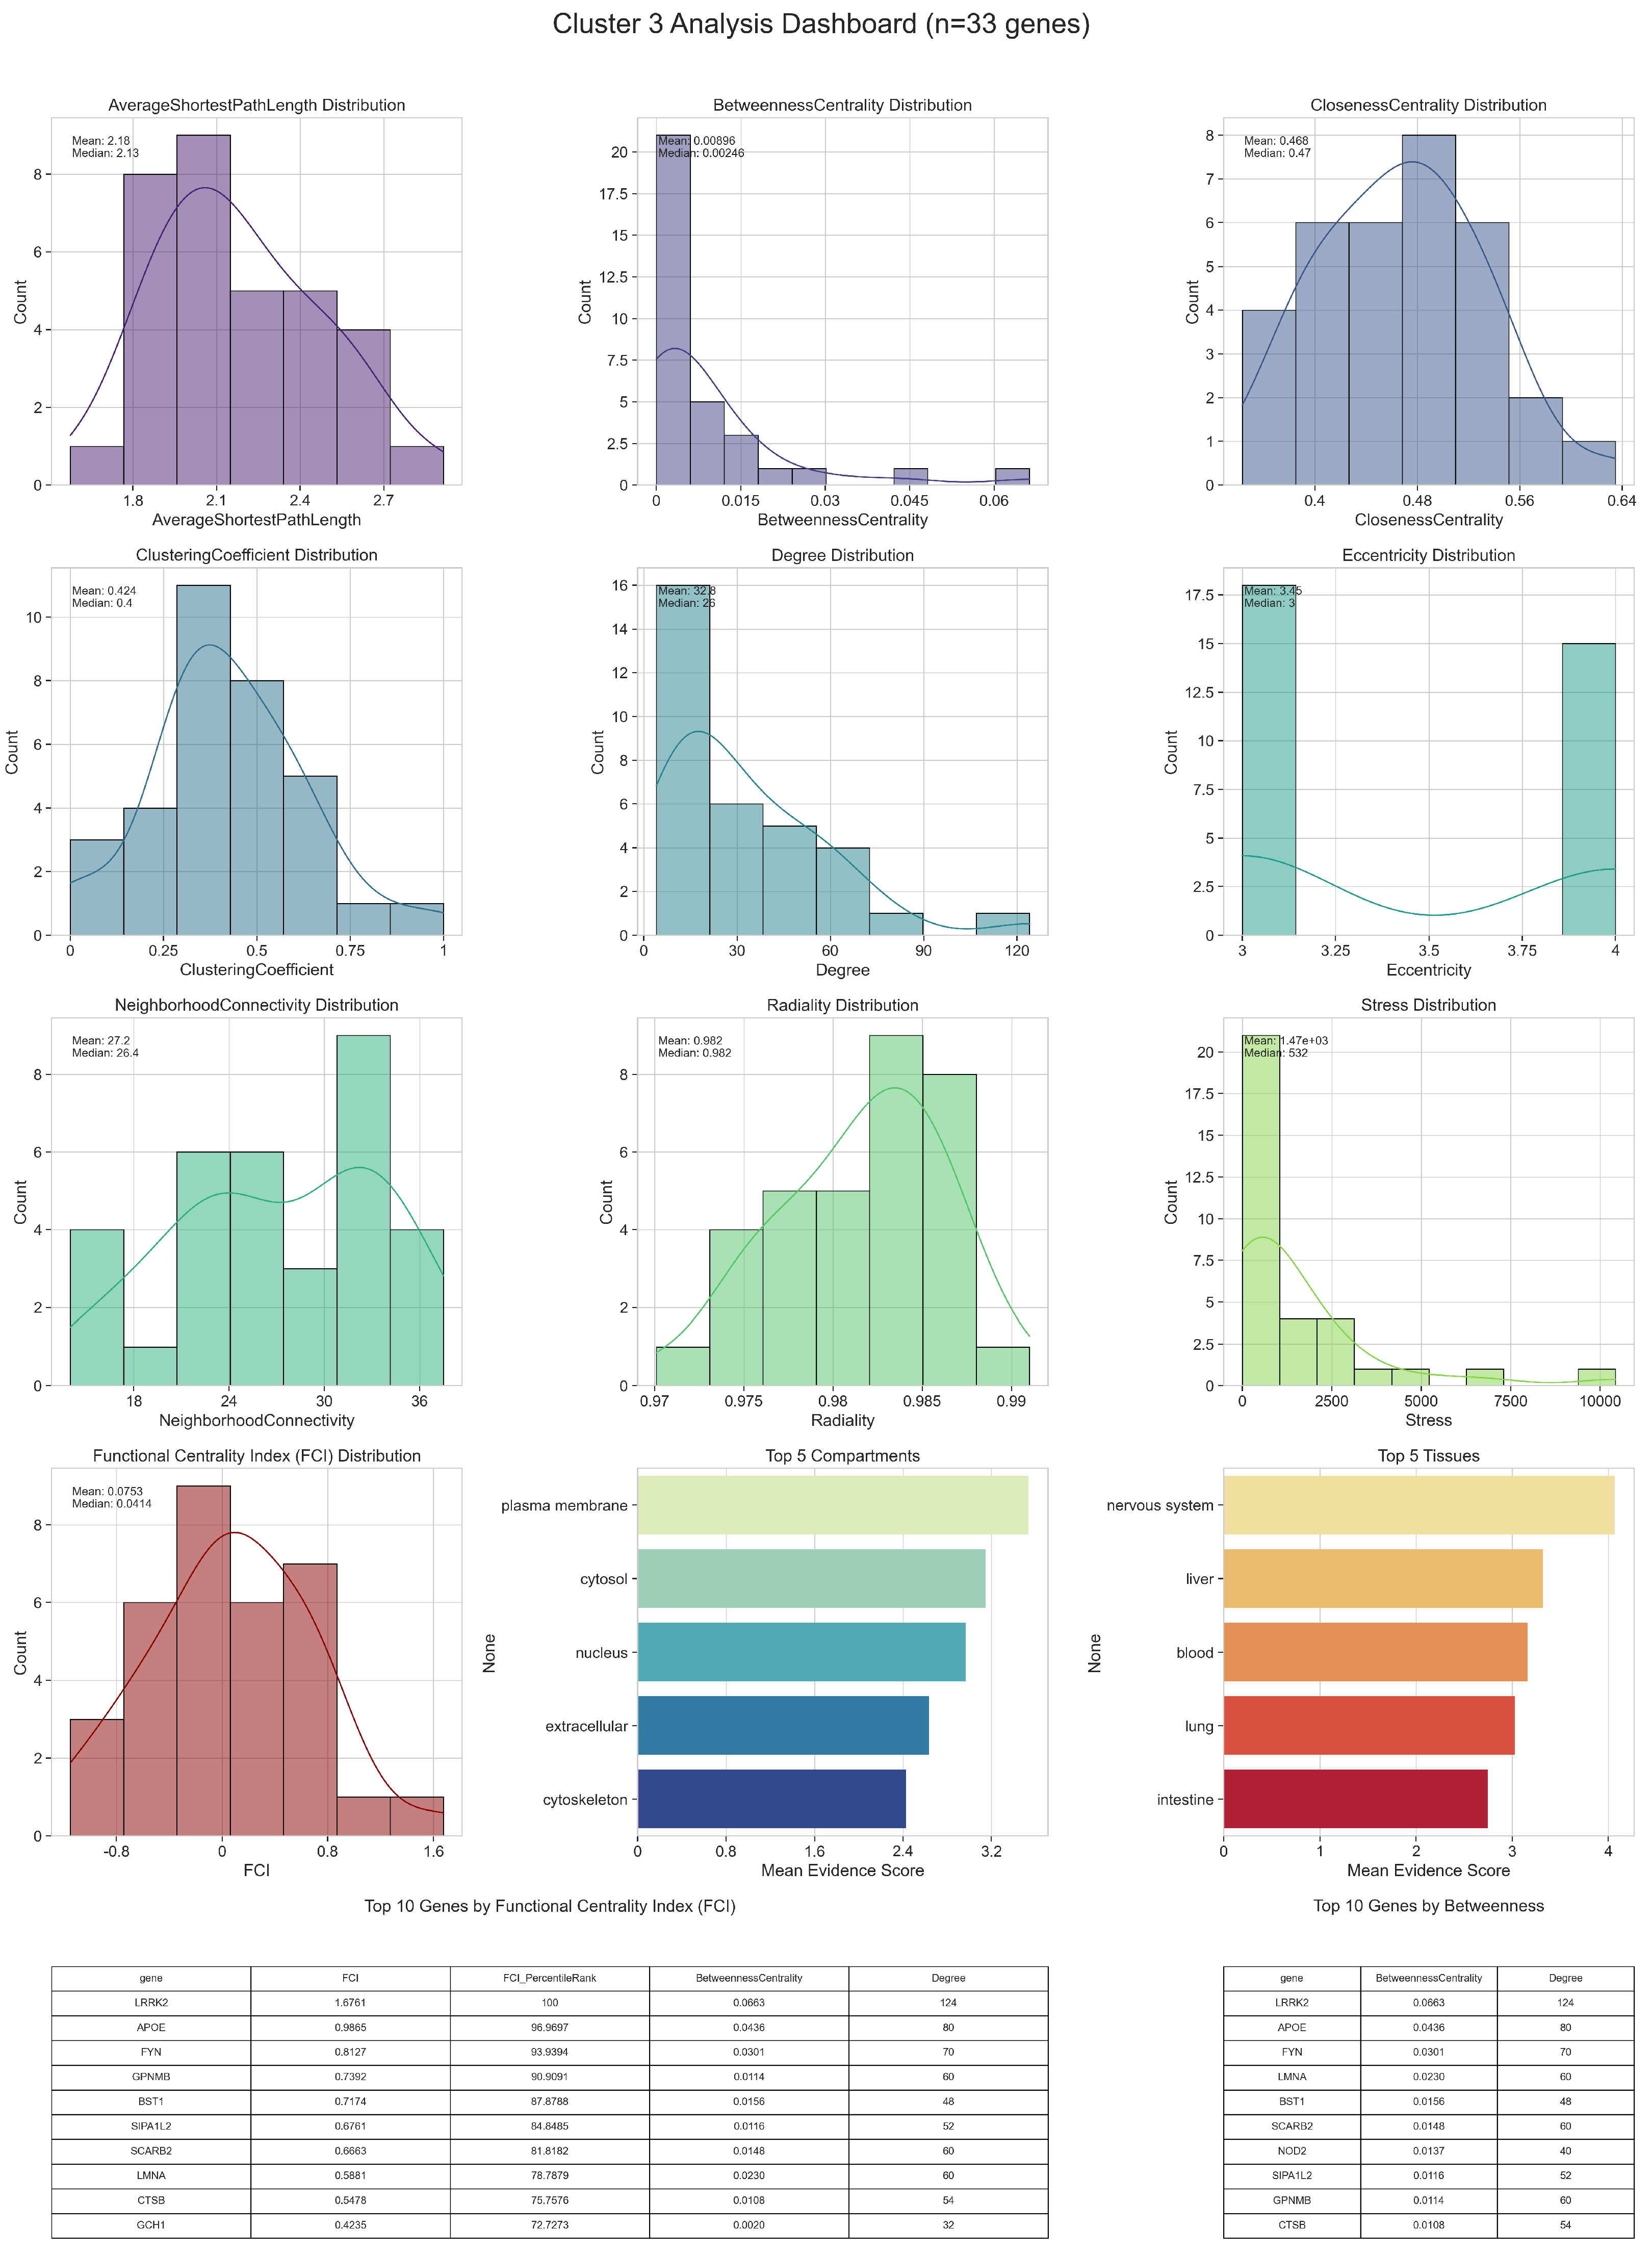
3.1. Network Analysis

3.1.1. Centralities and Functional Centrality Index

In the study of biological networks, topological metrics are employed to elucidate the structural properties of nodes—typically representing genes or proteins—and thereby reveal their functional roles within the system. A fundamental measure is the Degree Centrality, denoted by k i , which quantifies the number of direct interactions a node i maintains, serving as a primary indicator of its local connectivity. This measure sets the stage for more intricate evaluations of network behavior.
Betweenness Centrality is another critical metric that captures the extent to which a node functions as an intermediary in the flow of information. It is mathematically expressed as
C B ( i ) = s i t σ s t ( i ) σ s t ,
where σ s t represents the total number of shortest paths between nodes s and t, and σ s t ( i ) denotes those paths that pass through node i. This formulation identifies nodes that are pivotal in connecting disparate regions of the network and facilitating inter-module communication.
Closeness Centrality, defined by
C C ( i ) = 1 j i d ( i , j ) ,
where d ( i , j ) is the shortest path distance between nodes i and j, provides a measure of the efficiency with which a node can spread information across the network. A higher closeness centrality indicates that a node is, on average, more proximal to all other nodes, thereby enhancing its potential influence.
The Clustering Coefficient,
C i = 2 e i k i ( k i 1 ) ,
where e i is the number of edges connecting the neighbors of node i, reflects the degree to which a node’s immediate neighborhood forms a cohesive subnetwork, often corresponding to functional modules. Complementary to these metrics, Neighborhood Connectivity evaluates the average connectivity of a node’s direct neighbors, providing additional context about its local environment, while Radiality assesses a node’s integration into the overall network architecture.
Conversely, measures such as Eccentricity, ϵ i , defined as the maximum shortest path from node i to any other node, underscore the node’s positional centrality by highlighting its remoteness from the network periphery. The Average Shortest Path Length,
L i = 1 n 1 j i d ( i , j ) ,
where n is the total number of nodes, quantifies the mean distance from node i to all others, thereby emphasizing the efficiency of signal transmission. Moreover, Stress, given by
S i = s i t σ s t ( i ) ,
captures the cumulative burden placed on a node through its participation in the network’s shortest paths, thereby potentially pinpointing bottlenecks that may compromise network robustness. Finally, the Topological Coefficient, T i , gauges the extent to which a node shares common neighbors with other nodes, thus offering insights into its functional redundancy and specialization within the network.
To integrate these diverse topological descriptors into a unified framework, we define the Functional Centrality Index (FCI). The FCI aggregates multiple metrics, each calibrated by a biologically informed weight, into a composite score that reflects the functional significance of a node. Prior to integration, each metric is standardized such that its distribution has a mean of zero and a variance of one, i.e.,
z m , i = m ( i ) μ m σ m ,
where m ( i ) is the raw value of metric m for node i, and μ m and σ m are the corresponding mean and standard deviation. For metrics where lower values indicate greater functional importance—such as L i , ϵ i , and S i —the standardized scores are inverted via multiplication by 1 , ensuring that higher z-scores uniformly represent superior performance.
The FCI is then computed as the weighted sum of these standardized metrics:
FCI i = 1 W m w m · z m , i ,
with w m denoting the weight attributed to metric m and W = m w m serving as the normalization constant. These weights are meticulously chosen to mirror the biological significance of each metric; for instance, Betweenness Centrality may be assigned a relatively high weight to underscore its role in mediating information flow, whereas Closeness Centrality, Clustering Coefficient, Degree, Radiality, and Neighborhood Connectivity capture complementary aspects of both local and global network structure. Inverse metrics such as Eccentricity and Stress, after inversion, contribute to the index in a manner that enhances the interpretability of the overall score.
This formulation of the FCI facilitates the identification of key nodes—whether genes or proteins—that occupy central and functionally critical positions within the network, thereby offering a robust quantitative tool for probing the intricate interplay between network topology and biological function.

3.1.2. Node Clustering

In gene network analysis, the leading eigenvector algorithm is a cornerstone for uncovering community structure through spectral graph theory. Consider a gene interaction network represented by an adjacency matrix A , where each element A i j is defined as 1 if gene i interacts with gene j, and 0 otherwise. The first step of the algorithm involves constructing the modularity matrix B , with elements given by
B i j = A i j k i k j 2 m ,
where k i = j A i j is the degree of node i and m = 1 2 i j A i j represents the total number of edges in the network. This formulation captures the deviation of the observed network from a random configuration that preserves the degree distribution.
A central quantity in this approach is the modularity Q, defined as
Q = 1 2 m s T B s ,
where the vector s encodes the community assignment of nodes (with s i = + 1 or 1 indicating membership in one of two communities). Direct maximization of Q is a challenging combinatorial problem; however, by relaxing the binary constraint on s , one can approximate the optimal partition via the leading eigenvector of B . Specifically, if v is the eigenvector corresponding to the largest positive eigenvalue λ max of B , then the sign of each component v i guides the community assignment:
s i = + 1 , if v i 0 , 1 , if v i < 0 .
This spectral method leverages the fact that the leading eigenvector encapsulates the dominant pattern of connectivity, thus revealing the most significant split within the network.
In the context of gene networks—where nodes denote genes and edges represent either physical interactions or functional associations—this algorithm is particularly valuable. It enables the detection of communities that often correspond to functional modules, pathways, or co-regulated gene sets. Such insights are critical for understanding coordinated biological processes and the molecular basis of diseases, such as Parkinson’s disease. The robust mathematical framework provided by the eigen-decomposition of B ensures that the communities identified are statistically significant, effectively distinguishing meaningful structures from random noise, and ultimately offering a quantitative, scalable approach to dissecting the intricate web of gene interactions.

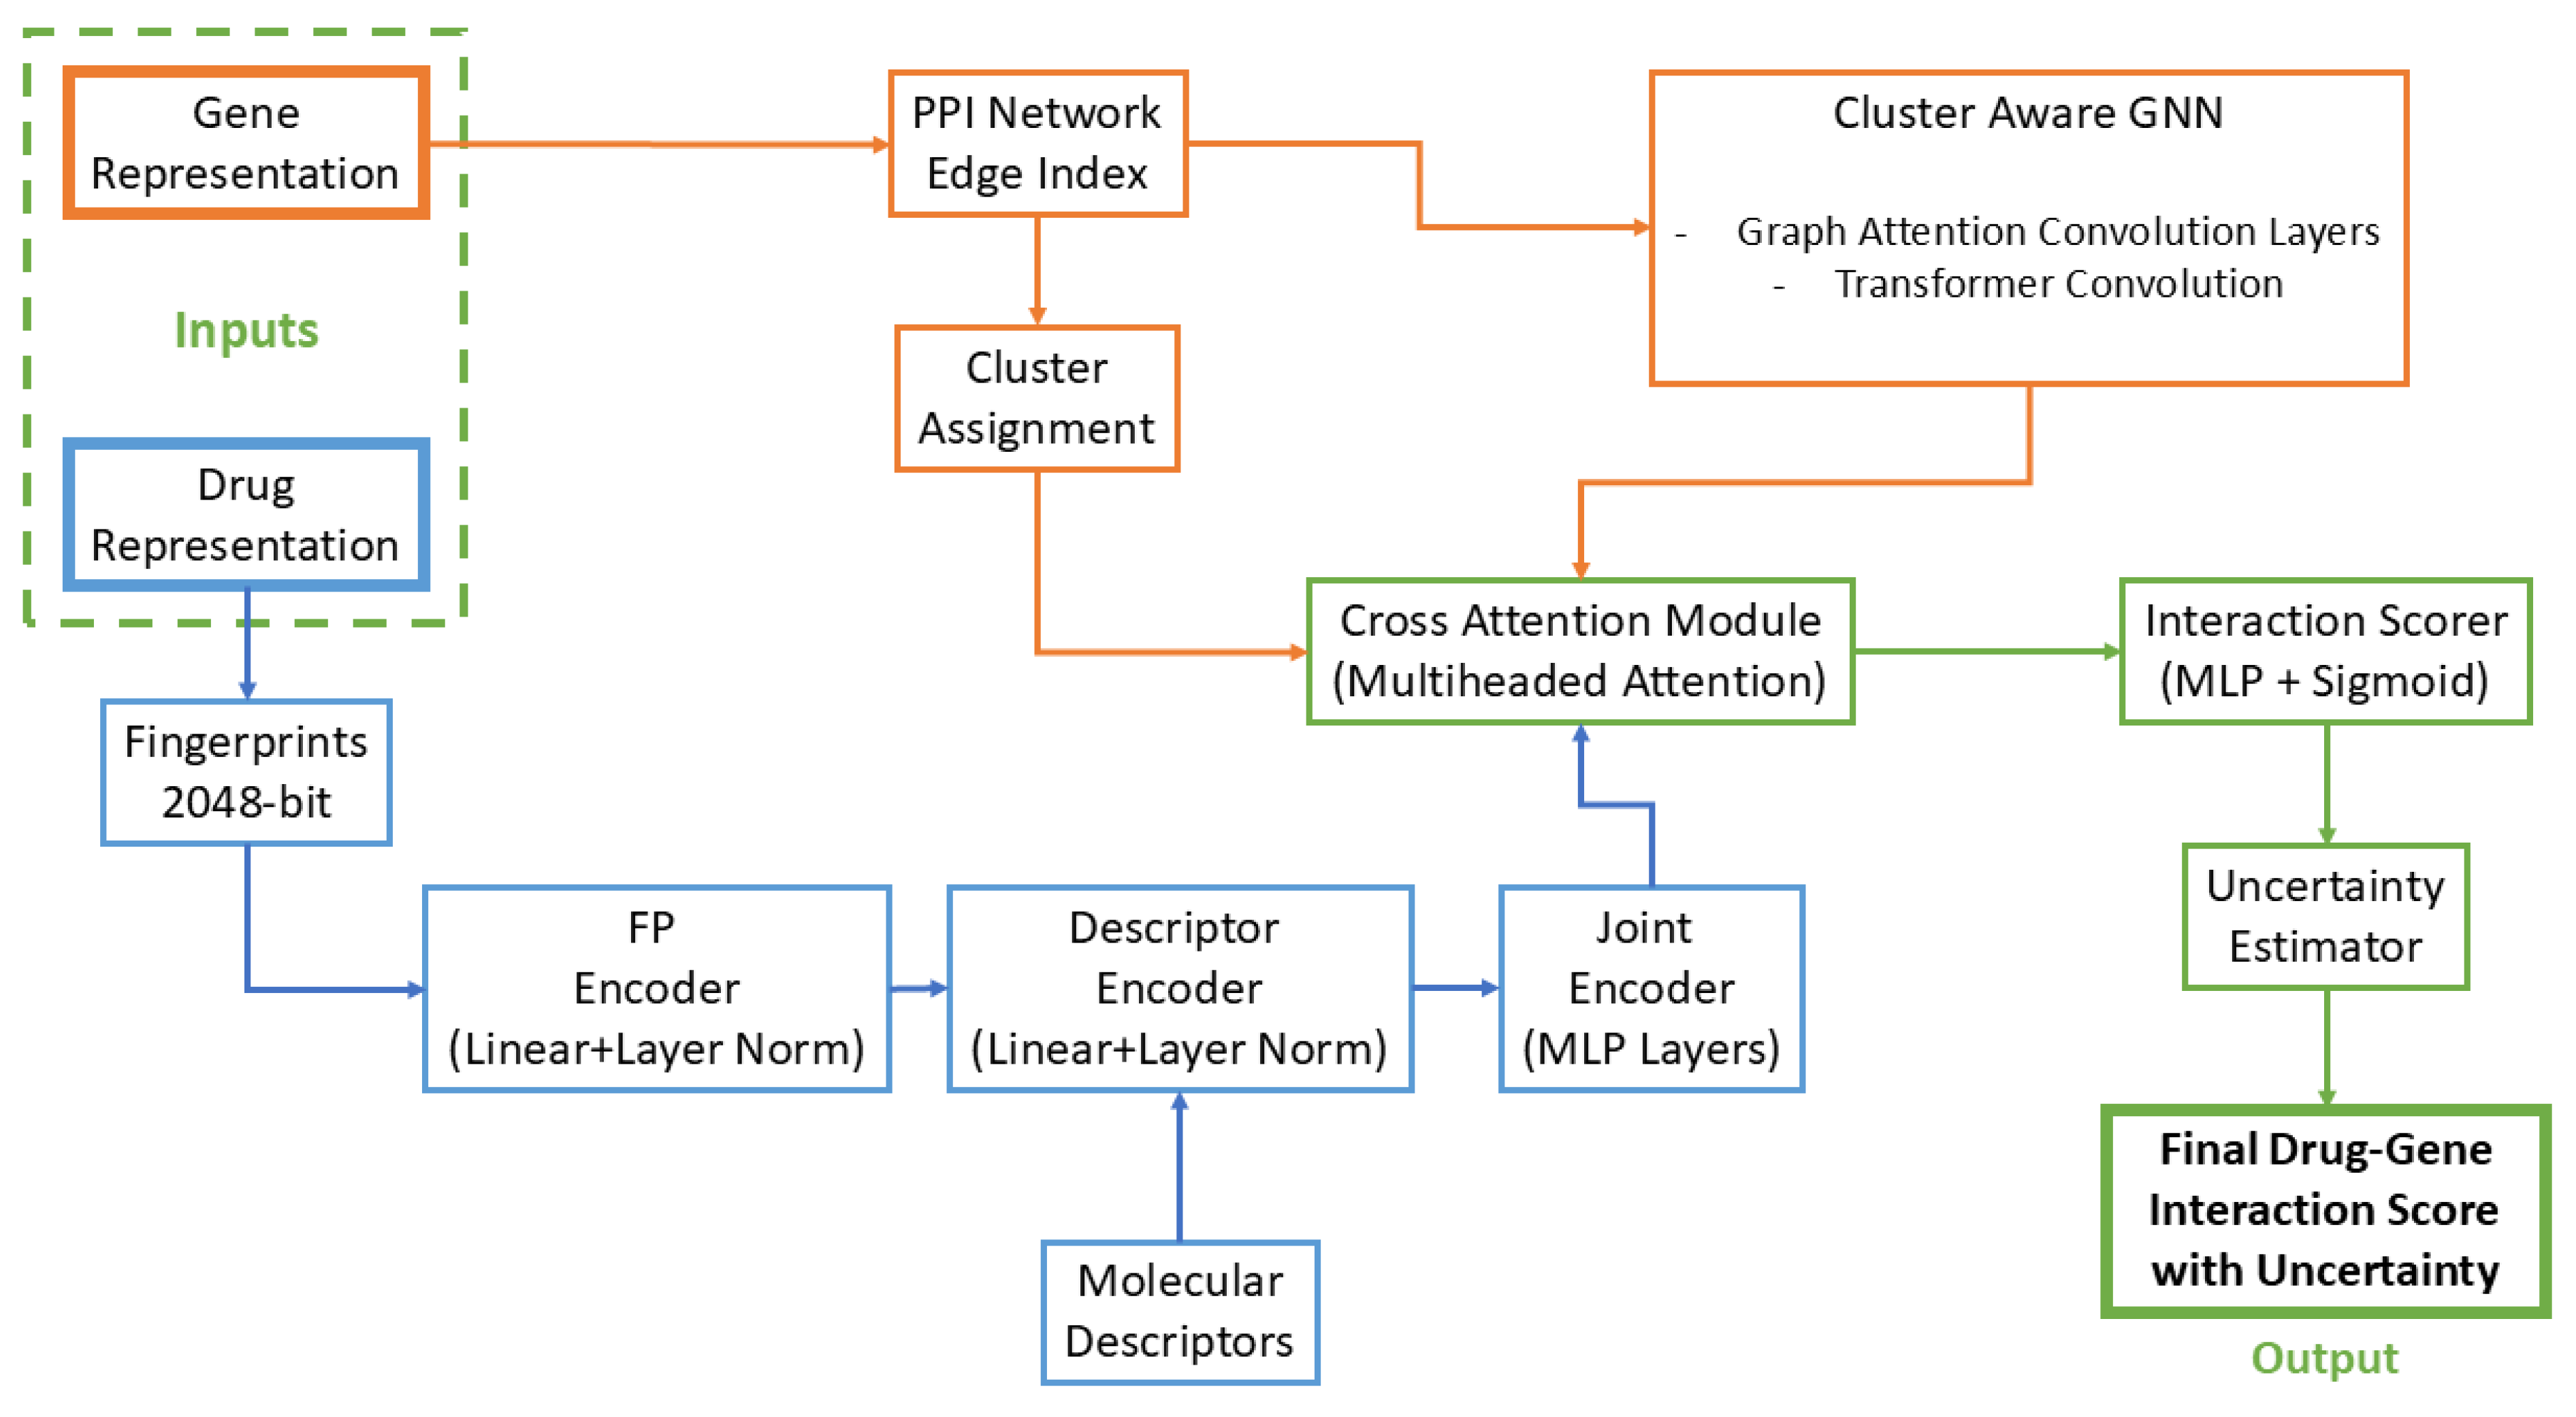
3.2. Multi-Modal Graph Neural Network Architecture

We present a deep learning framework that synergistically integrates heterogeneous biological data modalities through a multi-modal graph neural architecture to identify potential therapeutic candidates for Parkinson’s disease. The framework operates on three fundamental biological entities: small molecule drugs represented through chemical descriptors, PPI networks encoding Parkinsonian gene relationships, and functional cluster assignments derived from pathway analysis. Let D = { d i } i = 1 N denote the drug set and G = ( V , E ) represent the PD-specific PPI network with V = { g j } j = 1 M genes and edge set E V × V .

3.2.1. Molecular Representation Learning

Each drug molecule d i is encoded through dual complementary representations: a binary Morgan fingerprint f ( i ) { 0 , 1 } N f capturing substructure patterns, and a continuous descriptor vector d ( i ) R N d encoding physicochemical properties. The descriptors undergo standardization d ^ ( i ) = ( d ( i ) μ d ) σ d where μ d R N d and σ d R N d are dataset-wise moment vectors, and ⊘ denotes element-wise division. These features are non-linearly projected into a unified molecular embedding space via
h m o l ( i ) = Φ σ ( W f p f ( i ) + b f p ) σ ( W d e s c d ^ ( i ) + b d e s c ) ,
where Φ : R N f + N d R d m is a multi-layer perceptron (MLP) with batch normalization and dropout, σ denotes the LeakyReLU activation, and ‖ represents feature concatenation. An MLP is a feed-forward neural network built from stacked fully connected (dense) layers separated by nonlinear activation functions; in our framework, compact MLP “heads” transform the fused drug–gene embeddings into final interaction probability scores and uncertainty estimates [50]. LeakyReLU is a variant of the standard Rectified Linear Unit activation that, instead of zeroing out negative inputs, applies a small nonzero slope—e.g., f ( x ) = max ( 0.01 x , x ) —so that negative values still produce a gradient, helping to prevent “dead” neurons during training [51].

3.2.2. Cluster-Aware Gene Network Embedding

The PD-specific PPI network G is enriched with functional cluster information derived from pathway enrichment analysis, partitioning V into K clusters { C k } k = 1 K . Each gene g j receives an initial embedding e j R d g from a learnable matrix E g e n e R M × d g , concatenated with its cluster membership vector c j { 0 , 1 } K . The cluster-aware graph neural network processes these embeddings through L graph attention layers followed by a global transformer layer
h j ( l + 1 ) = k = 1 K h σ i N ( j ) α i j ( k ) W ( k ) h i ( l ) l { 1 , , L 1 } ,
where attention weights α i j ( k ) are computed via
α i j ( k ) = softmax j LeakyReLU a ( k ) [ W ( k ) h i ( l ) W ( k ) h j ( l ) ] .
The final transformer layer computes global context-aware embeddings through multi-head attention
z j = Ψ MultiHeadAttention ( W Q h j ( L ) , W K H ( L ) , W V H ( L ) ) c j ,
where H ( L ) R M × d h is the node embedding matrix and Ψ is a projection network.

3.2.3. Uncertainty-Aware Drug-Gene Interaction Modeling

The interaction likelihood between drug d i and gene g j is modeled through a dual cross-attention mechanism
A i , j = ( W Q h m o l ( i ) ) ( W K z j ) d k a i , j = softmax ( A i , j )
yielding attended representations h d g = a i , j W V z j and h g d = a j , i W V h m o l ( i ) . The interaction score s i , j [ 0 , 1 ] and aleatoric uncertainty u i , j R + are computed as
s i , j = Ω ( [ h d g h g d ] ) , u i , j = softplus ( Γ ( [ h d g h g d ] ) ) ,
where Ω and Γ are MLPs with single-dimensional outputs.

3.2.4. Multi-Objective Optimization

The model simultaneously optimizes three objectives
  • Drug-Target Interaction Prediction:
    L D T I = ( i , j ) BCE ( s i , j , y i , j ) u i , j + λ u ( i , j ) log u i , j
  • PD Gene Classification:
    L g e n e = λ g j BCE ( σ ( Θ ( z j ) ) , y j )
  • Molecular Autoencoding:
    L r e c o n = λ r Υ f p ( h m o l ( i ) ) f ( i ) 1 + Υ d e s c ( h m o l ( i ) ) d ^ ( i ) 2 2
    where BCE denotes Binary Cross-Entropy.
The composite loss L t o t a l = L D T I + L g e n e + L r e c o n is minimized through stochastic gradient descent with adaptive uncertainty weighting.

3.2.5. Uncertainty-Quantified Drug Prioritization

For candidate screening, we compute epistemic uncertainty via Monte Carlo dropout
s ¯ i , j = 1 T t = 1 T s i , j ( t ) , σ i , j 2 = 1 T t = 1 T ( s i , j ( t ) s ¯ i , j ) 2 , .
Drugs are ranked by aggregating scores across PD target genes G t a r g e t
Rank ( d i ) = 1 | G t a r g e t | g j G t a r g e t s ¯ i , j Interaction Affinity λ r 1 | G t a r g e t | g j G t a r g e t u i , j 2 + σ i , j 2 Total Uncertainty .
This dual-component ranking metric balances interaction likelihood against prediction confidence, enabling prioritization of high-affinity candidates with robust evidence. The framework’s multi-modal integration of chemical, genomic, and pathway data through deep geometric learning provides a systematic approach for identifying Parkinson’s therapeutics with quantified uncertainty estimates.
The proposed Multi-Modal Graph Neural Network architecture integrates diverse molecular and genetic representations to effectively model the complex interactions between candidate drugs and Parkinson’s disease target genes. This integration addresses a fundamental challenge in computational drug discovery: the synthesis of heterogeneous data types within a unified predictive framework. Figure 10 present the complete framework we present in this study.
In our multi-modal GNN pipeline, each small molecule is first featurized by computing a 2048-bit Morgan fingerprint alongside a panel of 1826 physicochemical descriptors; these two vectors are jointly embedded by the MolecularEncoder into a 512-dimensional drug representation. In parallel, each candidate gene is mapped to a learned embedding and then refined by passing through the ClusterAwareGNN, which propagates information across the PD-specific PPI network while leveraging module (cluster) assignments to bias the message-passing dynamics. The resulting drug and gene embeddings enter a Cross-Attention module, which aligns and fuses their features into a combined vector. Finally, a lightweight MLP head converts this fused embedding into (i) a sigmoid-activated interaction probability and (ii) an uncertainty estimate, thereby producing both a confidence-weighted prediction and an accompanying measure of model certainty.
The Multi-Modal Graph Neural Network was implemented with precise architectural specifications to optimize performance for Parkinson’s disease drug repurposing. The molecular encoder processes 2048-bit Morgan fingerprints (radius = 2) and 200-dimensional molecular descriptors through parallel pathways with hidden dimensions of 512 units. Each encoder employs a two-layer architecture with LeakyReLU activation (negative slope = 0.2) and dropout regularization ( p = 0.2 ), followed by LayerNorm—a normalization method that standardizes the summed inputs to each neuron across its features rather than across the batch, ensuring consistent scaling even when batch sizes vary. Input fingerprints undergo binarization prior to processing, while descriptors are scaled with scikit-learn’s StandardScaler—a preprocessing tool that applies z-score normalization by subtracting each feature’s mean and dividing by its standard deviation to yield zero-mean, unit-variance data—before being fed into the network.
The gene representation module initializes embeddings for all genes using Xavier uniform initialization to mitigate training instability. These embeddings are processed through a dual-layer neural network with LayerNorm and LeakyReLU activations, maintaining consistent 512-dimensional representations. For network integration, we employ a three-layer graph architecture comprising two Graph Attention Convolution GATConv, a graph-neural-network layer that uses attention mechanisms on graph edges, layers (8 attention heads each, with concatenation aggregation) followed by a final TransformerConv, a graph-convolution layer inspired by the Transformer architecture, layer for global context. The PPI network contains 83,426 validated edges after filtering, which are processed as an undirected graph with self-loops removed to prevent feature oversmoothing.
Our cluster-aware projection incorporates 5-dimensional one-hot encoded cluster assignments derived from network modularity analysis. This information is concatenated with node features and transformed through a linear layer ( 517 512 dimensions) with LayerNorm and dropout ( p = 0.2 ). During subgraph processing, we implement edge index batching with proper node relabeling to ensure computational efficiency, achieving processing rates of approximately 5500 drug-gene pairs per second on an NVIDIA ADA 3000 RTX, a high-performance graphics processing unit (GPU) from NVIDIA’s Ada Loveless architecture line.
The cross-attention mechanism implements an 8-head attention structure (head dimension = 64) with scaled dot-product attention (scaling factor = 1 / 8 ) and dropout ( p = 0.1 ) applied to attention weights. Query, key, and value projections maintain consistent dimensions ( 512 512 ) through independent linear transformations. The interaction scorer comprises a three-layer network ( 1024 512 256 1 ) with LeakyReLU activations, LayerNorm, and dropout ( p = 0.2 ), producing unbounded scores that undergo sigmoid activation for final [ 0 , 1 ] bounded outputs.
For uncertainty quantification, we implement a parallel head with identical architecture to the scorer but terminating with a sigmoid activation directly. During inference, we maintain dropout in evaluation mode and perform 10 stochastic forward passes, calculating the predictive mean and variance to derive aleatoric uncertainty estimates. Uncertainty scores are scaled by a factor of 0.5 to constrain the upper bound to 0.5, corresponding to maximum prediction uncertainty.
The model was trained using Adam optimization ( β 1 = 0.9 , β 2 = 0.999 ) with a learning rate of 10 4 and batch size of 64. For regularization, we employ L 2 weight decay ( Λ = 10 5 ) and early stopping (patience = 10 epochs, monitoring the area under the receiver operating characteristic curve (AUROC) on the validation set). The loss function combines binary cross-entropy with uncertainty-weighted regularization ( λ u n c e r t a i n t y = 0.1 ) to penalize overconfident predictions. Self-supervised pretraining was conducted on 9816 DrugBank compounds with a reconstruction loss combining BCE for fingerprints and mean squared error (MSE) for descriptors, with a pretraining weight of λ p r e t r a i n = 0.3 relative to the main task loss.
During drug screening, we segment the database into batches of 64 compounds with GPU memory management to handle the complete DrugBank library of 11,292 compounds. Z-score normalization is applied post-hoc to raw interaction scores, and compounds are filtered by uncertainty threshold ( τ = 0.5 , relaxed to τ = 0.7 if fewer than 10 compounds pass the initial filter). The final ranking incorporates both normalized scores and uncertainty metrics, with empirical percentile calculations based on rank position rather than theoretical normal distribution assumptions.

4. Conclusions

This study presents an integrative computational framework that combines network biology with a multi-modal graph neural network to identify and prioritize multi-target drug candidates for Parkinson’s disease. By harnessing protein–protein interaction networks, advanced clustering methods, and gene set enrichment analyses, our approach elucidates key molecular modules driving PD pathogenesis. The incorporation of polypharmacology through GNN predictions—augmented by uncertainty quantification—has enabled the identification of several promising repurposing candidates that simultaneously target critical nodes across diverse pathways, including lysosomal function, mitochondrial integrity, and neuroinflammation.
The findings reinforce the concept that Parkinson’s disease is a multifactorial network disorder, where effective therapeutic interventions must address interconnected biological processes rather than single targets. Although some predicted compounds, such as vitamin E derivatives and clinically established agents, offer encouraging translational potential, others highlight the need for further medicinal chemistry optimization to overcome safety or pharmacokinetic limitations.
Future work should focus on validating these computational predictions through rigorous in vitro and in vivo assays, refining drug formulations to improve central nervous system delivery, and ultimately advancing the most promising candidates into clinical evaluation. Overall, our study provides a novel, systems-level blueprint for drug repurposing in complex neurodegenerative diseases, offering new avenues for the development of multi-target therapies in Parkinson’s disease.

Author Contributions

Conceptualization, Ö.A., M.A.B. and G.C.; methodology, Ö.A., M.A.B. and G.C.; software, Ö.A. and M.A.B.; validation, Ö.A., M.A.B. and G.C.; formal analysis, Ö.A., M.A.B. and G.C.; investigation, Ö.A., M.A.B. and G.C.; resources, Ö.A., M.A.B. and G.C.; data curation, Ö.A., M.A.B. and G.C.; writing—original draft preparation, Ö.A., M.A.B. and G.C.; writing—review and editing, Ö.A., M.A.B. and G.C.; visualization, Ö.A., M.A.B. and G.C.; supervision, M.A.B.; project administration, G.C.; funding acquisition, G.C. All authors have read and agreed to the published version of the manuscript.

Funding

This research received no external funding.

Institutional Review Board Statement

Not applicable.

Informed Consent Statement

Not applicable.

Data Availability Statement

The original contributions presented in the study are included in the article, further inquiries can be directed to the corresponding author.

Conflicts of Interest

The authors declare no conflicts of interest.

Appendix A

Table A1. Top 10 drugs predicted by Multi-Modal GNN for five genes with highest FCI scores in Cluster 1.
Drug NameDrugBank IDRaw Scprez-ScoreUncertaintyPercentileElite PercentileProbabilityGene
Glycochenodeoxycholic AcidDB021230.83173.6760.2944100.0100.0100.0DGKQ
VilazodoneDB066840.79943.27320.335199.991999.837494.5108DGKQ
Ferrous chlorideDB135690.79893.2680.34399.983799.674894.4401DGKQ
S-Butyryl-CysteinDB021600.79593.23020.300599.975699.512293.926DGKQ
2-{4-[4-(4-Chloro-Phenoxy)-Benzenesulfonyl]
-Tetrahydro-Pyran-4-Yl}-N-Hydroxy-Acetamide
DB020490.78913.14510.319699.967599.349692.7659DGKQ
FlutemetamolDB150580.78083.04150.269199.959399.18791.3541DGKQ
NetarsudilDB139310.77692.99370.236499.951299.024490.7025DGKQ
D-BorneolDB170660.77532.97370.243399.943198.861890.4295DGKQ
TicagrelorDB088160.77232.93590.260199.934998.699289.9147DGKQ
6-Chloro-2-(2-Hydroxy-Biphenyl-3-Yl)
-1h-Indole-5-Carboxamidine
DB038650.77142.92560.298399.926898.536689.774DGKQ
IndobufenDB125450.82073.50230.3538100.0100.0100.0GAK
NetarsudilDB139310.80053.25410.339999.991999.837496.4035GAK
alpha-D-XylopyranoseDB033890.79993.24710.336399.983799.674896.3025GAK
MibefradilDB013880.78913.11360.24999.975699.512294.3682GAK
FluprednisoloneDB093780.78263.03360.311199.967599.349693.2086GAK
CiclesonideDB014100.78013.00360.308899.959399.18792.7734GAK
ImiglitazarDB125110.78013.00270.370199.951299.024492.7611GAK
L-BaclofenDB120980.77472.93640.353299.943198.861891.8GAK
3-(4-nitrophenyl)-1H-pyrazoleDB086950.77362.92330.241299.934998.699291.6099GAK
FlortaucipirDB150330.77232.9080.311499.926898.536691.3885GAK
Cortisone acetateDB013800.81463.29920.3751100.0100.0100.0GBA
Perillyl alcoholDB152890.80673.2020.38699.991999.837498.6197GBA
2-(2-{2-[(BIPHENYL-4-YLMETHYL)-AMINO]
-3-MERCAPTO-PENTANOYLAMINO}-ACETYLAMINO)
-3-METHYL-BUTYRIC ACID METHYL ESTER
DB086430.80153.13660.397699.983799.674897.6906GBA
alpha-N-Acetyl-D-galactosamineDB035670.79763.08910.338999.975699.512297.0158GBA
LandiololDB122120.79363.03870.303899.967599.349696.2997GBA
(1S)-2-[(2S,5R)-2-(AMINOMETHYL)
-5-ETHYNYLPYRROLIDIN-1-YL]-1
-CYCLOPENTYL-2-OXOETHANAMINE
DB073560.79273.02780.309599.959399.18796.1442GBA
N-(2-(((5-CHLORO-2-PYRIDINYL)AMINO)SULFONYL)
PHENYL)-4-(2-OXO-1(2H)-PYRIDINYL)BENZAMIDE
DB078000.79183.01630.340599.951299.024495.9808GBA
LY-294002DB026560.78842.97440.349299.943198.861895.3856GBA
N-{2-[4-(AMINOSULFONYL)PHENYL]ETHYL}ACETAMIDEDB081550.78482.93020.248499.934998.699294.7587GBA
Quinolinic AcidDB017960.78482.93020.311399.926898.536694.7577GBA
(1R,2R,3S,4R,6S)-3,4,6-Trihydroxy-5
-{[(S)-hydroxy(3-hydroxy-2-oxopropoxy)phosphoryl]oxy}
-1,2-cyclohexanediyl bis[dihydrogen (phosphate)]
DB020280.82993.74660.2958100.0100.0100.0TMEM175
CTS-1027DB084900.82963.74340.299599.991999.837499.9583TMEM175
VibegronDB148950.82573.69420.339299.983799.674899.3229TMEM175
RanolazineDB002430.82253.65510.318499.975699.512298.8164TMEM175
3-nitro-L-tyrosineDB038670.80933.49220.346599.967599.349696.7083TMEM175
3-hydroxyglutaric acidDB045940.80373.42260.279399.959399.18795.8081TMEM175
LG-100268DB019410.78913.24140.245699.951299.024493.4636TMEM175
Atecegatran metoxilDB125070.7823.15470.331599.943198.861892.3408TMEM175
(1S)-1-AMINO-2-(1H-INDOL-3-YL)ETHANOLDB086490.77923.11890.324799.934998.699291.8777TMEM175
TopiramateDB002730.7773.09280.284899.926898.536691.5404TMEM175
RamelteonDB009800.84213.77120.3392100.0100.0100.0BCKDK
IndomethacinDB003280.78943.1190.344799.991999.837491.6803BCKDK
(1S,2S,5S)2-(4-GLUTARIDYLBENZYL)
-5-PHENYL-1-CYCLOHEXANOL
DB079090.78933.11780.361699.983799.674891.6656BCKDK
Zinc Substituted Heme CDB042490.78633.0810.353699.975699.512291.1965BCKDK
3-{[(3-FLUORO-3’-METHOXYBIPHENYL-4-YL)AMINO]
CARBONYL}THIOPHENE-2-CARBOXYLIC ACID
DB079760.78313.04120.332499.967599.349690.6886BCKDK
PipequalineDB139910.78063.01070.286599.959399.18790.2999BCKDK
(1S,7S,8S,8AR)-1,2,3,7,8,8A-HEXAHYDRO-7-METHYL
-8-[2-[(2R,4R)-TETRAHYDRO-4-HY DROXY-6-OXO-2H-PYRAN
-2-YL]ETHYL]-1-NAPHTHALENOL
DB082240.77272.9130.36599.951299.024489.0531BCKDK
FluocortoloneDB089710.76982.87680.390899.943198.861888.5921BCKDK
GanaplacideDB161730.76932.87110.319899.934998.699288.5191BCKDK
Anisotropine methylbromideDB005170.76552.82380.369699.926898.536687.9157BCKDK
Table A2. Top 10 drugs predicted by Multi-Modal GNN for five genes with highest FCI scores in Cluster 2.
Drug NameDrugBank IDRaw Scorez-ScoreUncertaintyPercentileElite PercentileProbabilityGene
ClorotepineDB159710.81133.44890.3352100.0100.0100.0MAPT
OxtriphyllineDB013030.79113.20180.230899.991999.837496.3726MAPT
VerdohemeDB048030.7863.14020.306599.983799.674895.468MAPT
DodecyltrimethylammoniumDB027790.77252.97420.275999.975699.512293.0316MAPT
R-95845DB073270.77032.94730.367799.967599.349692.6366MAPT
TP-1287DB181040.76852.92570.27199.959399.18792.3184MAPT
TG100-115DB055520.76692.90610.313999.951299.024492.0308MAPT
BamethanDB132060.76272.85510.325299.943198.861891.2826MAPT
4-{5-[(1Z)-1-(2-IMINO-4-OXO-1,3
-THIAZOLIDIN-5-YLIDENE)ETHYL]
-2-FURYL}BENZENESULFONAMIDE
DB075400.76182.84420.31999.934998.699291.1232MAPT
PhenaglycodolDB193730.76052.82770.313499.926898.536690.8806MAPT
DesmopressinDB000350.79383.37450.3725100.0100.0100.0SNCA
Simenepag isopropylDB129770.78463.26210.297299.991999.837498.3222SNCA
BolasteroneDB014710.77743.17340.370199.983799.674896.9989SNCA
Sodium tetradecyl sulfateDB004640.77353.12640.2499.975699.512296.2981SNCA
Florbenazine F-18DB149450.76873.06740.222999.967599.349695.417SNCA
MALP-2DB184820.7683.0590.285499.959399.18795.292SNCA
MetoprineDB046550.76663.0420.303499.951299.024495.0387SNCA
MedifoxamineDB132190.76453.01620.369199.943198.861894.6535SNCA
NimesulideDB047430.76312.99930.332299.934998.699294.4003SNCA
Chlorotoxin I-131DB054620.76292.9970.378399.926898.536694.3666SNCA
(R)-methylmalonyl-CoADB040450.7892.93230.3501100.0100.0100.0RIT2
GestrinoneDB116190.78842.92540.316199.991999.837499.8871RIT2
2-(2,4-DICHLOROPHENOXY)
-5-(PYRIDIN-2-YLMETHYL)PHENOL
DB072870.78072.82890.310199.983799.674898.3112RIT2
TetrazepamDB133240.77842.79950.286299.975699.512297.8325RIT2
Tetragalacturonic acid hydroxymethylesterDB136210.77652.77560.244299.967599.349697.4415RIT2
Nojirimycine TetrazoleDB024710.77612.7710.320299.959399.18797.3674RIT2
DeudextromethorphanDB190540.77372.74080.365599.951299.024496.8746RIT2
Deoxyamidinoproclavaminic acidDB024750.77192.71740.268699.943198.861896.492RIT2
LevobetaxololDB093510.77152.71270.300699.934998.699296.4154RIT2
Prasterone enantateDB166250.77122.70920.326599.926898.536696.3585RIT2
2c-Methyl-D-Erythritol 2,4
-Cyclodiphosphate
DB039610.81263.37580.3139100.0100.0100.0PRKN
Sanfetrinem cilexetilDB191350.81053.34970.321999.991999.837499.6261PRKN
AcetarsolDB132680.8083.31860.230999.983799.674899.1797PRKN
N-(4-{[(3S)-3-(dimethylamino)pyrrolidin-1-yl]
carbonyl}phenyl)-5-fluoro-4-[2-methyl-1
-(1-methylethyl)-1H-imidazol-5-yl]pyrimidin
-2-amine
DB079360.79213.12230.336299.975699.512296.3617PRKN
(1R,4S,7AS)-1-(1-FORMYLPROP-1-EN-1-YL)
-4-METHOXY-2,4,5,6,7,7A-HEXAHYDRO
-1H-ISOINDOLE-3-CARBOXYLIC ACID
DB081100.78453.02850.273799.967599.349695.0164PRKN
HalothaneDB011590.78443.02650.278499.959399.18794.987PRKN
PhendimetrazineDB015790.78413.02270.30199.951299.024494.9334PRKN
Uridine diphosphate glucoseDB018610.78383.01920.370699.943198.861894.8823PRKN
IcaritinDB126720.77942.96430.394499.934998.699294.0949PRKN
IndralinDB182200.77742.93950.35499.926898.536693.7393PRKN
Genz-10850DB042890.8023.1940.3738100.0100.0100.0STX1B
BrasofensineDB048570.79813.14680.311599.991999.837499.2901STX1B
5-(3-{3-[3-HYDROXY-2-(METHOXYCARBONYL)
PHENOXY]PROPENYL}PHENYL)
-4-(HYDROXYMETHYL)ISOXAZOLE
-3-CARBOXYLIC ACID
DB080010.78843.02660.304999.983799.674897.4823STX1B
TavapadonDB148990.78172.94420.288999.975699.512296.2434STX1B
3-[(9H-fluoren-9-ylideneamino)oxy]propanoic acidDB072400.782.92260.298599.967599.349695.9172STX1B
PirepematDB191650.77992.92120.323599.959399.18795.8969STX1B
EpibatidineDB077200.77852.90490.3799.951299.024495.651STX1B
ClonazepamDB010680.77662.88140.240899.943198.861895.2977STX1B
OsalmidDB162730.7732.83670.321399.934998.699294.626STX1B
4,5-Dimethyl-1,2-phenylenediamineDB031800.77252.83040.305499.926898.536694.5305STX1B
Table A3. Top 10 drugs predicted by Multi-Modal GNN for five genes with highest FCI scores in Cluster 3.
Drug NameDrugBank IDRaw Scorez-ScoreUncertaintyPercentileElite PercentileProbabilityGene
HenatinibDB130190.81873.15050.3136100.0100.0100.0LRRK2
BetameprodineDB015520.81833.1460.360199.991999.837499.9323LRRK2
VatalanibDB048790.80873.02780.349699.983799.674898.158LRRK2
HistapyrrodineDB134790.80452.97530.298199.975699.512297.3698LRRK2
P-Anisic AcidDB027950.79542.86260.359199.967599.349695.6782LRRK2
Limonene, (+/-)-DB191460.79352.83930.272399.959399.18795.3283LRRK2
CemdomespibDB189530.7932.83320.295599.951299.024495.2376LRRK2
(3S)-1-CYCLOHEXYL-5-OXO
-N-PHENYLPYRROLIDINE
-3-CARBOXAMIDE
DB071550.79152.8150.288199.943198.861894.9635LRRK2
CarbapenemDB189120.78952.78940.366899.934998.699294.5795LRRK2
MonoisopropylphosphorylserineDB018050.78832.77480.289599.926898.536694.3604LRRK2
TNP-2092DB163120.82573.52580.3485100.0100.0100.0APOE
TropatepineDB132520.80483.2670.341399.991999.837496.4046APOE
PenfluridolDB137910.79253.11440.349799.983799.674894.2841APOE
2-PHENYLAMINO-4-METHYL
-5-ACETYL THIAZOLE
DB083590.78563.02880.274199.975699.512293.0947APOE
GW-590735DB072150.78473.01710.310399.967599.349692.9328APOE
SpiradolineDB127040.77842.93860.326899.959399.18791.8418APOE
Ginsenoside Rg3DB192570.77452.8910.33999.951299.024491.1806APOE
2-[(2’,3’,4’-TRIFLUOROBIPHENYL
-2-YL)OXY]ETHANOL
DB086110.77392.88360.316199.943198.861891.0774APOE
6-(4-chloro-2-fluoro-3-phenoxybenzyl)
pyridazin-3(2H)-one
DB083790.77322.87460.289599.934998.699290.9535APOE
PalovaroteneDB054670.76742.80210.327199.926898.536689.9458APOE
ChloroxylenolDB111210.79243.30410.3651100.0100.0100.0FYN
(6-METHYL-3,4-DIHYDRO-2H
-CHROMEN-2-YL)METHYLPHOSPHINATE
DB074870.78393.20090.3599.991999.837498.5094FYN
SoblidotinDB126770.78253.18370.322999.983799.674898.2605FYN
IOWH-032DB129590.78023.15580.366299.975699.512297.8585FYN
FelodipineDB010230.77833.13260.296499.967599.349697.5222FYN
TranscrocetinateDB059740.7753.09240.319999.959399.18796.9417FYN
ZolazepamDB115550.77053.03750.385699.951299.024496.1488FYN
(2S,3S)-3-AMINO-4-[(3S)-3-FLUOROPYRROLIDIN
-1-YL]-N,N-DIMETHYL-4-OXO
-2-(TRANS-4-[1,2,4]TRIAZOLO[1,5-A]
PYRIDIN-5-YLCYCLOHEXYL)BUTANAMIDE
DB071350.7693.01940.36699.943198.861895.8886FYN
Zuretinol acetateDB121120.76883.01680.311599.934998.699295.851FYN
5-(4-CHLORO-5-PHENYL-3-THIENYL)
-1,2,5-THIADIAZOLIDIN-3-ONE 1,1-DIOXIDE
DB071340.76552.9760.337799.926898.536695.2617FYN
Sodium stibogluconateDB056300.78113.19950.3156100.0100.0100.0GPNMB
2-[5-Methanesulfonylamino-2-(4-Aminophenyl)
-6-Oxo-1,6-Dihydro-1-Pyrimidinyl]
-N-(3,3,3-Trifluoro-1-Isopropyl
-2-Oxopropyl)Acetamide
DB032020.77833.16390.299899.991999.837499.4792GPNMB
IlginatinibDB127840.77313.09890.340499.983799.674898.5272GPNMB
2-{[4-(TRIFLUOROMETHOXY)BENZOYL]
AMINO}ETHYL DIHYDROGEN PHOSPHATE
DB077450.77163.08010.194699.975699.512298.252GPNMB
BrotizolamDB090170.76623.01330.333799.967599.349697.2749GPNMB
GunagratinibDB181910.76593.00970.344599.959399.18797.2221GPNMB
D-tartaric acidDB016940.76593.00920.298199.951299.024497.215GPNMB
Citraconic acidDB047340.76533.00170.313799.943198.861897.1049GPNMB
VB-309DB185390.7652.99780.368399.934998.699297.0487GPNMB
VP-14637DB121950.75632.88910.306699.926898.536695.4582GPNMB
Hydrolyzed CephalothinDB022470.81973.31240.3474100.0100.0100.0BST1
OxytetracyclineDB005950.80043.07620.37999.991999.837496.7303BST1
DyclonineDB006450.79993.07010.314899.983799.674896.6471BST1
N-(5-chloro-1,3-benzodioxol-4-yl)
-6-methoxy-7-(3-piperidin-1-ylpropoxy)
quinazolin-4-amine
DB072490.79913.06040.324199.975699.512296.5123BST1
(METHYLPYRIDAZINE PIPERIDINE
PROPYLOXYPHENYL)ETHYLACETATE
DB080130.79833.05050.306699.967599.349696.3748BST1
GhavamiolDB024920.79733.03840.271299.959399.18796.2078BST1
CryptoxanthinDB159140.79252.9790.297299.951299.024495.3855BST1
Emetonium iodideDB137690.79162.96920.297199.943198.861895.2496BST1
IsocyanomethaneDB043370.78752.91870.306199.934998.699294.5519BST1
5-(PARA-NITROPHENYL PHOSPHONATE)
-PENTANOIC ACID
DB082960.78642.90550.323599.926898.536694.3682BST1
Table A4. Top 10 drugs predicted by Multi-Modal GNN for five genes with highest FCI scores in Cluster 4.
Drug NameDrugBank IDRaw ScoreZ-ScoreUncertaintyPercentileElite PercentileProbabilityGene
LatamoxefDB045700.82723.62160.3132100.0100.0100.0NUCKS1
N-[4-(2-CHLOROPHENYL)-1,3-DIOXO
-1,2,3,6-TETRAHYDROPYRROLO
[3,4-C]CARBAZOL-9-YL]FORMAMIDE
DB072260.80993.41120.247399.991999.837497.0681NUCKS1
Acetic Acid Salicyloyl-Amino-EsterDB036670.79993.28870.341399.983799.674895.3599NUCKS1
DCFBC F-18DB147720.79743.25790.370899.975699.512294.9308NUCKS1
Etoposide toniribateDB172550.78583.11710.237699.967599.349692.9677NUCKS1
BatefenterolDB125260.78373.09120.402899.959399.18792.6068NUCKS1
EnalaprilatDB094770.78273.07860.331399.951299.024492.4319NUCKS1
Acetylcysteine zincDB144790.7793.0340.280199.943198.861891.8091NUCKS1
7-thionicotinamide-adenine
-dinucleotide phosphate
DB017630.7762.99680.318899.934998.699291.2906NUCKS1
4-(2,4-Dimethyl-1,3-thiazol-5-yl)
-N-[4-(trifluoromethyl)phenyl]
-2-pyrimidinamine
DB029150.7742.97260.288699.926898.536690.954NUCKS1
RuzinuradDB192090.82453.52580.28100.0100.0100.0DYRK1A
LY-2300559DB130160.8213.48320.302399.991999.837499.3795DYRK1A
NerandomilastDB182370.81043.35210.256599.983799.674897.4689DYRK1A
DodecyltrimethylammoniumDB027790.80833.32690.283499.975699.512297.102DYRK1A
3-(6-HYDROXY-NAPHTHALEN
-2-YL)-BENZO[D]ISOOXAZOL-6-OL
DB072360.79543.16810.316799.967599.349694.7897DYRK1A
2’-DeoxyuridineDB022560.79533.16750.345299.959399.18794.7809DYRK1A
Alpha-D-Galactose-1-PhosphateDB023170.79473.16010.281599.951299.024494.6729DYRK1A
Zk-806450DB021120.78543.04550.347399.943198.861893.0045DYRK1A
MiboleroneDB114290.78333.02040.326199.934998.699292.6387DYRK1A
(5R)-N,N-DIETHYL-5-METHYL
-2-[(THIOPHEN-2-YLCARBONYL)AMINO]
-4,5,6,7-TETRAHYDRO-1-BENZOTHIOPHENE
-3-CARBOXAMIDE
DB080330.7792.96740.234799.926898.536691.8665DYRK1A
AZD-9977DB154180.80033.33930.3033100.0100.0100.0PIK3CA
RupintrivirDB051020.79163.23110.332999.991999.837498.4824PIK3CA
AlgestoneDB180000.78523.15110.273499.983799.674897.3593PIK3CA
(5S)-2-(Cyclooctylamino)-5-methyl
-5-propyl-1,3-thiazol-4(5H)-one
DB078660.77993.08570.267199.975699.512296.4422PIK3CA
N-({(3R,4R)-4-[(benzyloxy)methyl]pyrrolidin
-3-yl}methyl)-N-(2-methylpropyl)
benzenesulfonamide
DB075050.77973.08380.261799.967599.349696.4161PIK3CA
4-[4-(4-Methyl-2-Methylamino-Thiazol
-5-Yl)-Pyrimidin-2-Ylamino]-Phenol
DB044070.77883.07190.316799.959399.18796.2493PIK3CA
N-acetylsulfanilyl chlorideDB123370.77863.06980.293499.951299.024496.2189PIK3CA
FlorantyroneDB089750.77182.98470.343599.943198.861895.0261PIK3CA
NateglinideDB007310.76892.94880.301899.934998.699294.523PIK3CA
Thioctic acid tromethamineDB062530.76832.94240.352599.926898.536694.4332PIK3CA
Ferrous ascorbateDB144900.8143.35290.2848100.0100.0100.0KANSL1
IlepatrilDB066040.8093.29140.280499.991999.837499.0953KANSL1
N-Pyridoxyl-2-Methylalanine-5-PhosphateDB042410.79193.08150.361399.983799.674896.0113KANSL1
DidesmethylrocaglamideDB154960.7913.07010.316699.975699.512295.8439KANSL1
4-Nitrophenyl PhosphateDB042140.79023.05990.296699.967599.349695.6938KANSL1
ApstatinDB040920.7822.960.365699.959399.18794.2249KANSL1
OdevixibatDB162610.78052.94080.385799.951299.024493.9427KANSL1
CRS-3123DB122620.78042.93950.252699.943198.861893.9245KANSL1
2-KETO-6-PHOSPHATE-D
-GLUCONIC ACID, ALPHA
-FURANOSE FORM
DB046630.77932.92670.298399.934998.699293.7364KANSL1
Coproporphyrin I containing CO(III)DB044230.7782.91060.275999.926898.536693.4998KANSL1
1-Hydroxyamine-2-Isobutylmalonic AcidDB023260.80383.36430.2747100.0100.0100.0SETD1A
VinflunineDB116410.79963.31340.218299.991999.837499.2457SETD1A
SobetiromeDB074250.79933.30990.347599.983799.674899.1936SETD1A
Ellagic acidDB088460.78433.12770.273999.975699.512296.4966SETD1A
PaeonolDB168300.77453.00870.239799.967599.349694.7347SETD1A
CladribineDB002420.77332.9940.319299.959399.18794.5164SETD1A
[(2R,3S,4R,5R)-5-(4-acetonyl-3-carbamoyl
-pyridin-1-ium-1-yl)-3,4-dihydroxy
-tetrahydrofuran-2-yl]methyl
[[(2R,3S,4R,5R)-5-(6-aminopurin-9-yl)
-3,4-dihydroxy-tetrahydrofuran-2-yl]
methoxy-hydroxy-phosphoryl] phosphate
DB027320.76882.93990.362199.951299.024493.7162SETD1A
Canrenoic acidDB090150.7662.90630.369999.943198.861893.219SETD1A
ACV tripeptideDB020250.76292.8690.314399.934998.699292.6663SETD1A
alpha-Amyl cinnamaldehydeDB141750.76242.86240.308399.926898.536692.569SETD1A
Table A5. Top 10 drugs predicted by Multi-Modal GNN for five genes with highest FCI scores in Cluster 5.
Drug NameDrugBank IDRaw Scorez-SscoreUncertaintyPercentileElite PercentileProbabilityGene
MMI-175DB023780.80963.49080.2966100.0100.0100.0MCCC1
GedatolisibDB118960.79833.3520.340699.991999.837498.0308MCCC1
(1S)-2-[(2S,5R)-2-(AMINOMETHYL)-5
-ETHYNYLPYRROLIDIN-1-YL]-1
-CYCLOPENTYL-2-OXOETHANAMINE
DB073560.7893.23740.399299.983799.674896.4038MCCC1
N-(3-chlorophenyl)-N-methyl-2-oxo-3
-[(3,4,5-trimethyl-1H-pyrrol-2-yl)methyl]
-2H-indole-5-sulfonamide
DB073690.77533.06830.425899.975699.512294.0031MCCC1
Testosterone decanoateDB160010.77393.05060.28999.967599.349693.7512MCCC1
N-Alpha-(2-Naphthylsulfonyl)-N(3-Amidino
-L-Phenylalaninyl)-4-Acetyl-Piperazine
DB041250.77273.0360.341199.959399.18793.5443MCCC1
NemonoxacinDB066000.7662.9530.340399.951299.024492.3665MCCC1
FludeoxyglucoseDB151070.76552.94650.292899.943198.861892.274MCCC1
GSK-2881078DB168880.76152.89720.293499.934998.699291.5738MCCC1
ValspodarDB118690.75812.85520.305399.926898.536690.9779MCCC1
Zinc cationDB145320.79663.2850.274100.0100.0100.0WWOX
Cyproterone acetateDB048390.78183.10640.330199.991999.837497.3973WWOX
NorethandroloneDB127870.77463.01860.272699.983799.674896.1187WWOX
LuteinDB001370.77393.01080.375999.975699.512296.0039WWOX
Hydrocortisone acetateDB145390.77162.98250.252699.967599.349695.5923WWOX
Cytidine-5’-MonophosphateDB034030.76982.96070.268999.959399.18795.2748WWOX
BrivudineDB033120.76872.94820.296199.951299.024495.092WWOX
THIOPHENE-2,5-DISULFONIC ACID 2
-AMIDE-5-(4-METHYL-BENZYLAMIDE)
DB073630.76742.93240.294699.943198.861894.8617WWOX
2-Methyl-3-(2-Aminothiazolo)PropanalDB030240.76642.92020.272199.934998.699294.6842WWOX
TalinololDB117700.76522.90570.32599.926898.536694.4735WWOX
ActeosideDB129960.77813.24040.3076100.0100.0100.0CCT3
HypophosphiteDB040530.77783.23650.359999.991999.837499.9413CCT3
(2S)-2-[(2,1,3-BENZOTHIADIAZOL-4
-YLSULFONYL)AMINO]-2-PHENYL-N
-PYRIDIN-4-YLACETAMIDE
DB075680.7763.21490.220599.983799.674899.6192CCT3
OsalmidDB162730.77153.15990.329499.975699.512298.7977CCT3
Open Form of 2’-Deoxy-Ribofuranose
-5’-Phosphate
DB040870.773.14060.350299.967599.349698.5106CCT3
UK-390957DB117190.76843.12120.362399.959399.18798.2208CCT3
SRA-737DB168760.76743.10960.331499.951299.024498.047CCT3
Iodo-WillardiineDB028180.76493.0790.320299.943198.861897.5903CCT3
ProtokylolDB068140.76333.05850.336499.934998.699297.284CCT3
XL-888DB129810.76053.02530.311399.926898.536696.7882CCT3
CandoxatrilatDB116230.81173.40840.3816100.0100.0100.0CRLS1
TivantinibDB122000.81093.39790.361599.991999.837499.8439CRLS1
(R)-tacrine(10)-hupyridoneDB046140.80963.38290.290799.983799.674899.6194CRLS1
9(S)-HODEDB073020.79713.2280.299699.975699.512297.3065CRLS1
GSK-2982772DB168750.79343.18260.339299.967599.349696.6298CRLS1
RU82197DB032680.78823.1180.228399.959399.18795.6651CRLS1
SulthiameDB083290.77742.98510.323699.951299.024493.6806CRLS1
NaluzotanDB055620.77462.9510.313199.943198.861893.1709CRLS1
EP-217609DB183930.77412.9440.217199.934998.699293.0661CRLS1
Brefeldin ADB073480.77312.93180.329499.926898.536692.885CRLS1
25-desacetylrifapentineDB152130.79473.310.3141100.0100.0100.0PMVK
DiethylcarbamazineDB007110.79283.28640.303899.991999.837499.6637PMVK
DexepicatechinDB192530.79253.28260.287299.983799.674899.6098PMVK
5-ALPHA-PREGNANE-3-BETA
-OL-HEMISUCCINATE
DB085100.79083.2620.314499.975699.512299.3156PMVK
L-Histidine Beta NaphthylamideDB019380.79063.25940.384499.967599.349699.2781PMVK
(5E)-14-CHLORO-15,17-DIHYDROXY
-4,7,8,9,10,11-HEXAHYDRO-2
-BENZOXACYCLOPENTADECINE
-1,12(3H,13H)-DIONE
DB081530.77923.120.31899.959399.18797.2896PMVK
IndeglitazarDB077240.77733.09650.27199.951299.024496.9553PMVK
Deoxycytidylyl-3’,5’-guanosineDB033260.77083.01710.372299.943198.861895.8224PMVK
FormaldehydeDB038430.76932.99860.198299.934998.699295.5585PMVK
DrostanoloneDB008580.76732.9740.367599.926898.536695.208PMVK

References

  1. Keane, H.; Ryan, B.J.; Jackson, B.; Whitmore, A.; Wade-Martins, R. Protein-protein interaction networks identify targets which rescue the MPP+ cellular model of Parkinson’s disease. Sci. Rep. 2015, 5, 17004. [Google Scholar]
  2. Akki, A.J.; Patil, S.A.; Hungund, S.; Sahana, R.; Patil, M.M.; Kulkarni, R.V.; Reddy, K.R.; Zameer, F.; Raghu, A.V. Advances in Parkinson’s disease research—A computational network pharmacological approach. Int. Immunopharmacol. 2024, 139, 112758. [Google Scholar] [CrossRef] [PubMed]
  3. Costa, H.N.; Esteves, A.R.; Empadinhas, N.; Cardoso, S.M. Parkinson’s disease: A multisystem disorder. Neurosci. Bull. 2023, 39, 113–124. [Google Scholar] [CrossRef] [PubMed]
  4. Tomkins, J.E.; Manzoni, C. Advances in protein-protein interaction network analysis for Parkinson’s disease. Neurobiol. Dis. 2021, 155, 105395. [Google Scholar]
  5. Basu, A.; Ash, P.E.; Wolozin, B.; Emili, A. Protein interaction network biology in neuroscience. Proteomics 2021, 21, 1900311. [Google Scholar]
  6. Santos-Lobato, B.L.; Vidal, A.F.; Ribeiro-dos Santos, Â. Regulatory miRNA–mRNA networks in Parkinson’s disease. Cells 2021, 10, 1410. [Google Scholar] [CrossRef]
  7. Selvam, S.; Ayyavoo, V. Biomarkers in neurodegenerative diseases: A broad overview. Explor. Neuroprotective Ther. 2024, 4, 119–147. [Google Scholar] [CrossRef]
  8. Fiscon, G.; Conte, F.; Farina, L.; Paci, P. Network-based approaches to explore complex biological systems towards network medicine. Genes 2018, 9, 437. [Google Scholar] [CrossRef]
  9. Kim, Y.; Park, J.H.; Cho, Y.R. Network-based approaches for disease-gene association prediction using protein-protein interaction networks. Int. J. Mol. Sci. 2022, 23, 7411. [Google Scholar] [CrossRef]
  10. Guo, Z.H.; Yi, H.C.; You, Z.H. Construction and comprehensive analysis of a molecular association network via lncRNA–miRNA–disease–drug–protein graph. Cells 2019, 8, 866. [Google Scholar] [CrossRef]
  11. Yue, Z.; Arora, I.; Zhang, E.Y.; Laufer, V.; Bridges, S.L.; Chen, J.Y. Repositioning drugs by targeting network modules: A Parkinson’s disease case study. BMC Bioinform. 2017, 18, 17–30. [Google Scholar] [CrossRef] [PubMed]
  12. Salemi, M.; Marchese, G.; Lanza, G.; Cosentino, F.I.; Salluzzo, M.G.; Schillaci, F.A.; Ventola, G.M.; Cordella, A.; Ravo, M.; Ferri, R. Role and Dysregulation of miRNA in Patients with Parkinson’s Disease. Int. J. Mol. Sci. 2022, 24, 712. [Google Scholar] [CrossRef] [PubMed]
  13. Bellucci, A.; Bubacco, L.; Longhena, F.; Parrella, E.; Faustini, G.; Porrini, V.; Bono, F.; Missale, C.; Pizzi, M. Nuclear factor-κB dysregulation and α-synuclein pathology: Critical interplay in the pathogenesis of Parkinson’s disease. Front. Aging Neurosci. 2020, 12, 68. [Google Scholar]
  14. Li, S.; Ding, Q.; Wang, X. “Network target” theory and network pharmacology. In Network Pharmacology; Springer: Berlin/Heidelberg, Germany, 2021; pp. 1–34. [Google Scholar]
  15. Pei, J.; Yin, N.; Ma, X.; Lai, L. Systems biology brings new dimensions for structure-based drug design. J. Am. Chem. Soc. 2014, 136, 11556–11565. [Google Scholar]
  16. Boyd, R.J.; Avramopoulos, D.; Jantzie, L.L.; McCallion, A.S. Neuroinflammation represents a common theme amongst genetic and environmental risk factors for Alzheimer and Parkinson diseases. J. Neuroinflamm. 2022, 19, 223. [Google Scholar]
  17. Toader, C.; Tataru, C.P.; Munteanu, O.; Serban, M.; Covache-Busuioc, R.A.; Ciurea, A.V.; Enyedi, M. Decoding Neurodegeneration: A Review of Molecular Mechanisms and Therapeutic Advances in Alzheimer’s, Parkinson’s, and ALS. Int. J. Mol. Sci. 2024, 25, 12613. [Google Scholar] [CrossRef]
  18. Ashtiani, M.; Salehzadeh-Yazdi, A.; Razaghi-Moghadam, Z.; Hennig, H.; Wolkenhauer, O.; Mirzaie, M.; Jafari, M. A systematic survey of centrality measures for protein-protein interaction networks. BMC Syst. Biol. 2018, 12, 80. [Google Scholar]
  19. Rout, T.; Mohapatra, A.; Kar, M. A systematic review of graph-based explorations of PPI networks: Methods, resources, and best practices. Netw. Model. Anal. Health Inform. Bioinform. 2024, 13, 29. [Google Scholar]
  20. Nayar, G.; Altman, R.B. Heterogeneous network approaches to protein pathway prediction. Comput. Struct. Biotechnol. J. 2024, 23, 2727–2739. [Google Scholar]
  21. Kim, Y.J.; Kim, K.; Lee, H.; Jeon, J.; Lee, J.; Yoon, J. The protein-protein interaction network of hereditary parkinsonism genes is a hierarchical scale-free network. Yonsei Med J. 2022, 63, 724. [Google Scholar]
  22. Parikshak, N.N.; Gandal, M.J.; Geschwind, D.H. Systems biology and gene networks in neurodevelopmental and neurodegenerative disorders. Nat. Rev. Genet. 2015, 16, 441–458. [Google Scholar] [CrossRef] [PubMed]
  23. Nicoletti, V.; Palermo, G.; Del Prete, E.; Mancuso, M.; Ceravolo, R. Understanding the multiple role of mitochondria in Parkinson’s disease and related disorders: Lesson from genetics and protein–interaction network. Front. Cell Dev. Biol. 2021, 9, 636506. [Google Scholar] [CrossRef] [PubMed]
  24. Bele, T. Network-based investigation to identify the common gene-disease linkage between Alzheimer’s disease, Parkinson’s disease, and epilepsy’. Netw. Biol. 2024, 14, 254. [Google Scholar]
  25. Rakshit, H.; Rathi, N.; Roy, D. Construction and analysis of the protein-protein interaction networks based on gene expression profiles of Parkinson’s disease. PLoS ONE 2014, 9, e103047. [Google Scholar] [CrossRef]
  26. Hsieh, K.; Wang, Y.; Chen, L.; Zhao, Z.; Savitz, S.; Jiang, X.; Tang, J.; Kim, Y. Drug repurposing for COVID-19 using graph neural network and harmonizing multiple evidence. Sci. Rep. 2021, 11, 23179. [Google Scholar] [CrossRef]
  27. Paul, S.G.; Saha, A.; Hasan, M.Z.; Noori, S.R.H.; Moustafa, A. A systematic review of graph neural network in healthcare-based applications: Recent advances, trends, and future directions. IEEE Access 2024, 12, 15145–15170. [Google Scholar] [CrossRef]
  28. Tang, X.; Dai, H.; Knight, E.; Wu, F.; Li, Y.; Li, T.; Gerstein, M. A survey of generative AI for de novo drug design: New frontiers in molecule and protein generation. Briefings Bioinform. 2024, 25, bbae338. [Google Scholar] [CrossRef]
  29. Du, H.; Yao, Q.; Zhang, J.; Liu, Y.; Wang, Z. Customized subgraph selection and encoding for drug-drug interaction prediction. Adv. Neural Inf. Process. Syst. 2024, 37, 109582–109608. [Google Scholar]
  30. Wu, Z.; Pan, S.; Chen, F.; Long, G.; Zhang, C.; Yu, P.S. A comprehensive survey on graph neural networks. IEEE Trans. Neural Netw. Learn. Syst. 2020, 32, 4–24. [Google Scholar] [CrossRef]
  31. Zhou, J.; Cui, G.; Hu, S.; Zhang, Z.; Yang, C.; Liu, Z.; Wang, L.; Li, C.; Sun, M. Graph neural networks: A review of methods and applications. AI Open 2020, 1, 57–81. [Google Scholar] [CrossRef]
  32. Zhou, Y.; Hou, Y.; Shen, J.; Huang, Y.; Martin, W.; Cheng, F. Network-based drug repurposing for novel coronavirus 2019-nCoV/SARS-CoV-2. Cell Discov. 2020, 6, 14. [Google Scholar] [CrossRef] [PubMed]
  33. Paranjpe, M.D.; Taubes, A.; Sirota, M. Insights into computational drug repurposing for neurodegenerative disease. Trends Pharmacol. Sci. 2019, 40, 565–576. [Google Scholar] [PubMed]
  34. Vicidomini, C.; Fontanella, F.; D’Alessandro, T.; Roviello, G.N. A Survey on Computational Methods in Drug Discovery for Neurodegenerative Diseases. Biomolecules 2024, 14, 1330. [Google Scholar] [CrossRef] [PubMed]
  35. Aldewachi, H.; Al-Zidan, R.N.; Conner, M.T.; Salman, M.M. High-throughput screening platforms in the discovery of novel drugs for neurodegenerative diseases. Bioengineering 2021, 8, 30. [Google Scholar] [CrossRef]
  36. Zeng, X.; Song, X.; Ma, T.; Pan, X.; Zhou, Y.; Hou, Y.; Zhang, Z.; Li, K.; Karypis, G.; Cheng, F. Repurpose open data to discover therapeutics for COVID-19 using deep learning. J. Proteome Res. 2020, 19, 4624–4636. [Google Scholar] [CrossRef]
  37. Li, W.; Ma, W.; Yang, M.; Tang, X. Drug repurposing based on the DTD-GNN graph neural network: Revealing the relationships among drugs, targets and diseases. BMC Genom. 2024, 25, 584. [Google Scholar] [CrossRef]
  38. Yella, J.K.; Ghandikota, S.K.; Jegga, A.G. GraMDTA: Multimodal graph neural networks for predicting drug-target associations. In Proceedings of the 2022 IEEE International Conference on Bioinformatics and Biomedicine (BIBM), Las Vegas, NV, USA, 6–8 December 2022; pp. 1957–1965. [Google Scholar]
  39. Chen, D.; Li, Z.; Ni, Y.; Zhang, G.; Wang, D.; Liu, Q.; Wu, S.; Yu, J.; Wang, L. Beyond efficiency: Molecular data pruning for enhanced generalization. Adv. Neural Inf. Process. Syst. 2024, 37, 18036–18061. [Google Scholar]
  40. Lysenko, A.; Sharma, A.; Boroevich, K.A.; Tsunoda, T. An integrative machine learning approach for prediction of toxicity-related drug safety. Life Sci. Alliance 2018, 1, e201800098. [Google Scholar]
  41. Jiang, S.; Qin, S.; Van Lehn, R.C.; Balaprakash, P.; Zavala, V.M. Uncertainty quantification for molecular property predictions with graph neural architecture search. Digit. Discov. 2024, 3, 1534–1553. [Google Scholar] [CrossRef]
  42. Shannon, P.; Markiel, A.; Ozier, O.; Baliga, N.S.; Wang, J.T.; Ramage, D.; Amin, N.; Schwikowski, B.; Ideker, T. Cytoscape: A software environment for integrated models of biomolecular interaction networks. Genome Res. 2003, 13, 2498–2504. [Google Scholar] [CrossRef]
  43. Utriainen, M.; Morris, J.H. clusterMaker2: A major update to clusterMaker, a multi-algorithm clustering app for Cytoscape. BMC Bioinform. 2023, 24, 134. [Google Scholar]
  44. Maere, S.; Heymans, K.; Kuiper, M. BiNGO: A Cytoscape plugin to assess overrepresentation of gene ontology categories in biological networks. Bioinformatics 2005, 21, 3448–3449. [Google Scholar] [PubMed]
  45. Knox, C.; Wilson, M.; Klinger, C.M.; Franklin, M.; Oler, E.; Wilson, A.; Pon, A.; Cox, J.; Chin, N.E.; Strawbridge, S.A.; et al. DrugBank 6.0: The DrugBank knowledgebase for 2024. Nucleic Acids Res. 2024, 52, D1265–D1275. [Google Scholar] [PubMed]
  46. Group, P.S. Effects of tocopherol and deprenyl on the progression of disability in early Parkinson’s disease. N. Engl. J. Med. 1993, 328, 176–183. [Google Scholar]
  47. Group, P.S. Impact of deprenyl and tocopherol treatment on Parkinson’s disease in DATATOP patients requiring levodopa. Ann. Neurol. 1996, 39, 37–45. [Google Scholar]
  48. Singh, S.; Seth, P.K. Functional association between NUCKS1 gene and Parkinson disease: A potential susceptibility biomarker. Bioinformation 2019, 15, 548. [Google Scholar]
  49. Wainberg, M.; Andrews, S.J.; Tripathy, S.J. Shared genetic risk loci between Alzheimer’s disease and related dementias, Parkinson’s disease, and amyotrophic lateral sclerosis. Alzheimer’s Res. Ther. 2023, 15, 113. [Google Scholar]
  50. Popescu, M.C.; Balas, V.E.; Perescu-Popescu, L.; Mastorakis, N. Multilayer perceptron and neural networks. WSEAS Trans. Circuits Syst. 2009, 8, 579–588. [Google Scholar]
  51. Xu, J.; Li, Z.; Du, B.; Zhang, M.; Liu, J. Reluplex made more practical: Leaky ReLU. In Proceedings of the 2020 IEEE Symposium on Computers and Communications (ISCC), Rennes, France, 7–10 July 2020; pp. 1–7. [Google Scholar]
Figure 1. A Clustered network for Parkinson’s Disease related genes. The light edges represent intercluster connections, while the bold edges represent intracluster connections.
Ijms 26 04453 g001
Figure 2. Topological and functional characteristics of Cluster 1, including degree distribution, centrality metrics, and neighborhood connectivity, alongside cellular compartments and tissue-specific evidence scores. Key genes ranked by FCI and Betweenness Centrality are presented.
Ijms 26 04453 g002
Figure 3. Topological and functional characteristics of Cluster 2, including degree distribution, centrality metrics, and neighborhood connectivity, alongside cellular compartments and tissue-specific evidence scores. Key genes ranked by FCI and Betweenness Centrality are presented.
Ijms 26 04453 g003
Figure 4. Topological and functional characteristics of Cluster 3, including degree distribution, centrality metrics, and neighborhood connectivity, alongside cellular compartments and tissue-specific evidence scores. Key genes ranked by FCI and Betweenness Centrality are presented.
Ijms 26 04453 g004
Figure 5. Topological and functional characteristics of Cluster 4, including degree distribution, centrality metrics, and neighborhood connectivity, alongside cellular compartments and tissue-specific evidence scores. Key genes ranked by FCI and Betweenness Centrality are presented.
Ijms 26 04453 g005
Figure 6. Topological and functional characteristics of Cluster 5, including degree distribution, centrality metrics, and neighborhood connectivity, alongside cellular compartments and tissue-specific evidence scores. Key genes ranked by FCI and Betweenness Centrality are presented.
Ijms 26 04453 g006
Figure 7. Comparison of FCI versus other network centrality metrics.
Ijms 26 04453 g007
Figure 8. Heatmap visualization of enriched GO terms for biological processes across five network clusters. Yellow indicates higher enrichment (−log10(FDR)).
Ijms 26 04453 g008
Figure 9. Multi-Target drug candidates for Parkinson’s Disease.
Ijms 26 04453 g009
Figure 10. Multi-Modal graph neural network framework.
Ijms 26 04453 g010
Table 1. Top terms of GO enrichment results for Cluster 1.
GO IDGO Termp-ValueFDRCluster
Frequency (%)
Background
Frequency (%)
Enrichment
Factor
50220prostaglandin-E synthase activity 1.65 × 10 5 9.76 × 10 3 0.17%10.0%0.02
8440inositol trisphosphate 3-kinase activity 5.74 × 10 5 9.76 × 10 3 0.17%10.0%0.02
44255cellular lipid metabolic process 2.88 × 10 5 9.76 × 10 3 0.17%10.0%0.02
6629lipid metabolic process 5.30 × 10 5 9.76 × 10 3 0.17%10.0%0.02
51766inositol trisphosphate kinase activity 7.65 × 10 5 0.0104 0.17%10.0%0.02
30384phosphoinositide metabolic process 3.02 × 10 4 0.0236 0.17%10.0%0.02
6633fatty acid biosynthetic process 4.17 × 10 4 0.0236 0.17%10.0%0.02
46457prostanoid biosynthetic process 2.47 × 10 4 0.0236 0.17%10.0%0.02
16044cellular membrane organization 4.07 × 10 4 0.0236 0.17%10.0%0.02
61024membrane organization 4.12 × 10 4 0.0236 0.17%10.0%0.02
1516prostaglandin biosynthetic process 2.47 × 10 4 0.0236 0.17%10.0%0.02
15035protein disulfide oxidoreductase activity 3.25 × 10 4 0.0236 0.17%10.0%0.02
15036disulfide oxidoreductase activity 5.66 × 10 4 0.0264 0.17%10.0%0.02
46578regulation of Ras protein signal transduction 6.11 × 10 4 0.0264 0.17%10.0%0.02
6692prostanoid metabolic process 6.22 × 10 4 0.0264 0.17%10.0%0.02
6693prostaglandin metabolic process 6.22 × 10 4 0.0264 0.17%10.0%0.02
917barrier septum formation 1.69 × 10 3 0.0395 0.17%10.0%0.02
47323[3-methyl-2-oxobutanoate dehydrogenase
(acetyl-transferring)] kinase activity
1.69 × 10 3 0.0395 0.17%10.0%0.02
43163-oxoacyl-[acyl-carrier-protein] reductase activity 1.69 × 10 3 0.0395 0.17%10.0%0.02
191713-hydroxyacyl-[acyl-carrier-protein]
dehydratase activity
1.69 × 10 3 0.0395 0.17%10.0%0.02
Table 2. Top terms of GO enrichment results for Cluster 2.
GO IDGO Termp-ValueFDRCluster
Frequency (%)
Background
Frequency (%)
Enrichment
Factor
48489synaptic vesicle transport 2.08 × 10 5 0.0149 0.17%10.0%0.02
43005neuron projection 3.17 × 10 5 0.0149 0.17%10.0%0.02
17157regulation of exocytosis 5.47 × 10 5 0.0172 0.17%10.0%0.02
44456synapse part 8.25 × 10 5 0.0185 0.17%10.0%0.02
1963synaptic transmission, dopaminergic 9.83 × 10 5 0.0185 0.17%10.0%0.02
60341regulation of cellular localization 1.44 × 10 4 0.0202 0.17%10.0%0.02
4385guanylate kinase activity 1.50 × 10 4 0.0202 0.17%10.0%0.02
5886plasma membrane 3.96 × 10 4 0.0249 0.17%10.0%0.02
80010regulation of oxygen and reactive
oxygen species metabolic process
3.25 × 10 4 0.0249 0.17%10.0%0.02
6836neurotransmitter transport 3.63 × 10 4 0.0249 0.17%10.0%0.02
8021synaptic vesicle 3.76 × 10 4 0.0249 0.17%10.0%0.02
44463cell projection part 2.80 × 10 4 0.0249 0.17%10.0%0.02
19226transmission of nerve impulse 2.45 × 10 4 0.0249 0.17%10.0%0.02
45202synapse 3.39 × 10 4 0.0249 0.17%10.0%0.02
30424axon 2.17 × 10 4 0.0249 0.17%10.0%0.02
23046signaling process 4.91 × 10 4 0.0254 0.17%10.0%0.02
42417dopamine metabolic process 5.13 × 10 4 0.0254 0.17%10.0%0.02
23060signal transmission 4.91 × 10 4 0.0254 0.17%10.0%0.02
46928regulation of neurotransmitter
secretion
5.13 × 10 4 0.0254 0.17%10.0%0.02
6810transport 5.64 × 10 4 0.0266 0.17%10.0%0.02
Table 3. Top terms of GO enrichment results for Cluster 3.
GO IDGO Termp-ValueFDRCluster
Frequency (%)
Background
Frequency (%)
Enrichment
Factor
31077post-embryonic camera-type eye development 1.76 × 10 5 5.45 × 10 3 0.17%10.0%0.02
33153T cell receptor V(D)J recombination 1.76 × 10 5 5.45 × 10 3 0.17%10.0%0.02
2568somatic diversification of T cell receptor genes 1.76 × 10 5 5.45 × 10 3 0.17%10.0%0.02
2681somatic recombination of T cell receptor gene segments 1.76 × 10 5 5.45 × 10 3 0.17%10.0%0.02
30030cell projection organization 3.36 × 10 5 8.34 × 10 3 0.17%10.0%0.02
323lytic vacuole 5.05 × 10 5 8.94 × 10 3 0.17%10.0%0.02
5764lysosome 5.05 × 10 5 8.94 × 10 3 0.17%10.0%0.02
32501multicellular organismal process 7.17 × 10 5 0.0111 0.17%10.0%0.02
48569post-embryonic organ development 1.05 × 10 4 0.0130 0.17%10.0%0.02
5773vacuole 1.01 × 10 4 0.0130 0.17%10.0%0.02
51000positive regulation of nitric-oxide synthase activity 1.31 × 10 4 0.0137 0.17%10.0%0.02
48513organ development 1.32 × 10 4 0.0137 0.17%10.0%0.02
2376immune system process 1.67 × 10 4 0.0138 0.17%10.0%0.02
33151V(D)J recombination 1.60 × 10 4 0.0138 0.17%10.0%0.02
5886plasma membrane 1.58 × 10 4 0.0138 0.17%10.0%0.02
31982vesicle 1.84 × 10 4 0.0143 0.17%10.0%0.02
7275multicellular organismal development 1.98 × 10 4 0.0144 0.17%10.0%0.02
51496positive regulation of stress fiber assembly 2.64 × 10 4 0.0182 0.17%10.0%0.02
32770positive regulation of monooxygenase activity 3.04 × 10 4 0.0192 0.17%10.0%0.02
45471response to ethanol 3.09 × 10 4 0.0192 0.17%10.0%0.02
Table 4. Top terms of GO enrichment results for Cluster 4.
GO IDGO Termp-ValueFDRCluster
Frequency (%)
Background
Frequency (%)
Enrichment
Factor
8139nuclear localization sequence binding 4.75 × 10 5 0.0236 0.12%10.0%0.01
6607NLS-bearing substrate import into nucleus 1.03 × 10 4 0.0255 0.12%10.0%0.01
17048Rho GTPase binding 5.29 × 10 4 0.0352 0.12%10.0%0.01
18024histone-lysine N-methyltransferase activity 5.66 × 10 4 0.0352 0.12%10.0%0.01
16279protein-lysine N-methyltransferase activity 5.66 × 10 4 0.0352 0.12%10.0%0.01
5048signal sequence binding 3.02 × 10 4 0.0352 0.12%10.0%0.01
5654nucleoplasm 5.53 × 10 4 0.0352 0.12%10.0%0.01
16278lysine N-methyltransferase activity 5.66 × 10 4 0.0352 0.12%10.0%0.01
31252cell leading edge 9.05 × 10 4 0.0450 0.12%10.0%0.01
42054histone methyltransferase activity 8.62 × 10 4 0.0450 0.12%10.0%0.01
Table 5. Top terms of GO enrichment results for Cluster 5.
GO IDGO Termp-ValueFDRCluster
Frequency (%)
Background
Frequency (%)
Enrichment
Factor
4631phosphomevalonate kinase activity 5.06 × 10 4 0.0272 0.05%10.0%0.01
5739mitochondrion 1.83 × 10 4 0.0272 0.05%10.0%0.01
6768biotin metabolic process 5.06 × 10 4 0.0272 0.05%10.0%0.01
5737cytoplasm 5.01 × 10 4 0.0272 0.05%10.0%0.01
4485methylcrotonoyl-CoA carboxylase activity 1.01 × 10 3 0.0435 0.05%10.0%0.01
Table 6. Drugs targeting multiple Parkinson’s genes.
DrugDrugBank IDTargetsz-ScorePercentile (%)Probability (%)Uncertainty
DithiazanineDB11516GAK, KANSL13.0199.994.70.1425
CeftolozaneDB09050TMEM175, RIT22.9699.989.10.2589
DL-alpha-TocopherolDB14476BCKDK, MAPT3.15100.093.60.2629
BromisovalDB13370LRRK2, APOE3.37100.098.60.2198
ImidureaDB14075APOE, CRLS12.9799.994.80.2147
Medronic acidDB14078GPNMB, BST12.9799.985.80.2464
ModufolinDB12676NUCKS1, WWOX2.8399.889.60.3004
Disclaimer/Publisher’s Note: The statements, opinions and data contained in all publications are solely those of the individual author(s) and contributor(s) and not of MDPI and/or the editor(s). MDPI and/or the editor(s) disclaim responsibility for any injury to people or property resulting from any ideas, methods, instructions or products referred to in the content.

