


The Association of Resistin with Metabolic Health and Obesity in a Mexican-American Population
 , , ,
, , ,
Abstract
1. Introduction
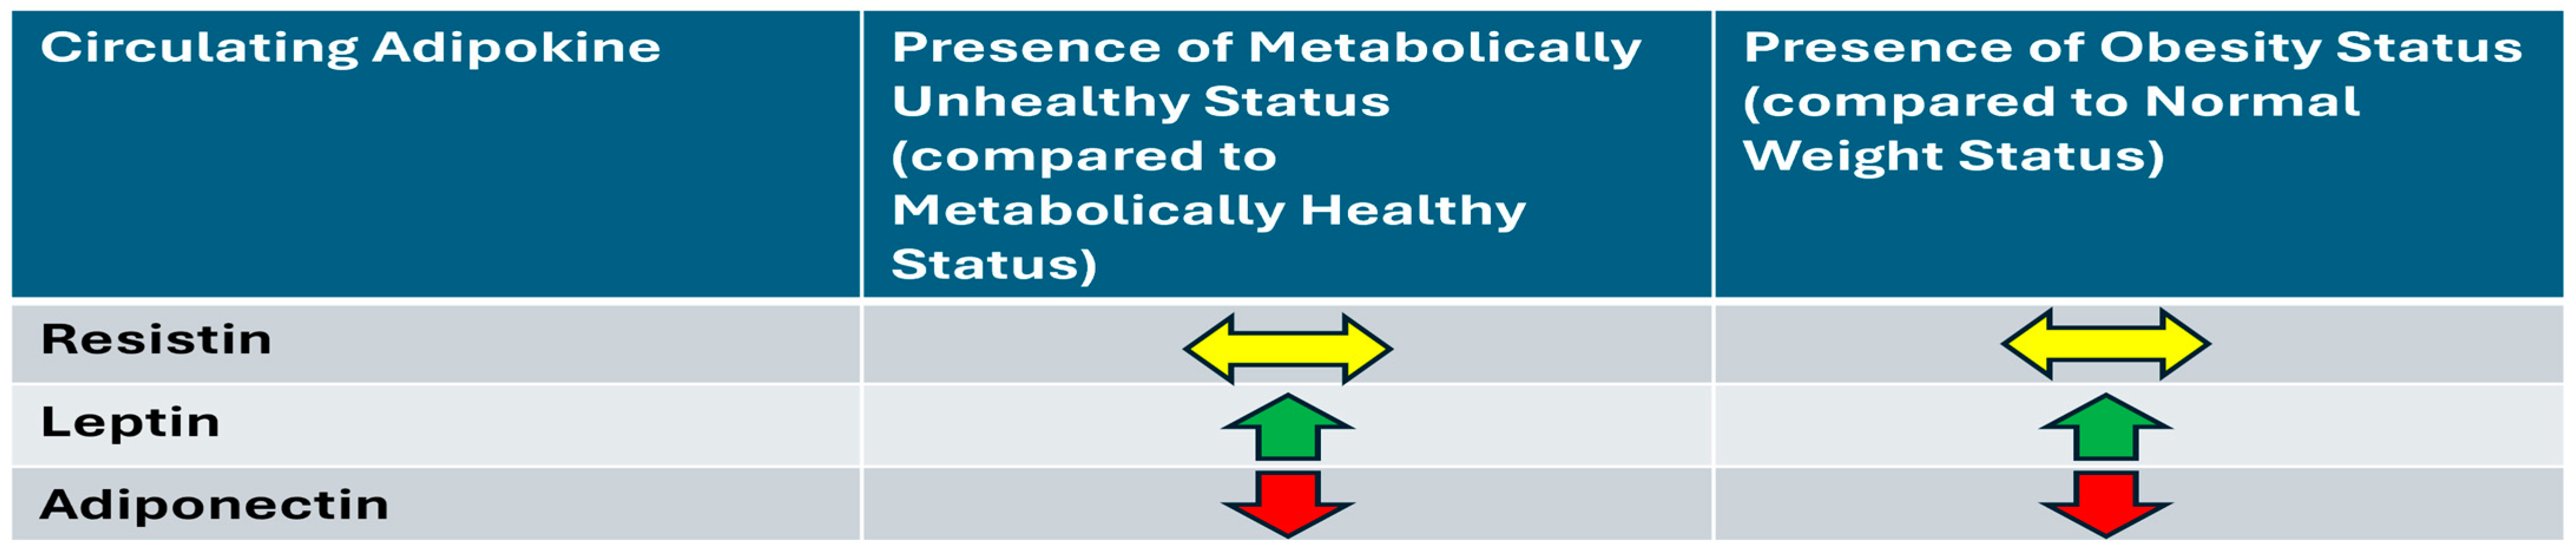
2. Results
2.1. Descriptive Demographic, Anthropometric, and Metabolic Characteristics by Metabolic Health and BMI Category
2.2. Univariable and Multivariable Associations Between Metabolic Health and BMI with Adipokines
3. Discussion
4. Materials and Methods
4.1. Study Participants
4.2. Definitions
4.3. Laboratory Measurements
4.4. Statistical Analysis
5. Conclusions
Supplementary Materials
Author Contributions
Funding
Institutional Review Board Statement
Informed Consent Statement
Data Availability Statement
Acknowledgments
Conflicts of Interest
Abbreviations
| ACEIs | angiotensin-converting enzyme inhibitors |
| ARBs | angiotensin receptor blockers |
| AT | adipose tissue |
| BMI | body mass index |
| CVD | cardiovascular disease |
| HbA1c | glycated hemoglobin |
| HDL-C | high-density lipoprotein cholesterol |
| HOMA-IR | homeostasis model assessment of insulin resistance |
| HOMA B | homeostasis model assessment of beta-cell function |
| IL-1β | interleukin-1 beta |
| IL-6 | interleukin-6 |
| IL-8 | interleukin-8 |
| IS | insulin sensitivity |
| LDL-C | low-density lipoprotein cholesterol |
| MHNW | Metabolically Healthy Normal Weight |
| MHO | Metabolically Healthy Obese |
| MUNHNW | Metabolically Unhealthy Normal Weight |
| MUHO | Metabolically Unhealthy Obese |
| NSAIDs | non-steroidal anti-inflammatory drugs |
| TNF-α | tumor necrosis factor-alpha |
| TZDs | thiazolidinediones |
References
- Steppan, C.M.; Bailey, S.T.; Bhat, S.; Brown, E.J.; Banerjee, R.R.; Wright, C.M.; Patel, H.R.; Ahima, R.S.; Lazar, M.A. The hormone resistin links obesity to diabetes. Nature 2001, 409, 307–312. [Google Scholar] [CrossRef] [PubMed]
- Park, H.K.; Kwak, M.K.; Kim, H.J.; Ahima, R.S. Linking resistin, inflammation, and cardiometabolic diseases. Korean J. Intern. Med. 2017, 32, 239–247. [Google Scholar] [CrossRef] [PubMed]
- Norata, G.D.; Ongari, M.; Garlaschelli, K.; Raselli, S.; Grigore, L.; Catapano, A.L. Plasma resistin levels correlate with determinants of the metabolic syndrome. Eur. J. Endocrinol. 2007, 156, 279–284. [Google Scholar] [CrossRef] [PubMed]
- Osawa, H.; Tabara, Y.; Kawamoto, R.; Ohashi, J.; Ochi, M.; Onuma, H.; Nishida, W.; Yamada, K.; Nakura, J.; Kohara, K.; et al. Plasma resistin, associated with single nucleotide polymorphism −420, is correlated with insulin resistance, lower HDL cholesterol, and high-sensitivity C-reactive protein in the Japanese general population. Diabetes Care 2007, 30, 1501–1506. [Google Scholar] [CrossRef]
- Hivert, M.F.; Manning, A.K.; McAteer, J.B.; Dupuis, J.; Fox, C.S.; Cupples, L.A.; Meigs, J.B.; Florez, J.C. Association of variants in RETN with plasma resistin levels and diabetes-related traits in the Framingham Offspring Study. Diabetes 2009, 58, 750–756. [Google Scholar] [CrossRef]
- Hivert, M.F.; Sullivan, L.M.; Fox, C.S.; Nathan, D.M.; D’Agostino, R.B., Sr.; Wilson, P.W.; Meigs, J.B. Associations of adiponectin, resistin, and tumor necrosis factor-alpha with insulin resistance. J. Clin. Endocrinol. Metab. 2008, 93, 3165–3172. [Google Scholar] [CrossRef]
- Fain, J.N.; Cheema, P.S.; Bahouth, S.W.; Lloyd Hiler, M. Resistin release by human adipose tissue explants in primary culture. Biochem. Biophys. Res. Commun. 2003, 300, 674–678. [Google Scholar] [CrossRef]
- Kaser, S.; Kaser, A.; Sandhofer, A.; Ebenbichler, C.F.; Tilg, H.; Patsch, J.R. Resistin messenger-RNA expression is increased by proinflammatory cytokines in vitro. Biochem. Biophys. Res. Commun. 2003, 309, 286–290. [Google Scholar] [CrossRef]
- Patel, L.; Buckels, A.C.; Kinghorn, I.J.; Murdock, P.R.; Holbrook, J.D.; Plumpton, C.; Macphee, C.H.; Smith, S.A. Resistin is expressed in human macrophages and directly regulated by PPAR gamma activators. Biochem. Biophys. Res. Commun. 2003, 300, 472–476. [Google Scholar] [CrossRef]
- Del Cristo Rodriguez Perez, M.; Gonzalez, D.A.; Rodriguez, I.M.; Coello, S.D.; Fernandez, F.J.C.; Diaz, B.B.; de Leon, A.C. Resistin as a risk factor for all-cause (and cardiovascular) death in the general population. Sci. Rep. 2022, 12, 19627. [Google Scholar] [CrossRef]
- Menzaghi, C.; Marucci, A.; Antonucci, A.; De Bonis, C.; Ortega Moreno, L.; Salvemini, L.; Copetti, M.; Trischitta, V.; Di Paola, R. Suggestive evidence of a multi-cytokine resistin pathway in humans and its role on cardiovascular events in high-risk individuals. Sci. Rep. 2017, 7, 44337. [Google Scholar] [CrossRef]
- Scarale, M.G.; Antonucci, A.; Cardellini, M.; Copetti, M.; Salvemini, L.; Menghini, R.; Mazza, T.; Casagrande, V.; Ferrazza, G.; Lamacchia, O.; et al. A Serum Resistin and Multicytokine Inflammatory Pathway Is Linked With and Helps Predict All-cause Death in Diabetes. J. Clin. Endocrinol. Metab. 2021, 106, e4350–e4359. [Google Scholar] [CrossRef] [PubMed]
- Rallidis, L.S.; Katsimardos, A.; Kosmas, N.; Rallidi, T.; Zapantiotis, D.; Varounis, C.; Kountouri, A. Differential prognostic value of resistin for cardiac death in patients with coronary artery disease according to the presence of metabolic syndrome. Heart Vessels 2022, 37, 713–719. [Google Scholar] [CrossRef]
- Gutierrez, A.D.; Flores, C.A.; Naik, S.; Lee, M.; Asgarisabet, P.; Resman, M.; Lee, M.; McCormick, J.B.; Fisher-Hoch, S.P. Resistin levels decrease as insulin resistance increases in a Mexican-American cohort. Cytokine 2021, 148, 155687. [Google Scholar] [CrossRef] [PubMed]
- Solis-Cano, D.G.; Porchia, L.M.; Gonzalez-Mejia, M.E.; Perez-Fuentes, R.; Ruiz-Vivanco, G.; Nieva-Vazquez, A.; Torres-Rasgado, E. Serum resistin levels inversely associated with cardiovascular risk indices in type 2 diabetics from central Mexico. Diabetes Metab. Syndr. 2017, 11 (Suppl. S2), S1053–S1057. [Google Scholar] [CrossRef]
- Nieva-Vazquez, A.; Perez-Fuentes, R.; Torres-Rasgado, E.; Lopez-Lopez, J.G.; Romero, J.R. Serum resistin levels are associated with adiposity and insulin sensitivity in obese Hispanic subjects. Metab. Syndr. Relat. Disord. 2014, 12, 143–148. [Google Scholar] [CrossRef]
- Degawa-Yamauchi, M.; Bovenkerk, J.E.; Juliar, B.E.; Watson, W.; Kerr, K.; Jones, R.; Zhu, Q.; Considine, R.V. Serum resistin (FIZZ3) protein is increased in obese humans. J. Clin. Endocrinol. Metab. 2003, 88, 5452–5455. [Google Scholar] [CrossRef]
- Azuma, K.; Katsukawa, F.; Oguchi, S.; Murata, M.; Yamazaki, H.; Shimada, A.; Saruta, T. Correlation between serum resistin level and adiposity in obese individuals. Obes. Res. 2003, 11, 997–1001. [Google Scholar] [CrossRef] [PubMed]
- Lee, J.H.; Chan, J.L.; Yiannakouris, N.; Kontogianni, M.; Estrada, E.; Seip, R.; Orlova, C.; Mantzoros, C.S. Circulating resistin levels are not associated with obesity or insulin resistance in humans and are not regulated by fasting or leptin administration: Cross-sectional and interventional studies in normal, insulin-resistant, and diabetic subjects. J. Clin. Endocrinol. Metab. 2003, 88, 4848–4856. [Google Scholar] [CrossRef]
- Heilbronn, L.K.; Rood, J.; Janderova, L.; Albu, J.B.; Kelley, D.E.; Ravussin, E.; Smith, S.R. Relationship between serum resistin concentrations and insulin resistance in nonobese, obese, and obese diabetic subjects. J. Clin. Endocrinol. Metab. 2004, 89, 1844–1848. [Google Scholar] [CrossRef]
- de Luis, D.A.; Gonzalez Sagrado, M.; Conde, R.; Aller, R.; Izaola, O.; Perez Castrillon, J.L.; Duenas, A. Relation of resistin levels with cardiovascular risk factors and insulin resistance in non-diabetes obese patients. Diabetes Res. Clin. Pract. 2009, 84, 174–178. [Google Scholar] [CrossRef]
- Dziegielewska-Gesiak, S.; Wyszomirska, K.; Fatyga, E.; Wysocka, E.; Muc-Wierzgon, M. The role of oxidant-antioxidant markers and resistin in metabolic syndrome elderly individuals. Sci. Prog. 2021, 104, 368504211006510. [Google Scholar] [CrossRef] [PubMed]
- Utzschneider, K.M.; Carr, D.B.; Tong, J.; Wallace, T.M.; Hull, R.L.; Zraika, S.; Xiao, Q.; Mistry, J.S.; Retzlaff, B.M.; Knopp, R.H.; et al. Resistin is not associated with insulin sensitivity or the metabolic syndrome in humans. Diabetologia 2005, 48, 2330–2333. [Google Scholar] [CrossRef]
- Codoner-Franch, P.; Alonso-Iglesias, E. Resistin: Insulin resistance to malignancy. Clin. Chim. Acta 2015, 438, 46–54. [Google Scholar] [CrossRef]
- Chavarria-Avila, E.; Ruiz Quezada, S.L.; Guzman-Ornelas, M.O.; Castro-Albarran, J.; Aguilar Aldrete, M.E.; Vasquez-Del Mercado, M.; Navarro-Hernandez, R.E. Association of resistin gene 3′UTR+62G>A polymorphism with insulin resistance, adiposity and the adiponectin-resistin index in Mexican population. Nutr. Hosp. 2013, 28, 1867–1876. [Google Scholar] [PubMed]
- Derosa, G.; Salvadeo, S.A.; D’Angelo, A.; Fogari, E.; Ragonesi, P.D.; Ciccarelli, L.; Piccinni, M.N.; Ferrari, I.; Gravina, A.; Maffioli, P.; et al. Rosiglitazone therapy improves insulin resistance parameters in overweight and obese diabetic patients intolerant to metformin. Arch. Med. Res. 2008, 39, 412–419. [Google Scholar] [CrossRef]
- Barac, A.; Campia, U.; Matuskey, L.A.; Lu, L.; Panza, J.A. Effects of peroxisome proliferator-activated receptor-gamma activation with pioglitazone on plasma adipokines in nondiabetic patients with either hypercholesterolemia or hypertension. Am. J. Cardiol. 2008, 101, 980–985. [Google Scholar] [CrossRef] [PubMed]
- Majuri, A.; Santaniemi, M.; Rautio, K.; Kunnari, A.; Vartiainen, J.; Ruokonen, A.; Kesaniemi, Y.A.; Tapanainen, J.S.; Ukkola, O.; Morin-Papunen, L. Rosiglitazone treatment increases plasma levels of adiponectin and decreases levels of resistin in overweight women with PCOS: A randomized placebo-controlled study. Eur. J. Endocrinol. 2007, 156, 263–269. [Google Scholar] [CrossRef]
- Black, M.H.; Shu, Y.H.; Wu, J.; Koebnick, C.; MacKay, A.; Watanabe, R.M.; Buchanan, T.A.; Xiang, A.H. Longitudinal Increases in Adiposity Contribute to Worsening Adipokine Profile over Time in Mexican Americans. Obesity 2018, 26, 703–712. [Google Scholar] [CrossRef]
- Xiang, A.H.; Black, M.H.; Shu, Y.H.; Wu, J.; MacKay, A.; Koebnick, C.; Watanabe, R.M.; Buchanan, T.A. Association of weight gain and fifteen adipokines with declining beta-cell function in Mexican Americans. PLoS ONE 2018, 13, e0201568. [Google Scholar] [CrossRef]
- Sigit, F.S.; Trompet, S.; Tahapary, D.L.; Sartono, E.; Willems van Dijk, K.; Yazdanbakhsh, M.; Supali, T.; Smit, J.W.A.; Rosendaal, F.R.; de Mutsert, R. The associations of leptin and adiponectin with the metabolic syndrome in an Indonesian and a Dutch population. Nutr. Metab. Cardiovasc. Dis. 2021, 31, 2426–2435. [Google Scholar] [CrossRef] [PubMed]
- Ter Horst, R.; van den Munckhof, I.C.L.; Schraa, K.; Aguirre-Gamboa, R.; Jaeger, M.; Smeekens, S.P.; Brand, T.; Lemmers, H.; Dijkstra, H.; Galesloot, T.E.; et al. Sex-Specific Regulation of Inflammation and Metabolic Syndrome in Obesity. Arterioscler. Thromb. Vasc. Biol. 2020, 40, 1787–1800. [Google Scholar] [CrossRef]
- Khan, U.I.; Ogorodnikova, A.D.; Xu, L.; Wang, D.; Wassertheil-Smoller, S.; Ho, G.Y.; Sowers, M.F.; Rajpathak, S.N.; Allison, M.A.; Mackey, R.H.; et al. The adipokine profile of metabolically benign obese and at-risk normal weight postmenopausal women: The Women’s Health Initiative Observational Study. Obesity 2014, 22, 786–794. [Google Scholar] [CrossRef]
- Mirza, S.; Hossain, M.; Mathews, C.; Martinez, P.; Pino, P.; Gay, J.L.; Rentfro, A.; McCormick, J.B.; Fisher-Hoch, S.P. Type 2-diabetes is associated with elevated levels of TNF-alpha, IL-6 and adiponectin and low levels of leptin in a population of Mexican Americans: A cross-sectional study. Cytokine 2012, 57, 136–142. [Google Scholar] [CrossRef]
- Tatti, P.; Masselli, L.; Buonanno, A.; Di Mauro, P.; Strollo, F. Leptin levels in diabetic and nondiabetic subjects. Endocrine 2001, 15, 305–308. [Google Scholar] [CrossRef] [PubMed]
- Mohammadzadeh, G.; Zarghami, N. Serum leptin level is reduced in non-obese subjects with type 2 diabetes. Int. J. Endocrinol. Metab. 2013, 11, 3–10. [Google Scholar] [CrossRef]
- Abdelgadir, M.; Elbagir, M.; Eltom, M.; Berne, C.; Ahren, B. Reduced leptin concentrations in subjects with type 2 diabetes mellitus in Sudan. Metabolism 2002, 51, 304–306. [Google Scholar] [CrossRef] [PubMed]
- Brennan, A.M.; Mantzoros, C.S. Drug Insight: The role of leptin in human physiology and pathophysiology—Emerging clinical applications. Nat. Clin. Pract. Endocrinol. Metab. 2006, 2, 318–327. [Google Scholar] [CrossRef]
- Lopez-Quintero, A.; Garcia-Zapien, A.G.; Flores-Martinez, S.E.; Diaz-Burke, Y.; Gonzalez-Sandoval, C.E.; Lopez-Roa, R.I.; Medina-Diaz, E.; Munoz-Almaguer, M.L.; Sanchez-Corona, J. Contribution of polymorphisms in the LEP, LEPR and RETN genes on serum leptin and resistin levels in young adults from Mexico. Cell. Mol. Biol. 2017, 63, 10–18. [Google Scholar] [CrossRef]
- Chavarria-Avila, E.; Vazquez-Del Mercado, M.; Gomez-Banuelos, E.; Ruiz-Quezada, S.L.; Castro-Albarran, J.; Sanchez-Lopez, L.; Martin-Marquez, B.T.; Navarro-Hernandez, R.E. The Impact of LEP G-2548A and LEPR Gln223Arg Polymorphisms on Adiposity, Leptin, and Leptin-Receptor Serum Levels in a Mexican Mestizo Population. Biomed. Res. Int. 2015, 2015, 539408. [Google Scholar] [CrossRef]
- Simental-Mendia, L.E.; Simental-Mendia, M.; Sahebkar, A.; Atkin, S.L.; Jamialahmadi, T. Effect of Fibrate Treatment on Circulating Adipokine Levels: A Systematic Review and Meta-analysis of Randomized Clinical Trials. Arch. Med. Res. 2024, 55, 102957. [Google Scholar] [CrossRef] [PubMed]
- Riera-Guardia, N.; Rothenbacher, D. The effect of thiazolidinediones on adiponectin serum level: A meta-analysis. Diabetes Obes. Metab. 2008, 10, 367–375. [Google Scholar] [CrossRef] [PubMed]
- Gomez, R.; Scotece, M.; Conde, J.; Gomez-Reino, J.J.; Lago, F.; Gualillo, O. Adiponectin and leptin increase IL-8 production in human chondrocytes. Ann. Rheum. Dis. 2011, 70, 2052–2054. [Google Scholar] [CrossRef]
- Qu, H.Q.; Li, Q.; Lu, Y.; Hanis, C.L.; Fisher-Hoch, S.P.; McCormick, J.B. Ancestral effect on HOMA-IR levels quantitated in an American population of Mexican origin. Diabetes Care 2012, 35, 2591–2593. [Google Scholar] [CrossRef]
- Pereira, R.I.; Low Wang, C.C.; Wolfe, P.; Havranek, E.P.; Long, C.S.; Bessesen, D.H. Associations of Adiponectin with Adiposity, Insulin Sensitivity, and Diet in Young, Healthy, Mexican Americans and Non-Latino White Adults. Int. J. Environ. Res. Public. Health 2015, 13, 54. [Google Scholar] [CrossRef] [PubMed]
- Fisher-Hoch, S.P.; Vatcheva, K.P.; Rahbar, M.H.; McCormick, J.B. Undiagnosed Diabetes and Pre-Diabetes in Health Disparities. PLoS ONE 2015, 10, e0133135. [Google Scholar] [CrossRef]
- Laing, S.T.; Smulevitz, B.; Vatcheva, K.P.; Rahbar, M.H.; Reininger, B.; McPherson, D.D.; McCormick, J.B.; Fisher-Hoch, S.P. Subclinical atherosclerosis and obesity phenotypes among Mexican Americans. J. Am. Heart Assoc. 2015, 4, e001540. [Google Scholar] [CrossRef]
- Wildman, R.P.; Muntner, P.; Reynolds, K.; McGinn, A.P.; Rajpathak, S.; Wylie-Rosett, J.; Sowers, M.R. The obese without cardiometabolic risk factor clustering and the normal weight with cardiometabolic risk factor clustering: Prevalence and correlates of 2 phenotypes among the US population (NHANES 1999-2004). Arch. Intern. Med. 2008, 168, 1617–1624. [Google Scholar] [CrossRef]
- Matthews, D.R.; Hosker, J.P.; Rudenski, A.S.; Naylor, B.A.; Treacher, D.F.; Turner, R.C. Homeostasis model assessment: Insulin resistance and beta-cell function from fasting plasma glucose and insulin concentrations in man. Diabetologia 1985, 28, 412–419. [Google Scholar] [CrossRef]
- Tan, M.S.; Chang, S.Y.; Chang, D.M.; Tsai, J.C.; Lee, Y.J. Association of resistin gene 3′-untranslated region +62G→A polymorphism with type 2 diabetes and hypertension in a Chinese population. J. Clin. Endocrinol. Metab. 2003, 88, 1258–1263. [Google Scholar] [CrossRef]
- Gouni-Berthold, I.; Giannakidou, E.; Faust, M.; Kratzsch, J.; Berthold, H.K.; Krone, W. Resistin gene 3′-untranslated region +62G→A polymorphism is associated with hypertension but not diabetes mellitus type 2 in a German population. J. Intern. Med. 2005, 258, 518–526. [Google Scholar] [CrossRef] [PubMed]

| Variable (Continuous) | ALL n = 1511 | Metabolically Healthy Normal Weight (MHNW) n = 362 (23.96%) | Metabolically Healthy Obese (MHO) n = 160 (10.59%) | Metabolically Unhealthy Normal Weight (MUHNW) n = 361 (23.89%) | Metabolically Unhealthy Obese (MUHO) n = 628 (41.56%) | p-Value * |
|---|---|---|---|---|---|---|
| Sex, male n (%) | 635 (42.03) | 161 (44.48) | 55 (34.38) | 163 (45.15) | 256 (40.76) | 0.0860 |
| Age (years), mean (SD) | 44.75 (15.20) | 38.15 (14.87) | 40.21 (13.15) | 48.91 (15.70) | 47.33 (14.04) | <0.0001 |
| BMI (kg/m2), mean (SD) | 31.01 (6.34) | 25.25 (2.82) | 35.11 (5.25) | 26.90 (2.44) | 35.61 (5.21) | <0.0001 |
| WAIST CIRCUMFERENCE (cm), mean (SD) | 102.9 (14.90) | 89.39 (8.71) | 108.9 (11.83) | 95.82 (8.41) | 113.2 (12.82) | <0.0001 |
| HbA1c (%), median (IQR) | 5.45 (4.67, 6.20) | 5.00 (4.19, 5.70) | 5.20 (4.50, 5.80) | 5.60 (4.84, 6.40) | 5.72 (4.81, 6.79) | <0.0001 |
| Fasting Blood Glucose mg/dL, median (IQR) | 98.00 (92.00, 109.0) | 92.50 (88.00, 96.00) | 93.00 (88.00, 98.00) | 102.0 (95.00, 114.0) | 105.0 (97.00, 126.0) | <0.0001 |
| Insulin (pmol/L), median (IQR) | 12.10 (7.70, 18.80) | 8.10 (5.40, 12.20) | 12.00 (7.50, 15.70) | 11.15 (7.70, 16.30) | 16.80 (10.50, 25.80) | <0.0001 |
| HOMA-IR, median (IQR) | 3.10 (1.93, 5.11) | 1.82 (1.19, 2.81) | 2.80 (1.70, 3.76) | 3.01 (1.99, 4.77) | 4.81 (3.00, 7.63) | <0.0001 |
| HOMA B, median (IQR) | 117.8 (73.01, 185.1) | 99.31 (70.00, 157.2) | 138.2 (96.92, 209.3) | 100.4 (62.53, 156.0) | 137.3 (76.68, 224.2) | <0.0001 |
| Resistin (ng/mL) **, median (IQR) | 18.87 (9.96, 28.96) | 17.76 (9.01, 25.18) | 18.97 (8.71, 30.84) | 19.08 (8.40, 30.44) | 19.53 (11.59, 29.85) | 0.1005 |
| Leptin (ng/mL), median (IQR) | 16.76 (7.28, 29.19) | 7.98 (3.49, 17.50) | 27.12 (13.59, 41.26) | 11.13 (5.12, 20.86) | 23.45 (13.73, 36.92) | <0.0001 |
| Adiponectin (µg/mL), median (IQR) | 14.35 (9.74, 20.47) | 17.16 (11.87, 24.71) | 15.34 (10.95, 21.38) | 14.67 (10.36, 20.73) | 12.48 (8.52, 18.14) | <0.0001 |
| Triglycerides_mg/dL, median (IQR) | 129.0 (89.00, 185.5) | 90.00 (65.00, 119.0) | 101.0 (73.00, 129.0) | 154.0 (104.0, 211.5) | 156.0 (116.0, 219.0) | <0.0001 |
| Total Cholesterol_mg/dL, mean (SD) | 182.5 (38.90) | 178.4 (39.37) | 180.6 (35.42) | 183.4 (39.27) | 184.8 (39.13) | 0.0416 |
| HDL-C_mg/dL, mean (SD) | 45.86 (11.46) | 51.85 (11.95) | 50.61 (10.34) | 43.60 (10.60) | 42.48 (10.06) | <0.0001 |
| LDL-C_mg/dL, mean (SD) | 107.8 (33.49) | 107.8 (34.16) | 108.2 (28.98) | 107.7 (35.51) | 107.8 (33.04) | 0.8902 |
| IL-1β (pg/mL), median (IQR) | 0.64 (0.49, 1.20) | 0.64 (0.45, 1.20) | 0.64 (0.49, 1.15) | 0.64 (0.51, 1.20) | 0.64 (0.51, 1.20) | 0.6647 |
| IL-6 (pg/mL), median (IQR) | 2.17 (0.95, 4.38) | 1.22 (0.64, 2.48) | 2.39 (0.73, 4.91) | 2.31 (0.95, 4.29) | 2.83 (1.51, 5.05) | <0.0001 |
| TNF-α (pg/mL), median (IQR) | 2.17 (0.95, 4.38) | 1.22 (0.64, 2.48) | 2.39 (0.73, 4.91) | 2.31 (0.95, 4.29) | 2.83 (1.51, 5.05) | <0.0001 |
| IL-8 (pg/mL), median (IQR) | 4.56 (3.36, 6.40) | 4.13 (3.14, 5.55) | 4.41 (3.33, 5.94) | 4.67 (3.51, 6.75) | 4.80 (3.45, 6.75) | <0.0001 |
| Hypertension (yes), n (%) | 416 (28.09) | 17 (4.71) | 16 (10.26) | 129 (36.24) | 254 (41.78) | <0.0001 |
| Smoking History, n (%) | 488 (33.15) | 107 (29.64) | 39 (25.16) | 131 (37.22) | 211 (34.93) | 0.0189 |
| Statins, n (%) | 265 (17.55) | 30 (8.29) | 7 (4.38) | 79 (21.88) | 149 (23.76) | <0.0001 |
| TZDs, n (%) | 26 (1.72) | 1 (0.28) | 0 (0.00) | 10 (2.77) | 15 (2.39) | 0.0103 |
| Incretin mimetics, n (%) | 45 (2.98) | 1 (0.28) | 0 (0.00) | 14 (3.88) | 30 (4.78) | <0.0001 |
| ACEIs/ARBs, n (%) | 340 (22.52) | 10 (2.76) | 9 (5.63) | 104 (28.81) | 217 (34.61) | <0.0001 |
| Fibrates, n (%) | 43 (2.85) | 1 (0.28) | 2 (1.25) | 13 (3.60) | 27 (4.31) | 0.0013 |
| NSAIDS, n (%) | 244 (16.16) | 32 (8.84) | 13 (8.13) | 67 (18.56) | 132 (21.05) | <0.0001 |
| Ln Resistin | Model 1 (Unadjusted) | Model 2 (Adjusted) | Model 3 (Adjusted) | |||
|---|---|---|---|---|---|---|
| Mean Difference (95% CI) | p-Value | Mean Difference (95% CI) | p-Value | Mean Difference (95% CI) | p-Value | |
| Metabolic Health/Obesity Group | 0.4888 | 0.7294 | 0.8252 | |||
| MHO vs. MHNW | 0.090 (−0.149, 0.329) | 0.4588 | 0.089 (−0.142, 0.320) | 0.4488 | 0.084 (−0.151, 0.319) | 0.4817 |
| MUHNW vs. MHNW | 0.066 (−0.121, 0.253) | 0.4890 | 0.035 (−0.146, 0.216) | 0.7032 | 0.033 (−0.155, 0.222) | 0.7311 |
| MUHO vs. MHNW | 0.130 (−0.036, 0.296) | 0.1236 | 0.085 (−0.075, 0.246) | 0.2978 | 0.071 (−0.096, 0.238) | 0.4054 |
| 0.4054 | −0.024 (−0.263, 0.215) | 0.8425 | −0.054 (−0.285, 0.177) | 0.6468 | −0.051 (−0.291, 0.188) | 0.6745 |
| MUHO vs. MHO | 0.040 (−0.183, 0.263) | 0.7239 | −0.004 (−0.220, 0.212) | 0.9721 | −0.013 (−0.236, 0.209) | 0.9061 |
| MUHO vs. MUHNW | 0.064 (−0.102, 0.230) | 0.4477 | 0.050 (−0.110, 0.210) | 0.5390 | 0.038 (−0.126, 0.201) | 0.6499 |
| IL-1Beta pg/mL | −0.006 (−0.015, 0.003) | 0.1936 | −0.010 (−0.021, 0.001) | 0.0690 | ||
| IL-6_pg/mL | −0.0001 (−0.001, 0.0001) | 0.7609 | −0.0001 (−0.001, 0.0001) | 0.8529 | ||
| TNF-Alfa pg/mL | −0.010 (−0.020, −0.001) | 0.0288 | −0.011 (−0.020, −0.002) | 0.0205 | ||
| IL-8 pg/mL | 0.076 (0.063, 0.090) | <0.001 | 0.077 (0.063, 0.091) | <0.001 | ||
| Sex: Male vs. Female | 0.040 (−0.099, 0.179) | 0.5732 | ||||
| Age (year) | −0.003 (−0.007, 0.002) | 0.2370 | ||||
| Smoking History: yes vs. no | 0.117 (−0.028, 0.262) | 0.1141 |
| Ln Leptin | Model 1 (Unadjusted) | Model 2 (Adjusted) | Model 3 (Adjusted) | |||
|---|---|---|---|---|---|---|
| Mean Difference (95% CI) | p-Value | Mean Difference (95% CI) | p-Value | Mean Difference (95% CI) | p-Value | |
| Metabolic Health/Obesity Group | <0.001 | <0.001 | <0.001 | |||
| MHO vs. MHNW | 1.139 (0.975, 1.303) | <0.001 | 1.140 (0.976, 1.304) | <0.001 | 1.026 (0.898, 1.154) | <0.001 |
| MUHNW vs. MHNW | 0.303 (0.174, 0.431) | <0.001 | 0.291 (0.163, 0.420) | <0.001 | 0.289 (0.187, 0.392) | <0.001 |
| MUHO vs. MHNW | 1.091 (0.977, 1.205) | <0.001 | 1.071 (0.956, 1.185) | <0.001 | 1.034 (0.943, 1.125) | <0.001 |
| MUHNW vs. MHO | −0.836 (−1.000, −0.672) | <0.001 | −0.849 (−1.013, −0.685) | <0.001 | −0.737 (−0.866, −0.607) | <0.001 |
| MUHO vs. MHO | −0.048 (−0.201, 0.105) | 0.5361 | −0.070 (−0.223, 0.084) | 0.3736 | 0.008 (−0.113, 0.129) | 0.8935 |
| MUHO vs. MUHNW | 0.788 (0.674, 0.902) | <0.001 | 0.779 (0.665, 0.893) | <0.001 | 0.745 (0.656, 0.834) | <0.001 |
| IL-1Beta pg/mL | 0.004 (−0.002, 0.011) | 0.1711 | 0.005 (−0.001, 0.010) | 0.1195 | ||
| IL-6 pg/mL | −0.0001 (−0.001, 0.0001) | 0.2269 | −0.0002 (−0.0005, 0.0001) | 0.2987 | ||
| TNF-Alfa pg/mL | 0.002 (−0.005, 0.008) | 0.5718 | 0.005 (0.0001, 0.010) | 0.0460 | ||
| IL-8 pg/mL | 0.012 (0.002, 0.021) | 0.0174 | 0.006 (−0.002, 0.013) | 0.1448 | ||
| Sex: Male vs. Female | −1.123 (−1.199, −1.048) | <0.001 | ||||
| Age (year) | −0.0001(−0.003, 0.002) | 0.8126 | ||||
| Smoking History: yes vs. no | −0.064 (−0.143, 0.015) | 0.1133 |
| Ln Adiponectin | Model 1 | Model 2 | Model 3 | |||
|---|---|---|---|---|---|---|
| Mean Difference (95% CI) | p-Value | Mean Difference (95% CI) | p-Value | Mean Difference (95% CI) | p-Value | |
| Metabolic Health/Obesity Group | <0.001 | <0.001 | <0.001 | |||
| MHO vs. MHNW | −0.133 (−0.237, −0.028) | 0.0130 | −0.145 (−0.250, −0.041) | 0.0065 | −0.178 (−0.276, −0.080) | <0.001 |
| MUHNW vs. MHNW | −0.202 (−0.285, −0.120) | <0.001 | −0.212 (−0.294, −0.130) | <0.001 | −0.309 (−0.388, −0.230) | <0.001 |
| MUHO vs. MHNW | −0.332 (−0.404, −0.259) | <0.001 | −0.343 (−0.416, −0.271) | <0.001 | −0.446 (−0.516, −0.376) | <0.001 |
| MUHNW vs. MHO | −0.070 (−0.175, 0.035) | 0.1912 | −0.066 (−0.171, 0.039) | 0.2150 | −0.131 (−0.231, −0.031) | 0.0104 |
| MUHO vs. MHO | −0.199 (−0.297, −0.101) | <0.001 | −0.198 (−0.296, −0.100) | <0.001 | −0.268 (−0.362, −0.175) | <0.001 |
| MUHO vs. MUHNW | −0.129 (−0.202, −0.056) | <0.001 | −0.132 (−0.204, −0.059) | <0.001 | −0.137 (−0.206, −0.069) | <0.001 |
| IL-1Beta pg/mL | −0.002 (−0.006, 0.002) | 0.2986 | −0.004 (−0.008, 0.001) | 0.1070 | ||
| IL-6 pg/mL | 0.0002 (0.0001, 0.0005) | 0.0425 | 0.0002 (0.0001, 0.0005) | 0.0405 | ||
| TNF-Alfa pg/mL | 0.0001 (−0.004, 0.005) | 0.8325 | 0.0001 (−0.004, 0.004) | 0.9304 | ||
| IL-8 pg/mL | 0.012 (0.005, 0.018) | <0.001 | 0.010 (0.004, 0.016) | 0.0010 | ||
| Sex: Male vs. Female | −0.259 (−0.317, −0.201) | <0.001 | ||||
| Age (year) | 0.010 (0.008, 0.012) | <0.001 | ||||
| Smoking History: yes vs. no | −0.014 (−0.075, 0.047) | 0.6463 |
Disclaimer/Publisher’s Note: The statements, opinions and data contained in all publications are solely those of the individual author(s) and contributor(s) and not of MDPI and/or the editor(s). MDPI and/or the editor(s) disclaim responsibility for any injury to people or property resulting from any ideas, methods, instructions or products referred to in the content. |
© 2025 by the authors. Licensee MDPI, Basel, Switzerland. This article is an open access article distributed under the terms and conditions of the Creative Commons Attribution (CC BY) license (https://creativecommons.org/licenses/by/4.0/).
Share and Cite
Al-Dallal, R.; Thomas, K.; Lee, M.; Chaudhri, A.; Davis, E.; Vaidya, P.; Lee, M.; McCormick, J.B.; Fisher-Hoch, S.P.; Gutierrez, A.D. The Association of Resistin with Metabolic Health and Obesity in a Mexican-American Population. Int. J. Mol. Sci. 2025, 26, 4443. https://doi.org/10.3390/ijms26094443
Al-Dallal R, Thomas K, Lee M, Chaudhri A, Davis E, Vaidya P, Lee M, McCormick JB, Fisher-Hoch SP, Gutierrez AD. The Association of Resistin with Metabolic Health and Obesity in a Mexican-American Population. International Journal of Molecular Sciences. 2025; 26(9):4443. https://doi.org/10.3390/ijms26094443
Chicago/Turabian StyleAl-Dallal, Reem, Keziah Thomas, MinJae Lee, Aysha Chaudhri, Eleanor Davis, Priyanka Vaidya, Miryoung Lee, Joseph B. McCormick, Susan P. Fisher-Hoch, and Absalon D. Gutierrez. 2025. "The Association of Resistin with Metabolic Health and Obesity in a Mexican-American Population" International Journal of Molecular Sciences 26, no. 9: 4443. https://doi.org/10.3390/ijms26094443
APA StyleAl-Dallal, R., Thomas, K., Lee, M., Chaudhri, A., Davis, E., Vaidya, P., Lee, M., McCormick, J. B., Fisher-Hoch, S. P., & Gutierrez, A. D. (2025). The Association of Resistin with Metabolic Health and Obesity in a Mexican-American Population. International Journal of Molecular Sciences, 26(9), 4443. https://doi.org/10.3390/ijms26094443