
MicroRNA Is Downregulated in Invasive Non-Functioning Pituitary Adenomas

 , , ,
, , ,  ,
,
Abstract
1. Introduction
2. Results
3. Discussion
4. Materials and Methods
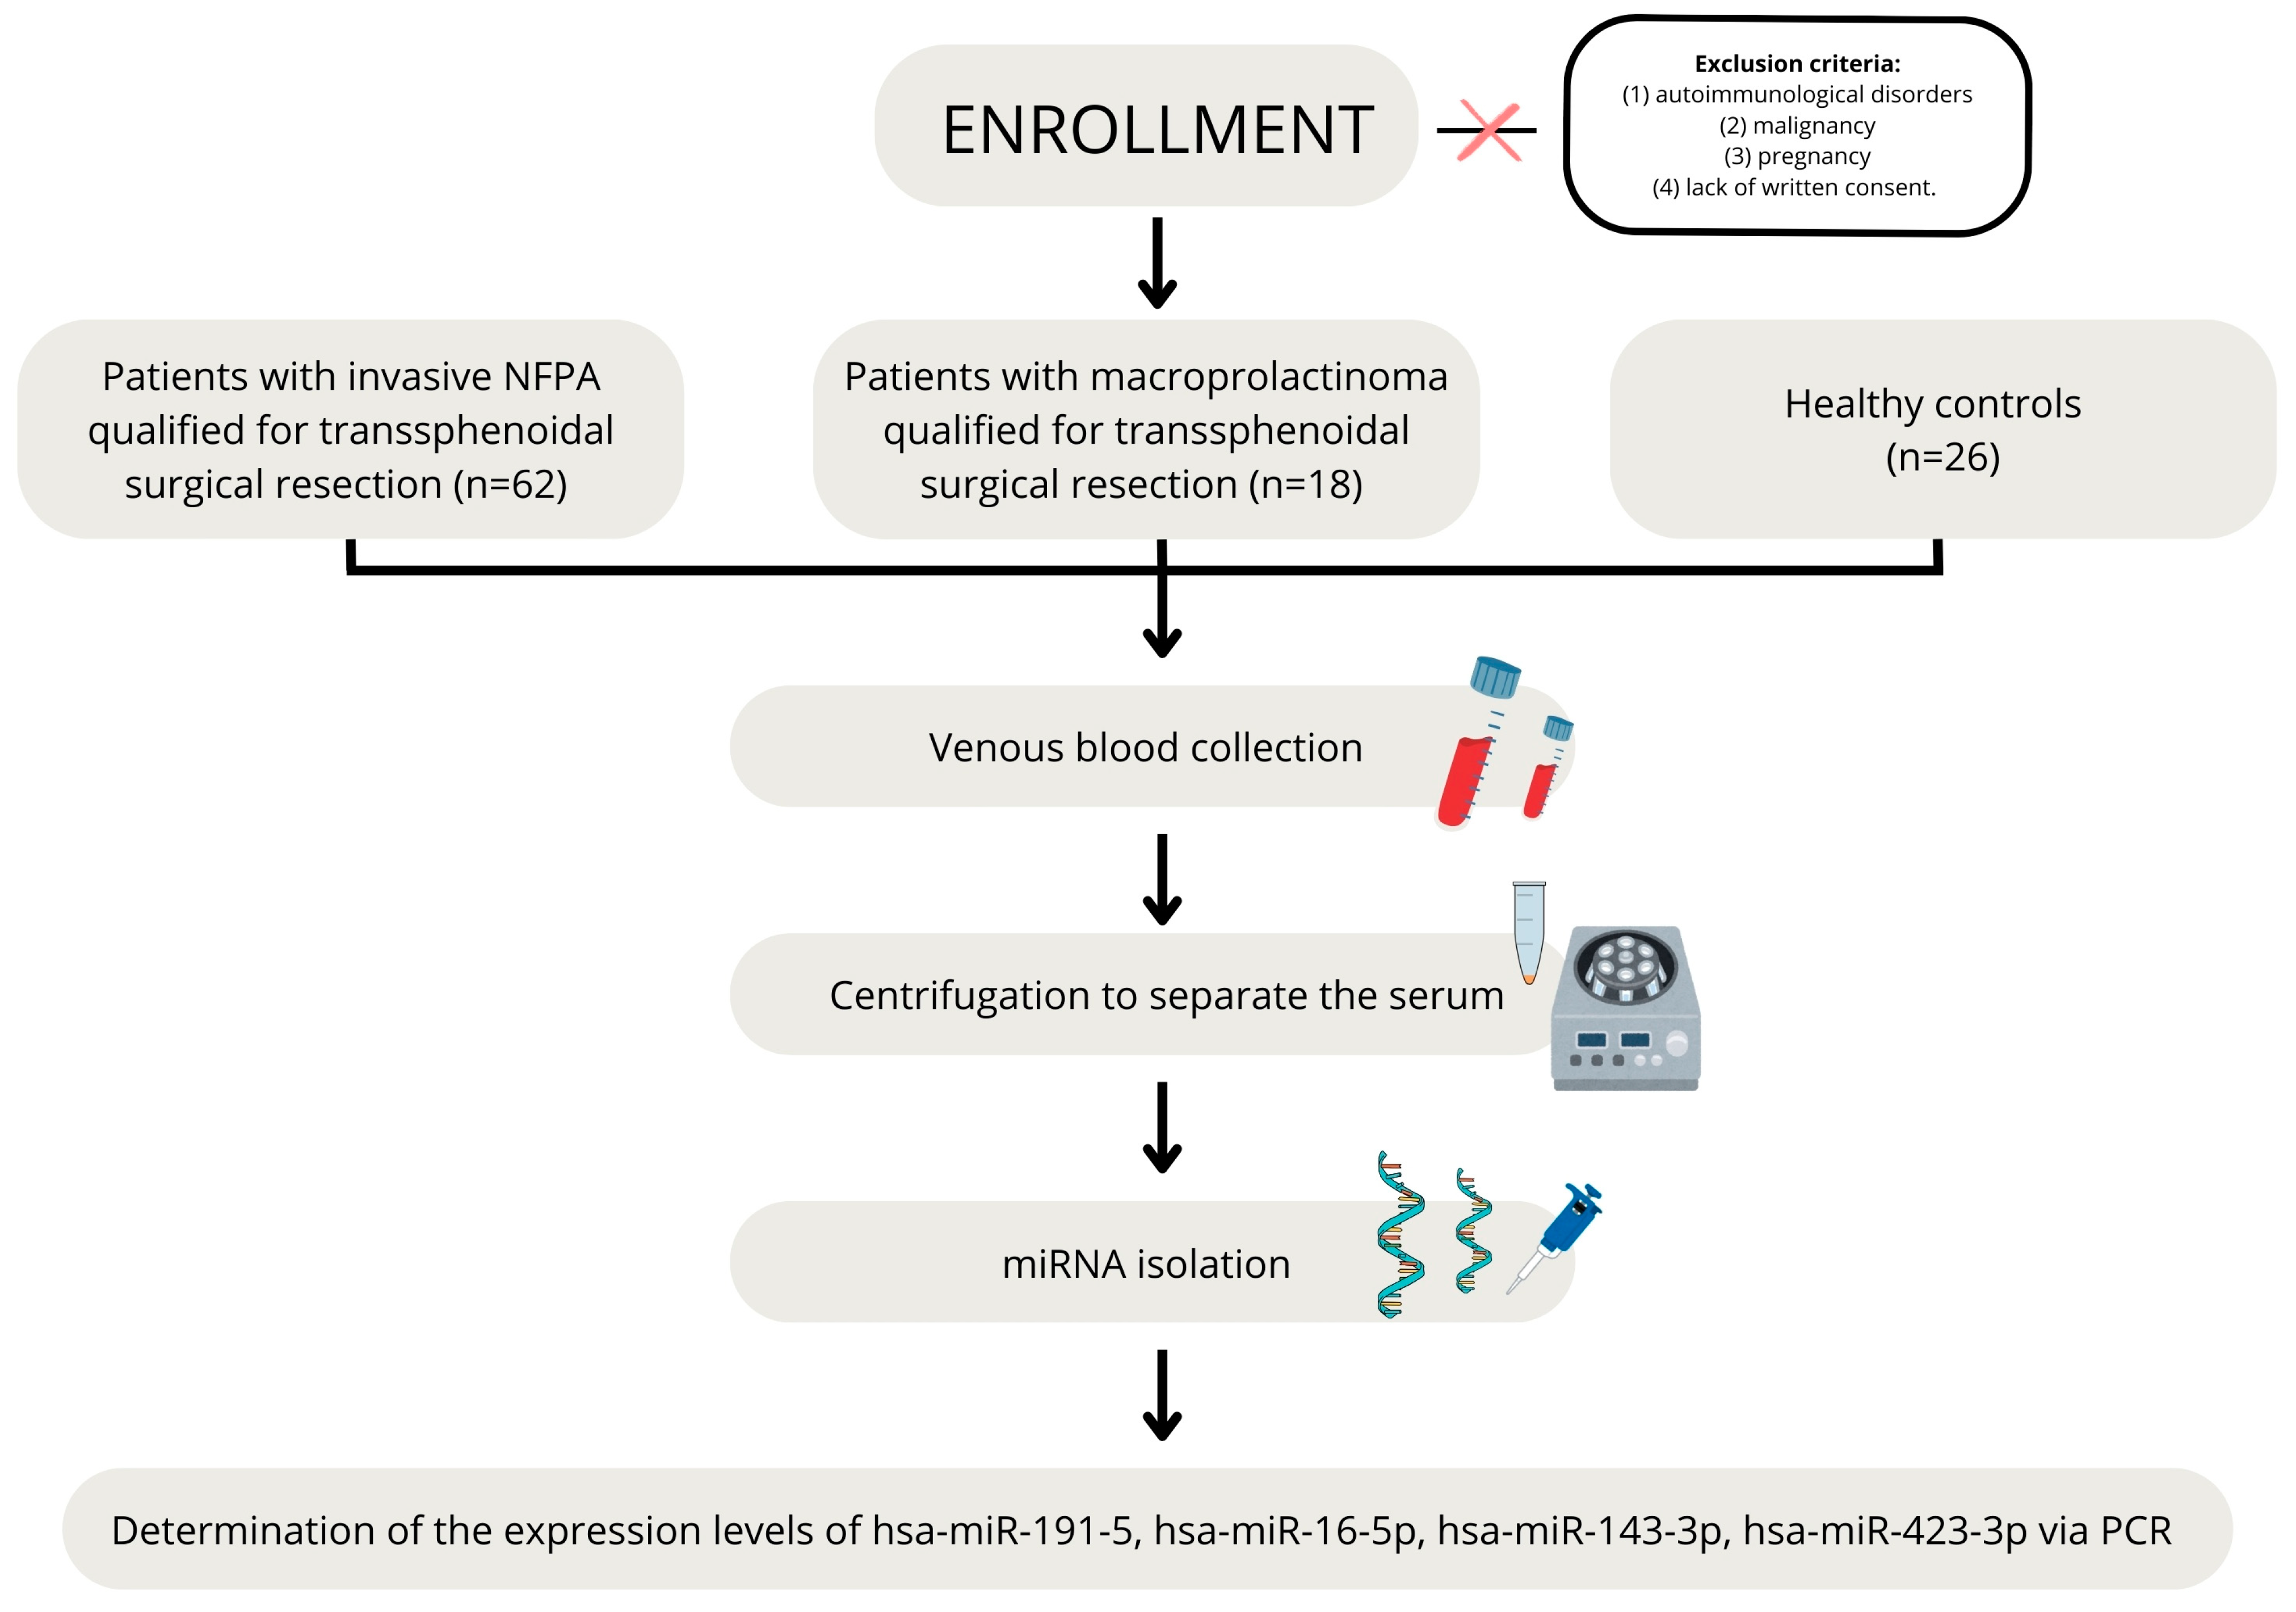
4.1. Patients
4.2. Hormone Level Assessment
4.3. Magnetic Resonance Imaging
4.4. MicroRNA Serum Level Assessment
4.5. Statistical Analyses
Author Contributions
Funding
Institutional Review Board Statement
Informed Consent Statement
Data Availability Statement
Conflicts of Interest
References
- Araujo-Castro, M.; Berrocal, V.R.; Pascual-Corrales, E. Pituitary Tumors: Epidemiology and Clinical Presentation Spectrum. Hormones 2020, 19, 145–155. [Google Scholar] [CrossRef]
- Lv, L.; Zhang, B.; Wang, M.; Yin, S.; Zhou, P.; Hu, Y.; Zhang, S.; Chen, C.; Zhang, N.; Jiang, S. Invasive Pituitary Adenomas with Gross Total Resection: The Wait-and-See Policy during Postoperative Management. J. Clin. Neurosci. 2018, 58, 49–55. [Google Scholar] [CrossRef]
- Ilie, M.D.; Jouanneau, E.; Raverot, G. Aggressive Pituitary Adenomas and Carcinomas. Endocrinol. Metab. Clin. N. Am. 2020, 49, 505–515. [Google Scholar] [CrossRef] [PubMed]
- Dekkers, O.M.; Karavitaki, N.; Pereira, A.M. The Epidemiology of Aggressive Pituitary Tumors (and Its Challenges). Rev. Endocr. Metab. Disord. 2020, 21, 209–212. [Google Scholar] [CrossRef] [PubMed]
- Melmed, S.; Kaiser, U.B.; Lopes, M.B.; Bertherat, J.; Syro, L.V.; Raverot, G.; Reincke, M.; Johannsson, G.; Beckers, A.; Fleseriu, M.; et al. Clinical Biology of the Pituitary Adenoma. Endocr. Rev. 2022, 43, 1003–1037. [Google Scholar] [CrossRef] [PubMed]
- Coopmans, E.C.; Korbonits, M. Molecular Genetic Testing in the Management of Pituitary Disease. Clin. Endocrinol. 2022, 97, 424–435. [Google Scholar] [CrossRef]
- Kasuki, L. Definition and Diagnosis of Aggressive Pituitary Tumors. Rev. Endocr. Metab. Disord. 2020, 21, 203–208. [Google Scholar] [CrossRef]
- Mehta, G.U.; Lonser, R.R. Management of Hormone-Secreting Pituitary Adenomas. Neuro. Oncol. 2017, 19, 762–773. [Google Scholar] [CrossRef] [PubMed]
- Petersenn, S.; Fleseriu, M.; Casanueva, F.F.; Giustina, A.; Biermasz, N.; Biller, B.M.K.; Bronstein, M.; Chanson, P.; Fukuoka, H.; Gadelha, M.; et al. Diagnosis and Management of Prolactin-Secreting Pituitary Adenomas: A Pituitary Society International Consensus Statement. Nat. Rev. Endocrinol. 2023, 19, 722–740. [Google Scholar] [CrossRef] [PubMed]
- Swearingen, B. Update on Pituitary Surgery. J. Clin. Endocrinol. Metab. 2012, 97, 1073–1081. [Google Scholar] [CrossRef]
- Zada, G.; Schroeder, H.W.S.; Little, A.S.; Laws, E.R. Introduction. Management of Pituitary Tumors: 2020 and Beyond. Neurosurg. Focus 2020, 48, E1. [Google Scholar] [CrossRef]
- Molitch, M.E. Diagnosis and Treatment of Pituitary Adenomas: A Review. JAMA 2017, 317, 516–524. [Google Scholar] [CrossRef]
- Tampourlou, M.; Ntali, G.; Ahmed, S.; Arlt, W.; Ayuk, J.; Byrne, J.V.; Chavda, S.; Cudlip, S.; Gittoes, N.; Grossman, A.; et al. Outcome of Nonfunctioning Pituitary Adenomas That Regrow After Primary Treatment: A Study From Two Large UK Centers. J. Clin. Endocrinol. Metab. 2017, 102, 1889–1897. [Google Scholar] [CrossRef] [PubMed]
- Chang, M.; Jiang, S.; Guo, X.; Gao, J.; Liu, P.; Bao, X.; Feng, M.; Wang, R. Exosomal RNAs in the Development and Treatment of Pituitary Adenomas. Front. Endocrinol. 2023, 14, 1142494. [Google Scholar] [CrossRef] [PubMed]
- Hu, Y.; Zhang, C.; Chang, Q.; Du, J.; Lu, H.; Guo, X.; Chang, W.; Liu, S.; Chen, C. MicroRNA-196a-5p Targeting LRP1B Modulates Phenotype of Thyroid Carcinoma Cells. Endokrynol. Pol. 2023, 74, 144–152. [Google Scholar] [CrossRef]
- Lyu, L.; Li, H.; Chen, C.; Yu, Y.; Wang, L.; Yin, S.; Hu, Y.; Jiang, S.; Ye, F.; Zhou, P. Exosomal miRNA Profiling Is a Potential Screening Route for Non-Functional Pituitary Adenoma. Front. Cell Dev. Biol. 2022, 9, 771354. [Google Scholar] [CrossRef] [PubMed]
- Hill, M.; Tran, N. miRNA Interplay: Mechanisms and Consequences in Cancer. Dis. Model. Mech. 2021, 14, dmm047662. [Google Scholar] [CrossRef]
- Zembska, A.; Jawiarczyk-Przybyłowska, A.; Wojtczak, B.; Bolanowski, M. MicroRNA Expression in the Progression and Aggressiveness of Papillary Thyroid Carcinoma. Anticancer Res. 2019, 39, 33–40. [Google Scholar] [CrossRef]
- Bottoni, A.; Piccin, D.; Tagliati, F.; Luchin, A.; Zatelli, M.C.; Degli Uberti, E.C. miR-15a and miR-16-1 down-Regulation in Pituitary Adenomas. J. Cell. Physiol. 2005, 204, 280–285. [Google Scholar] [CrossRef]
- Gallo, A.; Tandon, M.; Alevizos, I.; Illei, G.G. The Majority of MicroRNAs Detectable in Serum and Saliva Is Concentrated in Exosomes. PLoS ONE 2012, 7, e30679. [Google Scholar] [CrossRef]
- Cogswell, J.P.; Ward, J.; Taylor, I.A.; Waters, M.; Shi, Y.; Cannon, B.; Kelnar, K.; Kemppainen, J.; Brown, D.; Chen, C.; et al. Identification of miRNA Changes in Alzheimer’s Disease Brain and CSF Yields Putative Biomarkers and Insights into Disease Pathways. J. Alzheimer’s Dis. 2008, 14, 27–41. [Google Scholar] [CrossRef]
- da Silveira, J.C.; Veeramachaneni, D.N.R.; Winger, Q.A.; Carnevale, E.M.; Bouma, G.J. Cell-Secreted Vesicles in Equine Ovarian Follicular Fluid Contain miRNAs and Proteins: A Possible New Form of Cell Communication Within the Ovarian Follicle1. Biol. Reprod. 2012, 86, 1–10. [Google Scholar] [CrossRef] [PubMed]
- Hu, Y.; Zhu, L.; Cao, R. Clinical Predictive Value of Control Attenuation Parameters in Combination with miR-192-5p in Patients with Acute Pancreatitis in Nonalcoholic Fatty Liver Disease. Endokrynol. Pol. 2024, 75, 207–215. [Google Scholar] [CrossRef] [PubMed]
- Chen, X.; Ba, Y.; Ma, L.; Cai, X.; Yin, Y.; Wang, K.; Guo, J.; Zhang, Y.; Chen, J.; Guo, X.; et al. Characterization of microRNAs in Serum: A Novel Class of Biomarkers for Diagnosis of Cancer and Other Diseases. Cell Res. 2008, 18, 997–1006. [Google Scholar] [CrossRef]
- Lu, B.; Liu, G.-L.; Yu, F.; Li, W.-J.; Xiang, X.-X.; Xiao, H.-Z. MicroRNA-16/VEGFR2/P38/NF-κB Signaling Pathway Regulates Cell Growth of Human Pituitary Neoplasms. Oncol. Rep. 2018, 39, 1235–1244. [Google Scholar] [CrossRef]
- Beylerli, O.; Khasanov, D.; Gareev, I.; Valitov, E.; Sokhatskii, A.; Wang, C.; Pavlov, V.; Khasanova, G.; Ahmad, A. Differential Non-Coding RNAs Expression Profiles of Invasive and Non-Invasive Pituitary Adenomas. Non-Coding RNA Res. 2021, 6, 115–122. [Google Scholar] [CrossRef] [PubMed]
- Németh, K.; Darvasi, O.; Likó, I.; Szücs, N.; Czirják, S.; Reiniger, L.; Szabó, B.; Krokker, L.; Pállinger, É.; Igaz, P.; et al. Comprehensive Analysis of Circulating miRNAs in the Plasma of Patients With Pituitary Adenomas. J. Clin. Endocrinol. Metab. 2019, 104, 4151–4168. [Google Scholar] [CrossRef]
- Wang, Z.; Gao, L.; Guo, X.; Feng, C.; Deng, K.; Lian, W.; Xing, B. Identification of microRNAs Associated with the Aggressiveness of Prolactin Pituitary Tumors Using Bioinformatic Analysis. Oncol. Rep. 2019, 42, 533–548. [Google Scholar] [CrossRef]
- Lei, C.; Jing, G.; Jichao, W.; Xiaohui, L.; Fang, Q.; Hua, G.; Yazhou, M.; Zhang, Y. MiR-137’s Tumor Suppression on Prolactinomas by Targeting MITF and Modulating Wnt Signaling Pathway. J. Clin. Endocrinol. Metab. 2019, 104, 6391–6402. [Google Scholar] [CrossRef]
- Zhang, J.; Ma, D.; Liu, H.; Wang, J.; Fan, J.; Li, X. MicroRNA-143 Shows Tumor Suppressive Effects through Inhibition of Oncogenic K-Ras in Pituitary Tumor. Int. J. Clin. Exp. Pathol. 2017, 10, 10969–10978. [Google Scholar]
- Yagi, T.; Sawada, K.; Miyamoto, M.; Shimizu, A.; Oi, Y.; Toda, A.; Nakamura, K.; Kinose, Y.; Kodama, M.; Hashimoto, K.; et al. Continuous Administration of Anti-VEGFA Antibody Upregulates PAI-1 Secretion from Ovarian Cancer Cells via miR-143-3p Downregulation. Mol. Cancer Res. 2023, 21, 1093–1106. [Google Scholar] [CrossRef] [PubMed]
- Ju, Y.; Choi, G.-E.; Lee, M.W.; Jeong, M.; Kwon, H.; Kim, D.H.; Kim, J.; Jin, H.; Lee, K.E.; Hyun, K.-Y.; et al. Identification of miR-143-3p as a Diagnostic Biomarker in Gastric Cancer. BMC Med. Genom. 2023, 16, 135. [Google Scholar] [CrossRef] [PubMed]
- Hossian, A.K.M.N.; Mackenzie, G.G.; Mattheolabakis, G. Combination of miR-143 and miR-506 Reduces Lung and Pancreatic Cancer Cell Growth through the Downregulation of Cyclin-dependent Kinases. Oncol. Rep. 2021, 45, 2. [Google Scholar] [CrossRef]
- Shi, H.; Shen, H.; Xu, J.; Zhao, S.; Yao, S.; Jiang, N. MiR-143-3p Suppresses the Progression of Ovarian Cancer. Am. J. Transl. Res. 2018, 10, 866–874. [Google Scholar] [PubMed]
- Armstrong, L.; Willoughby, C.E.; McKenna, D.J. Targeting of AKT1 by miR-143-3p Suppresses Epithelial-to-Mesenchymal Transition in Prostate Cancer. Cells 2023, 12, 2207. [Google Scholar] [CrossRef]
- Renjie, W.; Haiqian, L. MiR-132, miR-15a and miR-16 Synergistically Inhibit Pituitary Tumor Cell Proliferation, Invasion and Migration by Targeting Sox5. Cancer Lett. 2015, 356, 568–578. [Google Scholar] [CrossRef]
- Niu, Y.; Zhou, H.; Liu, Y.; Wang, Y.; Xie, J.; Feng, C.; An, N. miR-16 Regulates Proliferation and Apoptosis of Pituitary Adenoma Cells by Inhibiting HMGA2. Oncol. Lett. 2019, 17, 2491–2497. [Google Scholar] [CrossRef]
- Amaral, F.C.; Torres, N.; Saggioro, F.; Neder, L.; Machado, H.R.; Silva, W.A.; Moreira, A.C.; Castro, M. MicroRNAs Differentially Expressed in ACTH-Secreting Pituitary Tumors. J. Clin. Endocrinol. Metab. 2009, 94, 320–323. [Google Scholar] [CrossRef]
- Zhao, S.; Li, J.; Feng, J.; Li, Z.; Liu, Q.; Lv, P.; Wang, F.; Gao, H.; Zhang, Y. Identification of Serum miRNA-423-5p Expression Signature in Somatotroph Adenomas. Int. J. Endocrinol. 2019, 2019, e8516858. [Google Scholar] [CrossRef]
- Tian, H.; Chen, S.; Zhang, C.; Li, M.; Zheng, H. MYC and hsa-miRNA-423-5p as Biomarkers in Nasopharyngeal Carcinoma Revealed by miRNA-mRNA-pathway Network Integrated Analysis. Mol. Med. Rep. 2017, 16, 1039–1046. [Google Scholar] [CrossRef]
- Zhang, Q.; Wang, Y.; Zhou, Y.; Zhang, Q.; Xu, C. Potential Biomarkers of miRNA in Non-Functional Pituitary Adenomas. World J. Surg. Oncol. 2021, 19, 270. [Google Scholar] [CrossRef] [PubMed]
- Nowak, J.K.; Walkowiak, J. Study Designs in Medical Research and Their Key Characteristics. J. Med. Sci. 2023, 92, e928. [Google Scholar] [CrossRef]
- Sawicka-Gutaj, N.; Gruszczyński, D.; Guzik, P.; Mostowska, A.; Walkowiak, J. Publication Ethics of Human Studies in the Light of the Declaration of Helsinki—A Mini-Review. J. Med. Sci. 2022, 91, e700. [Google Scholar] [CrossRef]
- Tokłowicz, M.; Żbikowska, A.; Janusz, P.; Kotwicki, T.; Andrusiewicz, M.; Kotwicka, M. MicroRNA Expression Profile Analysis in Human Skeletal Muscle Tissue: Selection of Critical Reference. Biomed. Pharmacother. 2023, 162, 114682. [Google Scholar] [CrossRef]

| NFPA (n = 62) | PRL (n = 18) | CG (n = 26) | |
|---|---|---|---|
| Age (M ± SD) | 57.3 ± 15.6 | 42.5 ± 14.0 | 42.2 ± 13.1 |
| Gender (males/females) | 30 (48%)/32 (52%) | 14 (78%)/4 (22%) | 9 (35%)/17 (65%) |
| Macroadenoma | 57 (92%) | 13 (72%) | NA |
| Giant adenoma | 5 (8%) | 5 (28%) | NA |
| Volume (cm3) (M ± SD) | 7.95 (±7.08) | 10.49 (±13) | NA |
| Invasive/Non-invasive | 62 (100%)/0 | 16 (89%)/2 (11%) | NA |
| Invasion of cavernous sinus | 57 (92%) | 14 (78%) | NA |
| Invasion of sphenoid sinus | 11 (18%) | 2 (11%) | NA |
| Optic chiasm compression | 45 (73%) | 13 (72%) | NA |
| Tumor mass effect | |||
| Headache | 54 (87%) | 11 (61%) | NA |
| Visual field defect | 39 (63%) | 9 (50%) | NA |
| Hyperprolactinemia | 24 (39%) | 18 (100%) | NA |
| Hypopituitarism | |||
| Gonadal axis | 30 (48%) | 9 (50%) | NA |
| Corticotropic axis | 20 (32%) | 6 (33%) | NA |
| Somatotropic axis | 6 (10%) | 1 (6%) | NA |
| Tyreotropic axis | 22 (35%) | 6 (33%) | NA |
| Median (95% CI) | NFPA | PRL | CG | p-Value |
|---|---|---|---|---|
| ACTH [pg/mL] | 29.8 (23.6–35.4) | 39.6 (26.4–45.6) * | 18.9 (13.7–22.2) | 0.006 |
| GH [ng/mL] | 0.26 (0.17–0.46) | 0.24 (0.07–0.49) * | 0.89 (0.35–1.95) | 0.018 |
| Cortisol [nmol/L] | 339 (271–408) | 331 (273–423) | 395 (340–471) | 0.066 |
| TSH [μU/mL] | 1.10 (0.90–1.47) * | 1.89 (1.02–2.22) | 1.77 (1.28–2.41) | 0.003 |
| fT3 [pmol/L] | 3.9 (3.7–4.1) * | 4.0 (3.4–4.4) | 4.5 (4.2–4.8) | 0.006 |
| fT4 [pmol/L] | 14.1 (13.4–15.0) * | 12.5 (9.3–15.0) * | 15.5 (14.6–16.2) | 0.002 |
| IGF1 [ng/mL] | M 101 (76–153) * F 154 (81–191) | M 106 (69–149) * F 195 (130–263) | M 174 (120–205) F 161 (110–204) | M 0.0036 F 0.39 |
| PRL [μIU/mL] | 302 (234–403) | 4220 (982–16697) * | 249 (197–363) | 0.000003 |
| FSH [mlU/mL] | 5.9 (4.5–7.8) | 2.6 (1.5–3.6) * | 5.9 (4.7–11.2) | 0.002 |
| LH [mlU/mL] | 3.7 (2.5–6.1) * | 2.1 (1.4–3.1) * | 8.2 (4.8–14.1) | 0.0008 |
| Testosterone [nmol/L] | M 7.06 (2.12–10.7) * F 0.4 (0.1–0.8) * | M 4.93 (1.50–9.95) * F 1.13 (0.85–1.38) | M 19.2 (16.6–24.1) F 1.0 (0.85–1.3) | M 0.0067 F 0.0005 |
| SHBG [nmol/L] | M 30.9 (25.4–63.2) F 63.8 (46.2–83.8) | M 38.3 (26.8–41.2) F 63.1 (49.5–79.8) | M 47.8 (36.8–52.6) F 67.3 (49.4–79.0) | M 0.19 F 0.99 |
| Estradiol [pg/mL] | M 14 (4–20) F 7 (5–18) | M 18 (7–28) F 41 (23–145) | M 21 (19–27) F 40 (13–87) | M 0.055 F 0.057 |
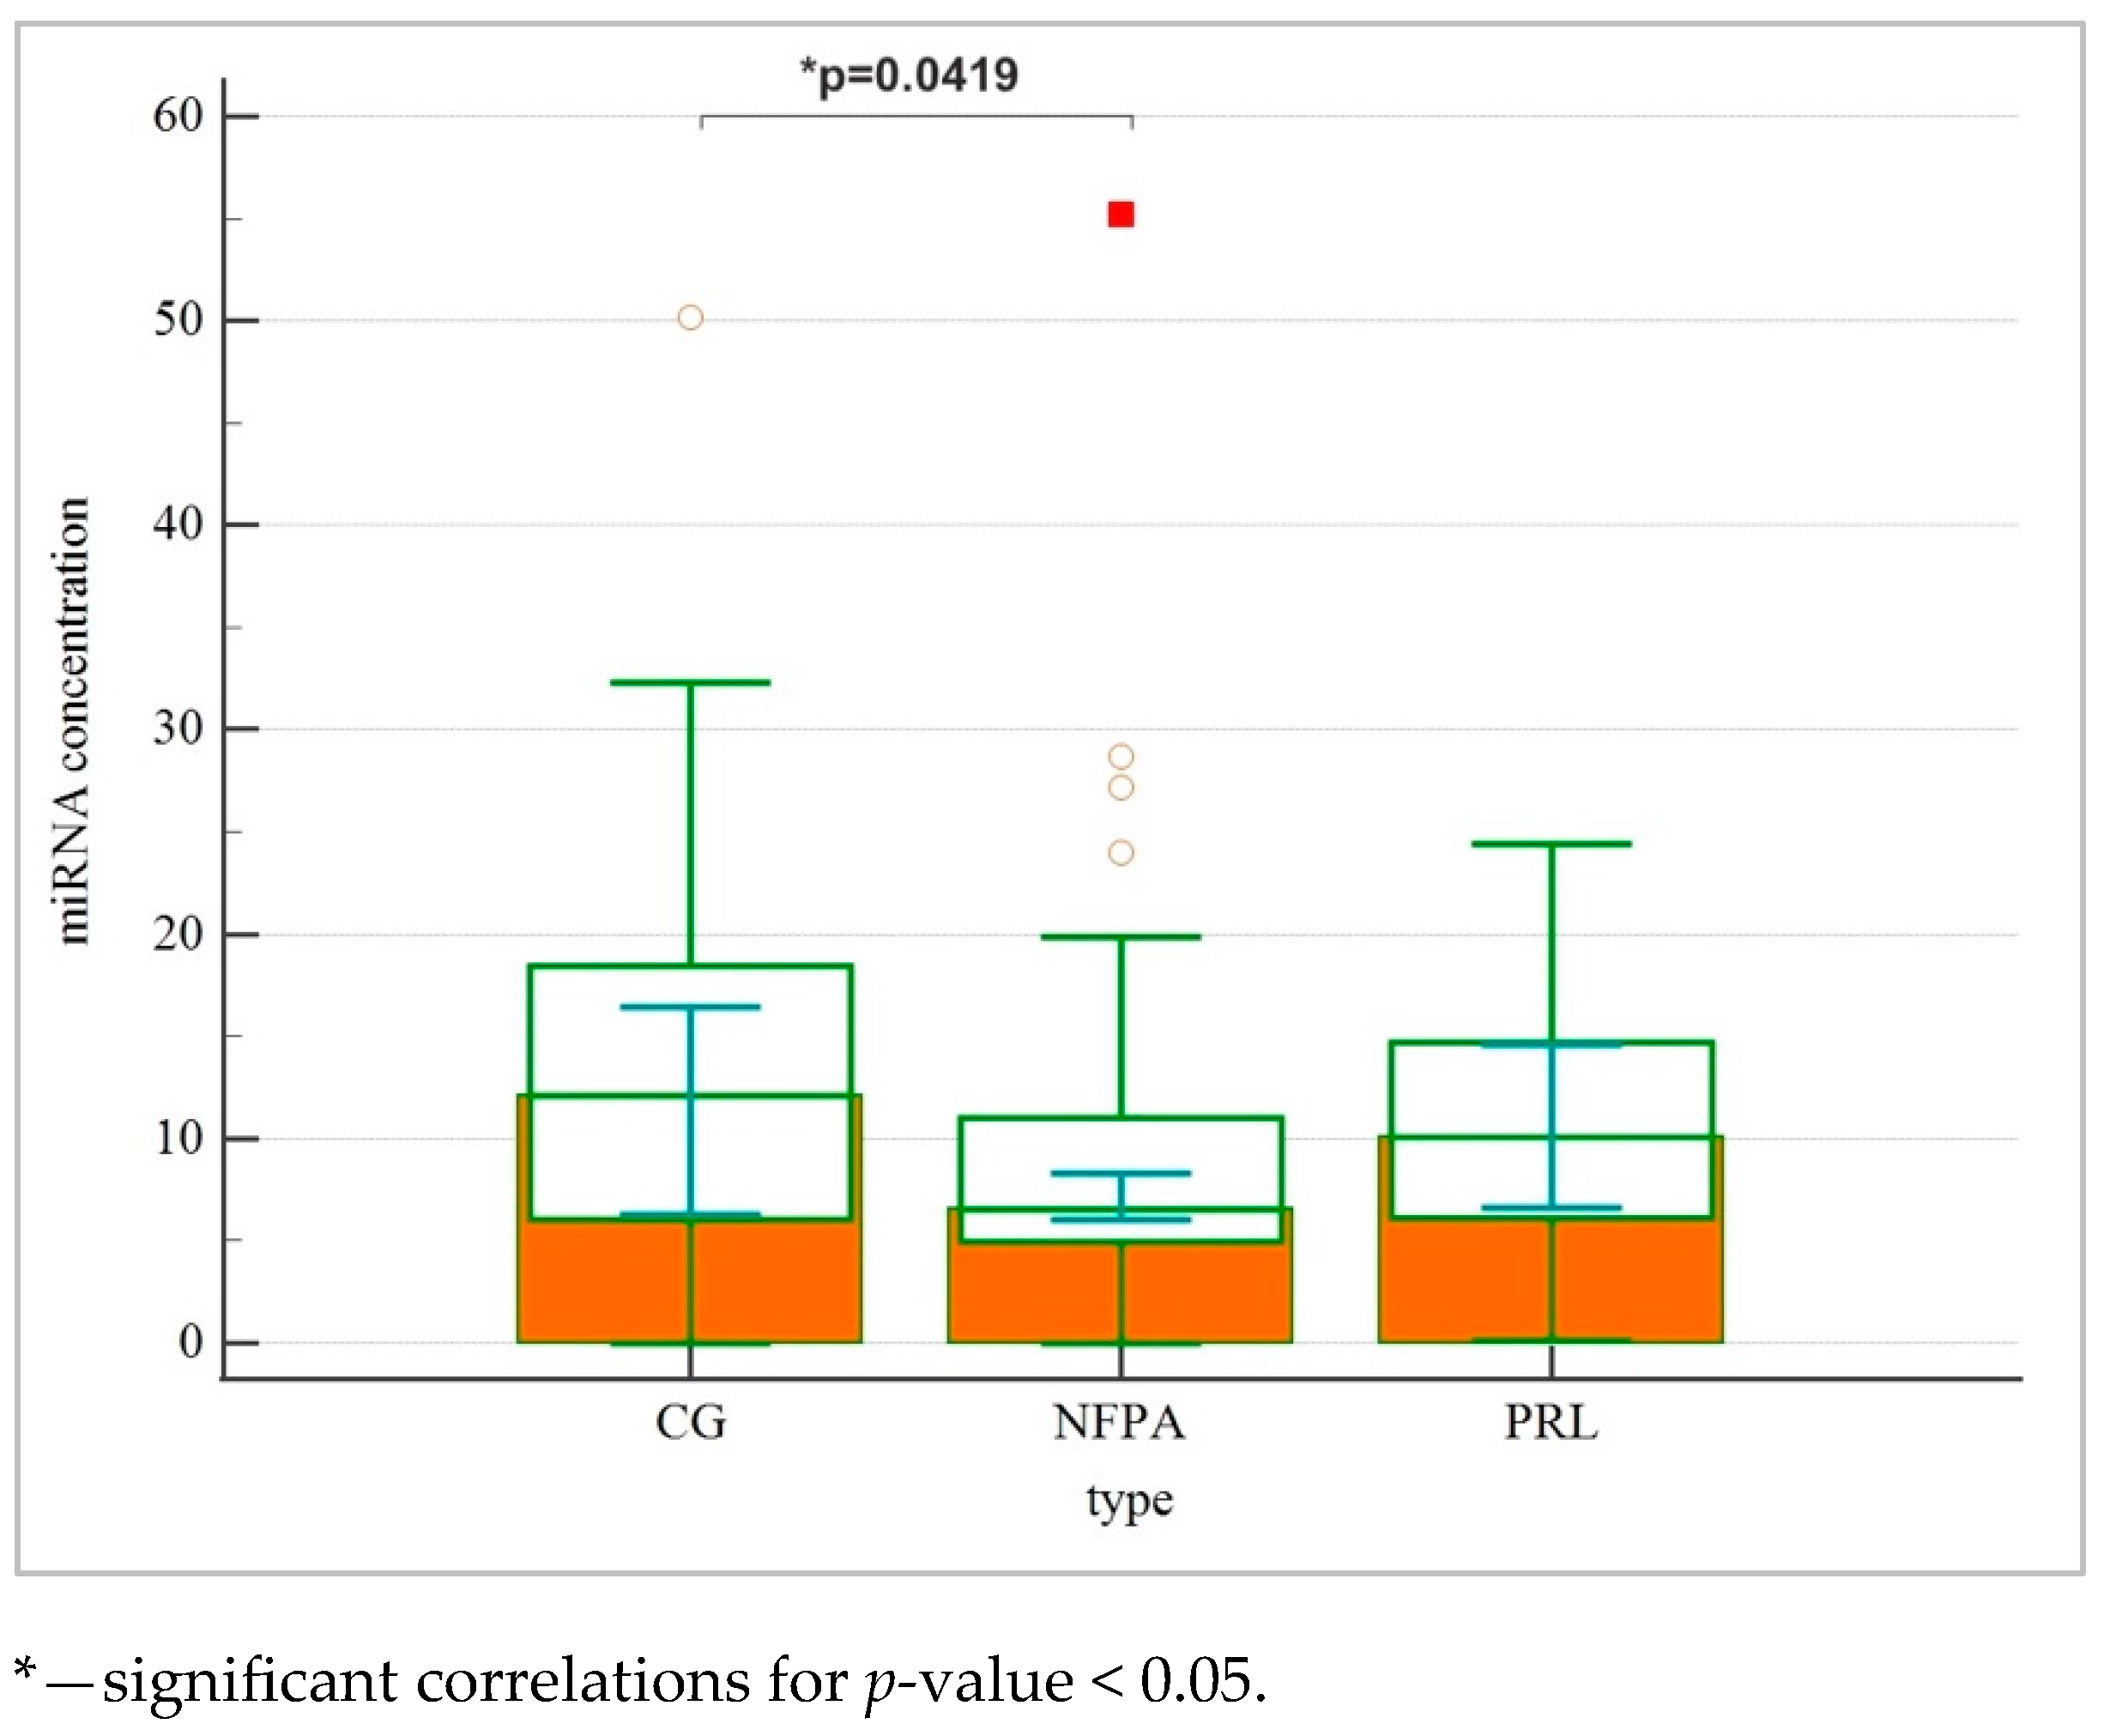
| miRNA concentracion | 6.55 (6.06–8.35) * | 10.08 (6.63–14.59) | 12.11 (6.28–16.45) | 0.031 |
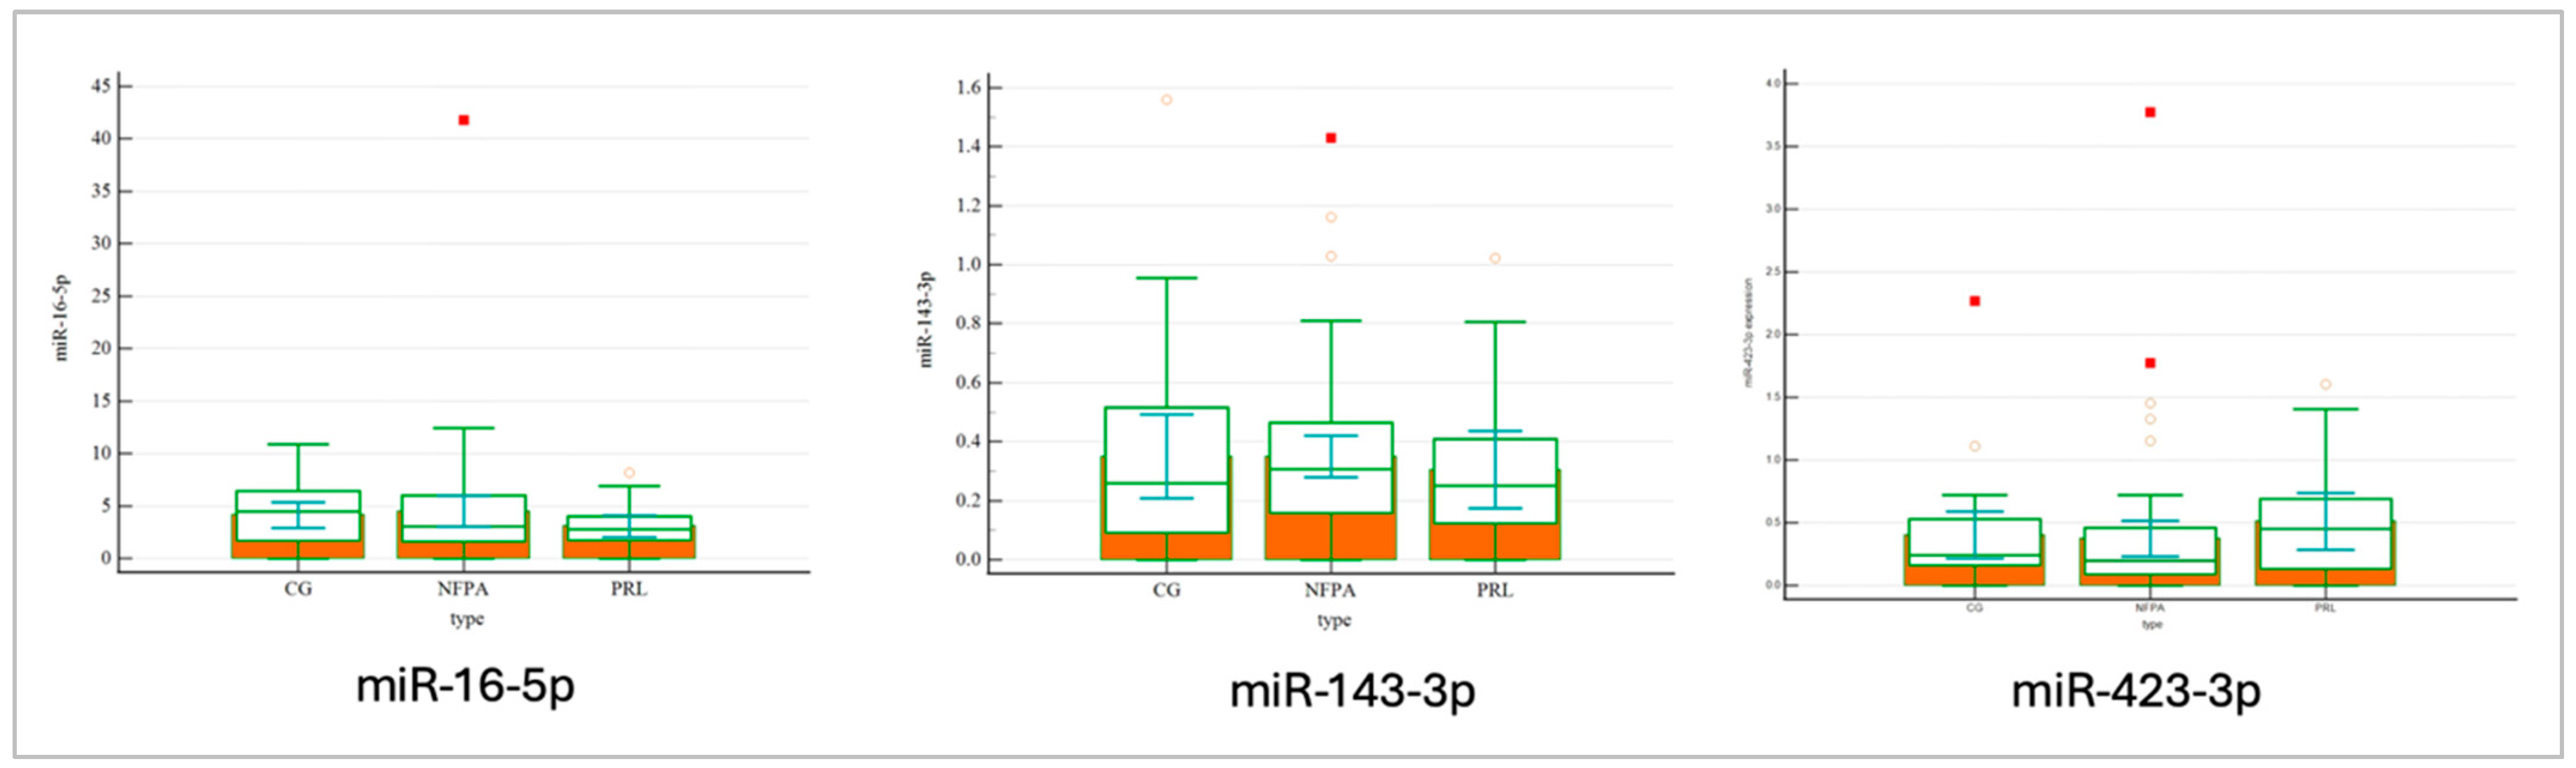
| hsa-miR-143-3p | 28.72 (28.05–29.01) | 29.08 (26.72–30.74) | 29.67 (27.49–30.49) | 0.568 |
| hsa-miR-16-5p | 24.22 (23.49–25.04) | 25.26 (22.50–27.06) | 25.38 (24.07–27.36) | 0.107 |
| hsa-miR-423-3p | 28.42 (27.07–29.62) | 27.74 (25.56–29.73) | 28.84 (27.97–29.66) | 0.523 |
| hsa-miR-191-5p | 28.05 (27.53–28.21) | 27.97 (26.21–31.04) | 28.92 (27.73–30.70) | 0.348 |
| hsa-miR-143-3p | hsa-miR-16-5p | hsa-miR-423-3p | Total miRNA Concentration | |||||
|---|---|---|---|---|---|---|---|---|
| Rs | p-Value | Rs | p-Value | Rs | p-Value | Rs | p-Value | |
| Tumor type | –0.0724 | 0.461 | 0.0153 | 0.8767 | 0.142 | 0.1459 | 0.255 | 0.0083 * |
| (a) | |||||||
|---|---|---|---|---|---|---|---|
| Independent Variables | Coefficient | Std. Error | 95% CI | t | p-Value | rpartial | rsemipartial |
| (Constant) | 6.6689 | 1.9316 | 2.8386 to 10.4993 | 3.4526 | 0.0008 | ||
| Type | 2.5451 | 1.0367 | 0.4894 to 4.6009 | 2.4551 | 0.0157 * | 0.2341 | 0.2341 |
| (b) | |||||||
| Independent Variables | Coefficient | Std. Error | 95% CI | t | p-Value | rpartial | rsemipartial |
| (Constant) | 6.6689 | 1.9316 | 2.8386 to 10.4993 | 3.4526 | 0.0008 | ||
| Type | 2.5451 | 1.0367 | 0.4894 to 4.6009 | 2.4551 | 0.0157 * | 0.2341 | 0.2341 |
| Age | BMI | Body Weight | Headache | |||||
| Rs | p-Value | Rs | p-Value | Rs | p-Value | Rs | p-Value | |
| miRNA concentration | –0.15 | 0.1326 | –0.12 | 0.24 | –0.01 | 0.8983 | –0.16 | 0.165 |
| Tumor volume | Visual field loss | Invasion of cavernous sinus | Invasion of sphenoid sinus | |||||
| Rs | p-value | Rs | p-value | Rs | p-value | Rs | p-value | |
| miRNA concentration | <0.01 | 0.9915 | 0.07 | 0.5235 | –0.23 | 0.0390 * | −0.10 | 0.368 |
Disclaimer/Publisher’s Note: The statements, opinions and data contained in all publications are solely those of the individual author(s) and contributor(s) and not of MDPI and/or the editor(s). MDPI and/or the editor(s) disclaim responsibility for any injury to people or property resulting from any ideas, methods, instructions or products referred to in the content. |
© 2025 by the authors. Licensee MDPI, Basel, Switzerland. This article is an open access article distributed under the terms and conditions of the Creative Commons Attribution (CC BY) license (https://creativecommons.org/licenses/by/4.0/).
Share and Cite
Derwich-Rudowicz, A.; Żbikowska, A.; Ruchała, M.; Andrusiewicz, M.; Moskal, J.; Sawicka-Gutaj, N. MicroRNA Is Downregulated in Invasive Non-Functioning Pituitary Adenomas. Int. J. Mol. Sci. 2025, 26, 4408. https://doi.org/10.3390/ijms26094408
Derwich-Rudowicz A, Żbikowska A, Ruchała M, Andrusiewicz M, Moskal J, Sawicka-Gutaj N. MicroRNA Is Downregulated in Invasive Non-Functioning Pituitary Adenomas. International Journal of Molecular Sciences. 2025; 26(9):4408. https://doi.org/10.3390/ijms26094408
Chicago/Turabian StyleDerwich-Rudowicz, Aleksandra, Aleksandra Żbikowska, Marek Ruchała, Mirosław Andrusiewicz, Jakub Moskal, and Nadia Sawicka-Gutaj. 2025. "MicroRNA Is Downregulated in Invasive Non-Functioning Pituitary Adenomas" International Journal of Molecular Sciences 26, no. 9: 4408. https://doi.org/10.3390/ijms26094408
APA StyleDerwich-Rudowicz, A., Żbikowska, A., Ruchała, M., Andrusiewicz, M., Moskal, J., & Sawicka-Gutaj, N. (2025). MicroRNA Is Downregulated in Invasive Non-Functioning Pituitary Adenomas. International Journal of Molecular Sciences, 26(9), 4408. https://doi.org/10.3390/ijms26094408