Article

GLIO-Select: Machine Learning-Based Feature Selection and Weighting of Tissue and Serum Proteomic and Metabolomic Data Uncovers Sex Differences in Glioblastoma

Radiation Oncology Branch, Center for Cancer Research, National Cancer Institute, NIH, 9000 Rockville Pike, Building 10, Bethesda, MD 20892, USA
*
Author to whom correspondence should be addressed.
Int. J. Mol. Sci. 2025, 26(9), 4339; https://doi.org/10.3390/ijms26094339
Submission received: 24 February 2025 / Revised: 27 March 2025 / Accepted: 30 April 2025 / Published: 2 May 2025
(This article belongs to the Section Molecular Informatics)

Abstract

Glioblastoma (GBM) is a fatal brain cancer known for its rapid and aggressive growth, with some studies indicating that females may have better survival outcomes compared to males. While sex differences in GBM have been observed, the underlying biological mechanisms remain poorly understood. Feature selection can lead to the identification of discriminative key biomarkers by reducing dimensionality from high-dimensional medical datasets to improve machine learning model performance, explainability, and interpretability. Feature selection can uncover unique sex-specific biomarkers, determinants, and molecular profiles in patients with GBM. We analyzed high-dimensional proteomic and metabolomic profiles from serum biospecimens obtained from 109 patients with pathology-proven glioblastoma (GBM) on NIH IRB-approved protocols with full clinical annotation (local dataset). Serum proteomic analysis was performed using Somalogic aptamer-based technology (measuring 7289 proteins) and serum metabolome analysis using the University of Florida’s SECIM (Southeast Center for Integrated Metabolomics) platform (measuring 6015 metabolites). Machine learning-based feature selection was employed to identify proteins and metabolites associated with male and female labels in high-dimensional datasets. Results were compared to publicly available proteomic and metabolomic datasets (CPTAC and TCGA) using the same methodology and TCGA data previously structured for glioma grading. Employing a machine learning-based and hybrid feature selection approach, utilizing both LASSO and mRMR, in conjunction with a rank-based weighting method (i.e., GLIO-Select), we linked proteomic and metabolomic data to clinical data for the purposes of feature reduction to identify molecular biomarkers associated with biological sex in patients with GBM and used a separate TCGA set to explore possible linkages between biological sex and mutations associated with tumor grading. Serum proteomic and metabolomic data identified several hundred features that were associated with the male/female class label in the GBM datasets. Using the local serum-based dataset of 109 patients, 17 features (100% ACC) and 16 features (92% ACC) were identified for the proteomic and metabolomic datasets, respectively. Using the CPTAC tissue-based dataset (8828 proteomic and 59 metabolomic features), 5 features (99% ACC) and 13 features (80% ACC) were identified for the proteomic and metabolomic datasets, respectively. The proteomic data serum or tissue (CPTAC) achieved the highest accuracy rates (100% and 99%, respectively), followed by serum metabolome and tissue metabolome. The local serum data yielded several clinically known features (PSA, PZP, HCG, and FSH) which were distinct from CPTAC tissue data (RPS4Y1 and DDX3Y), both providing methodological validation, with PZP and defensins (DEFA3 and DEFB4A) representing shared proteomic features between serum and tissue. Metabolomic features shared between serum and tissue were homocysteine and pantothenic acid. Several signals emerged that are known to be associated with glioma or GBM but not previously known to be associated with biological sex, requiring further research, as well as several novel signals that were previously not linked to either biological sex or glioma. EGFR, FAT4, and BCOR were the three features associated with 64% ACC using the TCGA glioma grading set. GLIO-Select shows remarkable results in reducing feature dimensionality when different types of datasets (e.g., serum and tissue-based) were used for our analyses. The proposed approach successfully reduced relevant features to less than twenty biomarkers for each GBM dataset. Serum biospecimens appear to be highly effective for identifying biologically relevant sex differences in GBM. These findings suggest that serum-based noninvasive biospecimen-based analyses may provide more accurate and clinically detailed insights into sex as a biological variable (SABV) as compared to other biospecimens, with several signals linking sex differences and glioma pathology via immune response, amino acid metabolism, and cancer hallmark signals requiring further research. Our results underscore the importance of biospecimen choice and feature selection in enhancing the interpretation of omics data for understanding sex-based differences in GBM. This discovery holds significant potential for enhancing personalized treatment plans and patient outcomes.

1. Introduction

Glioblastoma (GBM) is a fatal primary brain tumor that affects men disproportionately compared to women (1.6:1), with data suggesting that males have more aggressive diseases and poorer outcomes [1]. The biological reasons for these observations are as yet unclear, although molecular characterization reveals that females are more likely to have MGMT methylated disease, secondary GBMs, differences in tumor location, and molecular and metabolic mechanistic triggers [2,3,4,5,6]. Sex differences in cancer as applied to serum proteomics and metabolomics are important given mounting data for the differential response to management and outcome differences between male and female patients. This is particularly the case in non-invasively collected biospecimens such as serum where molecular profiling aimed at sex differences is underexplored [1,6,7,8,9,10,11]. Nonetheless, non-invasive specimens are easier and cheaper to acquire and provide the only means of obtaining data in real-time in tumors located in areas not amenable to repeat tissue sampling, such as the brain. Noninvasive biospecimens such as blood samples in the clinic are the mainstay of biomarker-directed clinical care in the real world and the most cost and time-effective means of obtaining information that can impact management in real-time. Blood-based biomarkers are not currently available for most cancers including GBM, limiting the ability to personalize management and curtailing access to precision medicine secondary to cost, particularly in resource-strained care environments [12,13]. Sex as a biological variable analysis (SABV) has been hampered by a paucity of data available with robust annotation for male and female as class labels and the prevalence of datasets where one sex is more frequently diagnosed with the primary tumor as compared to the other, as is the case for GBM [14]. Most analyses in this space employ data as an aggregate of both men and women without separation of the samples for analysis, masking potential differences. Additional barriers in serum proteomic and metabolomic data include the biological complexity of sex differences comprised of hormonal influences, genetic and epigenetic factors, and immune response [1]. Additional technical and methodological challenges contribute to the lack of conclusions in serum proteome and metabolome data, as both are highly complex, detecting both high- and low-abundance proteins and compounds, and there is difficulty in the attribution of differences to biological aspects compared to confounders including age and comorbidities [15]. The identification of biomarkers that are equally effective in women and men remains an understudied aspect of serum omics data. Given existing data supporting differences in outcomes (both progression and survival) in GBM in men vs. women, addressing these issues requires integrative, multidisciplinary approaches combining advanced proteomic and metabolomic technologies, robust bioinformatics, and the consideration of biological sex in study design and analysis. We wanted to define serum proteomic and metabolomic signals in a cohort of women and men with pathologically proven GBM using serum-derived proteomic and metabolomic data, hypothesizing that identified signals may be representative of both known signals associated with sex differences, which can provide validation of the methodology, and possible additional signals, which may indicate a relationship with the underlying malignancy, with possible downstream mechanistic insights. We repeated the same analysis in publicly available data (CPTAC and TCGA) and compared the results, exploring the intersectionality between serum vs. tissue in an effort to guide future efforts aimed at identifying GBM biomarkers with clinical applicability.
In this study, we proposed a hybrid feature selection method that combines LASSO (i.e., Least Absolute Shrinkage and Selection Operator) and mRMR (i.e., Minimum Redundancy Maximum Relevance). This approach leverages the advantages of sparse feature selection and reduced redundancy, effectively addressing the limitations of each method when applied individually. Through this integration, we sought to improve the reliability and interpretability of selected features, especially in the context of sex differences in glioblastoma. We also aimed to find the minimum number of selected features with the highest performance results in terms of accuracy rate.
The main contributions of this study, divided into technical and clinical aspects, are outlined below:
  • Technical aspects
  • To the best of our knowledge, this is the first study that employs a combined feature selection and weighting methodology (i.e., GLIO-Select) employing female/male as a class label for classification tasks on different proteomic, metabolomic, and molecular datasets.
  • To increase the scope and motivation of this study, we apply and compare our approach to the five different case studies on -omics and molecular datasets for classification.
  • We adopted our previous MetaWise [16] methodology to analyze different types of problems and omics data.
  • To address the effects of imbalanced class distribution in our datasets, we implemented stratified cross-validation, ensuring that each data fold retained the original class proportions.
  • We utilized a rank-based feature weighting methodology to identify the feature names despite potential variations across cross-validation folds.
  • We evaluated the effects of feature selection and weighting on six different machine learning models on proteomic, metabolomic, and molecular datasets to determine the optimal prediction model and minimal feature set for accurate classification.
  • We visualized and interpreted selected features by using clustergram (i.e., dendrogram and heatmap) plots according to the dataset’s male/female class labels.
  • Clinical aspects
  • We employed serum proteomic and metabolomic datasets applying feature selection operations to determine which serum signals distinguish samples obtained from females as compared to males. This is novel as serum proteomic and metabolomic profiles in GBM have not been described.
  • To determine whether there are overlapping or linked signals between tissue and serum, we carried out the same analysis in CPTAC proteomic and metabolomic data.
  • To link emerging signals and results derived using feature selection to transcriptomic data, we employed a TCGA glioma grading dataset we previously demonstrated as effective at glioma grading to identify mutations distinguishing tumor grade distribution between women and men.
  • The present approach, coupled with interpretable dimensionality reduction (i.e., feature selection), enabled the identification of biomarkers with high accuracy to differentiate males from females in patients with GBM.
  • Our methodology shows promising potential for future studies in several ways: (1) as a possible check for data accuracy in serum samples; (2) as a means of validating serum and tissue signals previously described using feature selection; (3) as a means of showcasing signals that have a distinct relationship to one sex vs. another, some of which represent novel signals; and (4) as a means of identifying signals that may help with further research into differential molecular and mechanistic aspects between females and males in GBM.
The remainder of this paper is structured as follows: Section 2 outlines the experimental setup, performance indicators, and computational outcomes in detail. Section 3 presents the results and discussion. Section 4 provides a detailed description of the dataset, the employed feature selection and weighting methodologies, and the supervised learning models used for classification. Finally, Section 5 summarizes the study’s findings and suggests potential directions for future research.

2. Results

In this section, we describe the experimental process and evaluation metrics, Then, we present our computational results based on rank-based feature selection and weighting in detail.

2.1. Experimental Process

To implement the proposed methods, we utilized Python’s scikit-learn library for machine learning algorithms and the mRMR [17] package for filter-based feature selection. We also utilized the MATLAB (version R2024b) environment for visualization purposes.
All experiments were carried out on a macOS Sequoia 15.2 MacBook Pro notebook with 16-core Apple M3 Max configurations and 128 GB LPDDR5 Memory. To achieve optimal results, we utilized six different classification models, including Support Vector Machines (SVMs), K-Nearest Neighbors (KNN), Logistic Regression (LR), Adaptive Boosting (AdaBoost), Random Forest (RF), and a voting-based ensemble learning model, which were used in both feature selection and classification stages. To ensure consistency across our previous studies [16,18] involving various data types, including molecular, proteomic, and metabolomic data, and given the numerous possible combinations of feature subsets, datasets, preprocessing methods, classification models, total or rank-ordered weights, and cross-validation methods, we have adopted the same parameter settings from Tasci et al. [16] and the same processing methods from our previous similar studies [16,18,19] for the feature selection and classification processes. In our study, we employed stratified five-fold cross-validation to evaluate the performance of our predictive models. In other words, the dataset is divided five-fold in a structured way (i.e., each fold maintains the same class distribution (male/female) as the original dataset). Each fold serves as a temporary hold-out set, while the remaining folds are used for model training. The mean accuracy rate value is obtained from the cross-validation process to calculate the performance results. This method was chosen for its ability to preserve class distributions across training and test sets, ensuring that male and female patient groups were proportionally represented in each fold. The cross-validation technique is also generally preferred and used over the hold-out set as it is considered more robust and better captures variations across different splits when the sample size is small. This was critical for minimizing bias and improving the robustness of our findings. Additionally, stratified cross-validation offered a computationally efficient approach to validate our results, making it particularly suitable given the scope of our study and the absence of hyperparameter optimization as a key objective. This methodology strikes a balance between computational efficiency and rigorous performance evaluation, thereby supporting the validity of our conclusions. The voting-based ensemble learning model consists of five prediction models, including SVM, KNN, LR, RF, and AdaBoost by applying the soft voting rule. We set the alpha parameter value as 0.01 for the LASSO feature selection (FS) method of the CPTAC [20] metabolomic and TCGA-UCI [21] GBM datasets due to the high correlation between features. To manage randomness and ensure consistent results on the datasets employed, we fixed the random state to 0 for all six machine-learning models.

2.2. Performance Metrics

To assess the performance of the hybrid filter and embedded feature selection techniques within the context of -omics data analysis, we specifically evaluated their classification accuracy. This metric directly reflects the success of the feature selection process in correctly classifying samples.
Classification accuracy (ACC) is determined by calculating the proportion of correctly classified samples within the entire dataset. This involves summing the number of true positive and true negative predictions and dividing this sum by the total number of samples, spanning both correct and incorrect classifications [22], as outlined in Equation (1).
A C C = T P + T N T P + T N + F P + F N
where TP, FN, TN, and FP denote the number of true positives, false negatives, true negatives, and false positives, respectively. This study aimed to find the best performance of different result sets according to the highest accuracy rate with the minimum number of selected features.

2.3. Computational Results

This subsection presents the effects of our feature selection and weighting approach on the performance of the learning models for five different datasets.

2.3.1. The Effects of Feature Selection and Weighting Method on Classification Model Performance for Omics and Molecular Datasets in Patients with GBM

Using stratified five-fold cross-validation, we evaluated the performance of LASSO and mRMR-based feature selection methods using rank-based weighting schemes (with weights of 1 and 2). The computational results of these experiments, detailing the weight count (‘k’), are thoroughly tabulated in Table 1, Table 2, Table 3, Table 4 and Table 5. The changes in color, from red to green, in the tables denote the lowest (red) accuracy rate values to the highest accuracy rate values (green). Bold values show the best results in the related table.
  • Proteomic Dataset Results
In this feature selection study for GBM patients, we obtained a 100% accuracy rate (ACC) with 17 selected proteomic features and the SVM classifier by assigning a rank value for LASSO of 2 and mRMR of 1 and using a weight value of 7 for the local preCRT-based proteomic dataset (see Table 1). A perfect classification accuracy score was yielded from a total of 7289 proteomic features for our serum-based GBM dataset with different numbers of selected features, models, and settings. We used the lowest number of selected features (i.e., largest dimensionality reduction) with the highest accuracy rate to provide efficient results. As can be observed in Table 1, LR also obtained a perfect accuracy rate by using 44 selected features and assigning weights of 1 to LASSO and 2 to mRMR. K-NN, RF, and voting-based ensemble learning models produced results close to the best and higher results than the AdaBoost model.
Table 1. The effect of the rank-based feature weighting and selection method on the accuracy rate (%) for the local preCRT-based proteomic dataset.
LASSO = 1 and mRMR = 2
k# of FeaturesSVMLRKNNRFAdaBoostVoting
118696.32098.18291.73296.27793.55098.139
287100.00099.09195.41197.23093.55099.091
34499.048100.00095.41198.18296.36499.091
42599.09199.09198.18294.50294.50299.091
51799.09199.09199.04895.41193.55098.139
61197.23097.23097.23095.41193.55097.230
7997.23097.23097.23095.41192.64196.321
8997.23097.23097.23095.41192.64196.321
9897.23097.23097.23096.36492.64196.321
10897.23097.23097.23096.36492.64196.321
11597.23097.23097.23095.41195.41197.230
12496.32196.27796.32193.55093.55096.321
13496.32196.27796.32193.55093.55096.321
14496.32196.27796.32193.55093.55096.321
LASSO = 2 and mRMR = 1
k# of FeaturesSVMLRKNNRFAdaBoostVoting
118696.32098.18291.73299.09193.55098.139
217596.32098.18291.73297.18693.55098.139
373100.00099.09194.50297.23095.41198.139
472100.00099.09192.64197.23094.50298.139
53999.09199.09194.50296.32094.50299.091
63699.04899.09193.59398.18295.45597.230
717100.00099.09198.18297.23097.27398.182
81699.04899.09197.22995.41193.59398.139
91197.18698.13998.13997.23096.32198.139
101098.13998.13995.41196.32196.32198.139
11496.32196.27796.32194.45993.55096.321
12496.32196.27796.32194.45993.55096.321
13496.32196.27796.32194.45993.55096.321
14496.32196.27796.32194.45993.55096.321
According to the CPTAC proteomic dataset feature selection results shown in Table 2, the best performance is obtained with 99% ACC, 5 selected proteomic features, and the SVM or KNN classifier by assigning a rank value of 2 to LASSO and 1 to mRMR and using a weight value of 6. As seen in the results in Table 2, all prediction models provided similar results. The AdaBoost model gave 97.000% ACC for all different weights and rank-based assignments. We propose that this status could be related to the effects of the features employed, data distribution, or model fitting. If we also use only two selected features, we can obtain 97% ACC for the CPTAC proteomic dataset.
Table 2. The effect of the rank-based feature weighting and selection method on the accuracy rate (%) for the CPTAC proteomic dataset.
LASSO = 1 and mRMR = 2
k# of FeaturesSVMLRKNNRFAdaBoostVoting
16898.00099.00096.94799.00097.00098.000
25199.00099.00098.00099.00097.00099.000
31499.00098.00099.00099.00097.00098.000
41199.00098.00099.00098.00097.00098.000
5798.00098.00098.00097.94797.00098.000
6798.00098.00098.00097.94797.00098.000
7697.00097.00097.00098.00097.00098.000
8697.00097.00097.00098.00097.00098.000
9497.00097.00097.00098.00097.00098.000
10497.00097.00097.00098.00097.00098.000
11297.00097.00098.00098.00097.00098.000
12297.00097.00098.00098.00097.00098.000
13297.00097.00098.00098.00097.00098.000
14297.00097.00098.00098.00097.00098.000
LASSO = 2 and mRMR = 1
k# of FeaturesSVMLRKNNRFAdaBoostVoting
16898.00099.00096.94799.00097.00098.000
23698.00099.00097.00099.00097.00099.000
31698.00099.00098.00099.00097.00099.000
41598.00099.00097.00098.00097.00099.000
5899.00099.00099.00098.00097.00098.000
6599.00098.00099.00096.94797.00098.000
7297.00097.00098.00098.00097.00098.000
8297.00097.00098.00098.00097.00098.000
9297.00097.00098.00098.00097.00098.000
10297.00097.00098.00098.00097.00098.000
11297.00097.00098.00098.00097.00098.000
12297.00097.00098.00098.00097.00098.000
13297.00097.00098.00098.00097.00098.000
14297.00097.00098.00098.00097.00098.000
  • Metabolomic Dataset Results
We also evaluated our GLIO-Select methodology on two different metabolomic datasets. The effect of the rank-based feature weighting and selection method on the accuracy rate (%) for two datasets is presented in Table 3 and Table 4. The best performance is obtained with 91.6% ACC, 16 selected metabolomic features, and the LR classifier by assigning a rank value of 2 to LASSO and 1 to mRMR and using a weight value of 7 for the local level one confidence level preCRT-based metabolomic dataset.
Table 3. The effect of the rank-based feature weighting and selection method on the accuracy rate (%) for the local level one preCRT-based metabolomic dataset.
LASSO = 1 and mRMR = 2
k# of FeaturesSVMLRKNNRFAdaBoostVoting
17281.29983.03081.25582.25171.86285.931
24885.84486.88374.71978.48569.09183.983
32787.79287.79280.21782.25175.67186.840
42188.78891.55885.88780.39081.25590.649
51687.87987.87984.02682.29481.29987.835
61081.29981.29977.61981.29981.25581.255
7879.48180.34679.48079.48177.61979.481
8680.39080.34676.53778.52870.00078.571
9577.57682.29472.81477.57671.90576.667
10377.53381.38572.85771.99174.67576.667
11377.53381.38572.85771.99174.67576.667
12278.57179.52473.93976.66768.22578.571
13278.57179.52473.93976.66768.22578.571
14176.66771.94874.67564.45968.13978.441
LASSO = 2 and mRMR = 1
k# of FeaturesSVMLRKNNRFAdaBoostVoting
17281.29983.03081.25580.34671.86285.931
26577.48984.02676.62376.66770.86683.074
34185.88888.74474.76280.39067.14384.935
43784.93586.84076.49480.34672.81484.026
52186.97085.97480.30381.34279.39486.970
61886.97088.74484.06979.48081.21286.926
71687.83591.55887.79281.38578.35587.835
81385.06585.97487.79279.52475.71486.926
91083.16084.06985.06579.52481.29986.017
10886.01785.97484.15679.48177.57686.061
11578.57178.48572.90078.48579.39478.571
12480.34680.43375.62879.43776.66780.303
13278.57179.52473.93976.66768.22578.571
14278.57179.52473.93976.66768.22578.571
For the CPTAC metabolomic dataset, the best result is provided by 80% ACC and 13 selected metabolomic features by utilizing the LR or voting-based ensemble models, using the feature weight value of 10 and assigning a rank-based weight of 2 to LASSO and 1 to mRMR (see Table 4). For the proteomic and metabolomic datasets, the assignment of the rank-based weights of 2 to LASSO 2 and 1 to mRMR gave the highest accuracy rate for all combination sets of feature selection operations by employing different weights or prediction models.
Table 4. The effect of the rank-based feature weighting and selection method on the accuracy rate (%) for the CPTAC metabolomic dataset.
LASSO = 1 and mRMR = 2
k# of FeaturesSVMLRKNNRFAdaBoostVoting
15556.00060.00060.00058.66757.33362.667
24557.33361.33358.66760.00060.00066.667
33861.33364.00058.66754.66754.66768.000
42565.33368.00065.33360.00064.00069.333
51873.33374.66772.00070.66765.33376.000
6970.66768.00066.66762.66762.66772.000
7872.00069.33365.33364.00069.33365.333
8773.33366.66764.00068.00066.66769.333
9773.33366.66764.00068.00066.66769.333
10365.33362.66764.00065.33360.00062.667
11365.33362.66764.00065.33360.00062.667
12264.00060.00073.33368.00050.66769.333
13264.00060.00073.33368.00050.66769.333
14168.00062.66768.00062.66760.00069.333
LASSO = 2 and mRMR = 1
k# of FeaturesSVMLRKNNRFAdaBoostVoting
15556.00060.00060.00054.66757.33362.667
25456.00060.00060.00049.33352.00064.000
34458.66661.33360.00058.66753.33368.000
44260.00062.66760.00056.00054.66768.000
53661.33362.66757.33364.00056.00069.333
63661.33362.66757.33364.00056.00069.333
72565.33368.00065.33358.66662.66766.667
82266.66669.33362.66762.66753.33368.000
91470.66778.66765.33365.33364.00076.000
101376.00080.00074.66774.66761.33380.000
11673.33366.66765.33366.66776.00069.333
12673.33366.66765.33366.66776.00069.333
13264.00060.00073.33368.00050.66769.333
14264.00060.00073.33368.00050.66769.333
  • Molecular Dataset Results
When we use the TCGA-GBM/UCI ML Repository molecular/mutation dataset for the male/female class label feature selection task, the best result is provided by 63.6% ACC, 3 selected features, a weight value of 11, and using SVM and RF models by assigning weights of 1 to LASSO and 2 to mRMR. The detailed results are illustrated in Table 5. This dataset shows which molecular/mutation genes are particularly discriminative for the current class label in GBM patient data. With the exception of KNN, all approaches provided similar results (Table 5) but were not able to separate the class label signals as well as the other datasets in this study. Overall, the three selected features resulted in 63.6% ACC.
Table 5. The effect of the rank-based feature weighting and selection method on the accuracy rate (%) for the TCGA-GBM/UCI ML Repository molecular dataset.
LASSO = 1 and mRMR = 2
k# of FeaturesSVMLRKNNRFAdaBoostVoting
1961.64661.65844.57161.37662.51561.364
2961.64661.65844.57161.37662.51561.364
3762.20161.09146.52362.20960.51961.638
4762.20161.09146.52362.20960.51961.638
5762.20161.09146.52362.20960.51961.638
6661.06663.06653.07461.06262.49560.781
7463.06263.35255.36463.06263.63463.630
8363.63463.06649.40463.63463.35262.213
9363.63463.06649.40463.63463.35262.213
10363.63463.06649.40463.63463.35262.213
11363.63463.06649.40463.63463.35262.213
12262.21362.78542.57562.78562.78562.499
LASSO = 2 and mRMR = 1
k# of FeaturesSVMLRKNNRFAdaBoostVoting
1961.64661.65853.08761.37662.51561.083
2762.20161.09145.66662.20960.51961.638
3762.20161.09145.66662.20960.51961.638
4661.91960.23345.66662.20960.80161.919
5561.06663.35252.50761.06262.49159.928
6561.06663.35252.50761.06262.49159.928
7463.06263.35255.36463.06263.63463.344
8362.78162.78552.52762.49962.78562.781
9262.21362.78542.57562.78562.78562.499
10161.64661.64643.14361.64661.64661.646
11161.64661.64643.14361.64661.64661.646
12161.64661.64643.14361.64661.64661.646
We give the selected feature names list for all datasets in Table S1 and present the mean performance of six prediction models on the datasets employed for the female/male dataset-based classification, with and without feature selection using five-fold stratified cross-validation in Supplementary Tables S2–S6. We assessed the performance of the different machine learning models using only LASSO FS or only mRMR FS methods for five GBM datasets. We observed that our feature selection and weighting methodology provided better results than using only one FS method.

2.3.2. Our Best Results of the Utilized Datasets

We constructed a generic table to show our best results for the feature selection tasks in this study. Table 6 presents the best accuracy rates in percentage, the number of all features, and the number of selected features for the datasets used. The table shows that the largest dimensionality reduction is obtained with the CPTAC-GBM proteomic dataset by reducing the number of features from 8828 to 5. The best ACC is yielded by utilizing our local proteomic preCRT-based dataset as the perfect classification. The minimum selected number of features (i.e., 3) is obtained from the TCGA-UCI glioma grading dataset for GBM patients. The lowest dimensionality reduction rate (i.e., from 59 to 13) is obtained with the CPTAC-GBM metabolomic dataset.

2.4. Clinical Results

We plotted clustergrams for each feature selection result in Figure 1, Figure 2, Figure 3, Figure 4 and Figure 5. Clustergrams are useful for grouping (i.e., hierarchical clustering) data based on similarity and visualizing those groupings. Clustergrams include a dendrogram and heatmap of the data. The colors and visual elements in a clustergram reveal key insights about the data structure. In clustergrams, colors usually represent the density or similarity of data points. Warm colors (reds and oranges) often indicate high density or similarity, while cool colors (blues and greens) suggest low density or similarity. The color scale helps illustrate how data points are distributed and their relative proximity. Clustergrams often consist of a dendrogram, a tree-like diagram that shows the sequence in which data points are grouped and how these groups are formed. By tracing the branches, we can identify which data points were grouped earlier and which were grouped later. The colors in the heatmap matrix represent the degree of similarity between two data points.
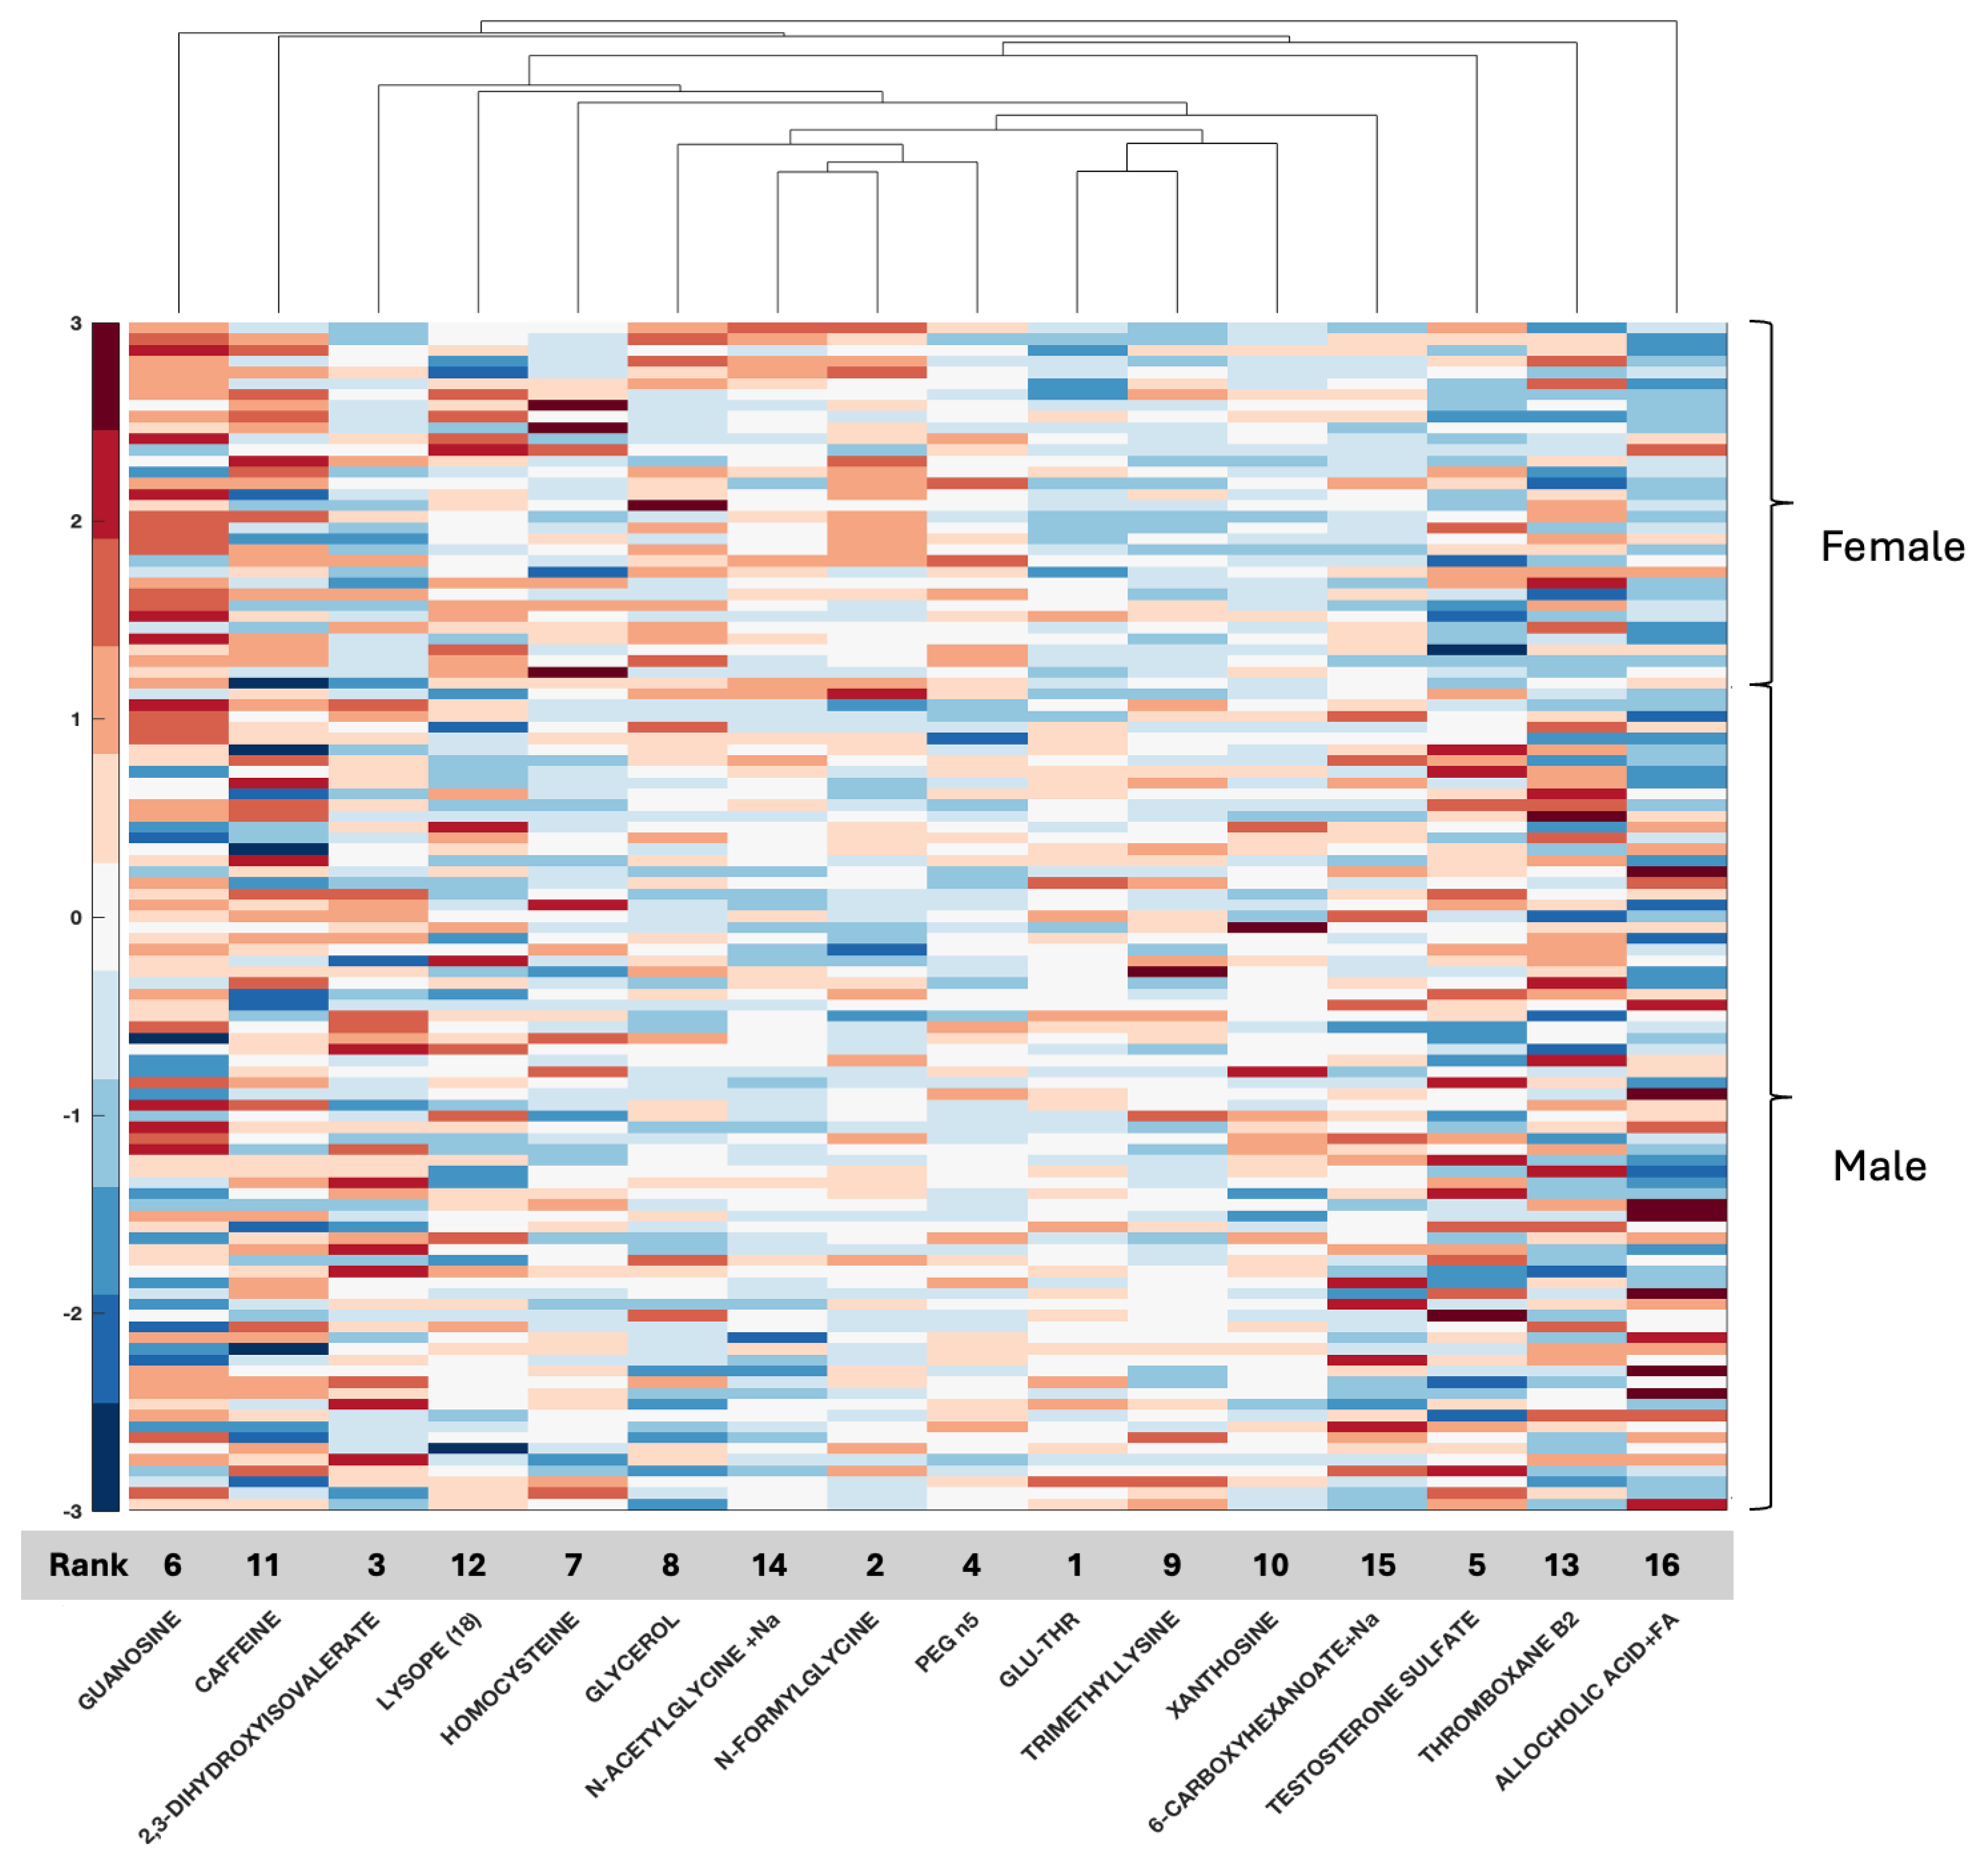
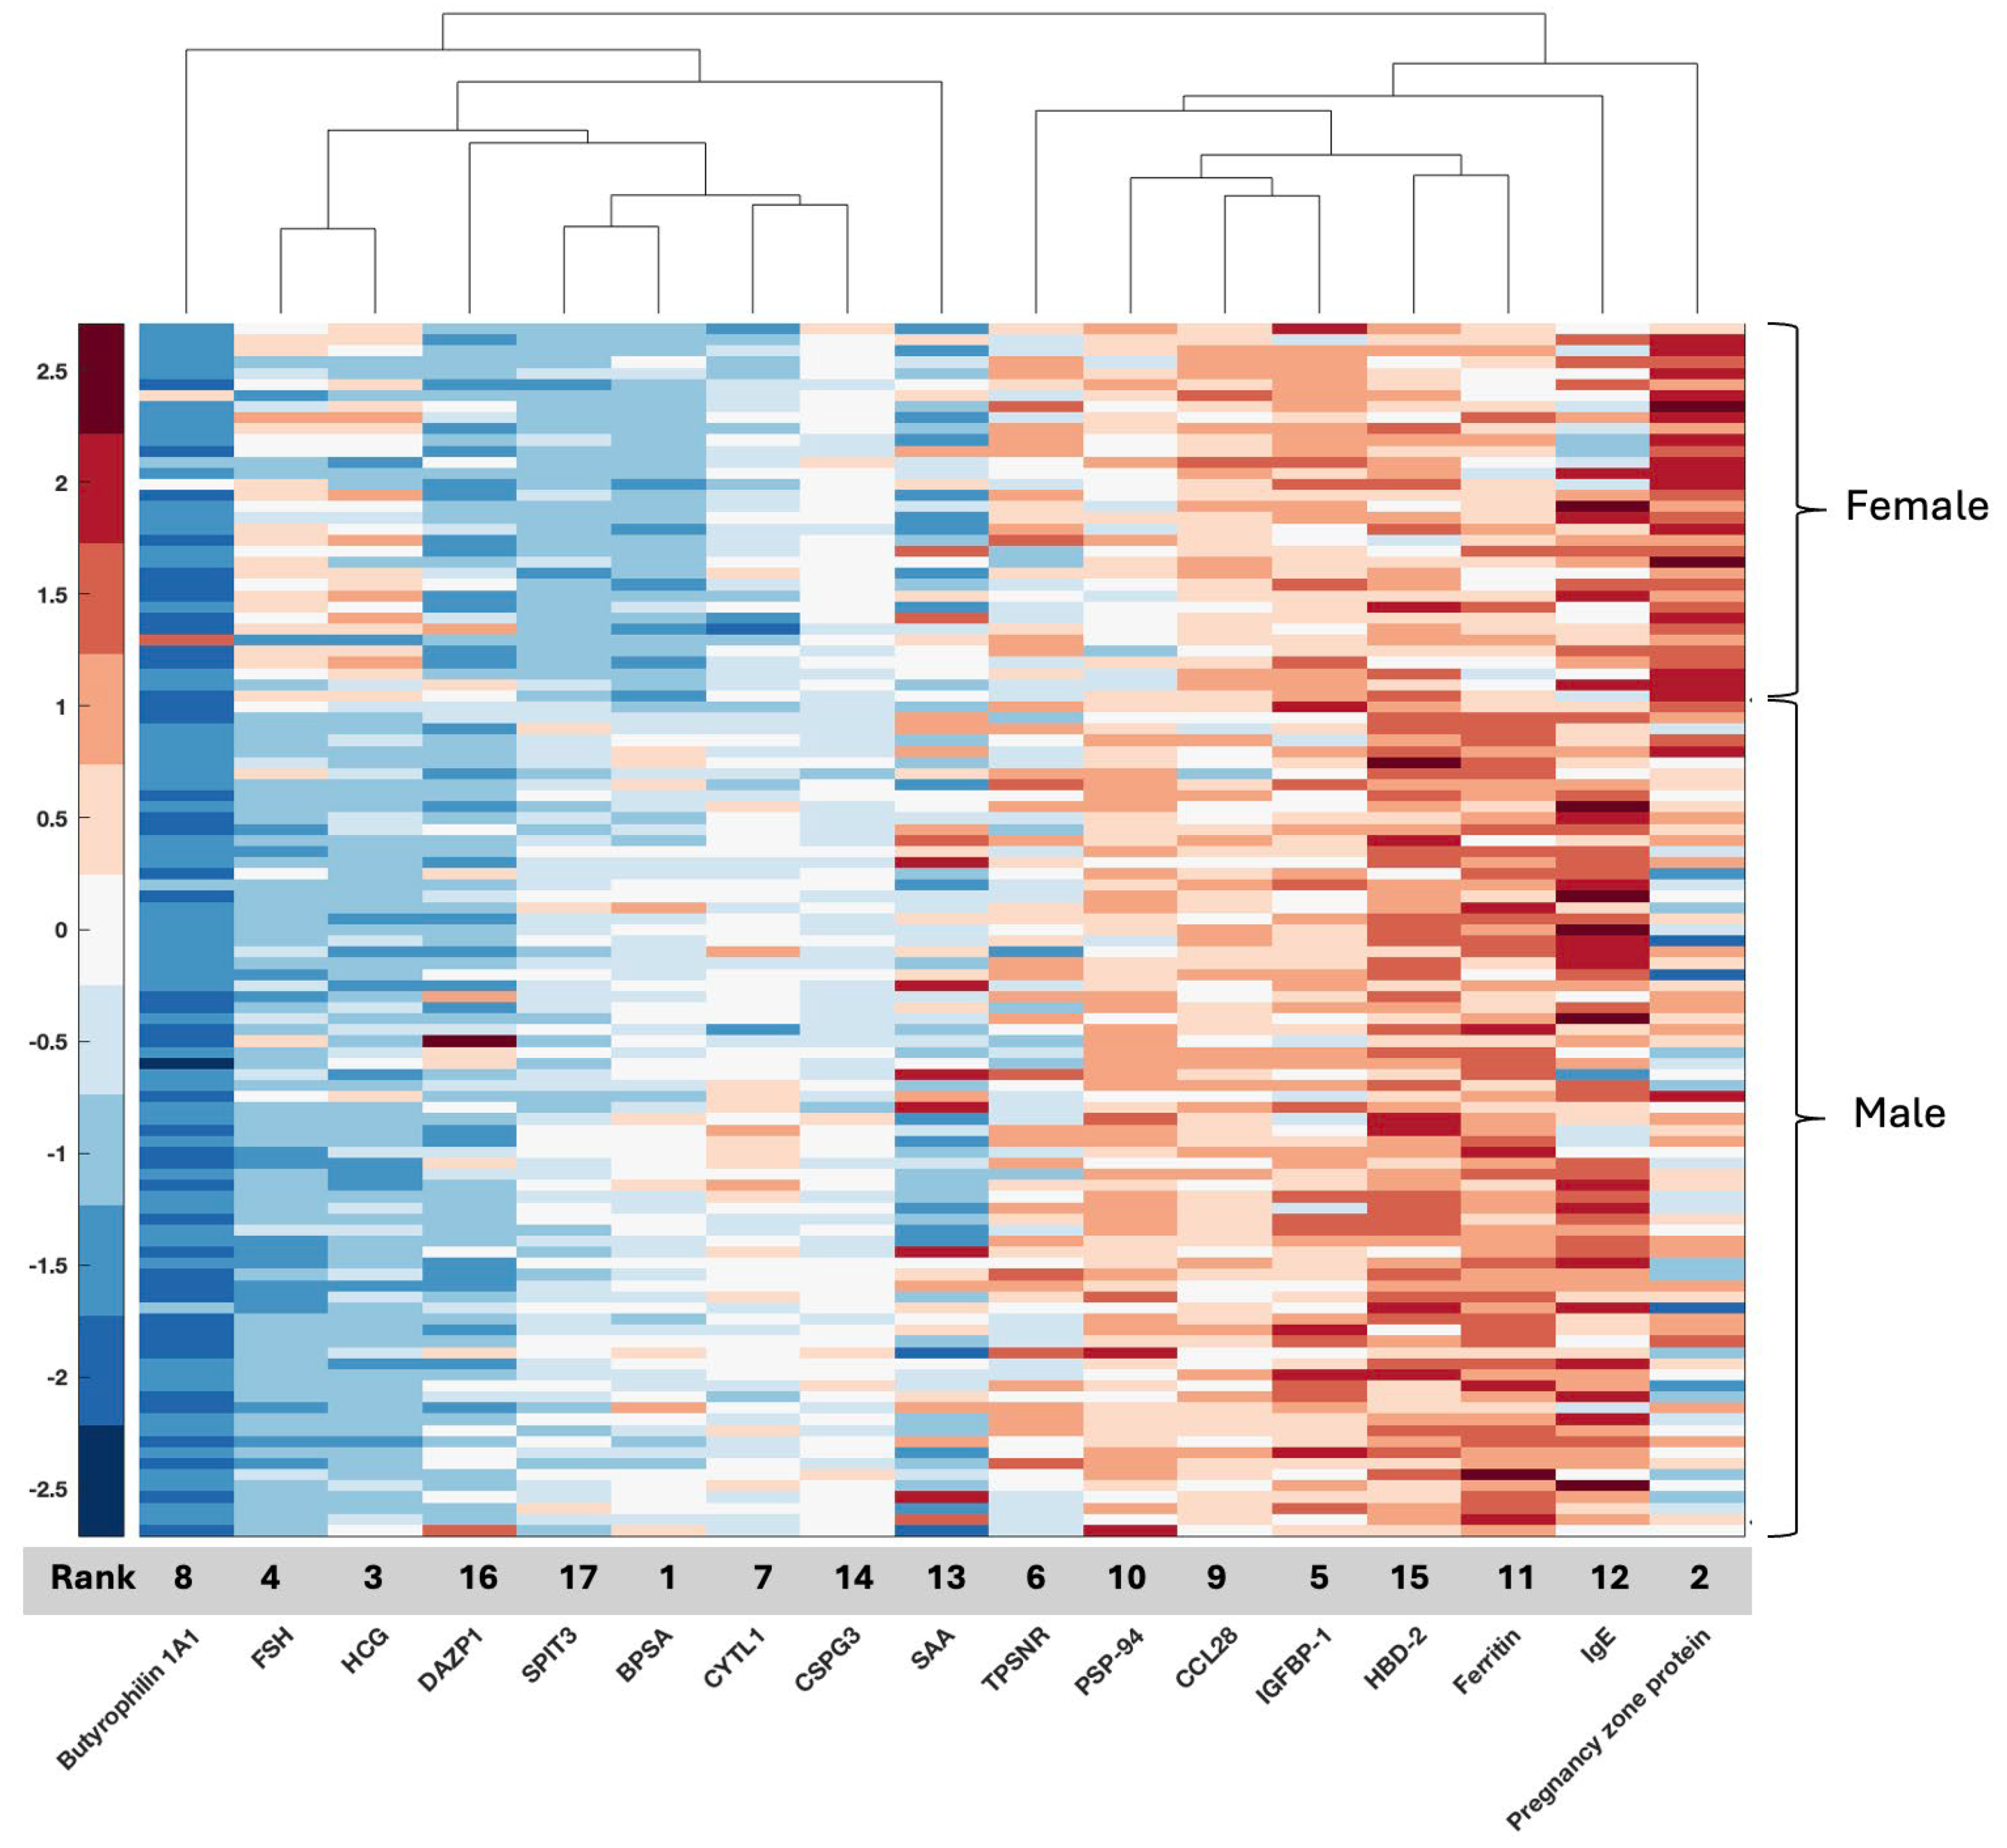
As can be shown in Figure 1, the most significant four features (96.3% ACC), namely, Benign Prostate-specific Antigen (BPSA), Pregnancy zone protein (PZP), Human Chorionic Gonadotropin (HCG), and Follicle-stimulating hormone (FSH), can have different values for males and females in our local proteomic dataset. It is observed that the BPSA heatmap value is around 0 in men and around −1 in women, and PZP in females has higher values than males. While the HCG and FSH heatmap values in females have positive values, it is observed that the values become negative for males. We also note the clustering of several markers. For example, two female-related sex hormones, FSH and HCG, exhibit high density in females and cluster together, while BPSA, a male marker, instead clusters with SPIT3 (Figure 1). HBD-2 and ferritin cluster together with lower values in females compared to males. CCL28 clusters with IGFBP-1, and then both cluster with PSP-94 (Figure 1).
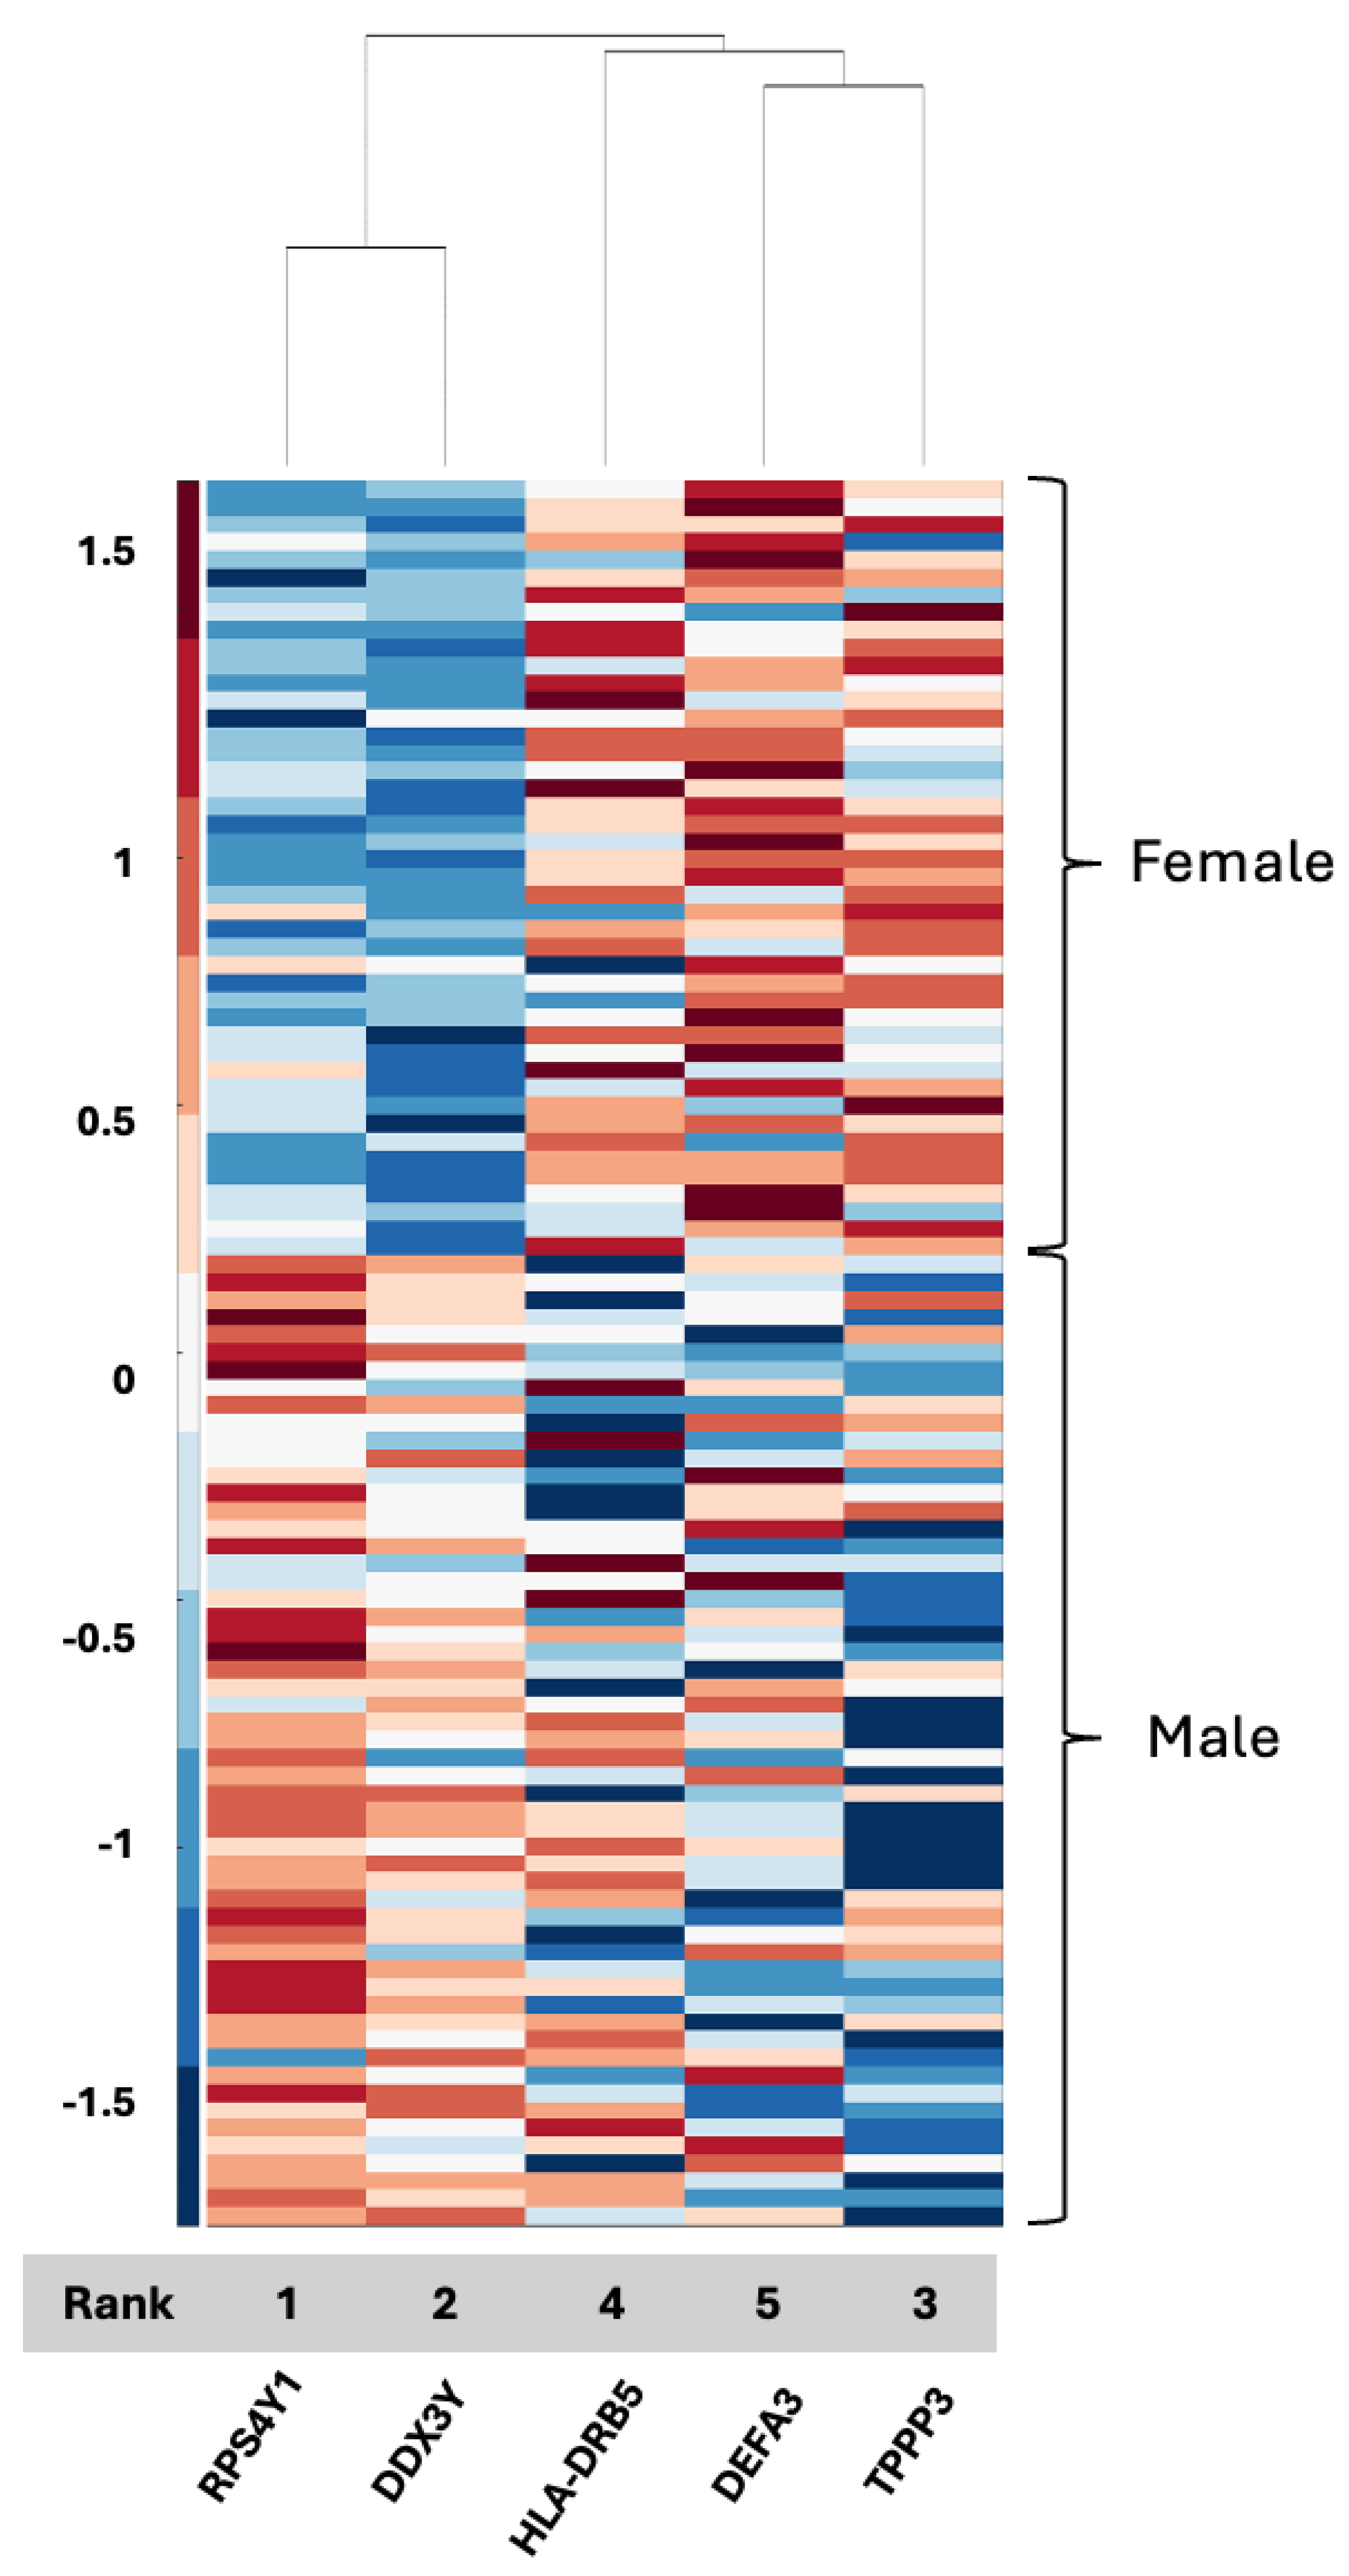
As can be seen in Figure 2, the most discriminative two proteomic features (97% ACC) for the CPTAC dataset are RPS4Y1 and DDX3Y. Both of these features have “Y” annotating their known association with the male sex, so they cluster together and exhibit positive values in males and negative values emerge in female GBM patients. DEFA3 and TPPP3 cluster together with higher values in females and also cluster with HLA-DRB5, which exhibits a more ambiguous pattern (Figure 2). Both the local set and the CPTAC set result in nearly perfect accuracy with the exception of PZP and two components of the denfensin family (HBD-2, also known as DEFB4A, in serum and DEFA3 in CPTAC). The signals that emerged as the most significant features are different between the local set (serum) and CPTAC (tissue).
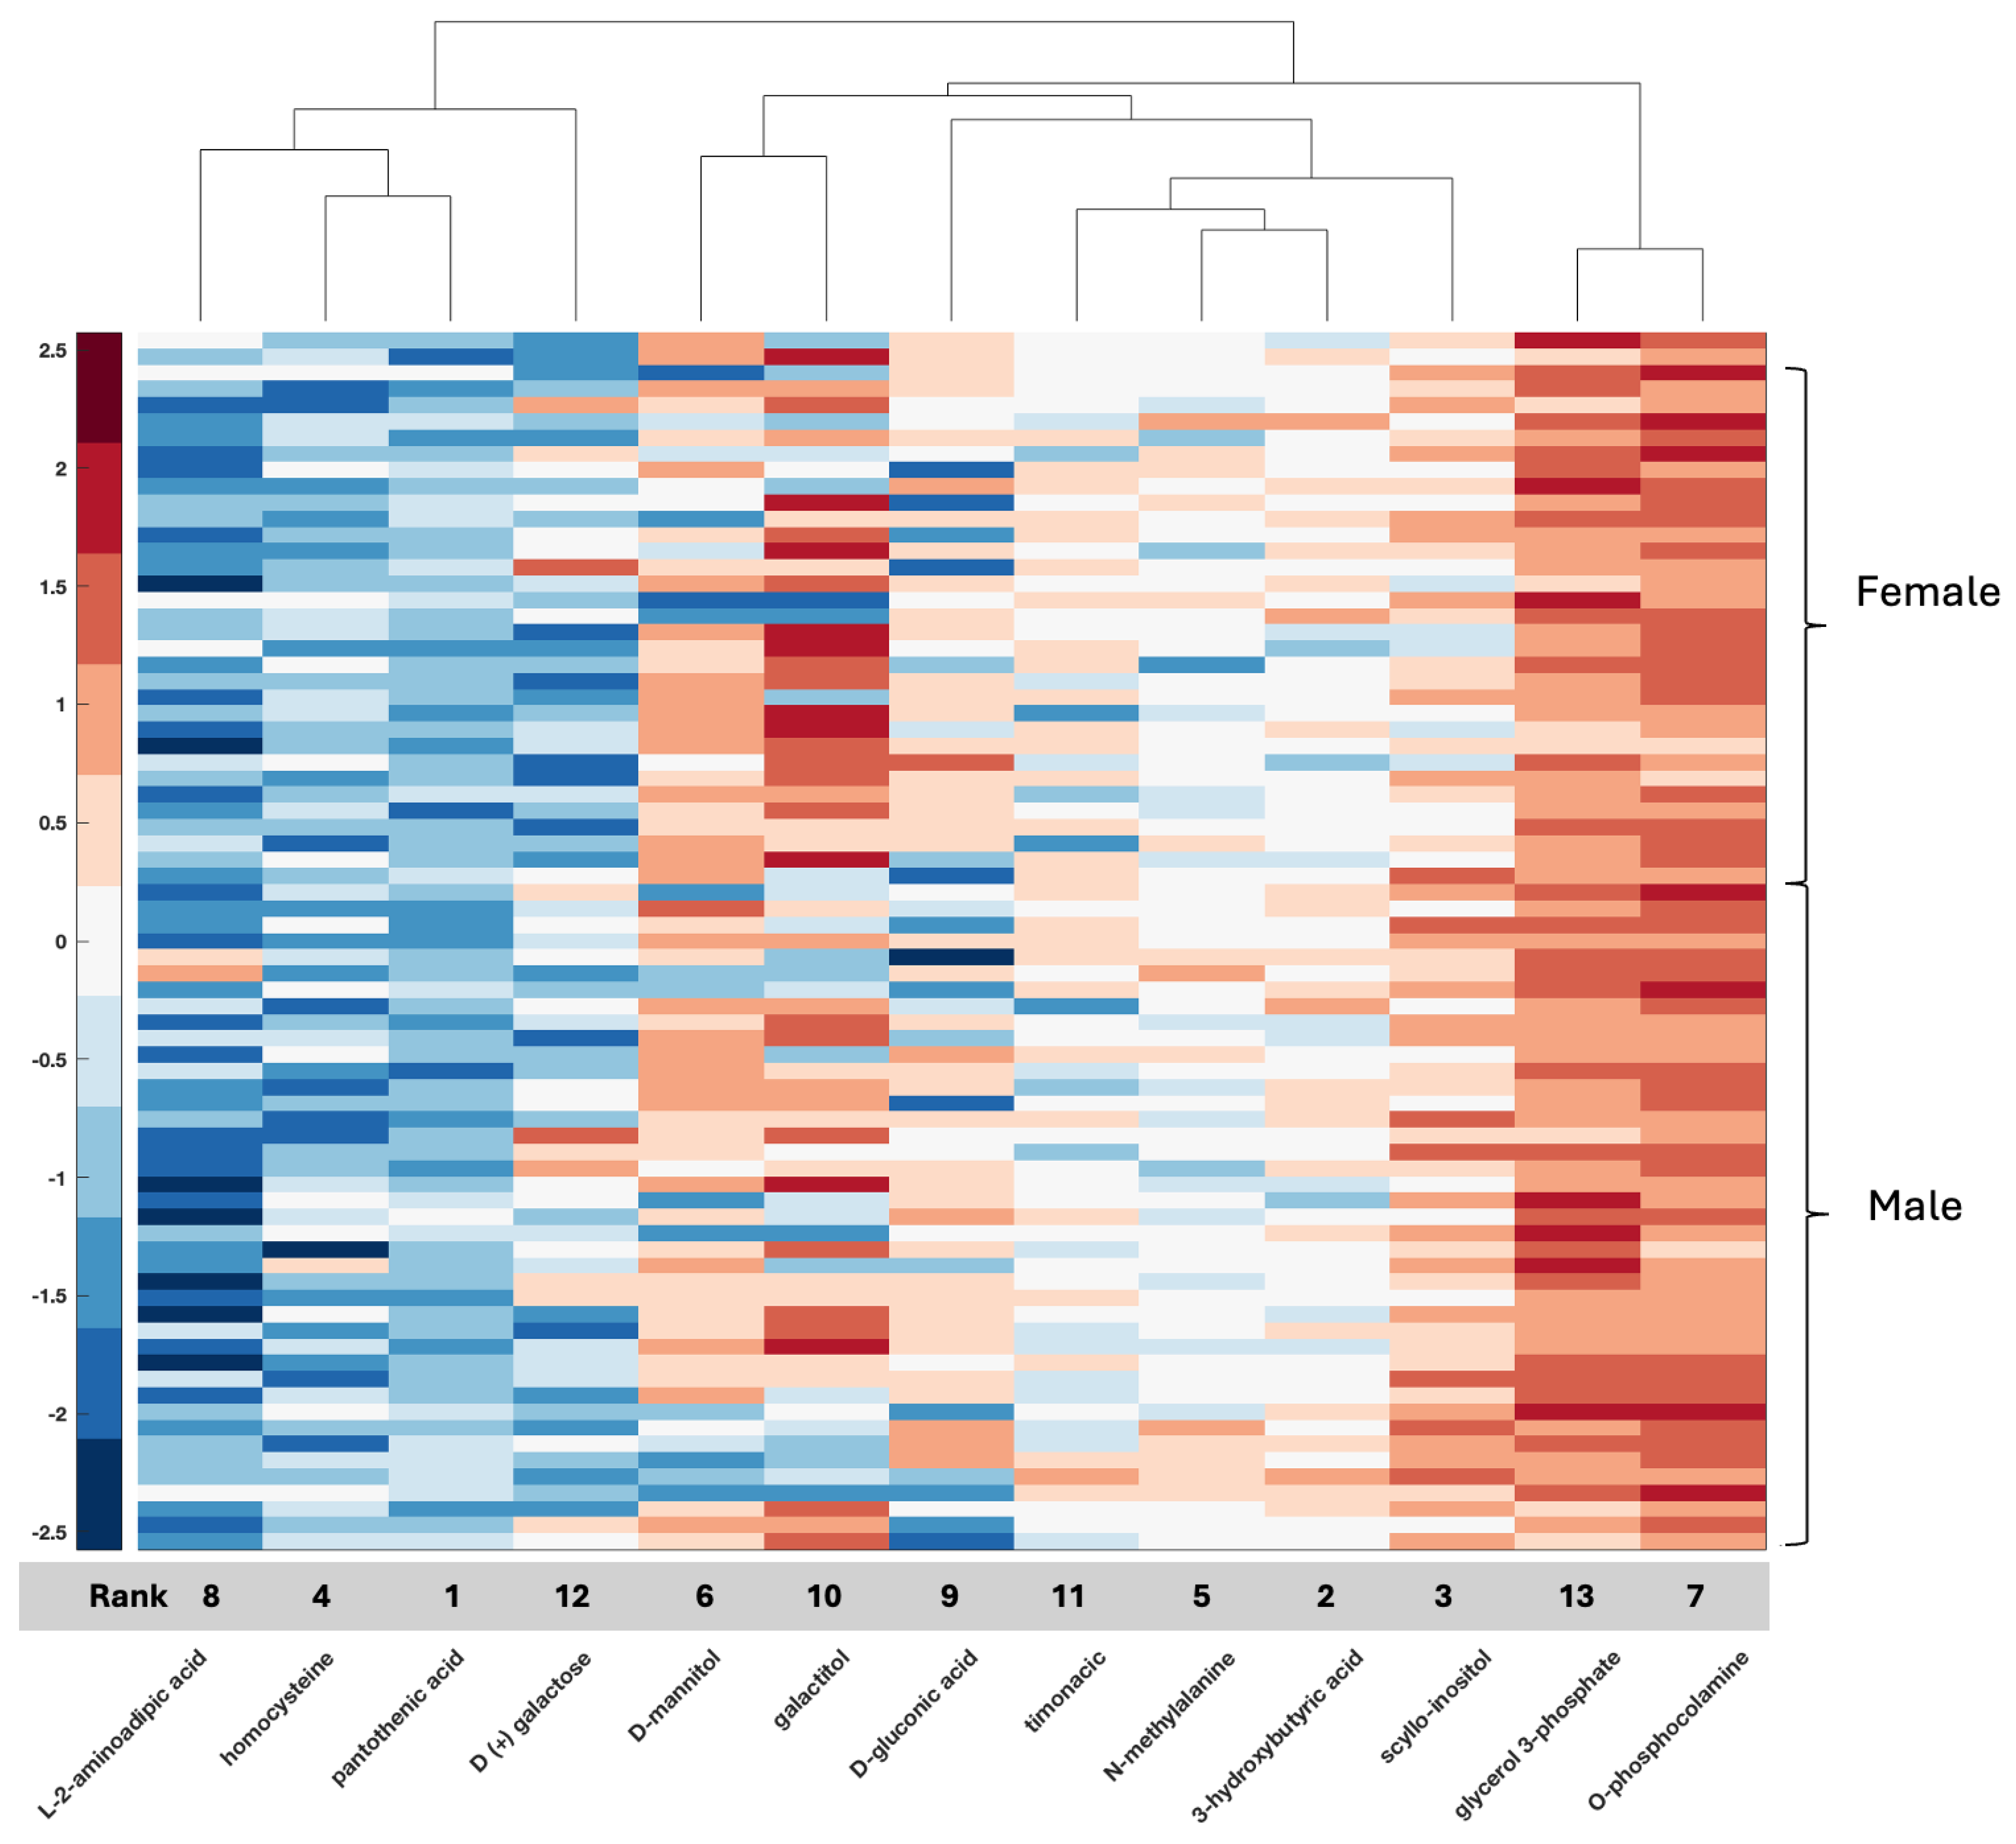
In the serum metabolomic data, the most significant two features (79.5% ACC) are obtained with GLU-THR and N-FORMYLGLYCINE for our local metabolomic dataset (Figure 3). While GLU-THR often has positive heatmap values in males with GBM, N-FORMYLGLYCINE has negative heatmap values in male GBM patients. The two most discriminative metabolomic features (60% ACC) are PANTOTHENIC ACID and 3-HYDROXYBUTYRIC ACID from the CPTAC metabolomic dataset (Figure 4). While PANTOTHENIC ACID heatmap data generally have a negative value in males or females, 3-HYDROXYBUTYRIC ACID has positive values or values around zero. The clustering of metabolic intermediates that share pathways (N-acetyl glycine and N-formylglycine, both elevated in females, and GLU-THR with TRYMETHYLYSINE, both decreased in females) also emerged (Figure 3). These metabolites are not present in the selected metabolic features in CPTAC. Two features were shared between the results in the two sets, HOMOCYSTEINE and PANTHOTHENIC ACID, although the latter did not make the list of top selected features that resulted in 92% accuracy in serum. In the CPTAC set, HOMOCYSTEINE and PANTHOTHENIC ACID cluster together, as do mannitol and galactitol, but differences between males and females are not as distinct in CPTAC tissue data, as evidenced by the 80% accuracy rate.
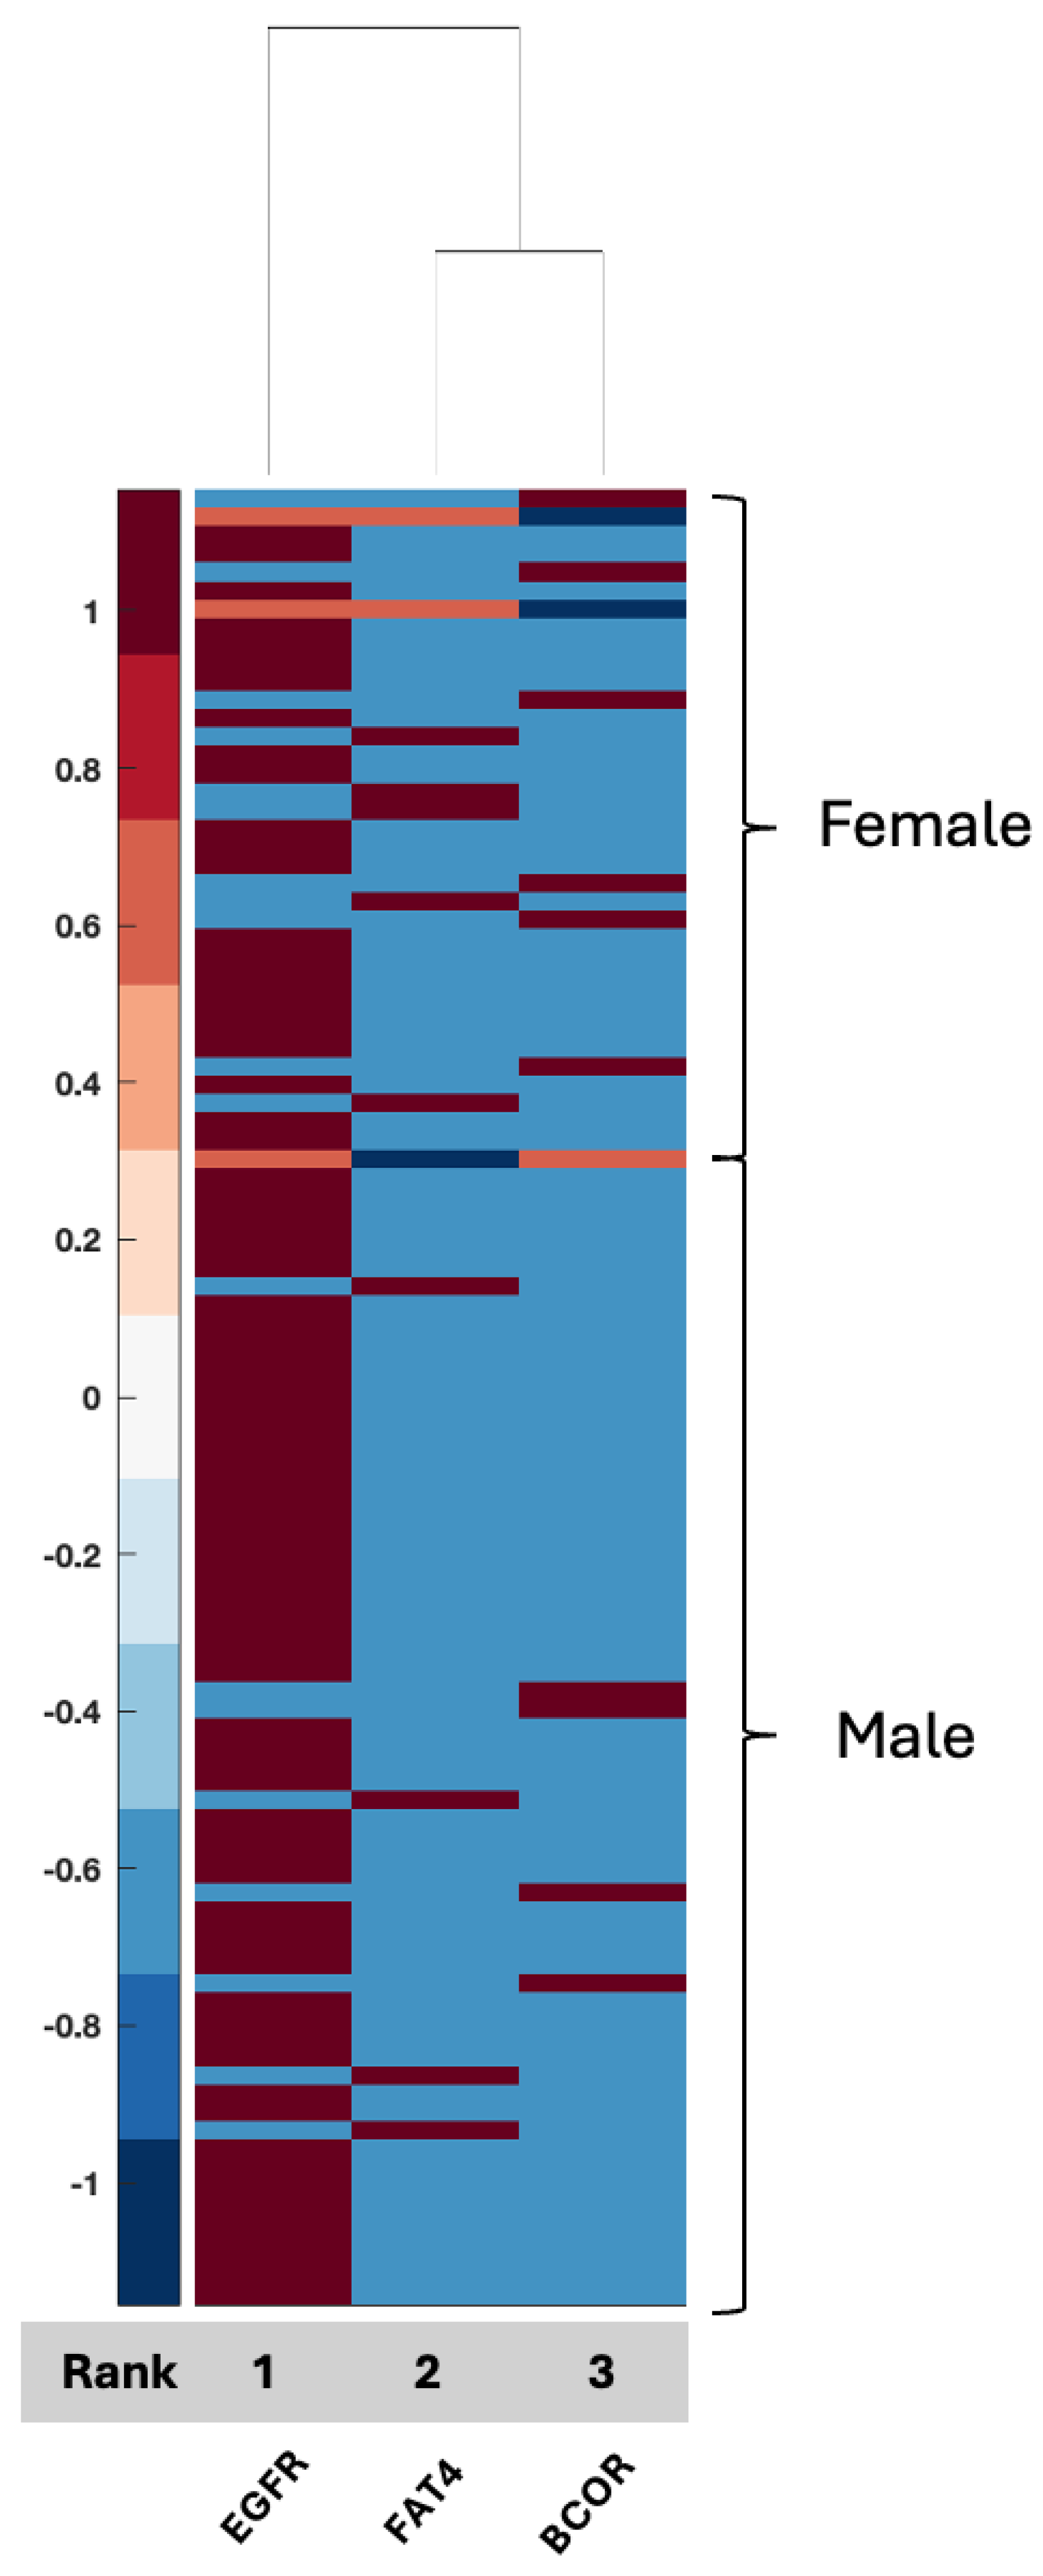
When employing the TCGA-UCI glioma grading dataset, the most discriminative and significant three features (63.6% ACC) are EGFR, FAT4, and BCOR. EGFR often has positive heatmap values for both men and women. However, FAT4 and BCOR often have negative heatmap values for both sexes (Figure 5). We can also say that heatmap values generally have lower or upper bound values as these mutation/molecular data contain only binary values. Additionally, as the highest ACC value is around 64%, it can be said that observing the differentiation in colors in males and females for the same molecules is difficult.
Figure 1. Clustergram for the selected features of the NCI NIH GBM proteomic dataset. Grey bar indicates the rank of the selected features from highest (1) to lowest (17) for the 17 selected features that were identified, resulting in a 100% accuracy rate.
Ijms 26 04339 g001
Figure 2. Clustergram for the selected features of the CPTAC proteomic dataset. Grey bar indicates the rank of the selected features from highest (1) to lowest (5) for the 5 selected features that were identified, resulting in a 99% accuracy rate.
Ijms 26 04339 g002
Figure 3. Clustergram for the selected features of the NCI NIH GBM serum metabolomic dataset. Grey bar indicates the rank of the selected features from highest (1) to lowest (16) for the 16 selected features that were identified, resulting in a 92% accuracy rate.
Ijms 26 04339 g003
Figure 4. Clustergram for the selected features of the CPTAC tissue metabolomic dataset. Grey bar indicates the rank of the selected features from highest (1) to lowest (13) for the 13 selected features that were identified, resulting in an 80% accuracy rate.
Ijms 26 04339 g004
Figure 5. Clustergram for the selected features of the TCGA (UCI shared) dataset. Grey bar indicates the rank of the selected features from highest (1) to lowest (3) for the 3 selected features that were identified, resulting in a 64% accuracy rate.
Ijms 26 04339 g005

3. Discussion

While several studies have described sex differences in GBM employing transcriptomic or tissue-level proteomic data, noninvasive biospecimen-derived data and biological sex differences profiles in GBM serum proteomic and metabolomic data are not currently available [1,6,9,11,23]. This paucity of data limits the ability to account for the impact of biological sex when interpreting emerging biomarkers in serum while also limiting our mechanistic understanding of observed outcome differences. In this study, we identified several hundred serum features associated with the male and female class labels in proteomic and metabolomic datasets. Using the local serum-based dataset, 17 features (100% ACC) and 16 features (92% ACC) were identified for the proteomic and metabolomic datasets, respectively, demonstrating that the serum in our cohort is a robust biospecimen of analysis for the identification of proteins associated with sex differences. Using the CPTAC tissue-based dataset (8828 proteomic and 59 metabolomic features), 5 features (99% ACC) and 13 features (80% ACC) were identified for the proteomic and metabolomic datasets, respectively. The proteomic data serum (local data) or tissue (CPTAC) achieved the highest accuracy rates (100% and 99%, respectively), followed by serum metabolome (92% and 80%) for the local set and CPTAC, respectively (Table 6).
The current GLIO-Select method allowed for the selection of serum proteomic features that can differentiate a sample originating from a female GBM patient from a male GBM patient in serum with 100% accuracy for proteomic features and 92% accuracy for metabolomic features. The identified proteomic features offer both internal and methodological validation since several are already described as being associated with sex differences specifically in serum, including benign prostatic specific antigen (BPSA) [24], pregnancy zone protein (PZP) [25], PSP-94 [26], and DAZP1 [27]. Additional roles in glioma have also emerged for proteins known to have an association with one sex compared to the other, including HCG [28], FSH [29], PZP [25,30], and ferritin [31] (Table 7). However, while existing data support several of the identified features as being associated more with one sex than the other, for example, PZP with the female sex and PSA with the male sex, there are females with low PZP and males with PSA as low as that measured in most females. Thus, per the existing literature, no one serum protein or metabolite is 100% associated with either sex. For example, HCG may be measured in both men and women but may have physiological (pregnancy) or pathological (testicular cancer) implications. It should also be noted that just because certain serum proteins have a classical association with biological sex, such as HCG, they may have an additional role in GBM that is either unrecognized or subject to evolving data. HCG has been associated with GBM and may represent a possible biomarker [32], being implicated in glioma cells’ redox homeostasis. Equally so, there is an emerging relationship between sex hormones and androgen levels and tumor aggressiveness in GBM, which may be reflected in the identification of PSA, FSH, and PSP-94 [29,33]. Some proteins, such as IGFBP-1 (associated with stemness and invasion) [34] and BTN1A1 (novel immune checkpoint exclusive to PDL-1) [35] may have a relationship with biological sex [36], but this is evolving. In contrast, others are already associated with glioma (TPSNR (HLA1 antigen processing protein) [37], IgE [38], SAA1 (potential prognostic marker) [39], NCAN (also known as CSPG3, glycosylated chondroitin sulfate proteoglycan implicated in the tumor microenvironment) [40], and SPIT3 [41], and, in our analysis, are also associated with biological sex (Figure 6). Interestingly, SPIT3 clustered with BPSA in the serum, raising the hypothesis that there may be mechanistic features between the male sex and tumor behavior in males that may link to stemness and treatment resistance. DEFB4A (a component of the defensin family associated with several malignancies) [42] was identified in serum, while DEFA3 was identified in tissue, with their roles in innate immunity and malignancy evolving. These proteins present an opportunity to identify potential mechanistic relationships that drive glioma proliferation and response differences between the sexes since they are, in some form, present and associated with sex in both biospecimens.
PZP was also identified in CPTAC tissue proteome in this analysis; however, it was not one of the five features that directly contributed to ACC of 99%.
The CPTAC tissue proteome data achieved an accuracy rate of 99% resulting in five features: RPS4Y1, DDX3Y, HLA-DRB5, DEFA3, and TPPP3. Two of the features, RPS4Y1 and DDX3Y, are already Y chromosome-associated, and HLA-DRB5 and TPPP3 have been reported as being associated with GBM [43,44] with respect to prognosis and the epithelial–mesenchymal transition, respectively, albeit not in serum biospecimens as of yet. In contrast, DEFA3, a member of the defensin family (Supplemental Table S1), has not been directly implicated in GBM or associated with sex differences specifically. Defensins, however, have been connected to cancer [42,45], and their identification in both serum (DEFB4A) and tissue (DEFA3) in association with GBM and biological sex could support previous data suggesting a relationship between innate immunity as a critical aspect of GBM propagation [46] and its contribution to differential outcomes between men and women in GBM. Defensins captured in serum biospecimens thus merit additional research as a possible biomarker and a key to sex differences and differential responses to management. A connection between TPPP3, DEFA3, and HLA-DRB5, as evidenced by the clustering observed in the current analysis (Figure 3), had not yet been described, and if it presents as a distinguishing signaling axis between men and women with GBM, this merits additional investigation as it links the epithelial–mesenchymal transition to tumor grade and prognosis and the innate immune system, with a clear link to biological sex in the GBM tissue proteome. We also observed limited overlap between proteins identified in serum and proteins identified in tissue, which may indicate that one biospecimen cannot serve as a validation of signals for the other, although far more data are needed in GBM using patient samples that have both serum and tissue for analysis.
With respect to metabolomic data, the relationship between compounds in serum or tissue and biological sex is less well defined, although data are emerging. Compounds such as serum testosterone were identified in this study, again providing validation of the biospecimen of origin given clinical information with known clinical applicability for measurement in serum and supporting the accuracy of the feature selection method. Additional compounds such as GLU-THR (glutamine threonine), homocysteine, glycerol, xanthosine, and thromboxane B2 have also been associated with glioma and documented as differentially measured between men and women, while others such as allocholic acid are evolving (Supplemental Table S7) [1,4,47,48,49,50,51]. These compounds, as well as several others, relate to amino acid synthesis [52] and purine metabolism, as well as fatty acid metabolism [53]. Two metabolomic features shared between serum and tissue were homocysteine and pantothenic acid; however, overall, fewer compounds for analysis were present in CPTAC than in our dataset, with only 59 features to work with. Overall, both purine metabolism and fatty acid metabolism have been reported as highly significant in GBM, with emerging relationships to tumor resistance [53,54,55], and the current analysis supports that, indeed, several compounds may be captured in the serum and tumor tissue of patients with GBM, leading to potential mechanistic relationships for further research. Blood homocysteine levels are related to primary brain tumors [56] and homocysteine is associated with biological sex differences [47]. In the present study, homocysteine ranked fourth in the CPTAC tissue data (ACC 80%) and seventh in the local serum (ACC 92%). Pantothenic acid or vitamin B5 has been associated with GBM, and in a recent study, it was one of several metabolites differentially expressed between core and edge tumor specimens in association with MGMT status [57]. In the present study, it was ranked feature number 1 in tissue (CPTAC); however, it was ranked far lower in serum, not even reaching the 16 top identified features in serum. Since it emerged as a feature in both datasets, it warrants further study regarding its relationship with biological sex differences with respect to GBM.
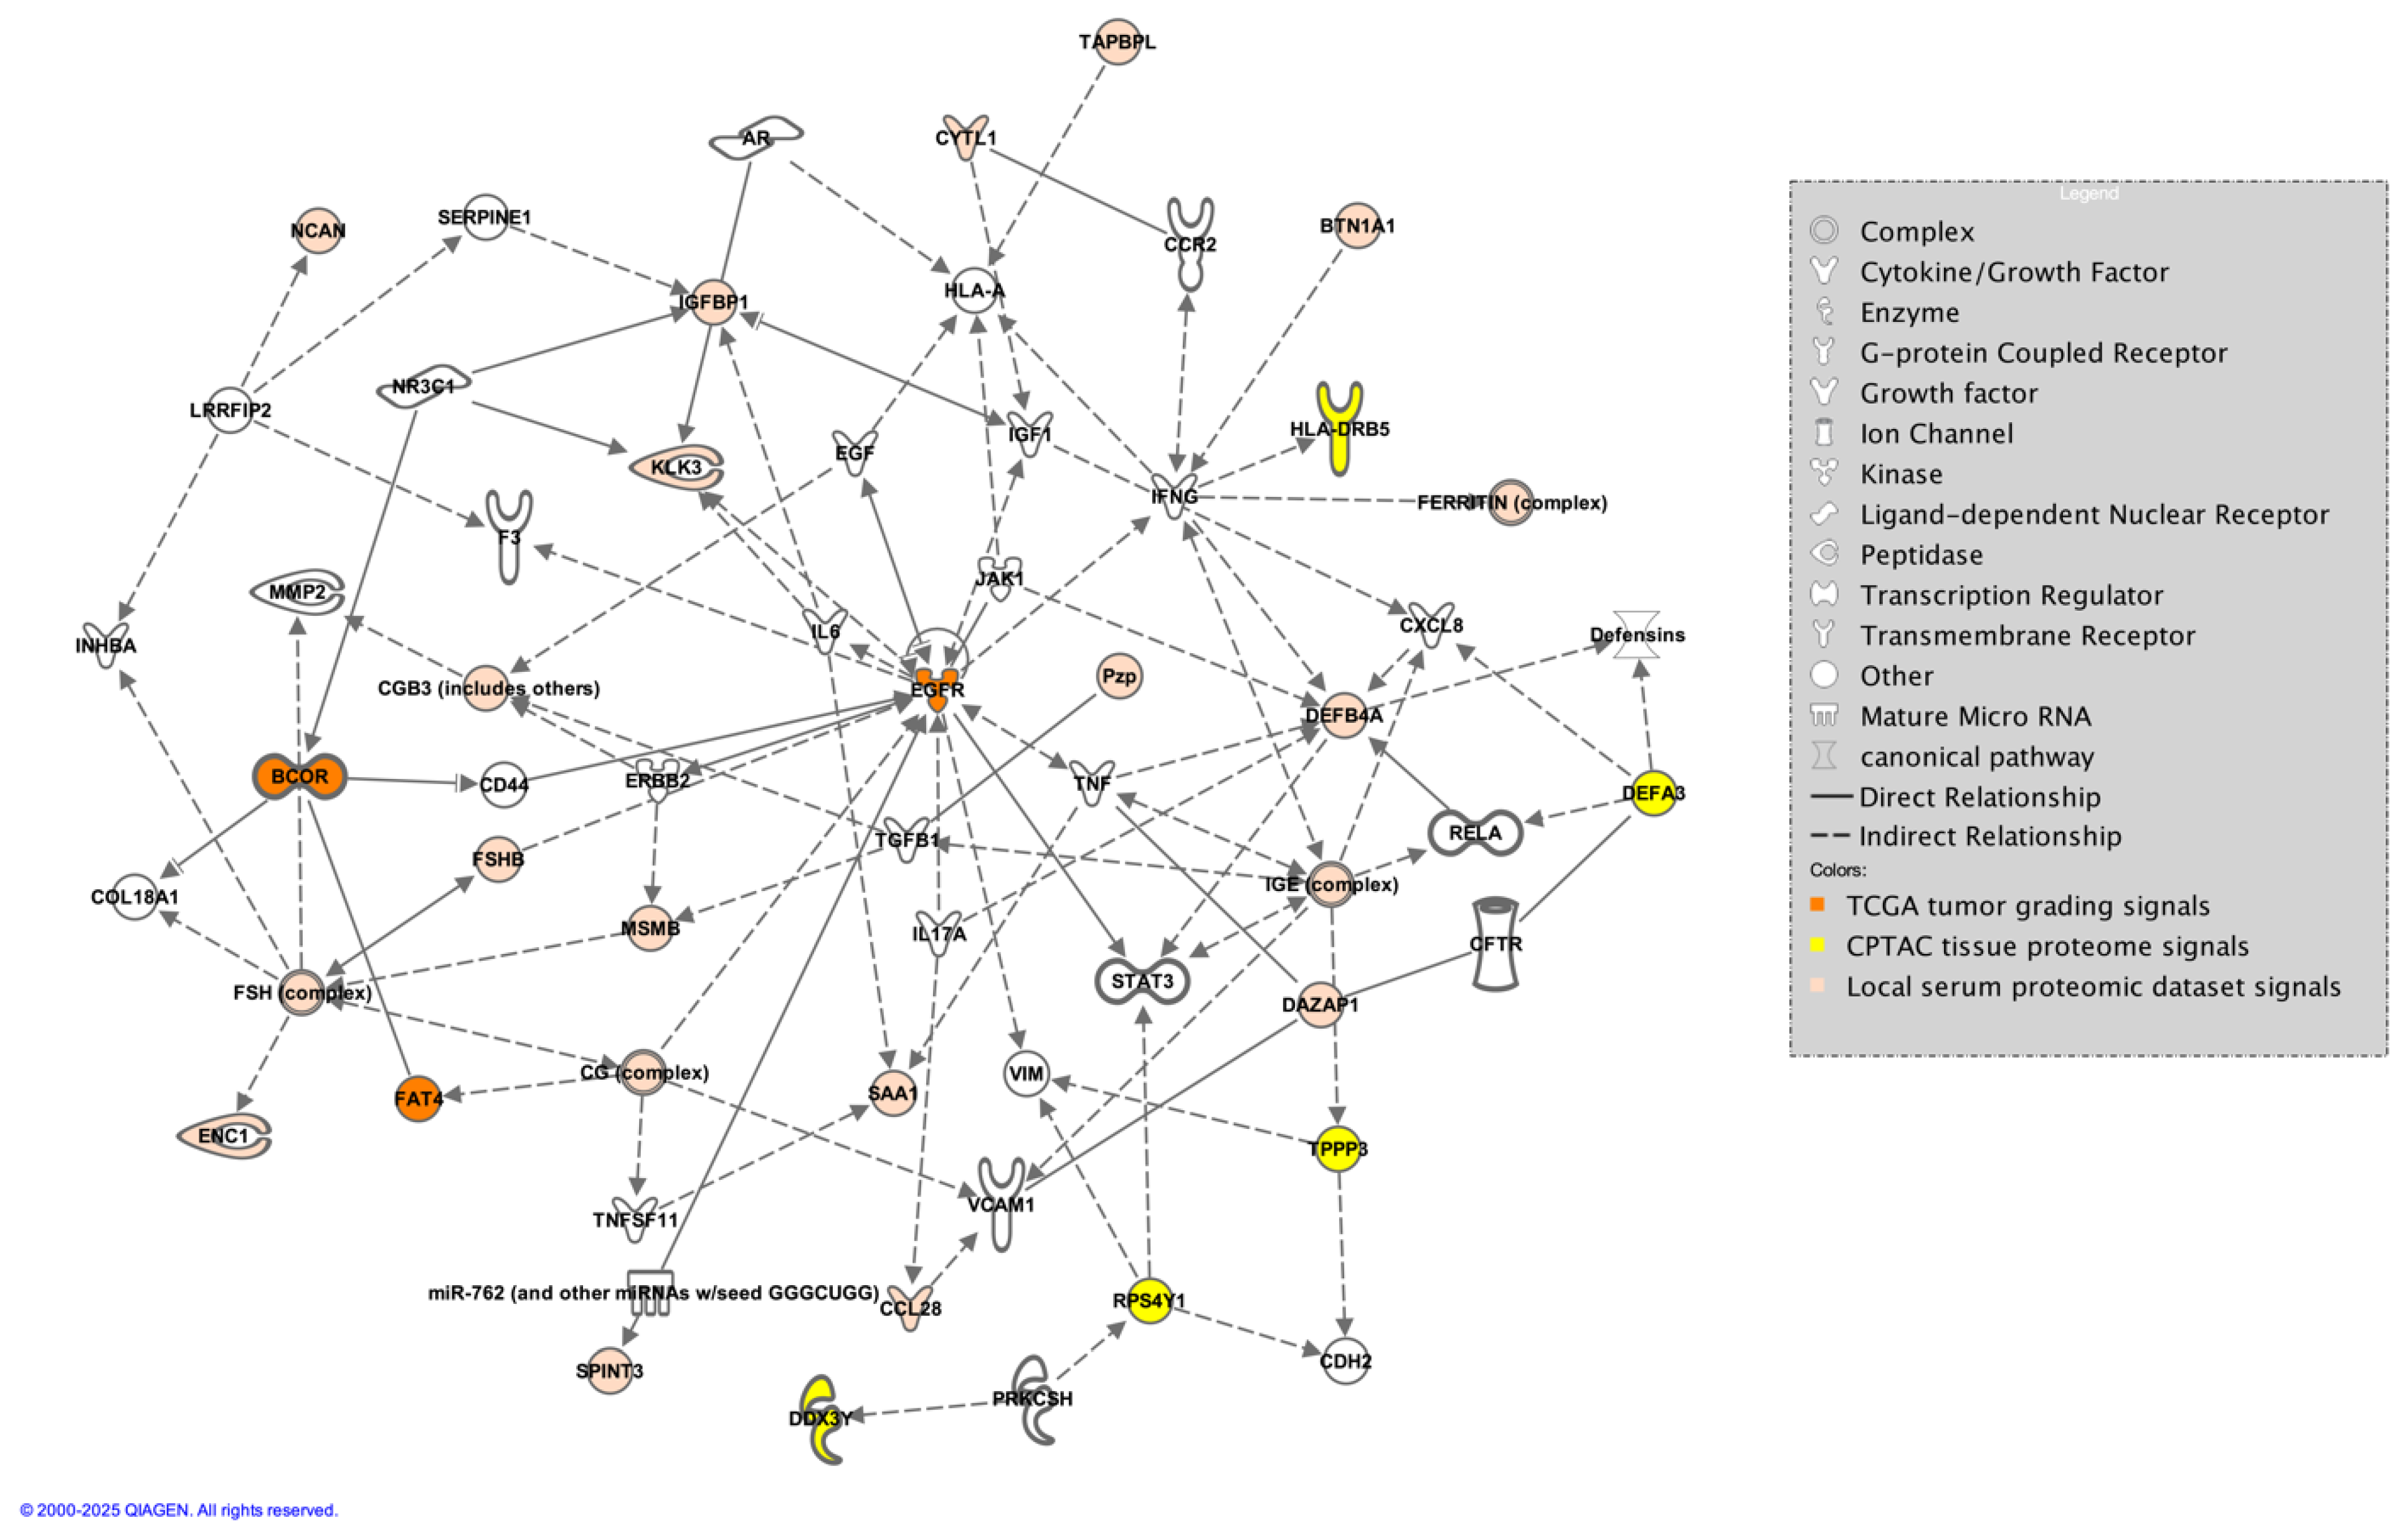
EGFR, FAT4, and BCOR were the three features associated with 64% ACC using the TCGA-UCI glioma grading set aimed at tumor grading [58]. The current analysis indicated that EGFR expression is differentially altered between men and women, with EGFR expression lower overall in women compared to men, which has been shown in other studies involving TCGA and other data [23]. FAT4 and BCOR, however, were overall higher in women as compared to men. Neither has been explored in their relationship with biological sex differences; however, FAT4 acts as a tumor-suppressor gene with typically lower expression in tumors [59], while BCOR (BCL6 corepressor gene) drives oncogenic transformation in neural cells [60]. BCOR has also been linked to glioma via BCOR-altered gliomas, a newly identified glioma with a potential response to fluorinated pyrimidines [61], indicating that glioma formation in women may occur via different pathways in women and men, resulting in differential tumor responses to chemotherapy. The relationship between the expression of these markers and sex differences is not well explored and the data are inconclusive. The current study illustrates potential relationships between well-known glioma drivers in males compared to females in GBM, some of which are better understood and studied; for example, the relationship between EGFR, BCOR, and FAT4 and connections to CD44 but with potential signaling via sex-related proteins such as HCG, as well as potential metabolic programming that may drive tumor behavior, e.g., via KLK3 (BPSA) and IGFBP1, which can connect to BCOR (Figure 7).
Figure 6. Proteins identified in serum have respective known relationships with biological sex and glioma, as well as novel signals with no direct or evolving relationships.
Ijms 26 04339 g006
Figure 7. Direct and indirect connections between proteins identified in the TCGA tumor grading dataset (orange), the CPTAC tissue proteomic dataset (yellow), and the local serum dataset (tan) generated by the authors in IPA [62].
Ijms 26 04339 g007
Our analyses can suggest that integrating LASSO with mRMR offers notable benefits compared to existing hybrid methods, such as enhanced classification performance or robustness. This highlights the effectiveness of our hybrid feature selection and weighting approach in managing high-dimensional data efficiently. Future studies will focus on refining and validating the proposed method using larger datasets and alternative hybrid techniques.
Our analysis focused on traditional machine learning methods, including SVM, KNN, Logistic Regression, AdaBoost, and Random Forest. Although modern techniques, such as deep neural networks, autoencoders, and transformer-based models, may offer benefits, these methods can introduce additional complexity and computational demands. Traditional approaches were chosen for their established utility in high-dimensional data with limited sample sizes, as well as their ease of interpretation. Future studies will explore integrating advanced techniques to compare their potential advantages with our current framework.
Some limitations of our study can be expressed as follows: The datasets used in our study do not include unaffected controls, which limits our ability to distinguish GBM-related features from those that may arise due to general variability unrelated to GBM. Future studies incorporating unaffected control data will be crucial for enhancing the specificity of identified features. While our feature selection analysis was aimed at identifying sex differences in GBM, it was conducted on combined datasets rather than separately for male and female groups. As another limitation of this study, we utilized two independent proteomic (or metabolomic) datasets to identify features associated with male/female GBM classification and feature selection. Although both datasets provided meaningful insights, the shared features between them were limited. This presented a challenge for implementing cross-dataset classification, which relies on consistent features across datasets for reliable evaluation. To address this, we concentrated on feature selection within each dataset, aiming to extract biologically relevant patterns unique to each one. Nonetheless, we recognize that cross-dataset classification could offer a more comprehensive assessment of the generalizability and robustness of our findings. Moving forward, future research can prioritize the inclusion of datasets with a higher degree of feature overlap or incorporate cross-dataset validation to reinforce our conclusions. Another limitation of this study is the lack of independent external validation, which is critical for assessing the generalizability of the model. The predictive model in this study was validated using stratified cross-validation as external validation was not possible due to the absence of datasets with the same specifications. This validation strategy ensures our results’ robustness within the available data’s constraints. Future work will aim to address this limitation by identifying or generating additional datasets to validate the findings externally.
Since a large number of classifier models, different datasets, five-fold stratified cross-validation technique, and different feature weighting values were tried and applied in this study, the implementation of the SHAP values in tree-based models or deep learning-based feature attribution methods would be associated with a significant increase in both time and processing power; it is, however, our intention to test these methods in future studies. While these advanced methods are recognized for both their capacity to capture complex nonlinear interactions and offer robust frameworks for feature selection, LASSO and mRMR were chosen for their well-established interpretability, computational efficiency, and suitability for high-dimensional omics datasets. Future work will address this limitation by comparing our approach with additional state-of-the-art techniques.
4. Materials and Methods

This section provides an overview and the key characteristics of our dataset employed. Subsequent subsections detail our methodological approach, including definitions, techniques, and prediction models utilized in this study.

4.1. Datasets

We employed a total of five proteomic, metabolomic, and molecular datasets from local or public data repositories to select the feature subset for the classification tasks in this study. The characteristics of the datasets employed are illustrated in Table 8.
The local proteomic preCRT-based dataset consists of NIH NCI ROB proteomic data of GBM patients with pre-chemoirradiation (CRT) status. This dataset is the format of log base two transformed regarding the preprocessing method and contains 109 cases with 74 males, 35 females, and 7289 proteomic features. The CPTAC (Clinical Proteomic Tumor Analysis Consortium)–GBM dataset is a nationwide initiative aimed at advancing the comprehension of cancer’s molecular underpinnings by leveraging extensive proteomic and genomic analyses, also known as proteogenomics [20]. The dataset includes different types of normalized GBM data, such as proteomic and metabolomic data. The local level one preCRT-based and normalized metabolomic dataset includes NIH NCI ROB metabolomic data from GBM patients who have not yet undergone chemoirradiation (CRT), adhering to confidence level one specification. The TCGA-UCI glioma grading dataset [21] for GBM patients includes only GBM patient data with 20 significant molecular features for 352 patients. These features can be not_mutated (i.e., 0) or mutated (i.e., 1) depending on their status.
Table 8. Proteomic, metabolomic, and molecular feature selection datasets utilized for the classification tasks.
DatasetPreprocessing# of Cases# of Males# of Females# of Features
Local Proteomic PreCRT-based DatasetLog Base 2 Transformed10974 (68%)35 (32%)7289
CPTAC-GBM Proteomic DatasetNormalized9955 (56%)44 (44%)8828
CPTAC-GBM Metabolomic DatasetNormalized7541 (55%)34 (45%)59
Local Level One PreCRT-based Metabolomic DatasetNormalized10773 (68%)34 (32%)318
TCGA-UCI Glioma Grading Dataset for GBMNo Preprocessing352217 (62%)135 (38%)20

4.2. Methodology

This section provides a general overview of our employed feature selection and weighting architecture, consisting of a brief description of underpinning methodologies.

4.2.1. Proposed Scheme

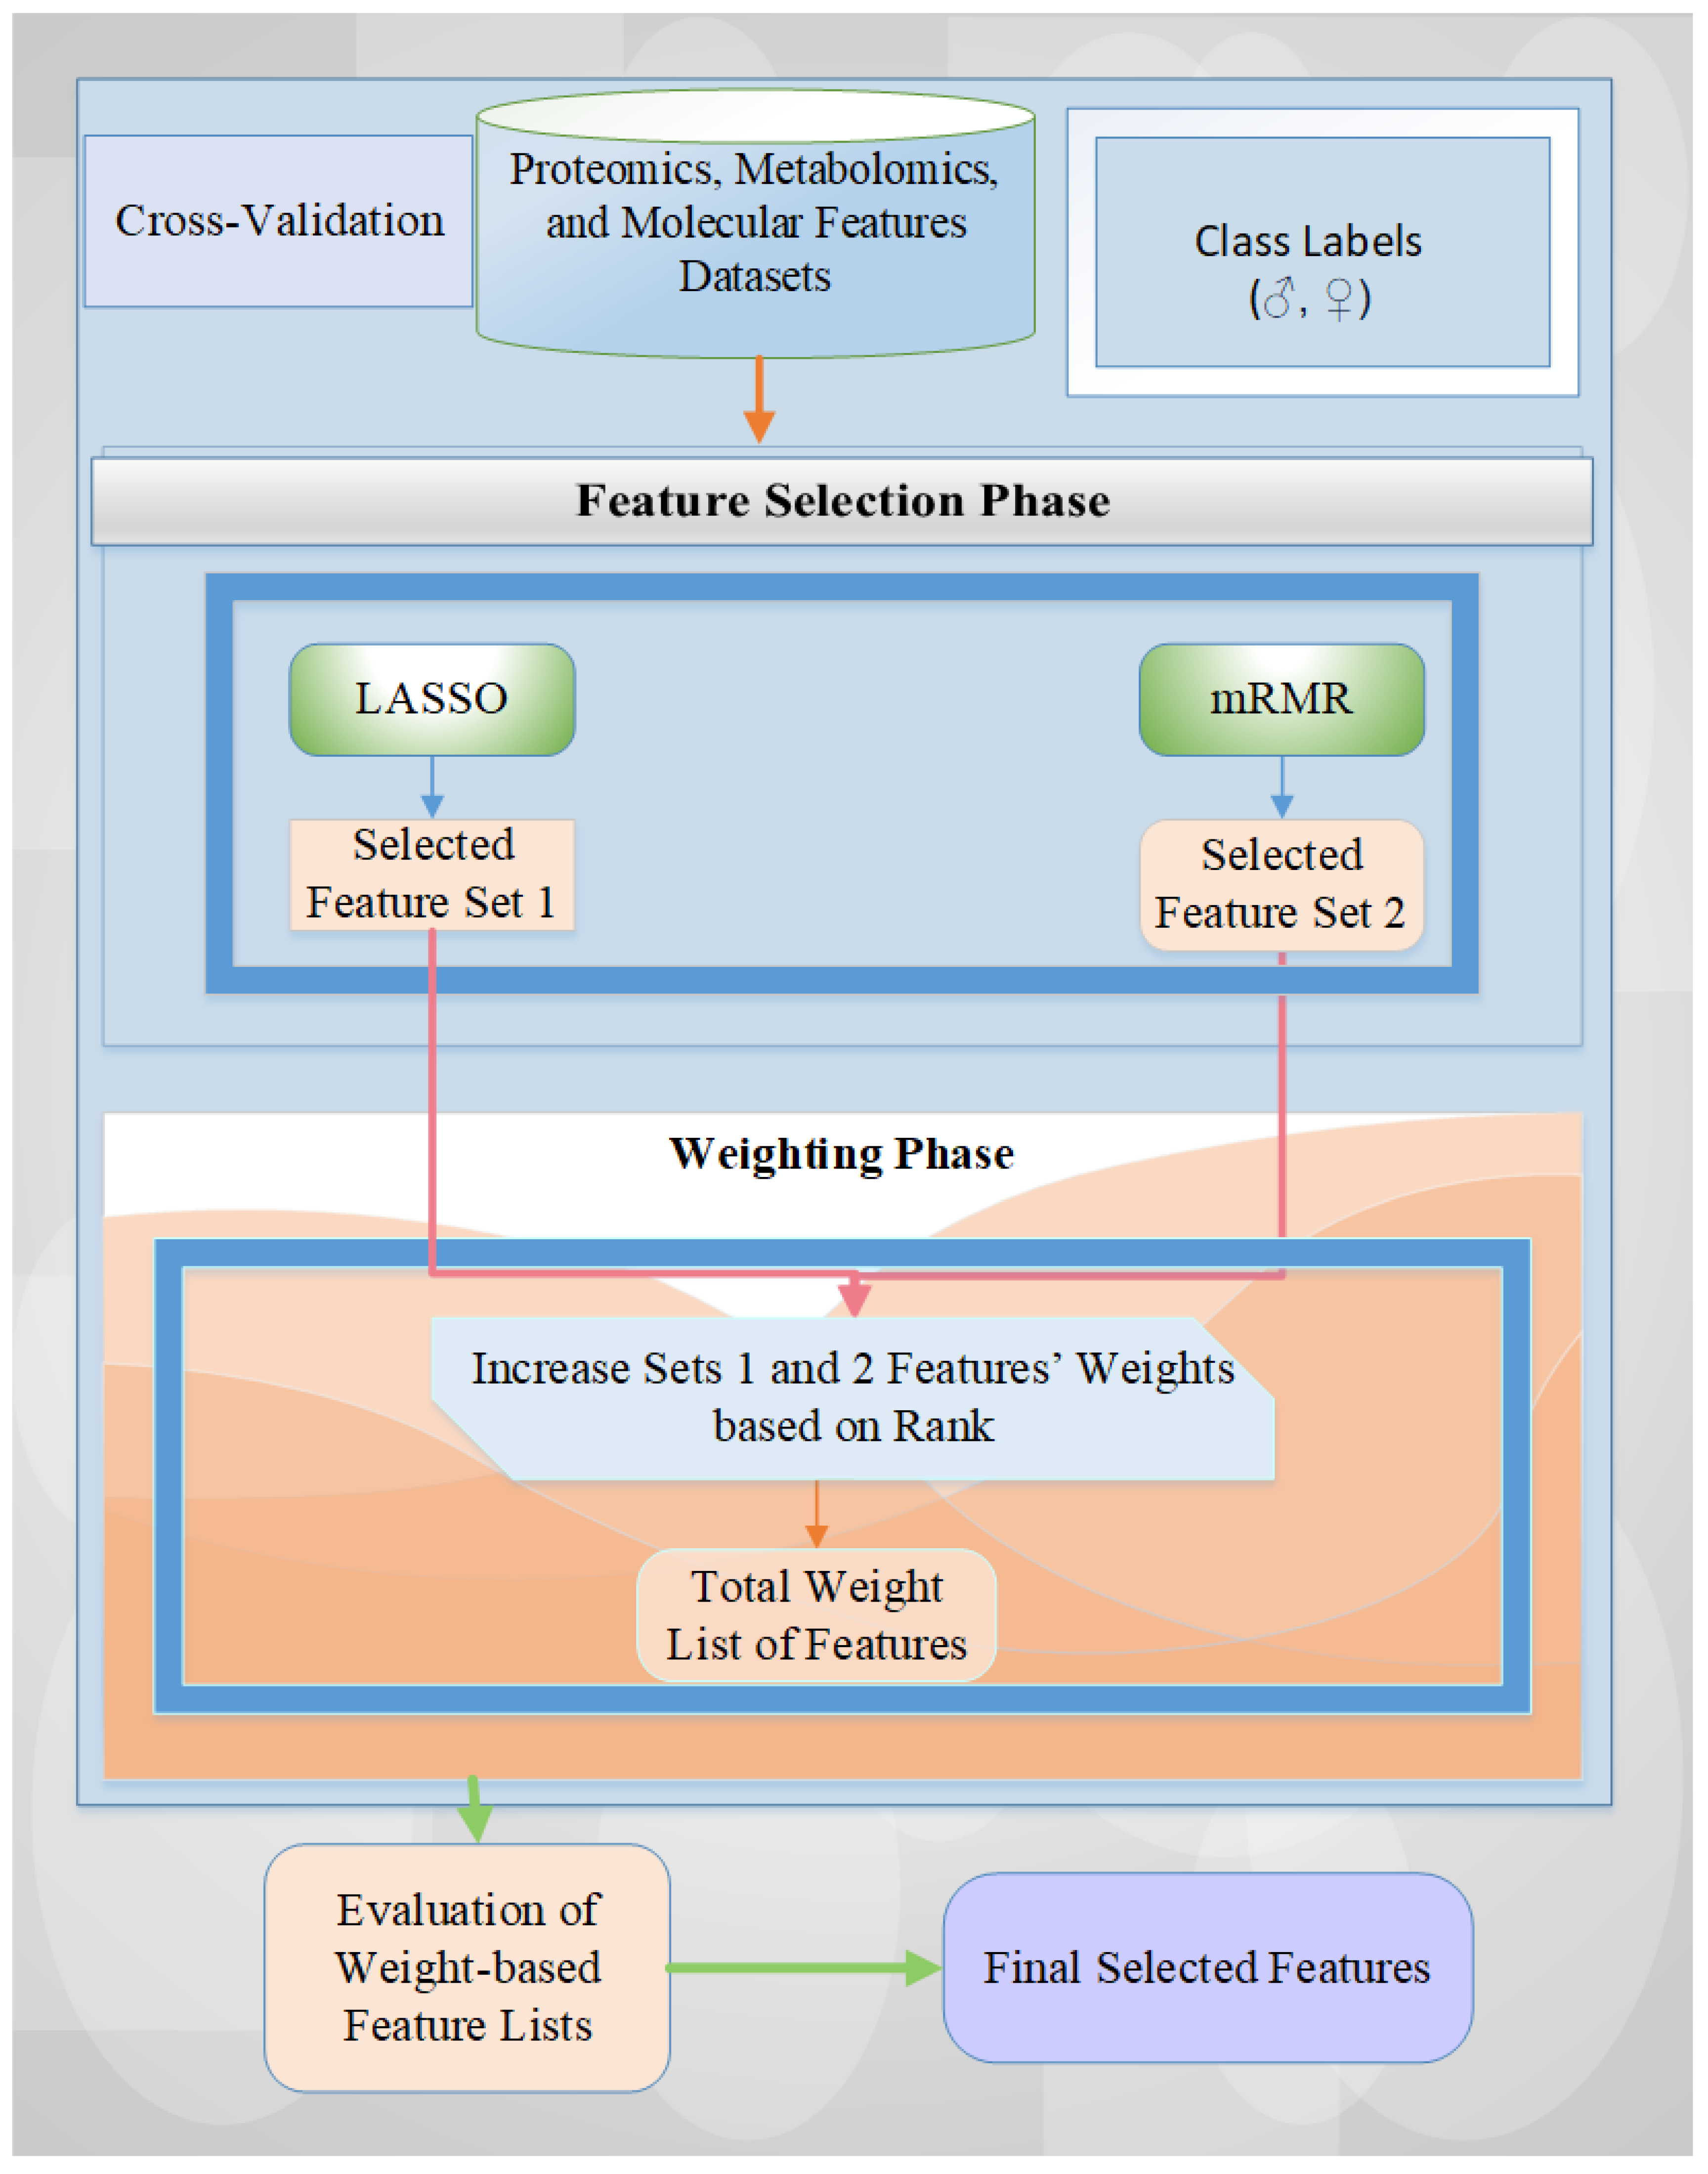
In this study, we adopted our previous methodology, MetaWise [16], with the same settings for feature selection tasks on five different GBM datasets that captured male and female as class labels for analysis. Our utilized scheme consists of two phases: (a) feature selection (FS) and (b) feature weighting (FW) [18,58,63]. These stages use the fusion of the two feature selection methods: Least Absolute Shrinkage and Selection Operator (LASSO) and Minimum Redundancy Maximum Relevance (mRMR). The detailed schematic diagram is illustrated in Figure 8.
First, all features are entered into the feature selection (FS) model using a cross-validation technique. For each fold, the feature sets selected by the two FS methods are saved into variables, and the selected feature counts are summed according to the weights provided by the rank-based approach (i.e., 2 or 1 for two FS methods). Then, the weight-based feature list is evaluated by using all weight values (i.e., features with higher weight values represent high importance levels). In the last phase, the final feature list is derived by examining all weight values and identifying those with the highest accuracy rate across six machine learning models: Support Vector Machine (SVM), K-Nearest Neighbors (KNN), Logistic Regression (LR), Random Forest (RF), Adaptive Boosting (AdaBoost), and voting-based ensemble learning model. The combined strategy of using LASSO and mRMR FS methods provides dimensionality reduction and contributes to decreasing feature redundancy with high-performance results by balancing feature relevance between the target and them. For an in-depth explanation of this methodology, please refer to Tasci et al. [16].
Figure 8. General overview of the utilized architecture for feature selection tasks.
Ijms 26 04339 g008

4.2.2. Feature Selection Methods

Feature selection is the process of selecting a subset of relevant and discriminative features for use in learning model construction. This step is crucial to improve the prediction model’s performance by eliminating redundant or irrelevant data, which can enhance the accuracy, speed, and interpretability of the model [19,64]. Feature selection methods can be categorized into three classes based on the evaluation criteria: filter, wrapper, and embedded methods [64]. Filter feature selection methods assess the relevance of features by examining metrics such as their statistical relationships with the target variable. They are independent of any machine learning algorithm and include techniques like correlation coefficients (e.g., mRMR). They are typically fast and computationally efficient but might ignore feature interactions. Wrapper feature selection methods evaluate the feature subset by training a model on different combinations of features and selecting the subset that yields the best performance. These methods are computationally expensive because they involve training multiple learning models. Embedded feature selection methods perform feature selection during the model training process (e.g., LASSO). Common methods consist of LASSO (Least Absolute Shrinkage and Selection Operator), which shrinks coefficients of less important features to zero, and mRMR (Minimum Redundancy Maximum Relevance), which selects features that have minimal redundancy among the features and maximum relevance to the target variable. These methods help in identifying the most significant feature subset that contributes to the predictive power of the learning model.

4.2.3. Feature Weighting Methods

To determine the relative importance of selected features in identifying patterns, weights were assigned based on their contribution to the classification operation in terms of their accuracy rate. A rank-based feature weighting scheme was applied for the LASSO and mRMR FS methods in this study. Their performance (i.e., accuracy rate) on each data fold was used to rank them. The top-performing method was given a weight of 2, while the other was assigned a weight of 1 for each fold. This process was repeated for all possible rank combinations to optimize feature weights for all the datasets [16]. In the final stage, all selected feature weights are summed and assessed to find the best-performing feature subset with the smallest number of features.

4.3. Classification

The classification stage involves training a machine learning model to categorize data into predefined classes or labels. Once the learning model is trained, the model can predict the class of new and unseen data based on the learned patterns. In our previous works [16,18], we provided a comprehensive overview of popular classification algorithms such as KNN, SVM, LR, AdaBoost, RF, and voting-based ensemble learning models. We employed a soft voting-based approach that predicts the class label based on the maximum of the sums of the predicted probabilities for five classification models [65].

5. Conclusions

This study (i.e., GLIO-Select) carries a fusion of the filter and embedded feature selection and weighting methodologies for feature selection tasks on five different GBM high-dimensional omics or molecular datasets that capture female and male as class labels. Six different machine-learning model performances are assessed regarding the accuracy rate with the different number of weights or selected features. Serum and tissue-based dataset results are also analyzed for feature selection operations. The critical importance level of the feature selection process regarding model performance improvement and reducing the computational complexity is also observed in detail for the dimensionality reduction operations. Overall, several signals emerged in the current analysis, which are known to be associated with glioma or GBM but were previously not known to be associated with biological sex, with several signals present in non-invasively derived biospecimen (serum). These findings require further validation and merit further scrutiny as potential therapies grounded in several critical signaling and metabolic pathways; notably, amino acid and fatty acid metabolism may have differential expression between men and women and result in different therapeutic responses. The ability to detect serum proteins and metabolites that are different between women and men provides encouragement that noninvasive biospecimen collection may provide biomarkers that can effectively eventually lead to more personalized management in GBM. Several novel signals that were previously not linked to either biological sex or glioma also emerged in the analysis and may relate to mechanistic insights for differential tumor responses between the sexes, especially those that link mechanistically to both tissue and genomic data.
By focusing on the most relevant and discriminative features, researchers can build more accurate and efficient models and aid in early diagnosis, prognosis, and personalized treatment of GBM. The feature selection process can also mitigate the curse of dimensionality and improve the generalizability of learning models. Ongoing advancements and research in this area are likely to significantly enhance patient outcomes and make substantial contributions to the broader field of cancer research regarding biomarker discovery or personalized treatments.

Supplementary Materials

The following supporting information can be downloaded at: https://www.mdpi.com/article/10.3390/ijms26094339/s1.

Author Contributions

E.T., conceptualization, data curation, methodology, software, investigation, writing—original draft preparation, visualization, review and editing; S.C., data curation, review and editing; Y.Z., data curation, review and editing; L.Z., data curation, review and editing; T.C.Z., data curation; M.S., data curation, review and editing; M.M., data curation, review and editing; K.C., supervision, funding acquisition; A.V.K., conceptualization, investigation, supervision, project administration, funding acquisition, writing—original draft preparation, visualization, review and editing. All authors have read and agreed to the published version of the manuscript.

Funding

Funding was provided in part by the NCI NIH intramural program (ZID BC 010990).

Institutional Review Board Statement

NCI NIH IRB-approved protocol 04-C-0020 was provided.

Informed Consent Statement

Obtained on the protocol.

Data Availability Statement

We have attached the organized CPTAC proteomic, metabolomic, and TCGA-UCI Glioma Grading for GBM datasets. De-identified data, including clinical data associated with our local omics dataset, will be shared once analyses for outcomes are complete.

Acknowledgments

Palantir Foundry was used to integrate, harmonize, and analyze data inside the secure NIH Integrated Data Analysis Platform (NIDAP).

Conflicts of Interest

The authors declare that they have no conflicts of interest.

Abbreviations

ACCAccuracy
AdaBoostAdaptive Boosting
CPTACClinical Proteomic Tumor Analysis Consortium
CRTChemoirradiation
FSFeature Selection
FWFeature Weighting
GBMGlioblastoma Multiforme
KNNK Nearest Neighbors
IPAIngenuity Pathway Analysis
LASSOLeast Absolute Shrinkage and Selection Operator
LRLogistic Regression
MRMRMinimum Redundancy—Maximum Relevance
NCINational Cancer Institute
NIDAPNIH Integrated Data Analysis Platform
NIHNational Institutes of Health
RFRandom Forest
ROBRadiation Oncology Branch
RTRadiation Therapy
SECIMSoutheast Center for Integrated Metabolomics
SVMSupport Vector Machine
TMZTemozolomide

References

  1. Carrano, A.; Juarez, J.J.; Incontri, D.; Ibarra, A.; Guerrero Cazares, H. Sex-Specific Differences in Glioblastoma. Cells 2021, 10, 1783. [Google Scholar] [CrossRef]
  2. Massey, S.C.; Whitmire, P.; Doyle, T.E.; Ippolito, J.E.; Mrugala, M.M.; Hu, L.S.; Canoll, P.; Anderson, A.R.A.; Wilson, M.A.; Fitzpatrick, S.M.; et al. Sex differences in health and disease: A review of biological sex differences relevant to cancer with a spotlight on glioma. Cancer Lett. 2021, 498, 178–187. [Google Scholar] [CrossRef] [PubMed]
  3. Ippolito, J.E.; Yim, A.K.; Luo, J.; Chinnaiyan, P.; Rubin, J.B. Sexual dimorphism in glioma glycolysis underlies sex differences in survival. JCI Insight 2017, 2, e92142. [Google Scholar] [CrossRef] [PubMed]
  4. Sponagel, J.; Jones, J.K.; Frankfater, C.; Zhang, S.; Tung, O.; Cho, K.; Tinkum, K.L.; Gass, H.; Nunez, E.; Spitz, D.R.; et al. Sex differences in brain tumor glutamine metabolism reveal sex-specific vulnerabilities to treatment. Med 2022, 3, 792–811.e12. [Google Scholar] [CrossRef] [PubMed]
  5. Yang, W.; Warrington, N.M.; Taylor, S.J.; Whitmire, P.; Carrasco, E.; Singleton, K.W.; Wu, N.; Lathia, J.D.; Berens, M.E.; Kim, A.H.; et al. Sex differences in GBM revealed by analysis of patient imaging, transcriptome, and survival data. Sci. Transl. Med. 2019, 11, eaao5253. [Google Scholar] [CrossRef]
  6. Jovanovich, N.; Habib, A.; Chilukuri, A.; Hameed, N.U.F.; Deng, H.; Shanahan, R.; Head, J.R.; Zinn, P.O. Sex-specific molecular differences in glioblastoma: Assessing the clinical significance of genetic variants. Front. Oncol. 2023, 13, 1340386. [Google Scholar] [CrossRef]
  7. Lee, J.; Kay, K.; Troike, K.; Ahluwalia, M.S.; Lathia, J.D. Sex Differences in Glioblastoma Immunotherapy Response. Neuromolecular Med. 2022, 24, 50–55. [Google Scholar] [CrossRef]
  8. Lee, J.; Troike, K.; Fodor, R.; Lathia, J.D. Unexplored Functions of Sex Hormones in Glioblastoma Cancer Stem Cells. Endocrinology 2022, 163, bqac002. [Google Scholar] [CrossRef]
  9. Shireman, J.M.; Ammanuel, S.; Eickhoff, J.C.; Dey, M. Sexual dimorphism of the immune system predicts clinical outcomes in glioblastoma immunotherapy: A systematic review and meta-analysis. Neuro-Oncol. Adv. 2022, 4, vdac082. [Google Scholar] [CrossRef]
  10. Tavelin, B.; Malmstrom, A. Sex Differences in Glioblastoma-Findings from the Swedish National Quality Registry for Primary Brain Tumors between 1999-2018. J. Clin. Med. 2022, 11, 486. [Google Scholar] [CrossRef]
  11. Garcia, C.A.; Bhargav, A.G.; Brooks, M.; Suarez-Meade, P.; Mondal, S.K.; Zarco, N.; ReFaey, K.; Jentoft, M.; Middlebrooks, E.H.; Snuderl, M.; et al. Functional Characterization of Brain Tumor-Initiating Cells and Establishment of GBM Preclinical Models that Incorporate Heterogeneity, Therapy, and Sex Differences. Mol. Cancer Ther. 2021, 20, 2585–2597. [Google Scholar] [CrossRef] [PubMed]
  12. Zhou, J.; Guo, H.; Liu, L.; Hao, S.; Guo, Z.; Zhang, F.; Gao, Y.; Wang, Z.; Zhang, W. Construction of co-expression modules related to survival by WGCNA and identification of potential prognostic biomarkers in glioblastoma. J. Cell Mol. Med. 2021, 25, 1633–1644. [Google Scholar] [CrossRef] [PubMed]
  13. Linhares, P.; Carvalho, B.; Vaz, R.; Costa, B.M. Glioblastoma: Is There Any Blood Biomarker with True Clinical Relevance? Int. J. Mol. Sci. 2020, 21, 5809. [Google Scholar] [CrossRef]
  14. Diaz Rosario, M.; Kaur, H.; Tasci, E.; Shankavaram, U.; Sproull, M.; Zhuge, Y.; Camphausen, K.; Krauze, A. The Next Frontier in Health Disparities—A Closer Look at Exploring Sex Differences in Glioma Data and Omics Analysis, from Bench to Bedside and Back. Biomolecules 2022, 12, 1203. [Google Scholar] [CrossRef]
  15. Krauze, A.V.; Sierk, M.; Nguyen, T.; Chen, Q.; Yan, C.; Hu, Y.; Jiang, W.; Tasci, E.; Zgela, T.C.; Sproull, M.; et al. Glioblastoma survival is associated with distinct proteomic alteration signatures post chemoirradiation in a large-scale proteomic panel. Front. Oncol. 2023, 13, 1127645. [Google Scholar] [CrossRef]
  16. Tasci, E.; Popa, M.; Zhuge, Y.; Chappidi, S.; Zhang, L.; Zgela, T.C.; Sproull, M.; Mackey, M.; Kates, H.R.; Garrett, T.J. MetaWise: Combined Feature Selection and Weighting Method to Link the Serum Metabolome to Treatment Response and Survival in Glioblastoma. Int. J. Mol. Sci. 2024, 25, 10965. [Google Scholar] [CrossRef]
  17. mRMR Feature Selection. Available online: https://github.com/smazzanti/mrmr (accessed on 17 February 2023).
  18. Tasci, E.; Shah, Y.; Jagasia, S.; Zhuge, Y.; Shephard, J.; Johnson, M.O.; Elemento, O.; Joyce, T.; Chappidi, S.; Cooley Zgela, T. MGMT ProFWise: Unlocking a New Application for Combined Feature Selection and the Rank-Based Weighting Method to Link MGMT Methylation Status to Serum Protein Expression in Patients with Glioblastoma. Int. J. Mol. Sci. 2024, 25, 4082. [Google Scholar] [CrossRef]
  19. Tasci, E.; Zhuge, Y.; Kaur, H.; Camphausen, K.; Krauze, A.V. Hierarchical Voting-Based Feature Selection and Ensemble Learning Model Scheme for Glioma Grading with Clinical and Molecular Characteristics. Int. J. Mol. Sci. 2022, 23, 14155. [Google Scholar] [CrossRef]
  20. Wang, L.-B.; Karpova, A.; Gritsenko, M.A.; Kyle, J.E.; Cao, S.; Li, Y.; Rykunov, D.; Colaprico, A.; Rothstein, J.H.; Hong, R. Proteogenomic and metabolomic characterization of human glioblastoma. Cancer Cell 2021, 39, 509–528.e20. [Google Scholar] [CrossRef]
  21. Tasci, E.; Zhuge, Y.; Camphausen, K.; Krauze, A.V. Glioma Grading Clinical and Mutation Features Dataset. 2022. Available online: https://doi.org/10.24432/C5R62J (accessed on 5 December 2024).
  22. Fawcett, T. An introduction to ROC analysis. Pattern Recognit. Lett. 2006, 27, 861–874. [Google Scholar] [CrossRef]
  23. Jang, B.; Yoon, D.; Lee, J.Y.; Kim, J.; Hong, J.; Koo, H.; Sa, J.K. Integrative multi-omics characterization reveals sex differences in glioblastoma. Biol. Sex Differ. 2024, 15, 23. [Google Scholar] [CrossRef] [PubMed]
  24. Linton, H.J.; Marks, L.S.; Millar, L.S.; Knott, C.L.; Rittenhouse, H.G.; Mikolajczyk, S.D. Benign prostate-specific antigen (BPSA) in serum is increased in benign prostate disease. Clin. Chem. 2003, 49, 253–259. [Google Scholar] [CrossRef]
  25. Yang, J.; Fang, W.; Wu, W.; Tian, Z.; Gao, R.; Yu, L.; Chen, D.; Weng, X.; Zhu, S.; Yang, C. A Novel Diagnostic Biomarker, PZP, for Detecting Colorectal Cancer in Type 2 Diabetes Mellitus Patients Identified by Serum-Based Mass Spectrometry. Front. Mol. Biosci. 2021, 8, 736272. [Google Scholar] [CrossRef] [PubMed]
  26. Luebke, A.M.; Attarchi-Tehrani, A.; Meiners, J.; Hube-Magg, C.; Lang, D.S.; Kluth, M.; Tsourlakis, M.C.; Minner, S.; Simon, R.; Sauter, G.; et al. Loss of PSP94 expression is associated with early PSA recurrence and deteriorates outcome of PTEN deleted prostate cancers. Cancer Biol. Med. 2019, 16, 319–330. [Google Scholar] [CrossRef] [PubMed]
  27. Tsui, S.; Dai, T.; Roettger, S.; Schempp, W.; Salido, E.C.; Yen, P.H. Identification of Two Novel Proteins That Interact with Germ-Cell-Specific RNA-Binding Proteins DAZ and DAZL1. Genomics 2000, 65, 266–273. [Google Scholar] [CrossRef]
  28. Kros, J.M.; Mustafa, D.M.; Dekker, L.J.; Sillevis Smitt, P.A.; Luider, T.M.; Zheng, P.P. Circulating glioma biomarkers. Neuro-Oncol. 2015, 17, 343–360. [Google Scholar] [CrossRef]
  29. Fariña-Jerónimo, H.; Martín-Ramírez, R.; González-Fernández, R.; Medina, L.; de Vera, A.; Martín-Vasallo, P.; Plata-Bello, J. Androgen deficiency is associated with a better prognosis in glioblastoma. Eur. J. Med. Res. 2024, 29, 57. [Google Scholar] [CrossRef]
  30. Huang, J.; Xu, Y.; Chen, Y.; Shen, J.; Qiu, Y.; Li, X.; Chen, X.; Ma, S. Revisiting the role of pregnancy zone protein (PZP) as a cancer biomarker in the immunotherapy era. J. Transl. Med. 2024, 22, 500. [Google Scholar] [CrossRef]
  31. Jaksch-Bogensperger, H.; Spiegl-Kreinecker, S.; Arosio, P.; Eckl, P.; Golaszewski, S.; Ebner, Y.; Al-Schameri, R.; Strasser, P.; Weis, S.; Bresgen, N. Ferritin in glioblastoma. Br. J. Cancer 2020, 122, 1441–1444. [Google Scholar] [CrossRef]
  32. Ahmad, F.; Ghosh, S.; Sinha, S.; Joshi, S.D.; Mehta, V.S.; Sen, E. TGF-β-induced hCG-β regulates redox homeostasis in glioma cells. Mol. Cell. Biochem. 2015, 399, 105–112. [Google Scholar] [CrossRef]
  33. Mondragón, J.A.; Serrano, Y.; Torres, A.; Orozco, M.; Segovia, J.; Manjarrez, G.; Romano, M.C. Glioblastoma cells express crucial enzymes involved in androgen synthesis: 3β-hydroxysteroid dehydrogenase, 17-20α-hydroxylase, 17β-hydroxysteroid dehydrogenase and 5α-reductase. Endocrinol. Diabetes Metab. 2021, 4, e00289. [Google Scholar] [CrossRef] [PubMed]
  34. Liu, Z.; Ji, H.; Fu, W.; Ma, S.; Zhao, H.; Wang, F.; Dong, J.; Yan, X.; Zhang, J.; Wang, N.; et al. IGFBPs were associated with stemness, inflammation, extracellular matrix remodeling and poor prognosis of low-grade glioma. Front. Endocrinol. 2022, 13, 943300. [Google Scholar] [CrossRef] [PubMed]
  35. Kim, Y.S.; Lee, S.H.; Park, A.H.; Wu, C.; Hong, B.K.; Jung, H.; Lin, S.H.; Yoo, S.S. BTN1A1 is a novel immune checkpoint mutually exclusive to PD-L1. J. Immunother. Cancer 2024, 12, e008303. [Google Scholar] [CrossRef] [PubMed]
  36. Undén, A.L.; Elofsson, S.; Brismar, K. Gender differences in the relation of insulin-like growth factor binding protein-1 to cardiovascular risk factors: A population-based study. Clin. Endocrinol. 2005, 63, 94–102. [Google Scholar] [CrossRef]
  37. Thuring, C.; Follin, E.; Geironson, L.; Freyhult, E.; Junghans, V.; Harndahl, M.; Buus, S.; Paulsson, K.M. HLA class I is most tightly linked to levels of tapasin compared with other antigen-processing proteins in glioblastoma. Br. J. Cancer 2015, 113, 1640. [Google Scholar] [CrossRef]
  38. Guerra, G.; Nakase, T.; Kachuri, L.; McCoy, L.; Hansen, H.M.; Rice, T.; Wiemels, J.L.; Wiencke, J.K.; Molinaro, A.M.; Wrensch, M.; et al. Association of immunoglobulin E levels with glioma risk and survival. J. Natl. Cancer Inst. 2024, 117, 545–553. [Google Scholar] [CrossRef]
  39. Cao, K.; Jiang, X.; Wang, B.; Ni, Z.; Chen, Y. SAA1 Expression as a Potential Prognostic Marker of the Tumor Microenvironment in Glioblastoma. Front. Neurol. 2022, 13, 905561. [Google Scholar] [CrossRef]
  40. Silver, D.J.; Siebzehnrubl, F.A.; Schildts, M.J.; Yachnis, A.T.; Smith, G.M.; Smith, A.A.; Scheffler, B.; Reynolds, B.A.; Silver, J.; Steindler, D.A. Chondroitin sulfate proteoglycans potently inhibit invasion and serve as a central organizer of the brain tumor microenvironment. J. Neurosci. 2013, 33, 15603–15617. [Google Scholar] [CrossRef]
  41. Pang, L.; Dunterman, M.; Guo, S.; Khan, F.; Liu, Y.; Taefi, E.; Bahrami, A.; Geula, C.; Hsu, W.H.; Horbinski, C.; et al. Kunitz-type protease inhibitor TFPI2 remodels stemness and immunosuppressive tumor microenvironment in glioblastoma. Nat. Immunol. 2023, 24, 1654–1670. [Google Scholar] [CrossRef]
  42. Adyns, L.; Proost, P.; Struyf, S. Role of Defensins in Tumor Biology. Int. J. Mol. Sci. 2023, 24, 5268. [Google Scholar] [CrossRef]
  43. Fan, X.; Liang, J.; Wu, Z.; Shan, X.; Qiao, H.; Jiang, T. Expression of HLA-DR genes in gliomas: Correlation with clinicopathological features and prognosis. Chin. Neurosurg. J. 2017, 3, 27. [Google Scholar] [CrossRef]
  44. Xu, X.; Hou, Y.; Long, N.; Jiang, L.; Yan, Z.; Xu, Y.; Lv, Y.; Xiang, X.; Yang, H.; Liu, J.; et al. TPPP3 promote epithelial-mesenchymal transition via Snail1 in glioblastoma. Sci. Rep. 2023, 13, 17960. [Google Scholar] [CrossRef] [PubMed]
  45. Ghosh, S.K.; McCormick, T.S.; Weinberg, A. Human Beta Defensins and Cancer: Contradictions and Common Ground. Front. Oncol. 2019, 9, 341. [Google Scholar] [CrossRef] [PubMed]
  46. Gillard, A.G.; Shin, D.H.; Hampton, L.A.; Lopez-Rivas, A.; Parthasarathy, A.; Fueyo, J.; Gomez-Manzano, C. Targeting Innate Immunity in Glioma Therapy. Int. J. Mol. Sci. 2024, 25, 947. [Google Scholar] [CrossRef]
  47. Cohen, E.; Margalit, I.; Shochat, T.; Goldberg, E.; Krause, I. Gender differences in homocysteine concentrations, a population-based cross-sectional study. Nutr. Metab. Cardiovasc. Dis. 2019, 29, 9–14. [Google Scholar] [CrossRef]
  48. Bolognesi, A.; Bortolotti, M.; Battelli, M.G.; Polito, L. Gender Influence on XOR Activities and Related Pathologies: A Narrative Review. Antioxidants 2024, 13, 211. [Google Scholar] [CrossRef]
  49. Campanella, R.; Guarnaccia, L.; Cordiglieri, C.; Trombetta, E.; Caroli, M.; Carrabba, G.; La Verde, N.; Rampini, P.; Gaudino, C.; Costa, A.; et al. Tumor-Educated Platelets and Angiogenesis in Glioblastoma: Another Brick in the Wall for Novel Prognostic and Targetable Biomarkers, Changing the Vision from a Localized Tumor to a Systemic Pathology. Cells 2020, 9, 294. [Google Scholar] [CrossRef]
  50. Osuna-Prieto, F.J.; Rubio-Lopez, J.; Di, X.; Yang, W.; Kohler, I.; Rensen, P.C.N.; Ruiz, J.R.; Martinez-Tellez, B. Plasma Levels of Bile Acids Are Related to Cardiometabolic Risk Factors in Young Adults. J. Clin. Endocrinol. Metab. 2022, 107, 715–723. [Google Scholar] [CrossRef]
  51. Oizel, K.; Chauvin, C.; Oliver, L.; Gratas, C.; Geraldo, F.; Jarry, U.; Scotet, E.; Rabe, M.; Alves-Guerra, M.C.; Teusan, R.; et al. Efficient Mitochondrial Glutamine Targeting Prevails Over Glioblastoma Metabolic Plasticity. Clin. Cancer Res. 2017, 23, 6292–6304. [Google Scholar] [CrossRef]
  52. Chen, J.; Cui, L.; Lu, S.; Xu, S. Amino acid metabolism in tumor biology and therapy. Cell Death Dis. 2024, 15, 42. [Google Scholar] [CrossRef]
  53. Miska, J.; Chandel, N.S. Targeting fatty acid metabolism in glioblastoma. J. Clin. Investig. 2023, 133, e163448. [Google Scholar] [CrossRef] [PubMed]
  54. Zhou, W.; Yao, Y.; Scott, A.J.; Wilder-Romans, K.; Dresser, J.J.; Werner, C.K.; Sun, H.; Pratt, D.; Sajjakulnukit, P.; Zhao, S.G.; et al. Purine metabolism regulates DNA repair and therapy resistance in glioblastoma. Nat. Commun. 2020, 11, 3811. [Google Scholar] [CrossRef] [PubMed]
  55. Jiang, N.; Xie, B.; Xiao, W.; Fan, M.; Xu, S.; Duan, Y.; Hamsafar, Y.; Evans, A.C.; Huang, J.; Zhou, W.; et al. Fatty acid oxidation fuels glioblastoma radioresistance with CD47-mediated immune evasion. Nat. Commun. 2022, 13, 1511. [Google Scholar] [CrossRef]
  56. Djurovic, Z.; Jovanovic, V.; Obrenovic, R.; Djurovic, B.; Soldatovic, I.; Vranic, A.; Jakovljevic, V.; Djuric, D.; Zivkovic, V. The importance of the blood levels of homocysteine, folate and vitamin B12 in patients with primary malignant brain tumors. JBUON 2020, 25, 2600–2607. [Google Scholar]
  57. Baxter, M.E.; Miller, H.A.; Chen, J.; Williams, B.J.; Frieboes, H.B. Metabolomic differentiation of tumor core versus edge in glioma. Neurosurg. Focus 2023, 54, E4. [Google Scholar] [CrossRef]
  58. Tasci, E.; Jagasia, S.; Zhuge, Y.; Camphausen, K.; Krauze, A.V. GradWise: A novel application of a rank-based weighted hybrid filter and embedded feature selection method for glioma grading with clinical and molecular characteristics. Cancers 2023, 15, 4628. [Google Scholar] [CrossRef]
  59. Mao, W.; Zhou, J.; Hu, J.; Zhao, K.; Fu, Z.; Wang, J.; Mao, K. A pan-cancer analysis of FAT atypical cadherin 4 (FAT4) in human tumors. Front. Public Health 2022, 10, 969070. [Google Scholar] [CrossRef]
  60. Nakata, S.; Yuan, M.; Rubens, J.A.; Kahlert, U.D.; Maciaczyk, J.; Raabe, E.H.; Eberhart, C.G. BCOR Internal Tandem Duplication Expression in Neural Stem Cells Promotes Growth, Invasion, and Expression of PRC2 Targets. Int. J. Mol. Sci. 2021, 22, 3913. [Google Scholar] [CrossRef]
  61. Donson, A.M.; Amani, V.; Griesinger, A.M.; Calzadilla, A.; Grimaldo, E.; Willard, N.; Foreman, N.K.; Mulcahy-Levy, J. Etmr-22. Identification of 5-Flurouracil As a Selective Therapy in a Novel EP300::Bcor Fusion Glioma Tumor Model. Neuro-Oncol. 2024, 26. [Google Scholar] [CrossRef]
  62. Krämer, A.; Green, J.; Pollard, J., Jr.; Tugendreich, S. Causal analysis approaches in Ingenuity Pathway Analysis. Bioinformatics 2014, 30, 523–530. [Google Scholar] [CrossRef]
  63. Tasci, E.; Jagasia, S.; Zhuge, Y.; Sproull, M.; Cooley Zgela, T.; Mackey, M.; Camphausen, K.; Krauze, A.V. RadWise: A Rank-Based Hybrid Feature Weighting and Selection Method for Proteomic Categorization of Chemoirradiation in Patients with Glioblastoma. Cancers 2023, 15, 2672. [Google Scholar] [CrossRef] [PubMed]
  64. Guyon, I.; Elisseeff, A. An introduction to variable and feature selection. J. Mach. Learn. Res. 2003, 3, 1157–1182. [Google Scholar]
  65. Voting Classifier. Available online: https://scikit-learn.org/stable/modules/generated/sklearn.ensemble.VotingClassifier.html (accessed on 7 August 2024).
Table 6. Our best results of the employed datasets for GBM (all identified features are in Supplementary Table S1).
Dataset# of FeaturesAccuracy Rate (%)Number of Identified Features
Local Proteomic PreCRT-based Dataset7289100.00017
CPTAC-GBM Proteomic Dataset882899.0005
CPTAC-GBM Metabolomic Dataset5980.00013
Local Level One PreCRT-based Metabolomic Dataset31891.55816
TCGA-UCI Glioma Grading Dataset for GBM2063.6343
Table 7. The 16 proteomic features identified in the NCI NIH GBM serum proteomic dataset. Green fill indicates known association with biological sex based on existing literature and use in the clinic and/or association with glioma or, more specifically in some cases, glioblastoma (GBM).
TargetEntrez Gene SymbolTarget Full NameDocumented Association with Biological SexDocumented Association with Glioma
BPSAKLK3Benign Prostate specific Antigenyes [24]no
PZPPZPPregnancy zone proteinyes [25]no
HCGCGA|CGB3|CGB7Human Chorionic Gonadotropinyes [28]yes [32]
FSHCGA|FSHBFollicle stimulating hormoneyesyes [29]
IGFBP-1IGFBP1Insulin-like growth factor-binding protein 1possible [36]yes [34]
TPSNRTAPBPLTapasin-related proteinnoyes [37]
CYTL1CYTL1Cytokine-like protein 1nono
BTN1A1BTN1A1Butyrophilin subfamily 1 member A1possible [35]no
CCL28CCL28C-C motif chemokine 28nono
PSP-94MSMBBeta-microseminoproteinyes [29,33]no
FerritinFTH1|FTLFerritinyes [1]yes [31]
IgEIGHEImmunoglobulin Epossibleyes [38]
SAA1SAA1Serum amyloid A-1 proteinnoyes [39]
CSPG3NCANNeurocan core proteinnoyes [40]
HBD-2DEFB4ABeta-defensin 4Anono
DAZP1DAZAP1DAZ-associated protein 1yes [27]no
SPIT3SPINT3Kunitz-type protease inhibitor 3noyes [41]
Disclaimer/Publisher’s Note: The statements, opinions and data contained in all publications are solely those of the individual author(s) and contributor(s) and not of MDPI and/or the editor(s). MDPI and/or the editor(s) disclaim responsibility for any injury to people or property resulting from any ideas, methods, instructions or products referred to in the content.