
Development of Dispersive Liquid–Liquid Microextraction Method Based on Solidification of Floating Organic Droplets for Rapid Determination of Three Strigolactones in Rice (Oryza sativa L.) Using Ultra-High-Performance Liquid Chromatography–Tandem Mass Spectrometry

 and
and
Abstract
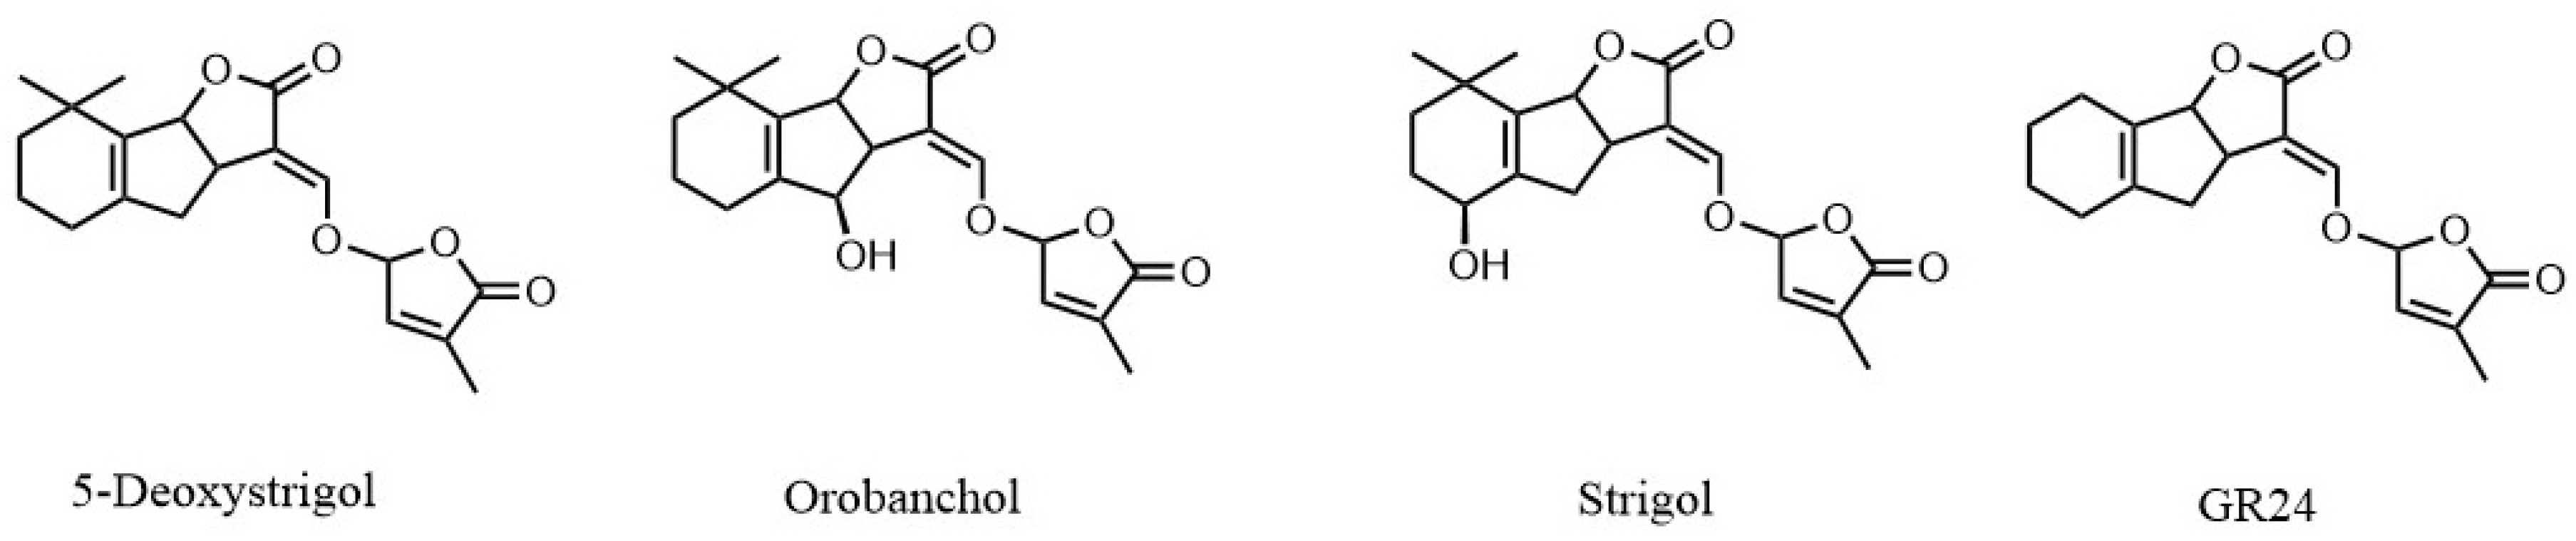
1. Introduction
2. Results and Discussion
2.1. The Best Tested Conditions of the DLLME-SFO Parameters
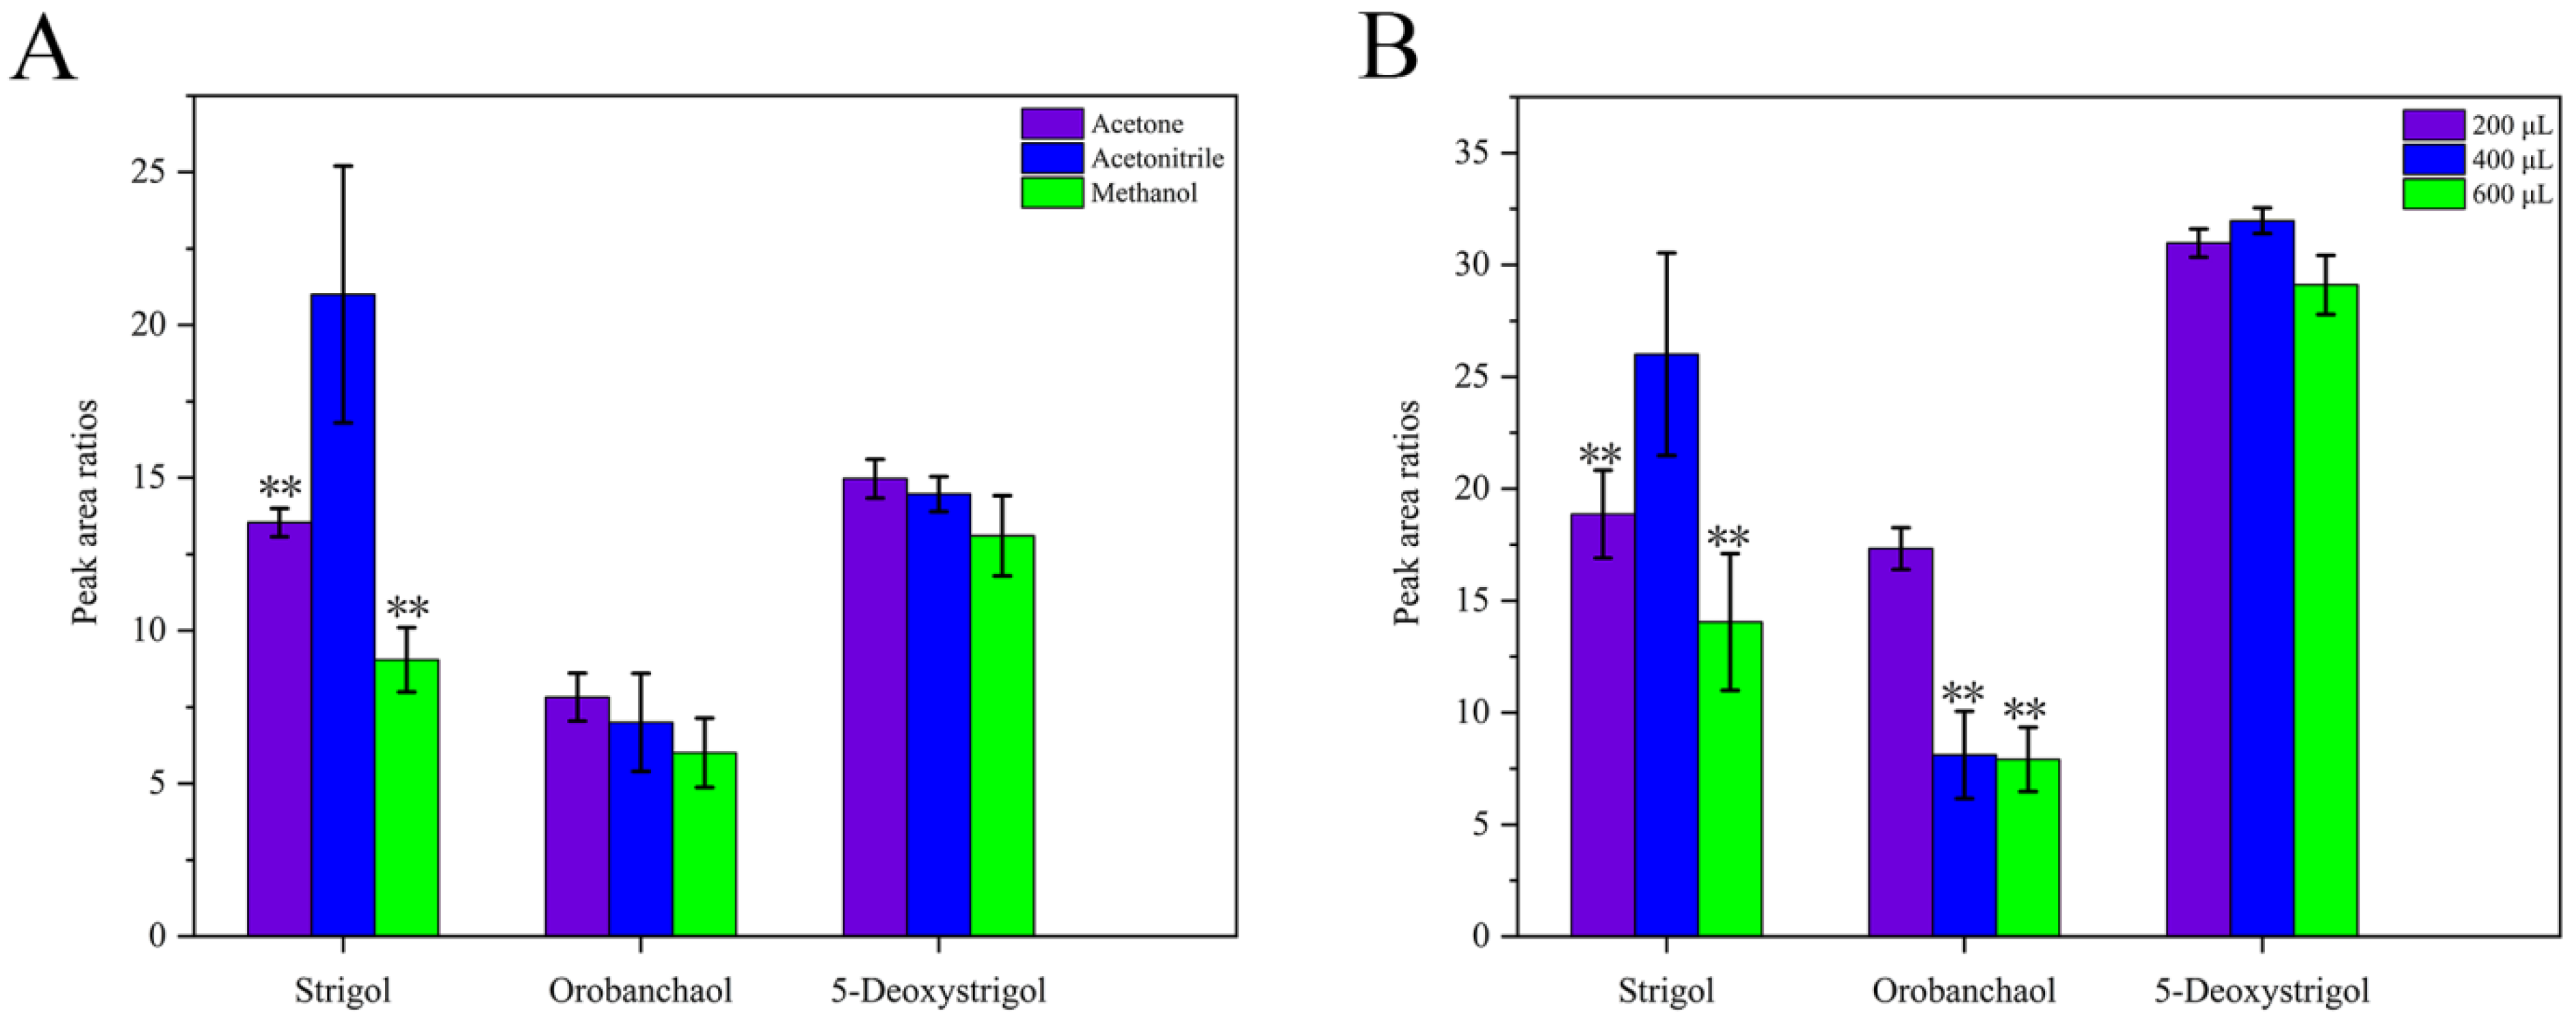
2.1.1. Selection of Dispersant and Dispersant Volume
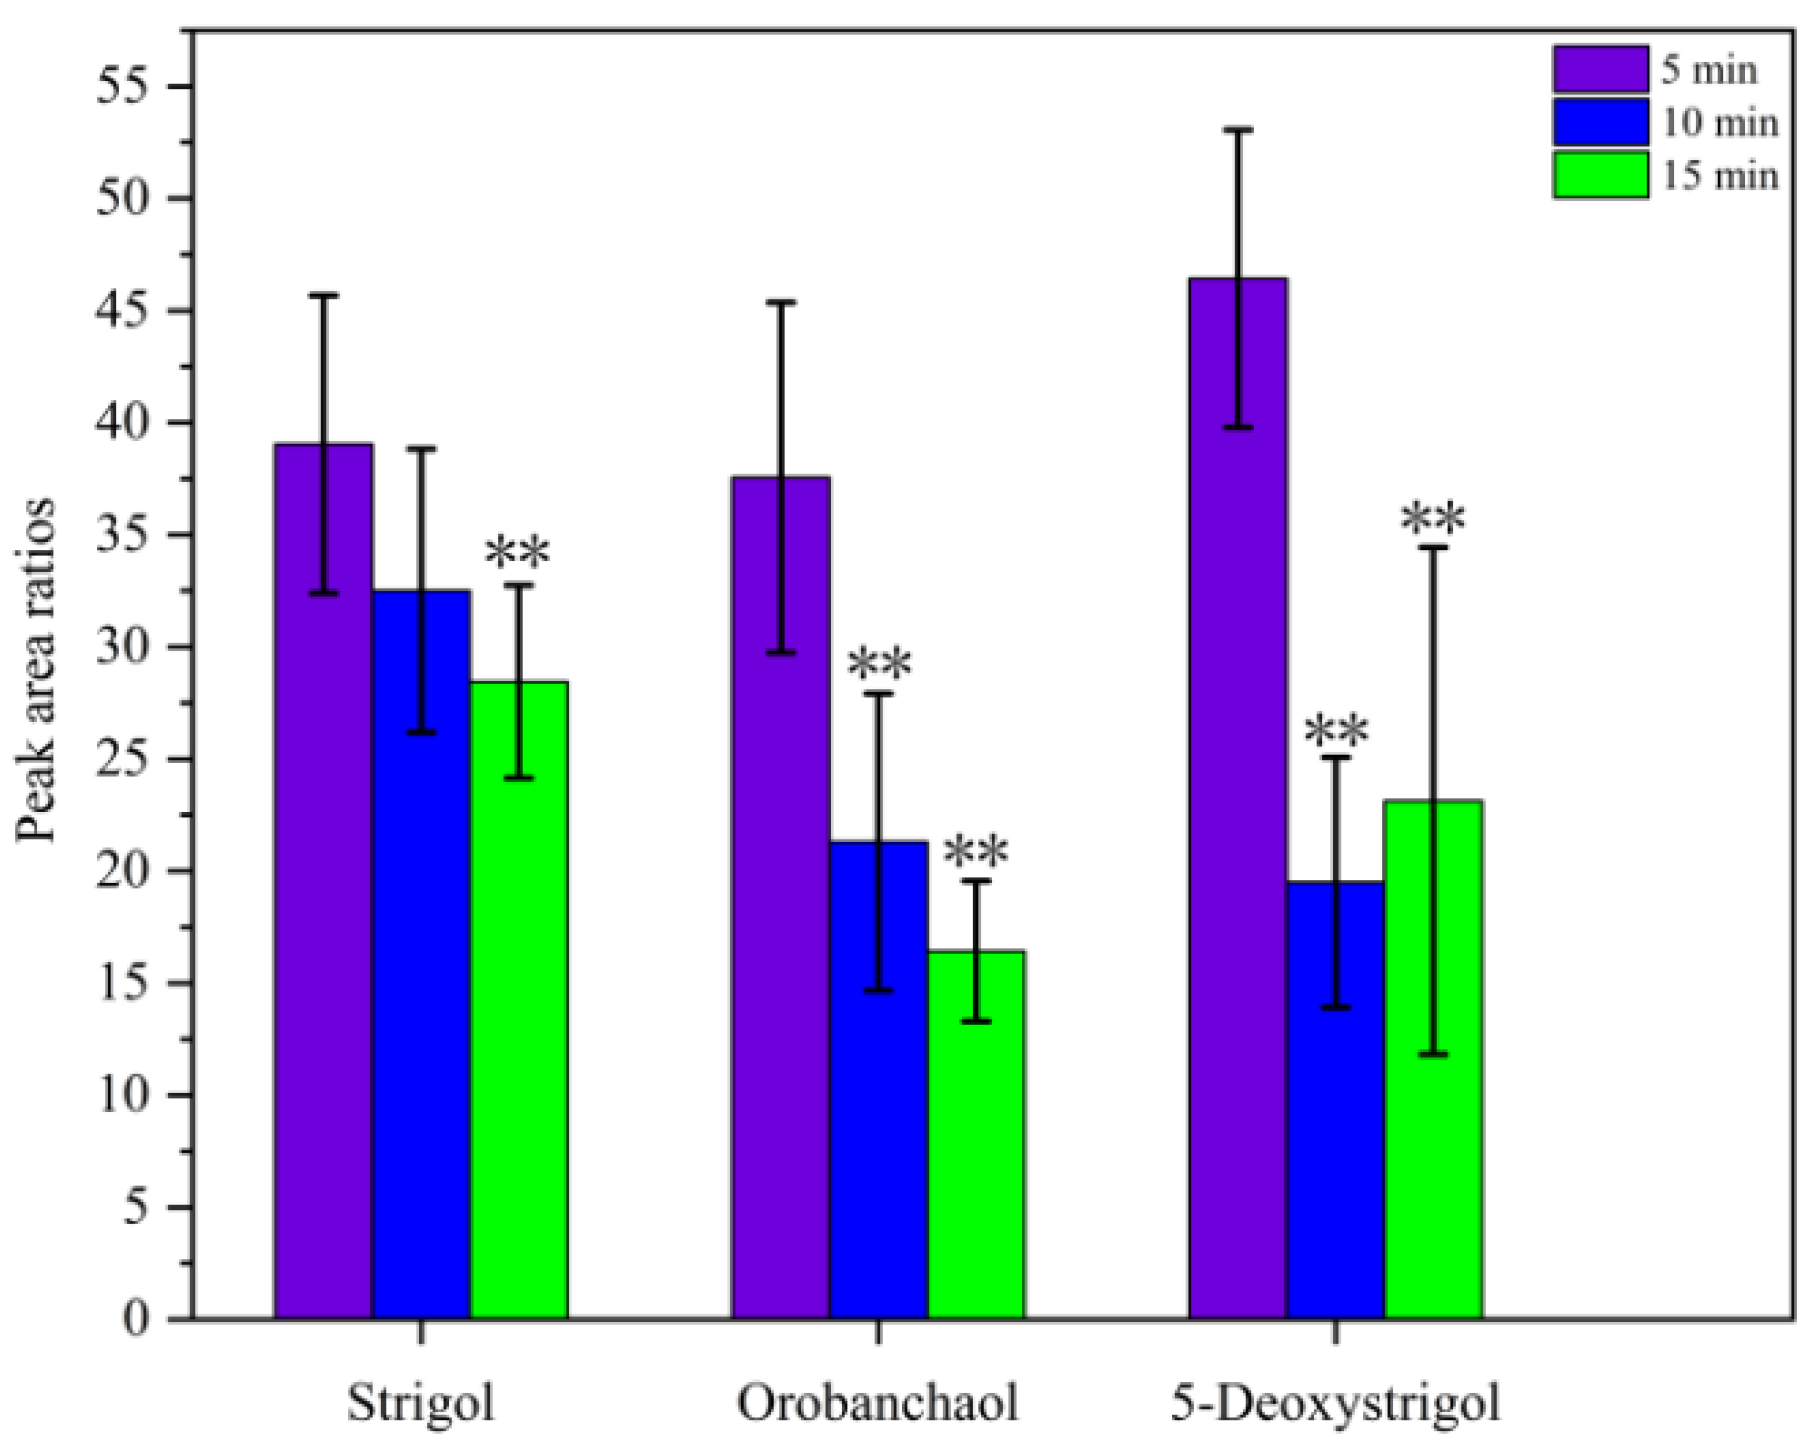
2.1.2. Effect of Ultrasonication Time
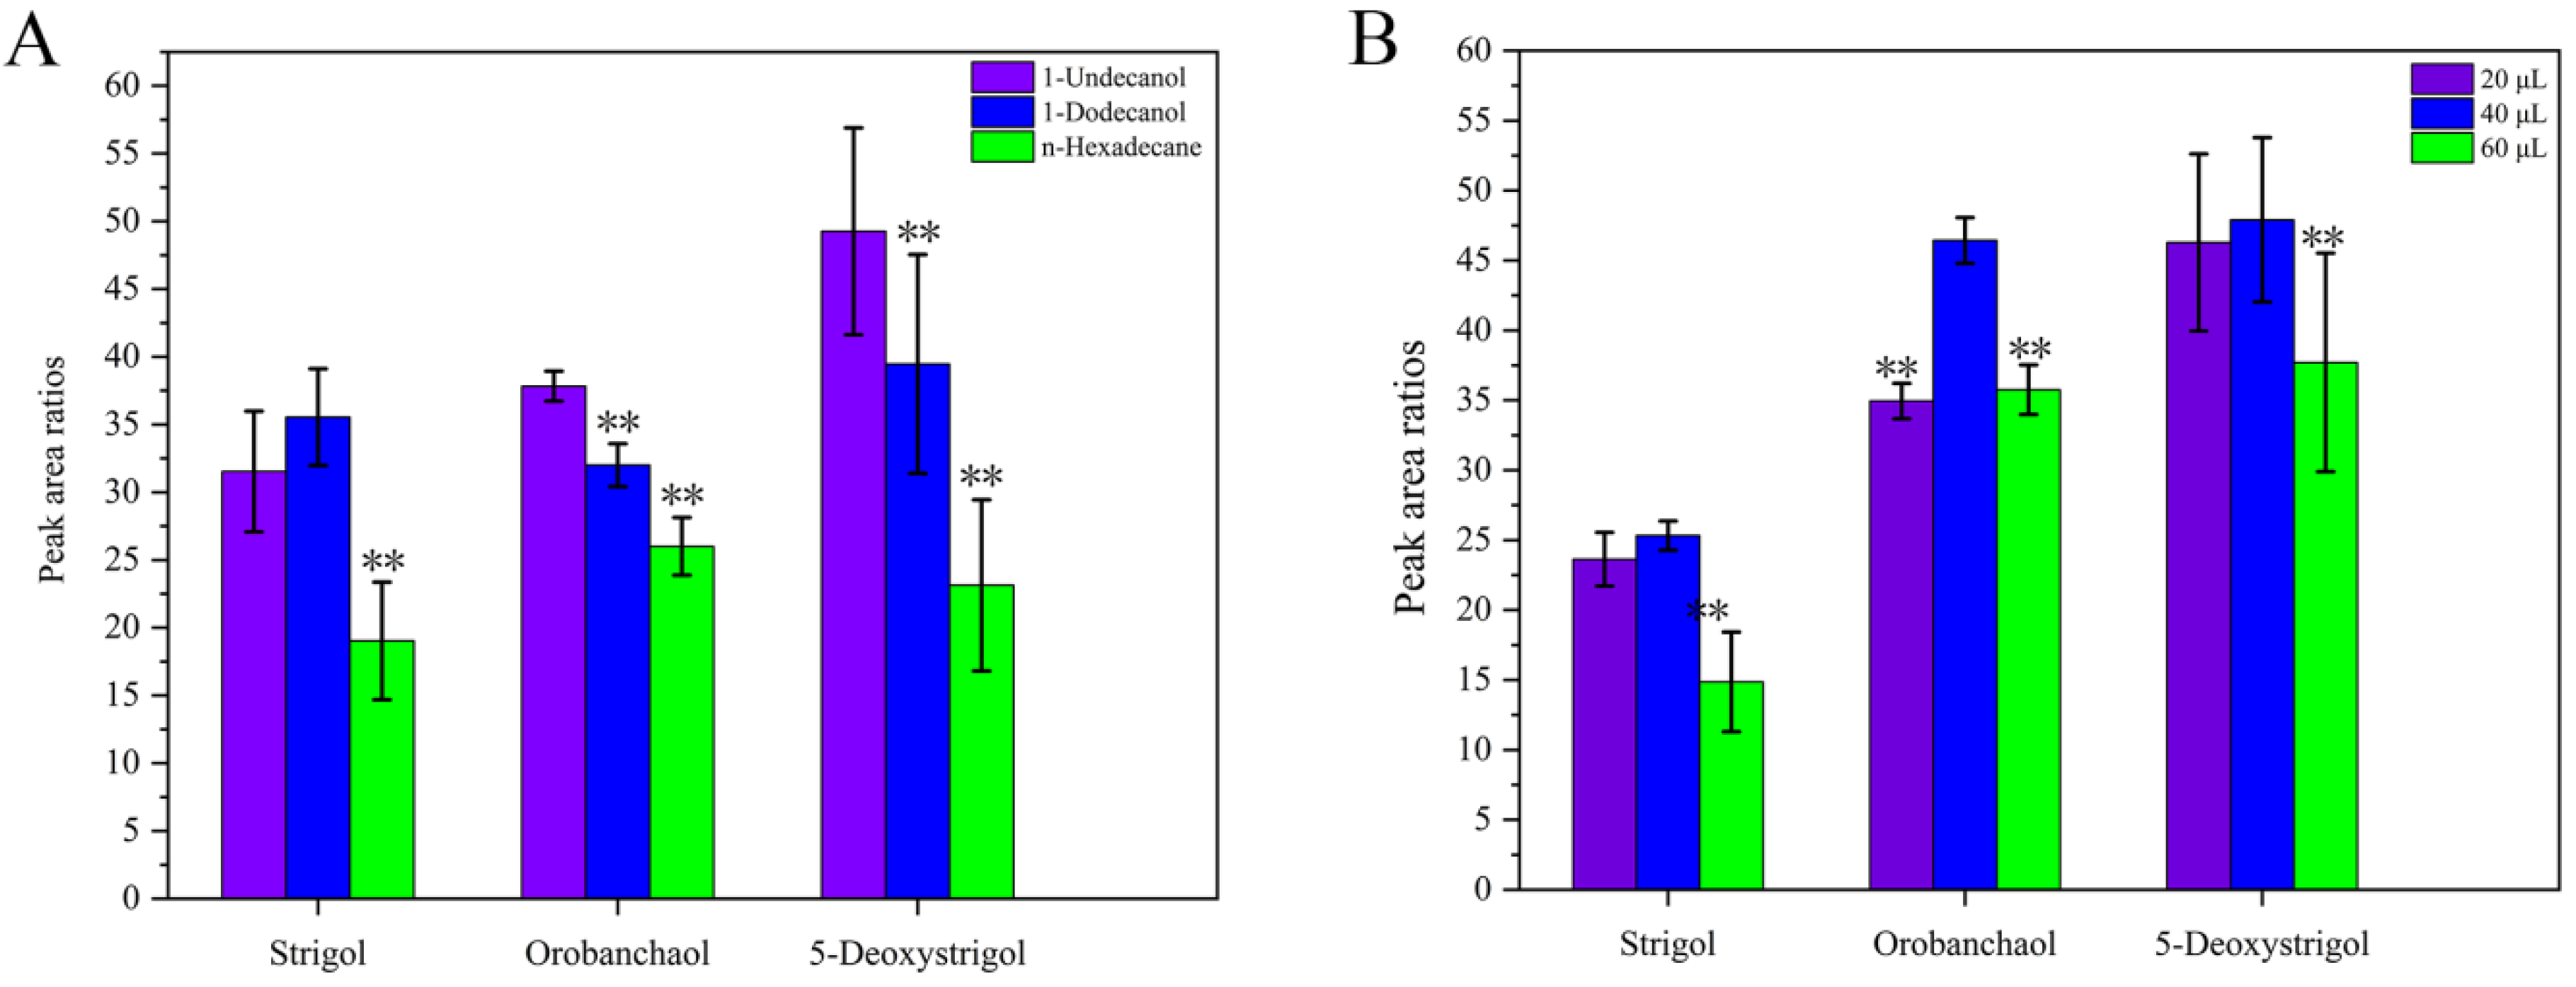
2.1.3. Selection of Extractant and Extractant Volume
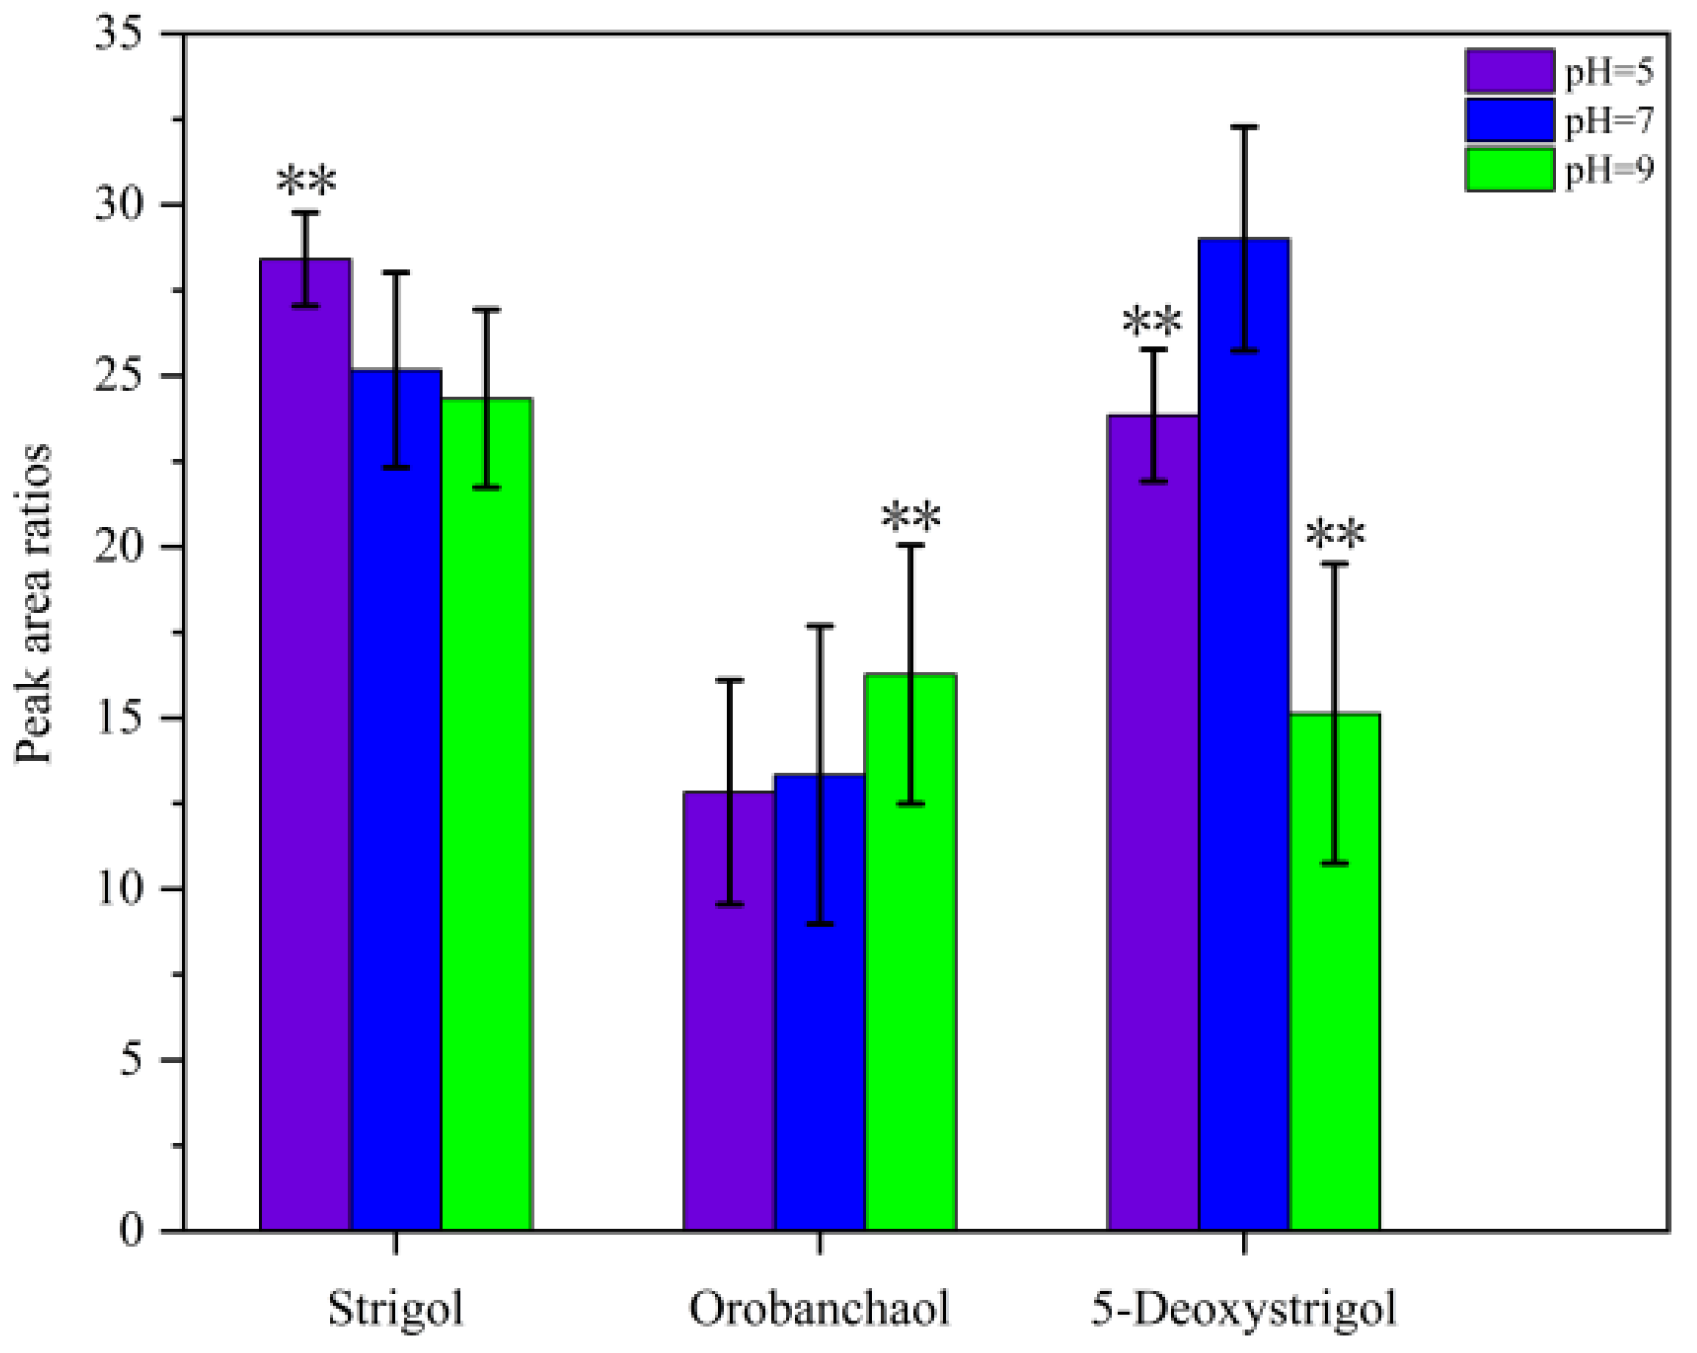
2.1.4. Effect of pH
2.2. Method Performance
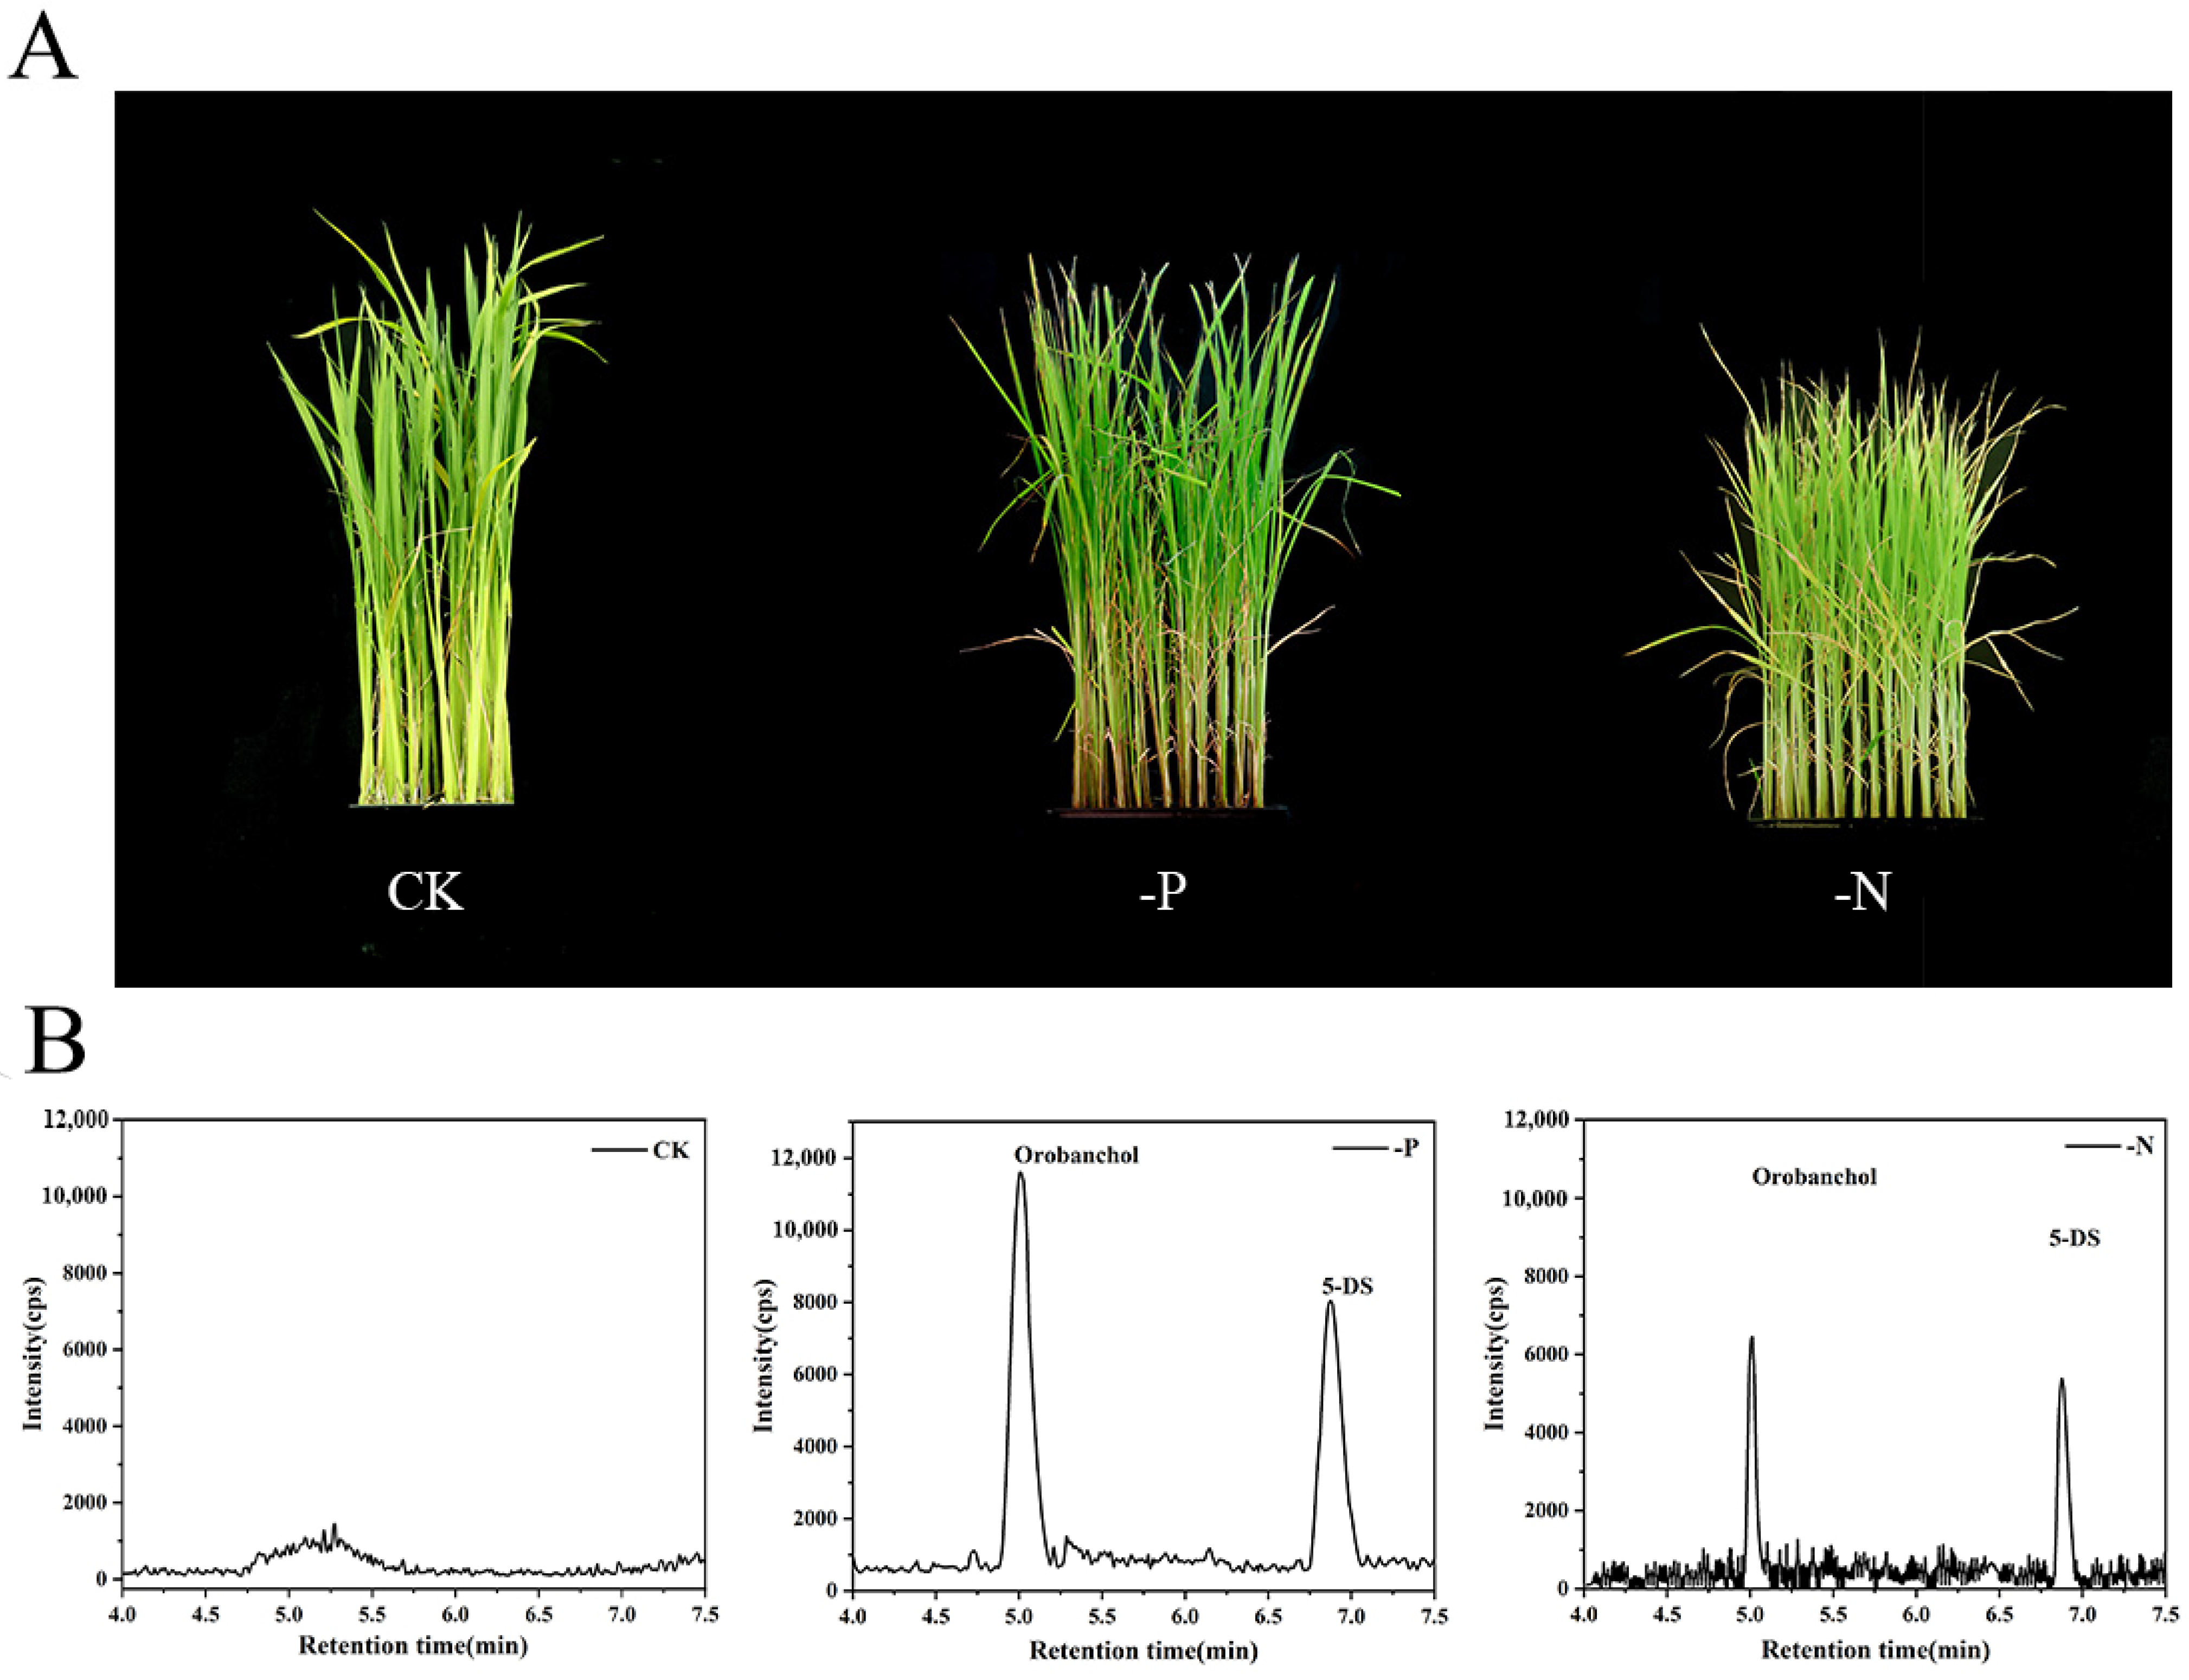
2.3. Application of the Proposed Method to Rice Samples
2.4. Comparison of DLLME-SFO with Other SL Extraction Methods
3. Materials and Methods
3.1. Chemicals and Standards
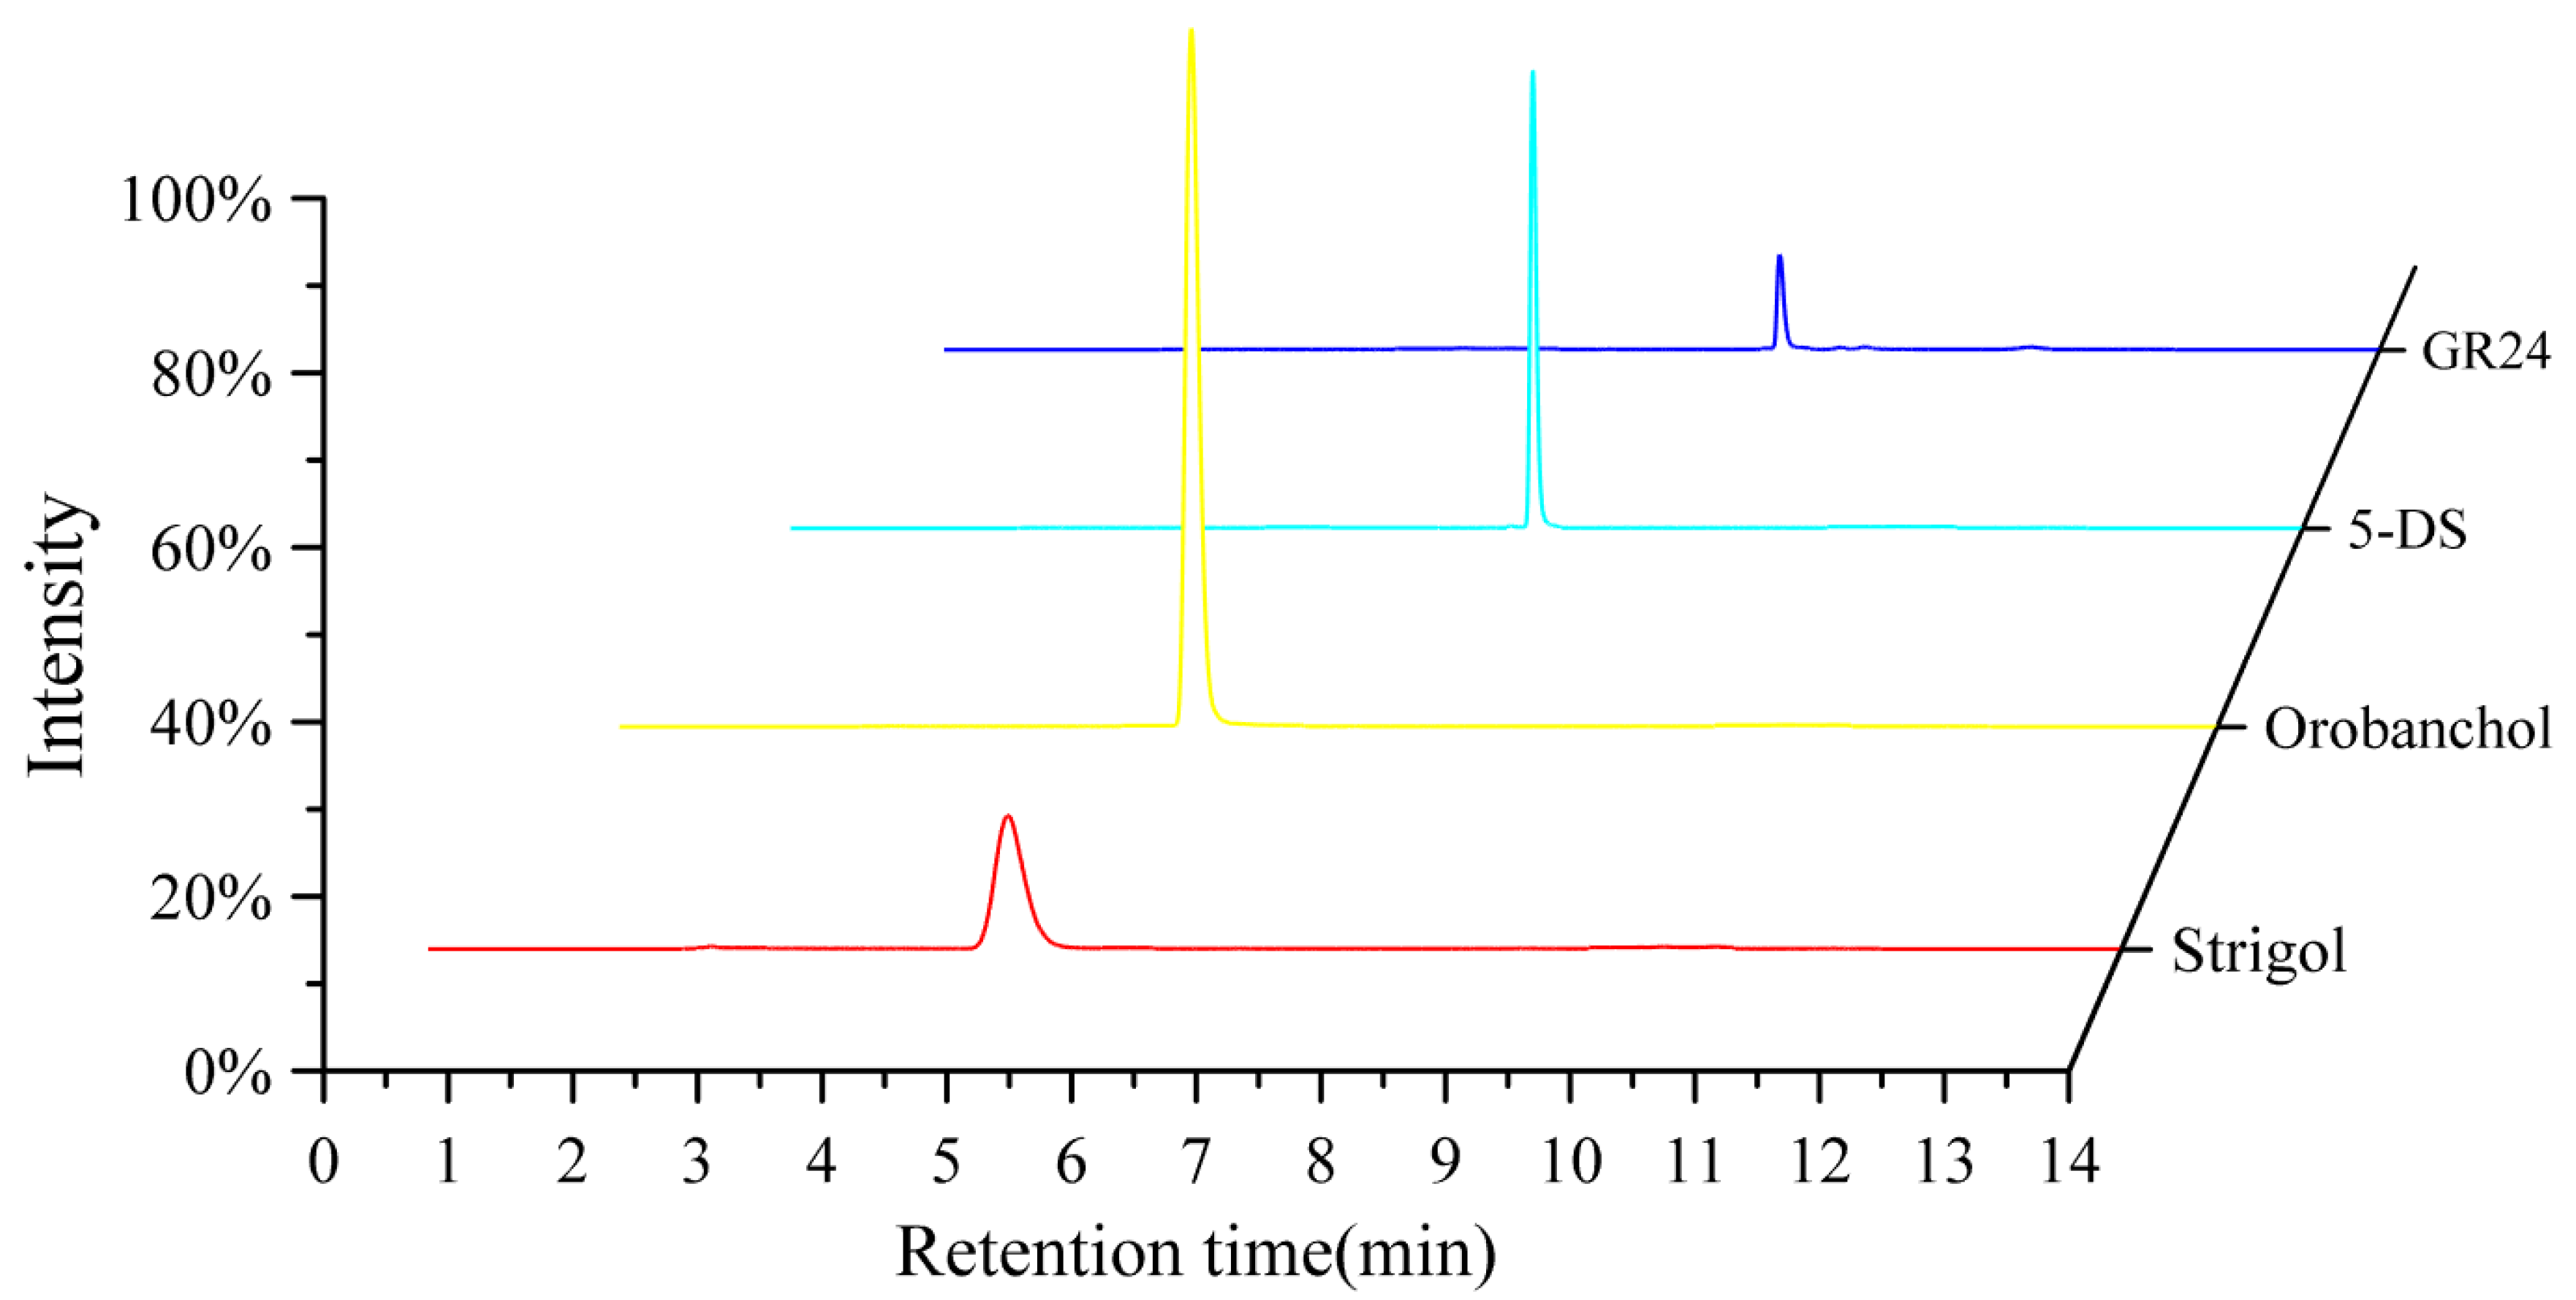
3.2. Instrument Analysis
3.3. Plant Material and Growth Conditions
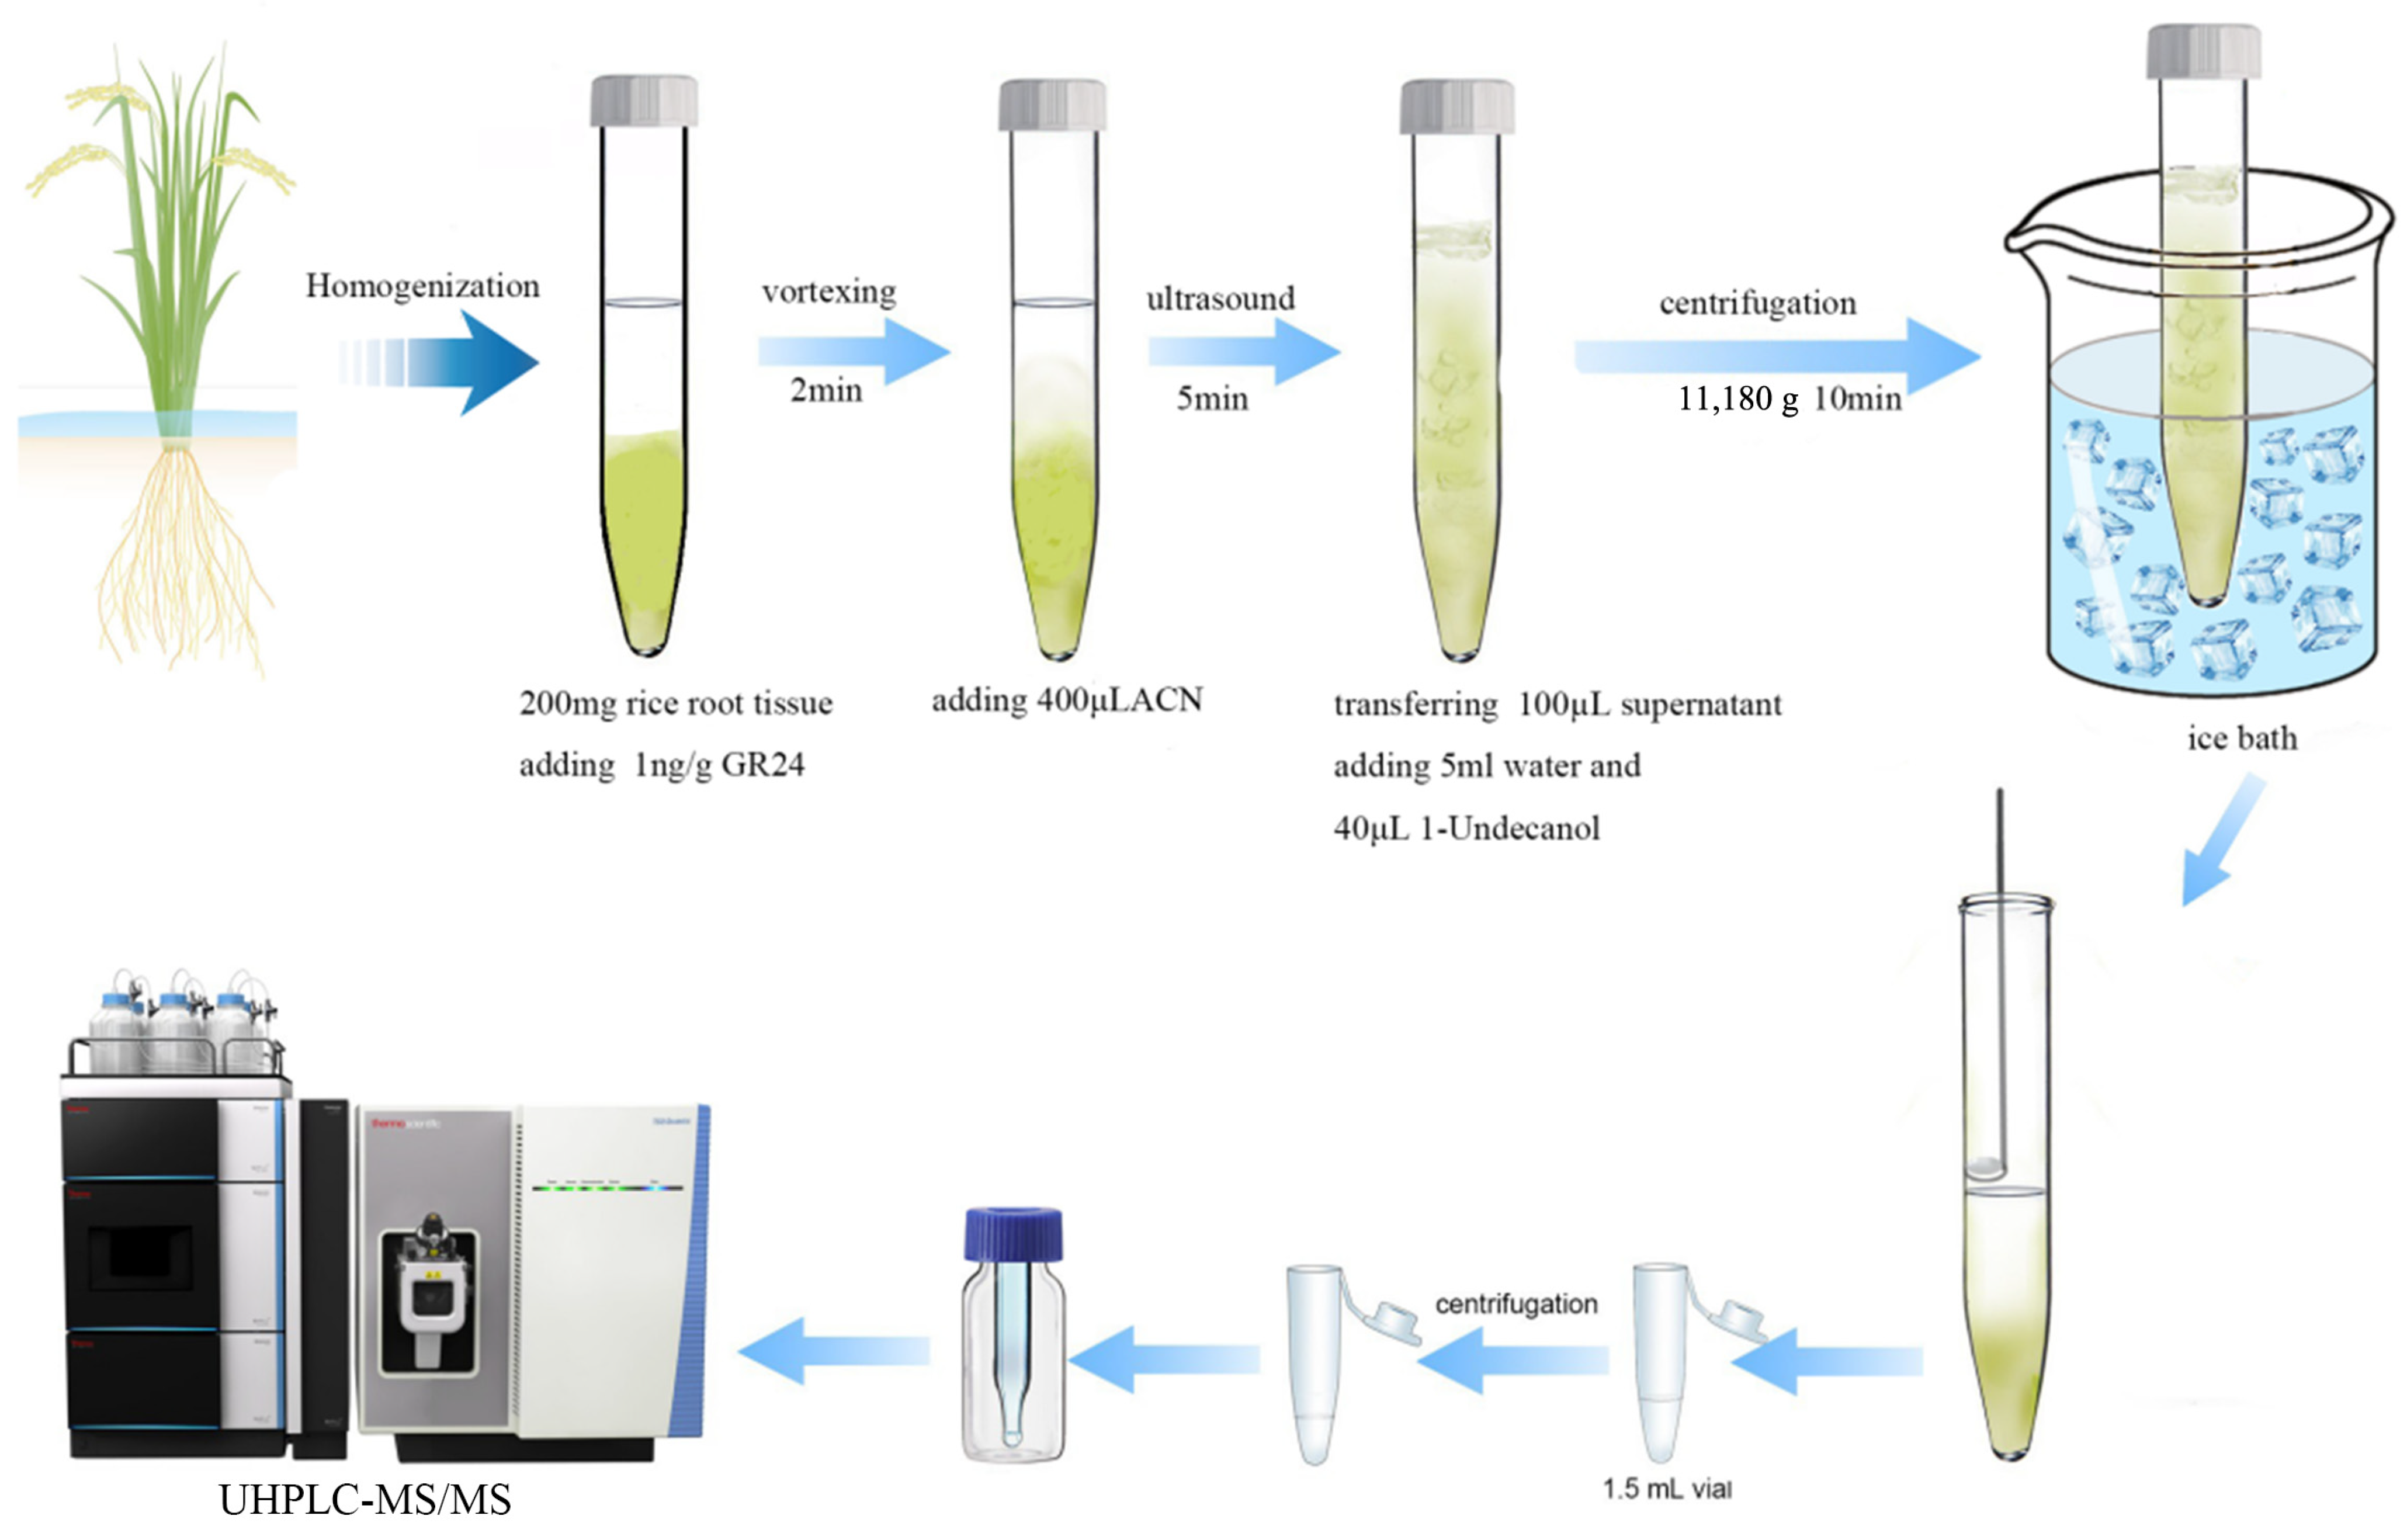
3.4. DLLME-SFO Procedure
3.5. Method Validation
4. Conclusions
Supplementary Materials
Author Contributions
Funding
Institutional Review Board Statement
Informed Consent Statement
Data Availability Statement
Conflicts of Interest
References
- Daignan-Fornier, S.; Keita, A.; Boyer, F.D. Chemistry of Strigolactones, Key Players in Plant Communication. ChemBioChem 2024, 25, e202400133. [Google Scholar] [CrossRef] [PubMed]
- Cao, D.; Chabikwa, T.; Barbier, F.; Dun, E.A.; Fichtner, F.; Dong, L.; Kerr, S.C.; Beveridge, C.A. Auxin-independent Effects of Apical Dominance Induce Changes in Phytohormones Correlated with Bud Outgrowth. Plant Physiol. 2023, 192, 1420–1434. [Google Scholar] [CrossRef] [PubMed]
- Guercio, A.M.; Palayam, M.; Shabek, N. Strigolactones: Diversity, Perception, and Hydrolysis. Phytochem. Rev. 2023, 22, 339–360. [Google Scholar] [CrossRef]
- Kang, Z.Y.; Yan, Y.J.; Lu, R.R.; Dong, X.Q.; Xu, J.; Zheng, D.; Li, S.H.; Gao, Q.Z.; Liu, S.N. Synthesis and Biological Profiling of Novel Strigolactone Derivatives for Arabidopsis Growth and Development. J. Agric. Food Chem. 2023, 71, 12859–12874. [Google Scholar] [CrossRef]
- Motonami, N.; Ueno, K.; Nakashima, H.; Nomura, S.; Mizutani, M.; Takikawa, H.; Sugimoto, Y. The Bioconversion of 5-Deoxystrigol to Sorgomol by the Sorghum, Sorghum bicolor (L.) Moench. Phytochemistry 2013, 93, 41–48. [Google Scholar] [CrossRef]
- Wakabayashi, T.; Ueno, K.; Sugimoto, Y. Structure Elucidation and Biosynthesis of Orobanchol. Front. Plant Sci. 2022, 13, 835160. [Google Scholar] [CrossRef]
- Halouzka, R.; Zeljković, S.Ć.; Klejdus, B.; Tarkowski, P. Analytical Methods in Strigolactone Research. Plant Methods 2020, 16, 76. [Google Scholar] [CrossRef]
- Wu, S.; Ma, X.Q.; Zhou, A.Q.; Valenzuela, A.; Zhou, K.; Li, Y.R. Establishment of Strigolactone-producing Bacterium-yeast Consortium. Sci. Adv. 2021, 7, eabh4048. [Google Scholar] [CrossRef] [PubMed]
- Wang, L.; Wang, B.; Yu, H.; Guo, H.Y.; Lin, T.; Kou, L.Q.; Wang, A.Q.; Shao, N.; Ma, H.Y.; Xiong, G.S.; et al. Transcriptional Regulation of Strigolactone Signalling in Arabidopsis. Nature 2020, 583, 277–281. [Google Scholar] [CrossRef]
- Wang, D.W.; Pang, Z.L.; Yu, H.Y.; Thiombiano, B.; Walmsley, A.; Yu, S.Y.; Zhang, Y.Y.; Wei, T.; Liang, L.; Wang, J.; et al. Probing Strigolactone Perception Mechanisms with Rationally Designed Small-molecule Agonists Stimulating Germination of Root Parasitic Weeds. Nat. Commun. 2022, 13, 3987. [Google Scholar] [CrossRef]
- Wang, D.W.; Xi, Z. Strigolactone Agonists/antagonists for Agricultural Applications: New Opportunities. Adv. Agrochem. 2022, 1, 61–72. [Google Scholar] [CrossRef]
- Yoneyama, K. Recent Progress in the Chemistry and Biochemistry of Strigolactones. J. Pestic. Sci. 2020, 45, 45–53. [Google Scholar] [CrossRef]
- Wang, Y.P.; Yao, R.F.; Du, X.X.; Guo, L.J.; Chen, L.; Xie, D.X.; Smith, S.M. Molecular Basis for High Ligand Sensitivity and Selectivity of Strigolactone Receptors in Striga. Plant Physiol. 2021, 185, 1411–1428. [Google Scholar] [CrossRef] [PubMed]
- Yuan, S.; Linquist, B.A.; Wilson, L.T.; Cassman, K.G.; Stuart, A.M.; Pede, V.; Miro, B.; Saito, K.; Agustiani, N.; Aristya, V.E.; et al. Sustainable Intensification for A Larger Global Rice Bowl. Nat. Commun. 2021, 12, 7163. [Google Scholar] [CrossRef] [PubMed]
- Wang, F.; Han, T.W.; Song, Q.X.; Ye, W.X.; Song, X.G.; Chu, J.F.; Li, J.Y.; Chen, Z.J. The Rice Circadian Clock Regulates Tiller Growth and Panicle Development Through Strigolactone Signaling and Sugar Sensing. Plant Cell. 2020, 32, 3124–3138. [Google Scholar] [CrossRef]
- Sun, H.W.; Bi, Y.; Tao, J.Y.; Huang, S.J.; Hou, M.; Xue, R.X.; Liang, Z.H.; Gu, P.Y.; Yoneyama, K.; Xie, X.N.; et al. Strigolactones are Required for Nitric Oxide to Induce Root Elongation in Response to Nitrogen and Phosphate Deficiencies in Rice. Plant Cell Environ. 2016, 39, 1473–1484. [Google Scholar] [CrossRef] [PubMed]
- Yuan, K.; Zhang, H.; Yu, C.J.; Luo, N.; Yan, J.J.; Zheng, S.; Hu, Q.L.; Zhang, D.H.; Kou, L.Q.; Meng, X.B.; et al. Low Phosphorus Promotes NSP1-NSP2 Heterodimerization to Enhance Strigolactone Biosynthesis and Regulate Shoot and Root Architecture in Rice. Mol. Plant 2023, 16, 1811–1831. [Google Scholar] [CrossRef]
- Campanharo, S.C.; Baldo da Silva, A.F.; Bleuzen, A.; Mangabeira da Silva, J.J.; Pereira de Freitas, L.V.; Assane, I.M.; Pilarski, F.; Rizzato Paschoal, J.A. The Association of Modified QuEChERS and DLLME to Offer High Analytical Detectability to Assess Residual Depletion Profile of Erythromycin in Fish. Food Chem. 2023, 405 Pt A, 134852. [Google Scholar] [CrossRef]
- Herghelegiu, M.C.; Pănescu, V.A.; Bocoș-Bințințan, V.; Coman, R.T.; Berg, V.; Lyche, J.L.; Bruzzoniti, M.C.; Beldean-Galea, M.S. Simultaneous Determination of Steroids and NSAIDs, Using DLLME-SFO Extraction and HPLC Analysis, in Milk and Eggs Collected from Rural Roma Communities in Transylvania, Romania. Molecules 2023, 29, 96. [Google Scholar] [CrossRef]
- El-Deen, A.K.; Elmansi, H.; Belal, F.; Magdy, G. Recent Advances in Dispersion Strategies for Dispersive Liquid–Liquid Microextraction from Green Chemistry Perspectives. Microchem. J. 2023, 191, 108807. [Google Scholar] [CrossRef]
- Sonawane, D.; Sahu, A.K.; Jadav, T.; Tekade, R.K.; Sengupta, P. Innovation in Strategies for Sensitivity Improvement of Chromatography and Mass Spectrometry Based Analytical Techniques. Crit. Rev. Anal. Chem. 2021, 53, 655–671. [Google Scholar] [CrossRef]
- Wang, L.; Zou, Y.; Kaw, H.Y.; Wang, G.; Sun, H.; Cai, L.; Li, C.; Meng, L.Y.; Li, D. Recent Developments and Emerging Trends of Mass Spectrometric Methods in Plant Hormone Analysis: A Review. Plant Methods. 2020, 16, 54. [Google Scholar] [CrossRef] [PubMed]
- Krasylenko, Y.; Komis, G.; Hlynska, S.; Vavrdova, T.; Ovecka, M.; Pospisil, T.; Samaj, J. GR24, A Synthetic Strigolactone Analog, and Light Affect the Organization of Cortical Microtubules in Arabidopsis Hypocotyl Cells. Front. Plant Sci. 2021, 12, 675981. [Google Scholar] [CrossRef] [PubMed]
- Yang, Q.; Wu, Y.Q.; Zhang, S.H.; Xie, H.Y.; Han, D.D.; Yan, H.Y. Recent Advancements in the Extraction and Analysis of Phthalate Acid Esters in Food Samples. Food Chem. 2025, 463 Pt 2, 141262. [Google Scholar] [CrossRef] [PubMed]
- Custodio-Mendoza, J.A.; Ramos, A.; Lorenzo, R.A.; Carro, A.M. Ultrasound-assisted Enzymatic Indirect Determination of Total 3-Monochloropropane-1,2-diol Esters in Canned Fish Oil Fraction. Food Chem. 2023, 403, 134423. [Google Scholar] [CrossRef]
- Jovanović, M.S.; Krgović, N.; Živković, J.; Stević, T.; Zdunić, G.; Bigović, D.; Šavikin, K. Ultrasound-Assisted Natural Deep Eutectic Solvents Extraction of Bilberry Anthocyanins: Optimization, Bioactivities, and Storage Stability. Plants 2022, 11, 2680. [Google Scholar] [CrossRef]
- Pérez, R.A.; Albero, B. Ultrasound-assisted Extraction Methods for the Determination of Organic Contaminants in Solid and Liquid Samples. TrAC Trends Anal. Chem. 2023, 166, 117204. [Google Scholar] [CrossRef]
- Sajid, M. Dispersive Liquid-Liquid Microextraction: Evolution in Design, Application Areas, and Green Aspects. TrAC Trends Anal. Chem. 2022, 152, 16636. [Google Scholar] [CrossRef]
- Tay, K.S.J.; See, H.H. Recent Advances in Dispersive Liquid-Liquid Microextraction for Pharmaceutical Analysis. Crit. Rev. Anal. Chem. 2024, 21–22. [Google Scholar] [CrossRef]
- Liang, H.; Sun, H.; Shao, C.; Lv, B.; Cao, W.Y.; Zhou, J.X.; Zhu, J.P.; Zhang, Y.Y. Regulation of Nitrogen and Phosphorus Content and Terpenoid Metabolite Accumulation in P. ginseng by Exogenous Strigolactone. Curr. Plant Biol. 2025, 41, 2214–6628. [Google Scholar] [CrossRef]
- Oldroyd, G.E.D.; Leyser, O. A Plant’s Diet, Surviving in A Variable Nutrient Environment. Science 2020, 368, eaba0196. [Google Scholar] [CrossRef] [PubMed]
- Song, Y.; Wan, G.Y.; Wang, J.X.; Zhang, Z.S.; Xia, J.Q.; Sun, L.Q.; Lu, J.; Ma, C.X.; Yu, L.H.; Xiang, C.B.; et al. Balanced Nitrogen–iron Sufficiency Boosts Grain Yield and Nitrogen Use Efficiency by Promoting Tillering. Mol. Plant 2023, 16, 1661–1677. [Google Scholar] [CrossRef] [PubMed]
- Deng, S.R.; Li, J.Y.; Du, Z.Z.; Wu, Z.X.; Yang, J.; Cai, H.M.; Wu, G.B.; Xu, F.S.; Huang, Y.C.; Wang, S.L.; et al. Rice ACID PHOSPHATASE 1 Regulates Pi Stress Adaptation by Maintaining Intracellular Pi Homeostasis. Plant Cell Environ. 2021, 45, 191–205. [Google Scholar] [CrossRef] [PubMed]
- Fang, Z.M.; Ji, Y.Y.; Hu, J.; Guo, R.K.; Sun, S.Y.; Wang, X.L. Strigolactones and Brassinosteroids Antagonistically Regulate the Stability of the D53-OsBZR1 Complex to Determine FC1 Expression in Rice Tillering. Mol. Plant 2020, 13, 586–597. [Google Scholar] [CrossRef]
- Wang, Y.X.; Shang, L.G.; Yu, H.; Zeng, L.G.; Hu, J.; Ni, S.; Rao, Y.C.; Li, S.F.; Chu, J.F.; Meng, X.B.; et al. A Strigolactone Biosynthesis Gene Contributed to the Green Revolution in Rice. Mol. Plant 2020, 13, 923–932. [Google Scholar] [CrossRef]
- Boutet-Mercey, S.; Perreau, F.; Roux, A.; Clavé, G.; Pillot, J.P.; Schmitz-Afonso, I.; Touboul, D.; Mouille, G.; Rameau, C.; Boyer, F.D. Validated Method for Strigolactone Quantification by Ultra High-Performance Liquid Chromatography-Electrospray Ionisation Tandem Mass Spectrometry Using Novel Deuterium Labelled Standards. Phytochem. Anal. 2018, 29, 59–68. [Google Scholar] [CrossRef]
- Rial, C.; Varela, R.M.; Molinillo, J.M.G.; López-Ráez, J.A.; Macías, F.A. A New UHPLC-MS/MS Method for the Direct Determination of Strigolactones in Root Exudates and Extracts. Phytochem. Anal. 2019, 30, 110–116. [Google Scholar] [CrossRef]
- Floková, K.; Shimels, M.; Andreo Jimenez, B.; Bardaro, N.; Strnad, M.; Novák, O.; Bouwmeester, H.J. An Improved Strategy to Analyse Strigolactones in Complex Sample Matrices Using UHPLC-MS/MS. Plant Methods. 2020, 16, 125. [Google Scholar] [CrossRef]
- Xin, P.Y.; Guo, Q.H.; Li, B.B.; Cheng, S.J.; Yan, J.J.; Chu, J.F. A Tailored High-Efficiency Sample Pretreatment Method for Simultaneous Quantification of 10 Classes of Known Endogenous Phytohormones. Plant Commun. 2020, 1, 100047. [Google Scholar] [CrossRef]
- Xie, X.; Kisugi, T.; Yoneyama, K.; Nomura, T.; Akiyama, K.; Uchida, K.; Yokota, T.; McErlean, C.S.P.; Yoneyama, K. Methyl Zealactonoate, A Novel Germination Stimulant for Root Parasitic Weeds Produced by Maize. J. Pestic. Sci. 2017, 42, 58–61. [Google Scholar] [CrossRef]
- Matuszewski, B.K.; Constanzer, M.L.; Chavez-Eng, C.M. Matrix Effect in Quantitative LC/MS/MS Analyses of Biological Fluids: A Method for Determination of Finasteride in Human Plasma at Picogram Per Milliliter Concentrations. Anal. Chem. 1998, 70, 882–889. [Google Scholar] [CrossRef] [PubMed]


| Analytes | Equation of Linear Regression | Linear Range (ng/mL) | R2 | Recovery (%) | Inter-Day Precision (RSD%) | Intra-Day Precision (RSD%) | LODs (pg/g) | LOQs (pg/g) | Matrix Effects(%) | |||
|---|---|---|---|---|---|---|---|---|---|---|---|---|
| Low (1 ng/g) | High (5 ng/g) | Low (1 ng/g) | High (5 ng/g) | Low (1 ng/g) | High (5 ng/g) | |||||||
| Strigol | y = 3.30x + 0.9144 | 0.1–50 | 0.9993 | 83 | 89 | 8.9 | 11.4 | 8.3 | 6.7 | 1.2 | 6.5 | 111.3 |
| Orobanchol | y = 2.11x + 0.1019 | 0.1–50 | 0.9995 | 90 | 91 | 10.2 | 6.3 | 11.4 | 8.6 | 0.8 | 3.5 | 115.2 |
| 5-Deoxystrigol | y = 1.14x + 1.3491 | 0.1–50 | 0.9996 | 96 | 93 | 11.7 | 5.6 | 12.4 | 4.5 | 0.6 | 1.3 | 119.3 |
| Analytes | CK (pg/g) | -P (pg/g) | -N (pg/g) |
|---|---|---|---|
| Strigol | N.D. | N.D. | N.D. |
| Orobanchol | N.D. | 10.6 ± 6.3 | 8.8 ± 3.5 |
| 5-Deoxystrigol | N.D. | 15.5 ± 4.4 | 10.8 ± 2.8 |
| Sample Source | SLs | Extraction Method | Extraction Solvent | LOD | Recovery (%) | Matrix Effect (%) | Reference |
|---|---|---|---|---|---|---|---|
| Pea (Pisum sativum) | orobanchol, orobanchyl acetate, and fabacyl acetate | LLE | ethyl acetate | 0.14–4.94 μg/L | 57.3–77.0 | 66.4–162.1 | [36] |
| Tomato (Solanum lycopersicum) | 7-oxoorobanchyl acetate, solanacol, orobanchol, strigol, fabacyl acetate, orobanchyl acetate, and 5-DS | LLE | ethyl acetate | 0.02–0.96 μg/L | 80.2–108.1 | Not explicitly mentioned | [37] |
| Sorghum (Sorghum bicolor), rice (Oryza sativa), pea (Pisum sativum), and tomato (Solanum lycopersicum) | strigol, solanacol, orobanchol, sorgomol, GR24, sorgolactone, 4-DO, 5-DS, carlactonoic acid, carlactone | Rapid extraction with organic solvents (e.g., acetone) followed by single-step preconcentration on polymeric RP SPE sorbent | 5% acetonitrile/water (v/v) for root exudates, 60% acetone/water (v/v) for root tissues | 0.125–2.5 fmol | 83.1–95.6 | 61.8–102.5 | [38] |
| Rice (Oryza sativa) | 5-DS | Tailored solid-phase extraction (SPE) procedure based on physicochemical properties | 90% methanol | 0.29 pg | 45.6–70.5 | 89.1–96.7 | [39] |
| Rice (Oryza sativa) | Strigol, 5-DS, Orobanchol | DLLME-SFO | 1-undecanol | 0.6–1.2 pg/g | 82.6–96.3 | 111.3–119.3 | This work |
| Analytes | RT (min) | Parent Ion(m/z) | Product Ion (m/z) | Collision Energy(eV) | RF Lens (V) |
|---|---|---|---|---|---|
| Strigol | 4.88 | 369.23 | 272.05 */257.14 | 15.87/24.29 | 169 |
| Orobanchol | 5.01 | 347.25 | 314.96 */328.94 | 9.00/10.01 | 142 |
| 5-Deoxystrigol | 6.87 | 331.24 | 216.18 */97.03 | 16.20/20.71 | 118 |
| GR24(IS) | 8.15 | 321.18 | 223.91 */303.00 | 14.48/11.95 | 184 |
Disclaimer/Publisher’s Note: The statements, opinions and data contained in all publications are solely those of the individual author(s) and contributor(s) and not of MDPI and/or the editor(s). MDPI and/or the editor(s) disclaim responsibility for any injury to people or property resulting from any ideas, methods, instructions or products referred to in the content. |
© 2025 by the authors. Licensee MDPI, Basel, Switzerland. This article is an open access article distributed under the terms and conditions of the Creative Commons Attribution (CC BY) license (https://creativecommons.org/licenses/by/4.0/).
Share and Cite
Zhu, X.; Wu, Z.; Deng, X.; Liao, Z.; Wang, R.; Luo, Z. Development of Dispersive Liquid–Liquid Microextraction Method Based on Solidification of Floating Organic Droplets for Rapid Determination of Three Strigolactones in Rice (Oryza sativa L.) Using Ultra-High-Performance Liquid Chromatography–Tandem Mass Spectrometry. Int. J. Mol. Sci. 2025, 26, 4337. https://doi.org/10.3390/ijms26094337
Zhu X, Wu Z, Deng X, Liao Z, Wang R, Luo Z. Development of Dispersive Liquid–Liquid Microextraction Method Based on Solidification of Floating Organic Droplets for Rapid Determination of Three Strigolactones in Rice (Oryza sativa L.) Using Ultra-High-Performance Liquid Chromatography–Tandem Mass Spectrometry. International Journal of Molecular Sciences. 2025; 26(9):4337. https://doi.org/10.3390/ijms26094337
Chicago/Turabian StyleZhu, Xianxin, Zihan Wu, Xunzhi Deng, Ze Liao, Ruozhong Wang, and Zhoufei Luo. 2025. "Development of Dispersive Liquid–Liquid Microextraction Method Based on Solidification of Floating Organic Droplets for Rapid Determination of Three Strigolactones in Rice (Oryza sativa L.) Using Ultra-High-Performance Liquid Chromatography–Tandem Mass Spectrometry" International Journal of Molecular Sciences 26, no. 9: 4337. https://doi.org/10.3390/ijms26094337
APA StyleZhu, X., Wu, Z., Deng, X., Liao, Z., Wang, R., & Luo, Z. (2025). Development of Dispersive Liquid–Liquid Microextraction Method Based on Solidification of Floating Organic Droplets for Rapid Determination of Three Strigolactones in Rice (Oryza sativa L.) Using Ultra-High-Performance Liquid Chromatography–Tandem Mass Spectrometry. International Journal of Molecular Sciences, 26(9), 4337. https://doi.org/10.3390/ijms26094337