
The Genetic Elements of the Obesity Paradox in Atherosclerosis Identified in an Intercross Between Hyperlipidemic Mouse Strains
 and
and 
Abstract
1. Introduction
2. Results
3. Discussion
4. Methods
Supplementary Materials
Author Contributions
Funding
Institutional Review Board Statement
Informed Consent Statement
Data Availability Statement
Conflicts of Interest
References
- Tremmel, M.; Gerdtham, U.G.; Nilsson, P.M.; Saha, S. Economic Burden of Obesity: A Systematic Literature Review. Int. J. Environ. Res. Public. Health 2017, 14, 435. [Google Scholar] [CrossRef] [PubMed]
- Labounty, T.M.; Gomez, M.J.; Achenbach, S.; Al-Mallah, M.; Berman, D.S.; Budoff, M.J.; Cademartiri, F.; Callister, T.Q.; Chang, H.-J.; Cheng, V.; et al. Body mass index and the prevalence, severity, and risk of coronary artery disease: An international multicentre study of 13 874 patients. Eur. Heart J. Cardiovasc. Imaging 2013, 14, 456–463. [Google Scholar] [CrossRef] [PubMed]
- Atique, S.M.; Shadbolt, B.; Marley, P.; Farshid, A. Association Between Body Mass Index and Age of Presentation With Symptomatic Coronary Artery Disease. Clin. Cardiol. 2016, 39, 653–657. [Google Scholar] [CrossRef]
- Angelantonio, E.D.; Bhupathiraju, S.N.; Wormser, D.; Gao, P.; Kaptoge, S.; de Gonzalez, A.B.; Cairns, B.J.; Huxley, R.; Jackson, C.L.; Joshy, G.; et al. Body-mass index and all-cause mortality: Individual-participant-data meta-analysis of 239 prospective studies in four continents. Lancet 2016, 388, 776–786. [Google Scholar] [CrossRef]
- Lavie, C.J.; Oktay, A.A.; Milani, R.V. The obesity paradox and obesity severity in elderly STEMI patients. Eur. Heart J.-Qual. Care Clin. Outcomes 2017, 3, 166–167. [Google Scholar] [CrossRef] [PubMed]
- Oktay, A.A.; Lavie, C.J.; Kokkinos, P.F.; Parto, P.; Pandey, A.; Ventura, H.O. The Interaction of Cardiorespiratory Fitness With Obesity and the Obesity Paradox in Cardiovascular Disease. Prog. Cardiovasc. Dis. 2017, 60, 30–44. [Google Scholar] [CrossRef]
- Panic, A.; Stanimirovic, J.; Sudar-Milovanovic, E.; Isenovic, E.R. Oxidative stress in obesity and insulin resistance. Explor. Med. 2022, 3, 58–70. [Google Scholar] [CrossRef]
- Antonopoulos, A.S.; Tousoulis, D. The molecular mechanisms of obesity paradox. Cardiovasc. Res. 2017, 113, 1074–1086. [Google Scholar] [CrossRef] [PubMed]
- Lyall, D.M.; Celis-Morales, C.; Ward, J.; Iliodromiti, S.; Anderson, J.J.; Gill, J.M.R.; Smith, D.J.; Ntuk, U.E.; Mackay, D.F.; Holmes, M.V.; et al. Association of Body Mass Index With Cardiometabolic Disease in the UK Biobank. JAMA Cardiol. 2017, 2, 882–889. [Google Scholar] [CrossRef]
- Gruberg, L.; Weissman, N.J.; Waksman, R.; Fuchs, S.; Deible, R.; Pinnow, E.E.; Ahmed, L.M.; Kent, K.M.; Pichard, A.D.; Suddath, W.O.; et al. The impact of obesity on the short-term and long-term outcomes after percutaneous coronary intervention: The obesity paradox? J. Am. Coll. Cardiol. 2002, 39, 578–584. [Google Scholar] [CrossRef]
- Romero-Corral, A.; Montori, V.M.; Somers, V.K.; Korinek, J.; Thomas, R.J.; Allison, T.G.; Mookadam, F.; Lopez-Jimenez, F. Association of bodyweight with total mortality and with cardiovascular events in coronary artery disease: A systematic review of cohort studies. Lancet 2006, 368, 666–678. [Google Scholar] [CrossRef] [PubMed]
- Niedziela, J.; Hudzik, B.; Niedziela, N.; Gąsior, M.; Gierlotka, M.; Wasilewski, J.; Myrda, K.; Lekston, A.; Poloński, L.; Rozentryt, P. The obesity paradox in acute coronary syndrome: A meta-analysis. Eur. J. Epidemiol. 2014, 29, 801–812. [Google Scholar] [CrossRef] [PubMed]
- Wang, L.; Liu, W.; He, X.; Chen, Y.; Lu, J.; Liu, K.; Cao, K.; Yin, P. Association of overweight and obesity with patient mortality after acute myocardial infarction: A meta-analysis of prospective studies. Int. J. Obes. 2016, 40, 220–228. [Google Scholar] [CrossRef]
- Takagi, H.; Umemoto, T.; ALICE (All-Literature Investigation of Cardiovascular Evidence) Group. Overweight, but not obesity, paradox on mortality following coronary artery bypass grafting. J. Cardiol. 2016, 68, 215–221. [Google Scholar] [CrossRef] [PubMed]
- Vecchié, A.; Dallegri, F.; Carbone, F.; Bonaventura, A.; Liberale, L.; Portincasa, P.; Frühbeck, G.; Montecucco, F. Obesity phenotypes and their paradoxical association with cardiovascular diseases. Eur. J. Intern. Med. 2018, 48, 6–17. [Google Scholar] [CrossRef]
- Niraj, A.; Pradhan, J.; Fakhry, H.; Veeranna, V.; Afonso, L. Severity of coronary artery disease in obese patients undergoing coronary angiography: “obesity paradox” revisited. Clin. Cardiol. 2007, 30, 391–396. [Google Scholar] [CrossRef]
- Brodsky, S.V.; Barth, R.F.; Mo, X.; Yildiz, V.; Allenby, P.; Ivanov, I.; Moore, S.; Hitchcock, C.L.; Smith, S.; Sachak, T.; et al. An obesity paradox: An inverse correlation between body mass index and atherosclerosis of the aorta. Cardiovasc. Pathol. 2016, 25, 515–520. [Google Scholar] [CrossRef]
- Drake, T.A.; Schadt, E.; Hannani, K.; Kabo, J.M.; Krass, K.; Colinayo, V.; Greaser, L.E.; Goldin, J.; Lusis, A.J. Genetic loci determining bone density in mice with diet-induced atherosclerosis. Physiol. Genom. 2001, 5, 205–215. [Google Scholar] [CrossRef]
- Wang, S.S.; Schadt, E.E.; Wang, H.; Wang, X.; Ingram-Drake, L.; Shi, W.; Drake, T.A.; Lusis, A.J. Identification of pathways for atherosclerosis in mice: Integration of quantitative trait locus analysis and global gene expression data. Circ. Res. 2007, 101, e11–e30. [Google Scholar] [CrossRef]
- Chagari, B.; Shi, L.J.; Dao, E.; An, A.; Chen, M.-H.; Bao, Y.; Shi, W. Genetic connection of carotid atherosclerosis with coat color and body weight in an intercross between hyperlipidemic mouse strains. Physiol. Genom. 2022, 54, 166–176. [Google Scholar] [CrossRef]
- Mehrabian, M.; Wen, P.Z.; Fisler, J.; Davis, R.C.; Lusis, A.J. Genetic loci controlling body fat, lipoprotein metabolism, and insulin levels in a multifactorial mouse model. J. Clin. Investig. 1998, 101, 2485–2496. [Google Scholar] [CrossRef] [PubMed]
- Kuhn, T.; Kaiser, K.; Lebek, S.; Altenhofen, D.; Knebel, B.; Herwig, R.; Rasche, A.; Pelligra, A.; Görigk, S.; Khuong, J.M.-A.; et al. Comparative genomic analyses of multiple backcross mouse populations suggest SGCG as a novel potential obesity-modifier gene. Hum. Mol. Genet. 2022, 31, 4019–4033. [Google Scholar] [CrossRef] [PubMed]
- Li, Y.; Tesson, B.M.; Churchill, G.A.; Jansen, R.C. Critical reasoning on causal inference in genome-wide linkage and association studies. Trends Genet. 2010, 26, 493–498. [Google Scholar] [CrossRef] [PubMed]
- Smith, J.D.; Bhasin, J.M.; Baglione, J.; Settle, M.; Xu, Y.; Barnard, J. Atherosclerosis susceptibility loci identified from a strain intercross of apolipoprotein E-deficient mice via a high-density genome scan. Arterioscler. Thromb. Vasc. Biol. 2006, 26, 597–603. [Google Scholar] [CrossRef]
- Kayashima, Y.; Tomita, H.; Zhilicheva, S.; Kim, S.; Kim, H.S.; Bennett, B.J.; Maeda, N. Quantitative trait loci affecting atherosclerosis at the aortic root identified in an intercross between DBA2J and 129S6 apolipoprotein E-null mice. PLoS ONE 2014, 9, e88274. [Google Scholar] [CrossRef]
- Tomita, H.; Zhilicheva, S.; Kim, S.; Maeda, N. Aortic arch curvature and atherosclerosis have overlapping quantitative trait loci in a cross between 129S6/SvEvTac and C57BL/6J apolipoprotein E-null mice. Circ. Res. 2010, 106, 1052–1060. [Google Scholar] [CrossRef]
- Abramson, A.M.; Shi, L.J.; Lee, R.N.; Chen, M.-H.; Shi, W. Phenotypic and Genetic Evidence for a More Prominent Role of Blood Glucose than Cholesterol in Atherosclerosis of Hyperlipidemic Mice. Cells 2022, 11, 2669. [Google Scholar] [CrossRef]
- Itoi-Babaya, M.; Ikegami, H.; Fujisawa, T.; Ueda, H.; Nojima, K.; Babaya, N.; Kobayashi, M.; Noso, S.; Kawaguchi, Y.; Yamaji, K.; et al. Fatty liver and obesity: Phenotypically correlated but genetically distinct traits in a mouse model of type 2 diabetes. Diabetologia 2007, 50, 1641. [Google Scholar] [CrossRef]
- Reed, D.R.; McDaniel, A.H.; Avigdor, M.; Bachmanov, A.A. QTL for body composition on chromosome 7 detected using a chromosome substitution mouse strain. Obesity 2008, 16, 483–487. [Google Scholar] [CrossRef]
- Yi, N.; Diament, A.; Chiu, S.; Kim, K.; Allison, D.B.; Fisler, J.S.; Warden, C.H. Characterization of epistasis influencing complex spontaneous obesity in the BSB model. Genetics 2004, 167, 399–409. [Google Scholar] [CrossRef]
- York, B.; Lei, K.; West, D.B. Sensitivity to dietary obesity linked to a locus on chromosome 15 in a CAST/Ei x C57BL/6J F2 intercross. Mamm. Genome 1996, 7, 677–681. [Google Scholar] [CrossRef] [PubMed]
- West, D.B.; Goudey-Lefevre, J.; York, B.; Truett, G.E. Dietary obesity linked to genetic loci on chromosomes 9 and 15 in a polygenic mouse model. J. Clin. Investig. 1994, 94, 1410–1416. [Google Scholar] [CrossRef] [PubMed]
- Warden, C.H.; Fisler, J.S.; Shoemaker, S.M.; Wen, P.Z.; Svenson, K.L.; Pace, M.J.; Lusis, A.J. Identification of four chromosomal loci determining obesity in a multifactorial mouse model. J. Clin. Investig. 1995, 95, 1545–1552. [Google Scholar] [CrossRef]
- Bennett, B.J.; Davis, R.C.; Civelek, M.; Orozco, L.; Wu, J.; Qi, H.; Pan, C.; Packard, R.R.; Eskin, E.; Yan, M.; et al. Genetic Architecture of Atherosclerosis in Mice: A Systems Genetics Analysis of Common Inbred Strains. PLoS Genet. 2015, 11, e1005711. [Google Scholar] [CrossRef]
- Kim, M.; Huda, M.N.; Evans, L.W.; Que, E.; Gertz, E.R.; Maeda-Smithies, N.; Bennett, B.J. Integrative analysis of hepatic transcriptional profiles reveals genetic regulation of atherosclerosis in hyperlipidemic Diversity Outbred-F1 mice. Sci. Rep. 2023, 13, 9475. [Google Scholar] [CrossRef]
- Makhanova, N.; Morgan, A.P.; Kayashima, Y.; Makhanov, A.; Hiller, S.; Zhilicheva, S.; Xu, L.; Pardo-Manuel de Villena, F.; Maeda, N. Genetic architecture of atherosclerosis dissected by QTL analyses in three F2 intercrosses of apolipoprotein E-null mice on C57BL6/J, DBA/2J and 129S6/SvEvTac backgrounds. PLoS ONE 2017, 12, e0182882. [Google Scholar] [CrossRef]
- Jones, M.B.; An, A.; Shi, L.J.; Shi, W. Regional Variation in Genetic Control of Atherosclerosis in Hyperlipidemic Mice. G3 Genes Genomes Genet. 2020, 10, 4679–4689. [Google Scholar] [CrossRef] [PubMed]
- Grainger, A.T.; Jones, M.B.; Li, J.; Chen, M.-H.; Manichaikul, A.; Shi, W. Genetic analysis of atherosclerosis identifies a major susceptibility locus in the major histocompatibility complex of mice. Atherosclerosis 2016, 254, 124–132. [Google Scholar] [CrossRef]
- Shi, W.; Li, J.; Bao, K.; Chen, M.-H.; Liu, Z. Ldlr-Deficient Mice with an Atherosclerosis-Resistant Background Develop Severe Hyperglycemia and Type 2 Diabetes on a Western-Type Diet. Biomedicines 2022, 10, 1429. [Google Scholar] [CrossRef]
- Mehrabian, M.; Wong, J.; Wang, X.; Jiang, Z.; Shi, W.; Fogelman, A.M.; Lusis, A.J. Genetic locus in mice that blocks development of atherosclerosis despite extreme hyperlipidemia. Circ. Res. 2001, 89, 125–130. [Google Scholar] [CrossRef]
- Welch, C.L.; Bretschger, S.; Latib, N.; Bezouevski, M.; Guo, Y.; Pleskac, N.; Liang, C.P.; Barlow, C.; Dansky, H.; Breslow, J.L.; et al. Localization of atherosclerosis susceptibility loci to chromosomes 4 and 6 using the Ldlr knockout mouse model. Proc. Natl. Acad. Sci. USA 2001, 98, 7946–7951. [Google Scholar] [CrossRef] [PubMed]
- Wang, C.-Y.; Liao, J.K. A mouse model of diet-induced obesity and insulin resistance. Methods Mol Biol. 2012, 821, 421–433. [Google Scholar] [CrossRef] [PubMed]
- Shi, L.J.; Tang, X.; He, J.; Shi, W. Hyperlipidemia Influences the Accuracy of Glucometer-Measured Blood Glucose Concentrations in Genetically Diverse Mice. Am. J. Med. Sci. 2021, 362, 297–302. [Google Scholar] [CrossRef] [PubMed]
- Broman, K.W.; Sen, S.; Owens, S.E.; Manichaikul, A.; Southard-Smith, E.M.; Churchill, G.A. The X chromosome in quantitative trait locus mapping. Genetics 2006, 174, 2151–2158. [Google Scholar] [CrossRef]
- Leduc, M.S.; Hageman, R.S.; Verdugo, R.A.; Tsaih, S.W.; Walsh, K.; Churchill, G.A.; Paigen, B. Integration of QTL and bioinformatic tools to identify candidate genes for triglycerides in mice. J. Lipid Res. 2011, 52, 1672–1682. [Google Scholar] [CrossRef]


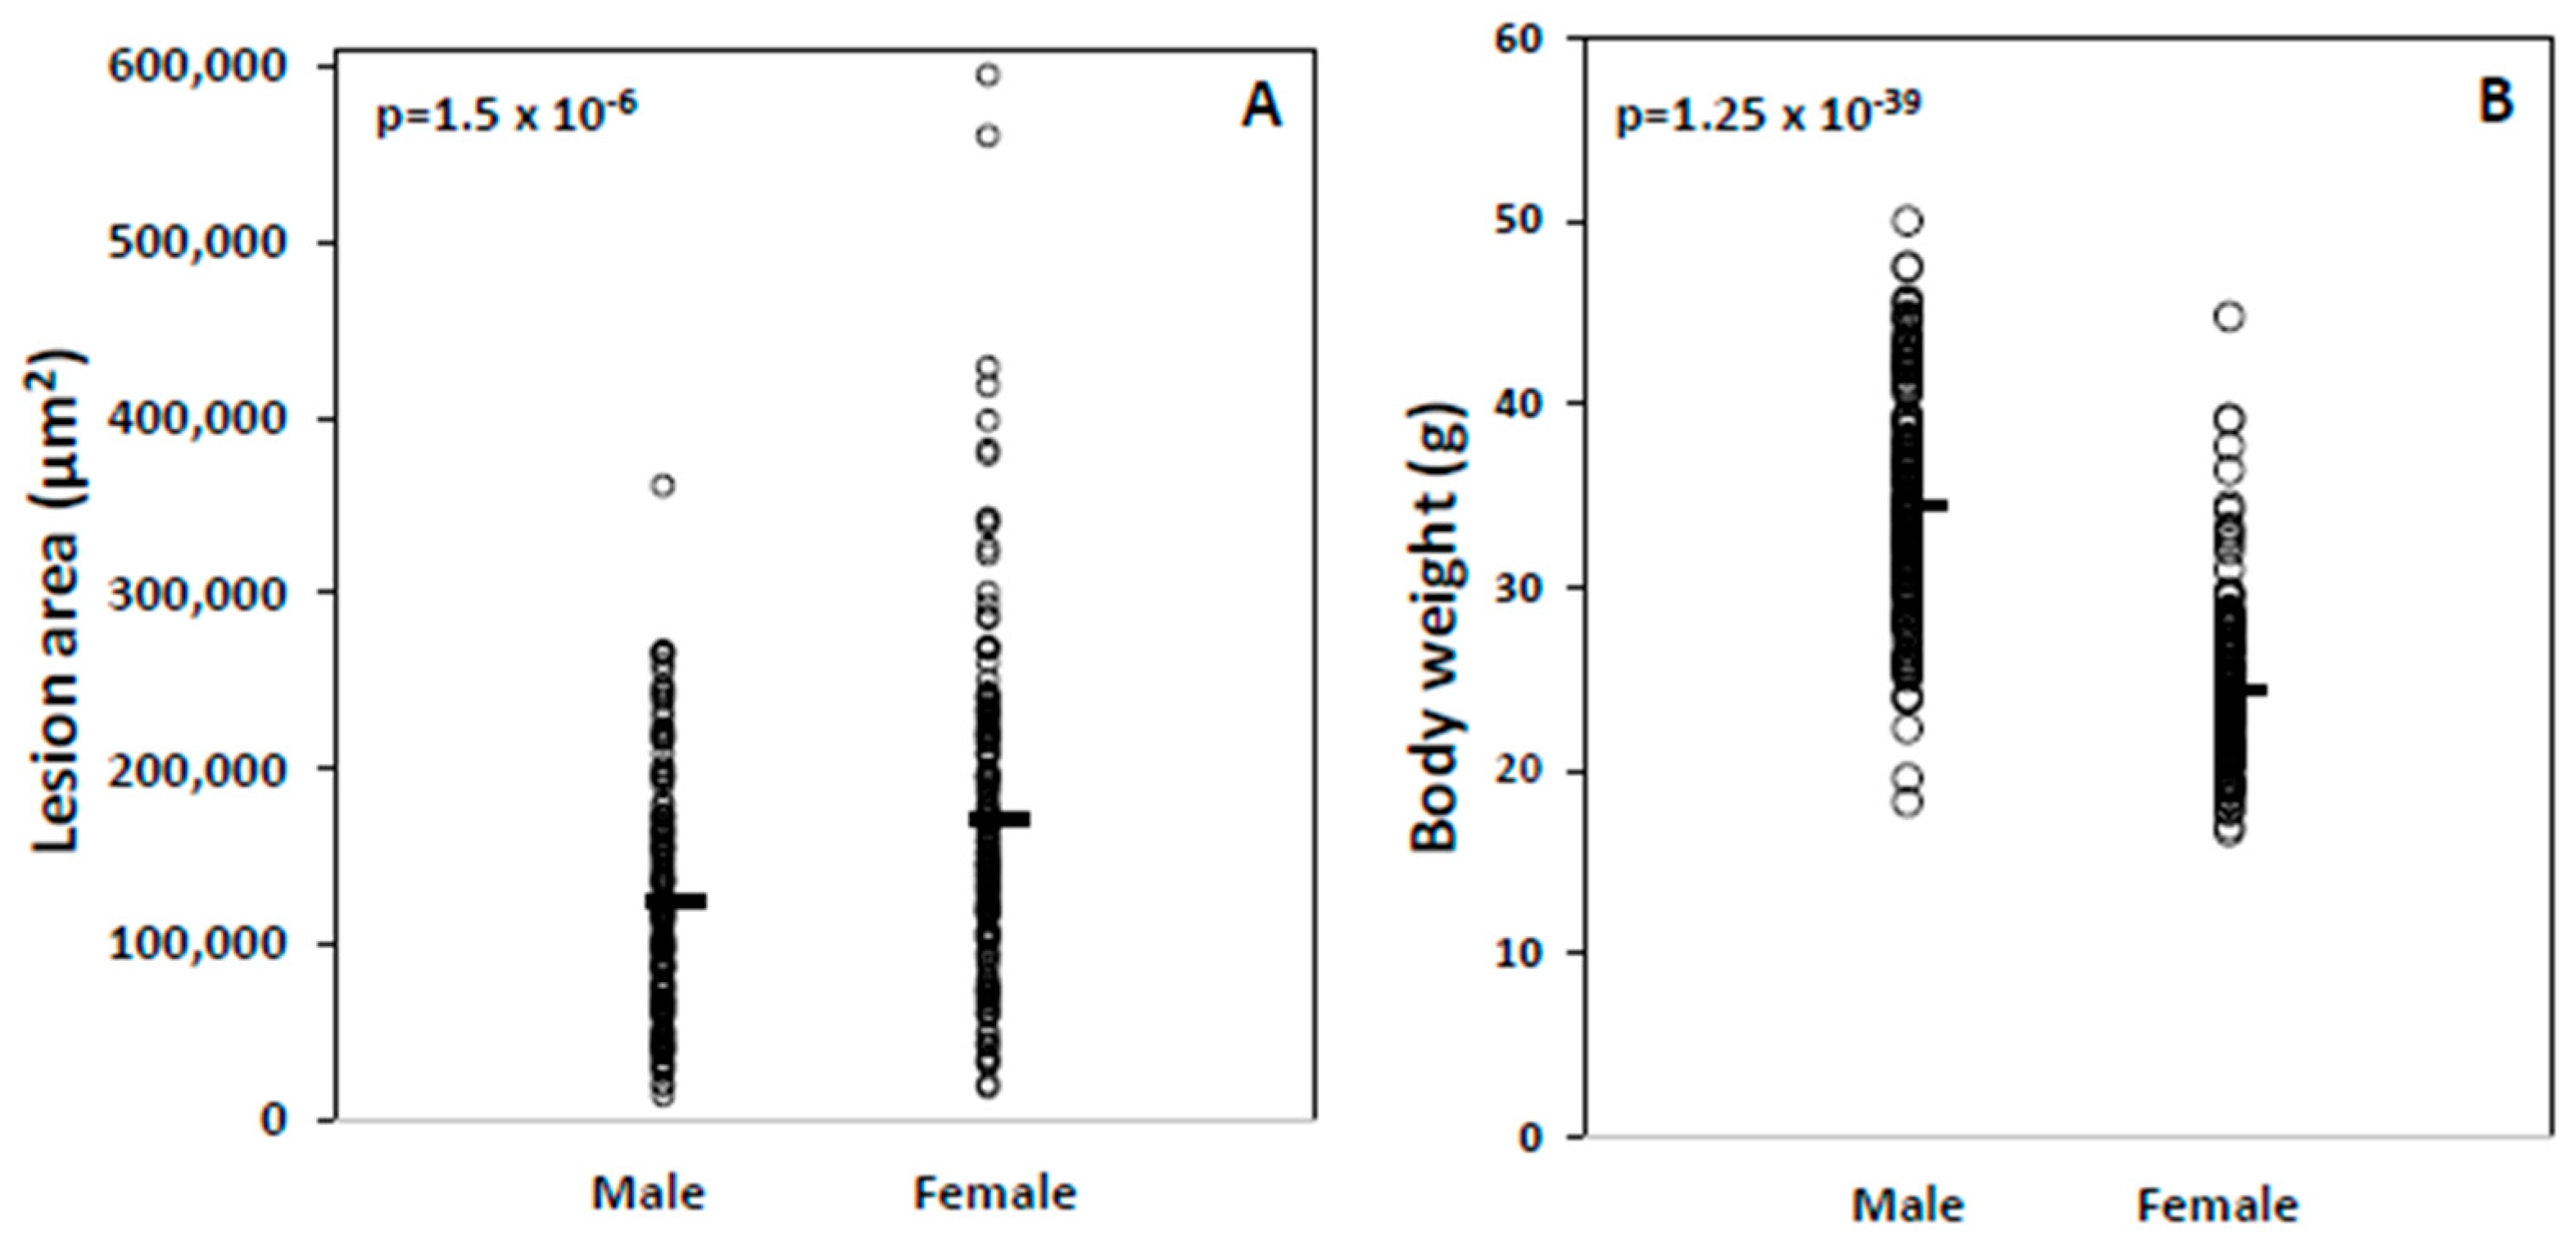
| Phenotype | Male | SD | Female | SD | p Value |
|---|---|---|---|---|---|
| Weight | 34.5 | 6.2 | 24.4 | 4.7 | 1.25 × 10−39 |
| Coat color | 1.3 | 0.9 | 1.3 | 0.9 | 0.69 |
| Atherosclerosis | 123,721 | 68,875 | 171,219 | 96,504 | 1.53 × 10⁻⁶ |
| Total Cholesterol (nonfast chow) | 355.7 | 87.0 | 415.8 | 105.0 | 1.42 × 10⁻⁷ |
| Non-HDL (nonfast chow) | 317.0 | 86.7 | 390.4 | 103.9 | 1.57 × 10⁻¹⁰ |
| Triglycerides (nonfast chow) | 93.8 | 33.0 | 95.8 | 33.0 | 0.61 |
| HDL (nonfast chow) | 38.7 | 14.0 | 25.4 | 11.9 | 1.3 × 10⁻¹⁶ |
| Glucose (nonfast chow) | 277.4 | 44.4 | 281.3 | 42.2 | 0.44 |
| Total Cholesterol (nonfast Western) | 1206.2 | 276.3 | 1184.9 | 225.6 | 0.47 |
| Non-HDL (nonfast Western) | 1176.5 | 277.3 | 1168.3 | 228.7 | 0.78 |
| Triglycerides (nonfast Western) | 162.1 | 72.8 | 120.4 | 45.8 | 1.29 × 10⁻⁸ |
| HDL (nonfast Western) | 29.6 | 12.4 | 16.6 | 9.8 | 2.36 × 10⁻²⁰ |
| Glucose (nonfast Western) | 391.4 | 134.4 | 313.4 | 92.8 | 1.91 × 10⁻⁸ |
| Total cholesterol (fast Western) | 1232.5 | 480.7 | 1192.9 | 373.2 | 0.43 |
| Non-HDL (fast Western) | 1204.8 | 483.1 | 1177.5 | 373.4 | 0.59 |
| Triglycerides (fast Western) | 185.6 | 107.4 | 132.9 | 62.9 | 6.86 × 10⁻⁷ |
| HDL (fast Western) | 27.7 | 20.2 | 15.5 | 10.8 | 9.3 × 10⁻¹⁰ |
| Glucose (fast Western) | 368.3 | 168.3 | 296.0 | 121.1 | 3.42 × 10⁻⁵ |
| Trait | R (♂ + ♀) | P (♂ + ♀) | R (♀) | P (♀) | R (♂) | P (♂) |
|---|---|---|---|---|---|---|
| Body weight | −0.286 | 0.013 | −0.076 | 0.351 | −0.242 | 0.0036 |
| Coat color | −0.056 | 0.366 | −0.064 | 0.429 | 0.038 | 0.659 |
| LDL (chow, nonfast) | 0.083 | 0.777 | 0.038 | 0.644 | 0.019 | 0.821 |
| HDL (chow, nonfast) | −0.069 | 0.249 | −0.088 | 0.277 | 0.045 | 0.597 |
| Triglycerides (chow, nonfast) | −0.132 | 0.012 | −0.249 | 0.0019 | 0.004 | 0.962 |
| Glucose (chow, nonfast) | 0.013 | 0.980 | 0.087 | 0.281 | 0.130 | 0.121 |
| LDL (Western, nonfast) | 0.024 | 0.634 | 0.041 | 0.611 | 0.117 | 0.165 |
| HDL (Western, nonfast) | −0.130 | 0.867 | −0.049 | 0.545 | −0.078 | 0.353 |
| Triglycerides (Western, nonfast) | −0.031 | 0.279 | 0.071 | 0.381 | 0.200 | 0.016 |
| Glucose (Western, nonfast) | −0.011 | 0.154 | 0.014 | 0.860 | 0.165 | 0.049 |
| LDL (Western, fast) | 0.048 | 0.315 | 0.065 | 0.423 | 0.056 | 0.510 |
| HDL (Western, fast) | −0.139 | 0.432 | −0.133 | 0.102 | 0.014 | 0.871 |
| Triglycerides (Western, fast) | −0.005 | 0.171 | 0.057 | 0.483 | 0.118 | 0.164 |
| Glucose (Western, fast) | 0.076 | 0.009 | 0.120 | 0.137 | 0.203 | 0.015 |
| Locus Name | Chr | Peak (Mb) | 95% CI (Mb) | SNP ID | LOD (♂ + ♀) | Allele Effect | Allele Effect | ||||||
|---|---|---|---|---|---|---|---|---|---|---|---|---|---|
| BB (♀) | H (♀) | LL (♀) | BB (♂) | H (♂) | LL (♂) | Mode of Inheritance | High Allele | ||||||
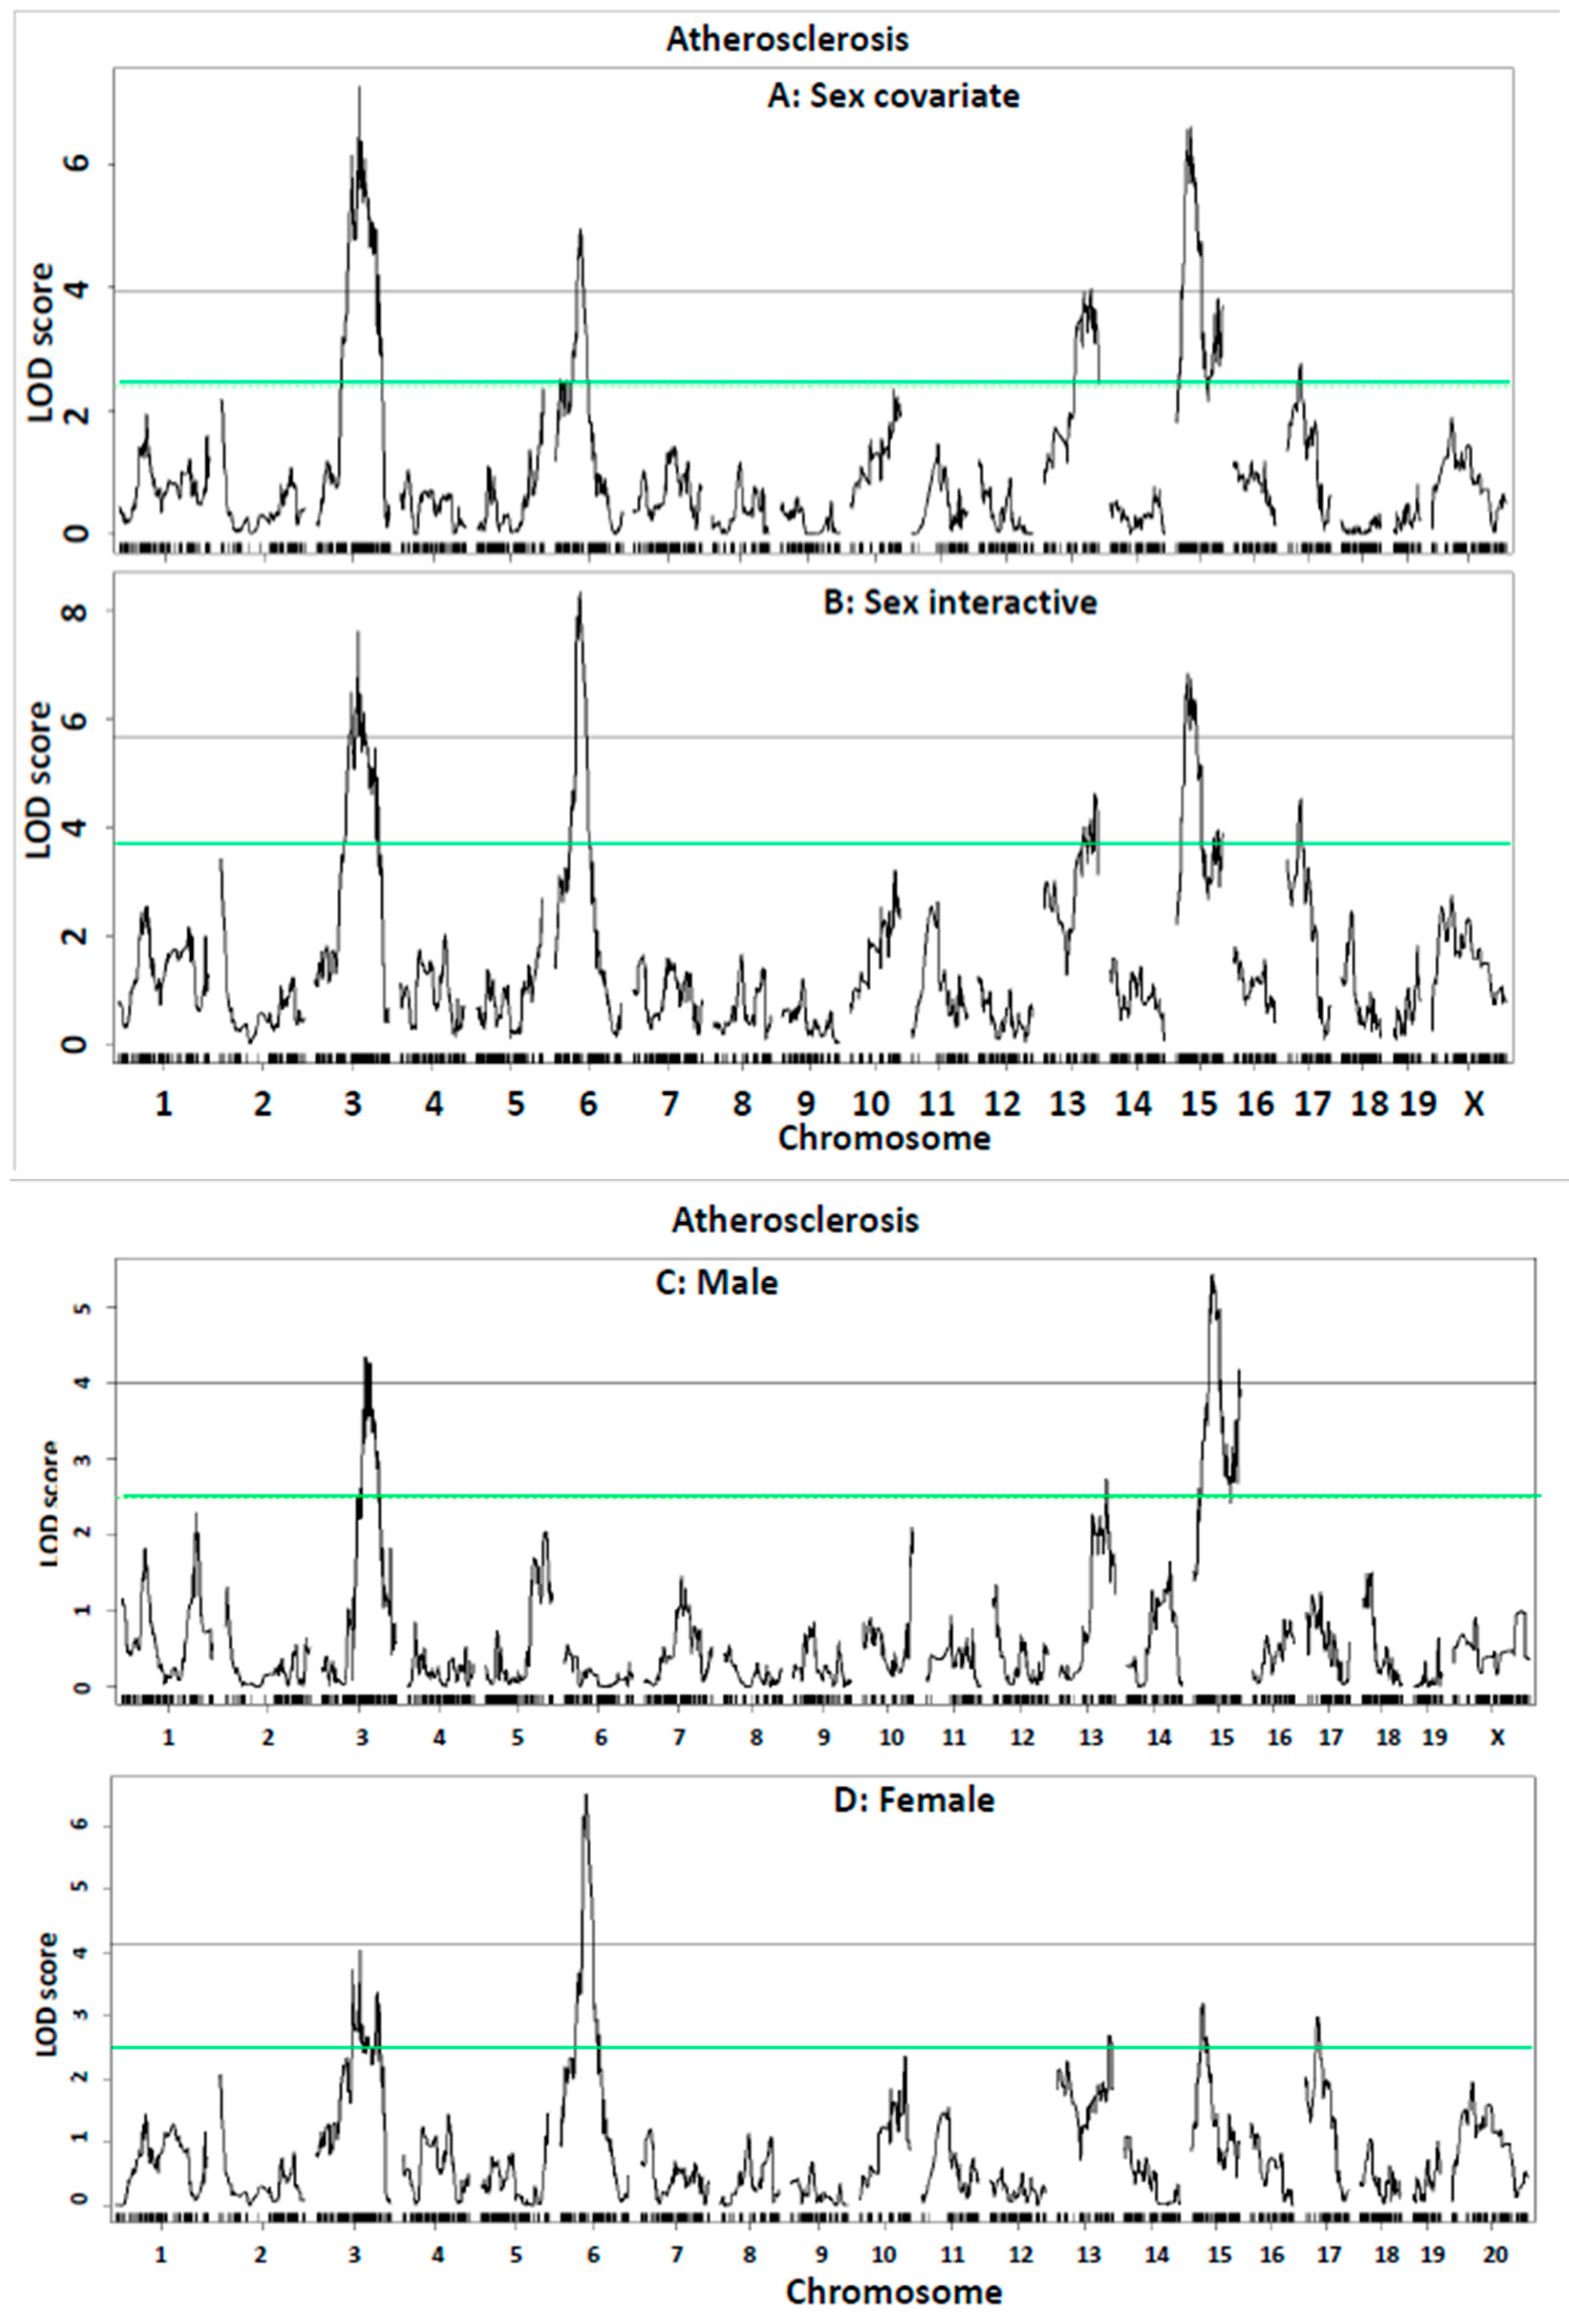
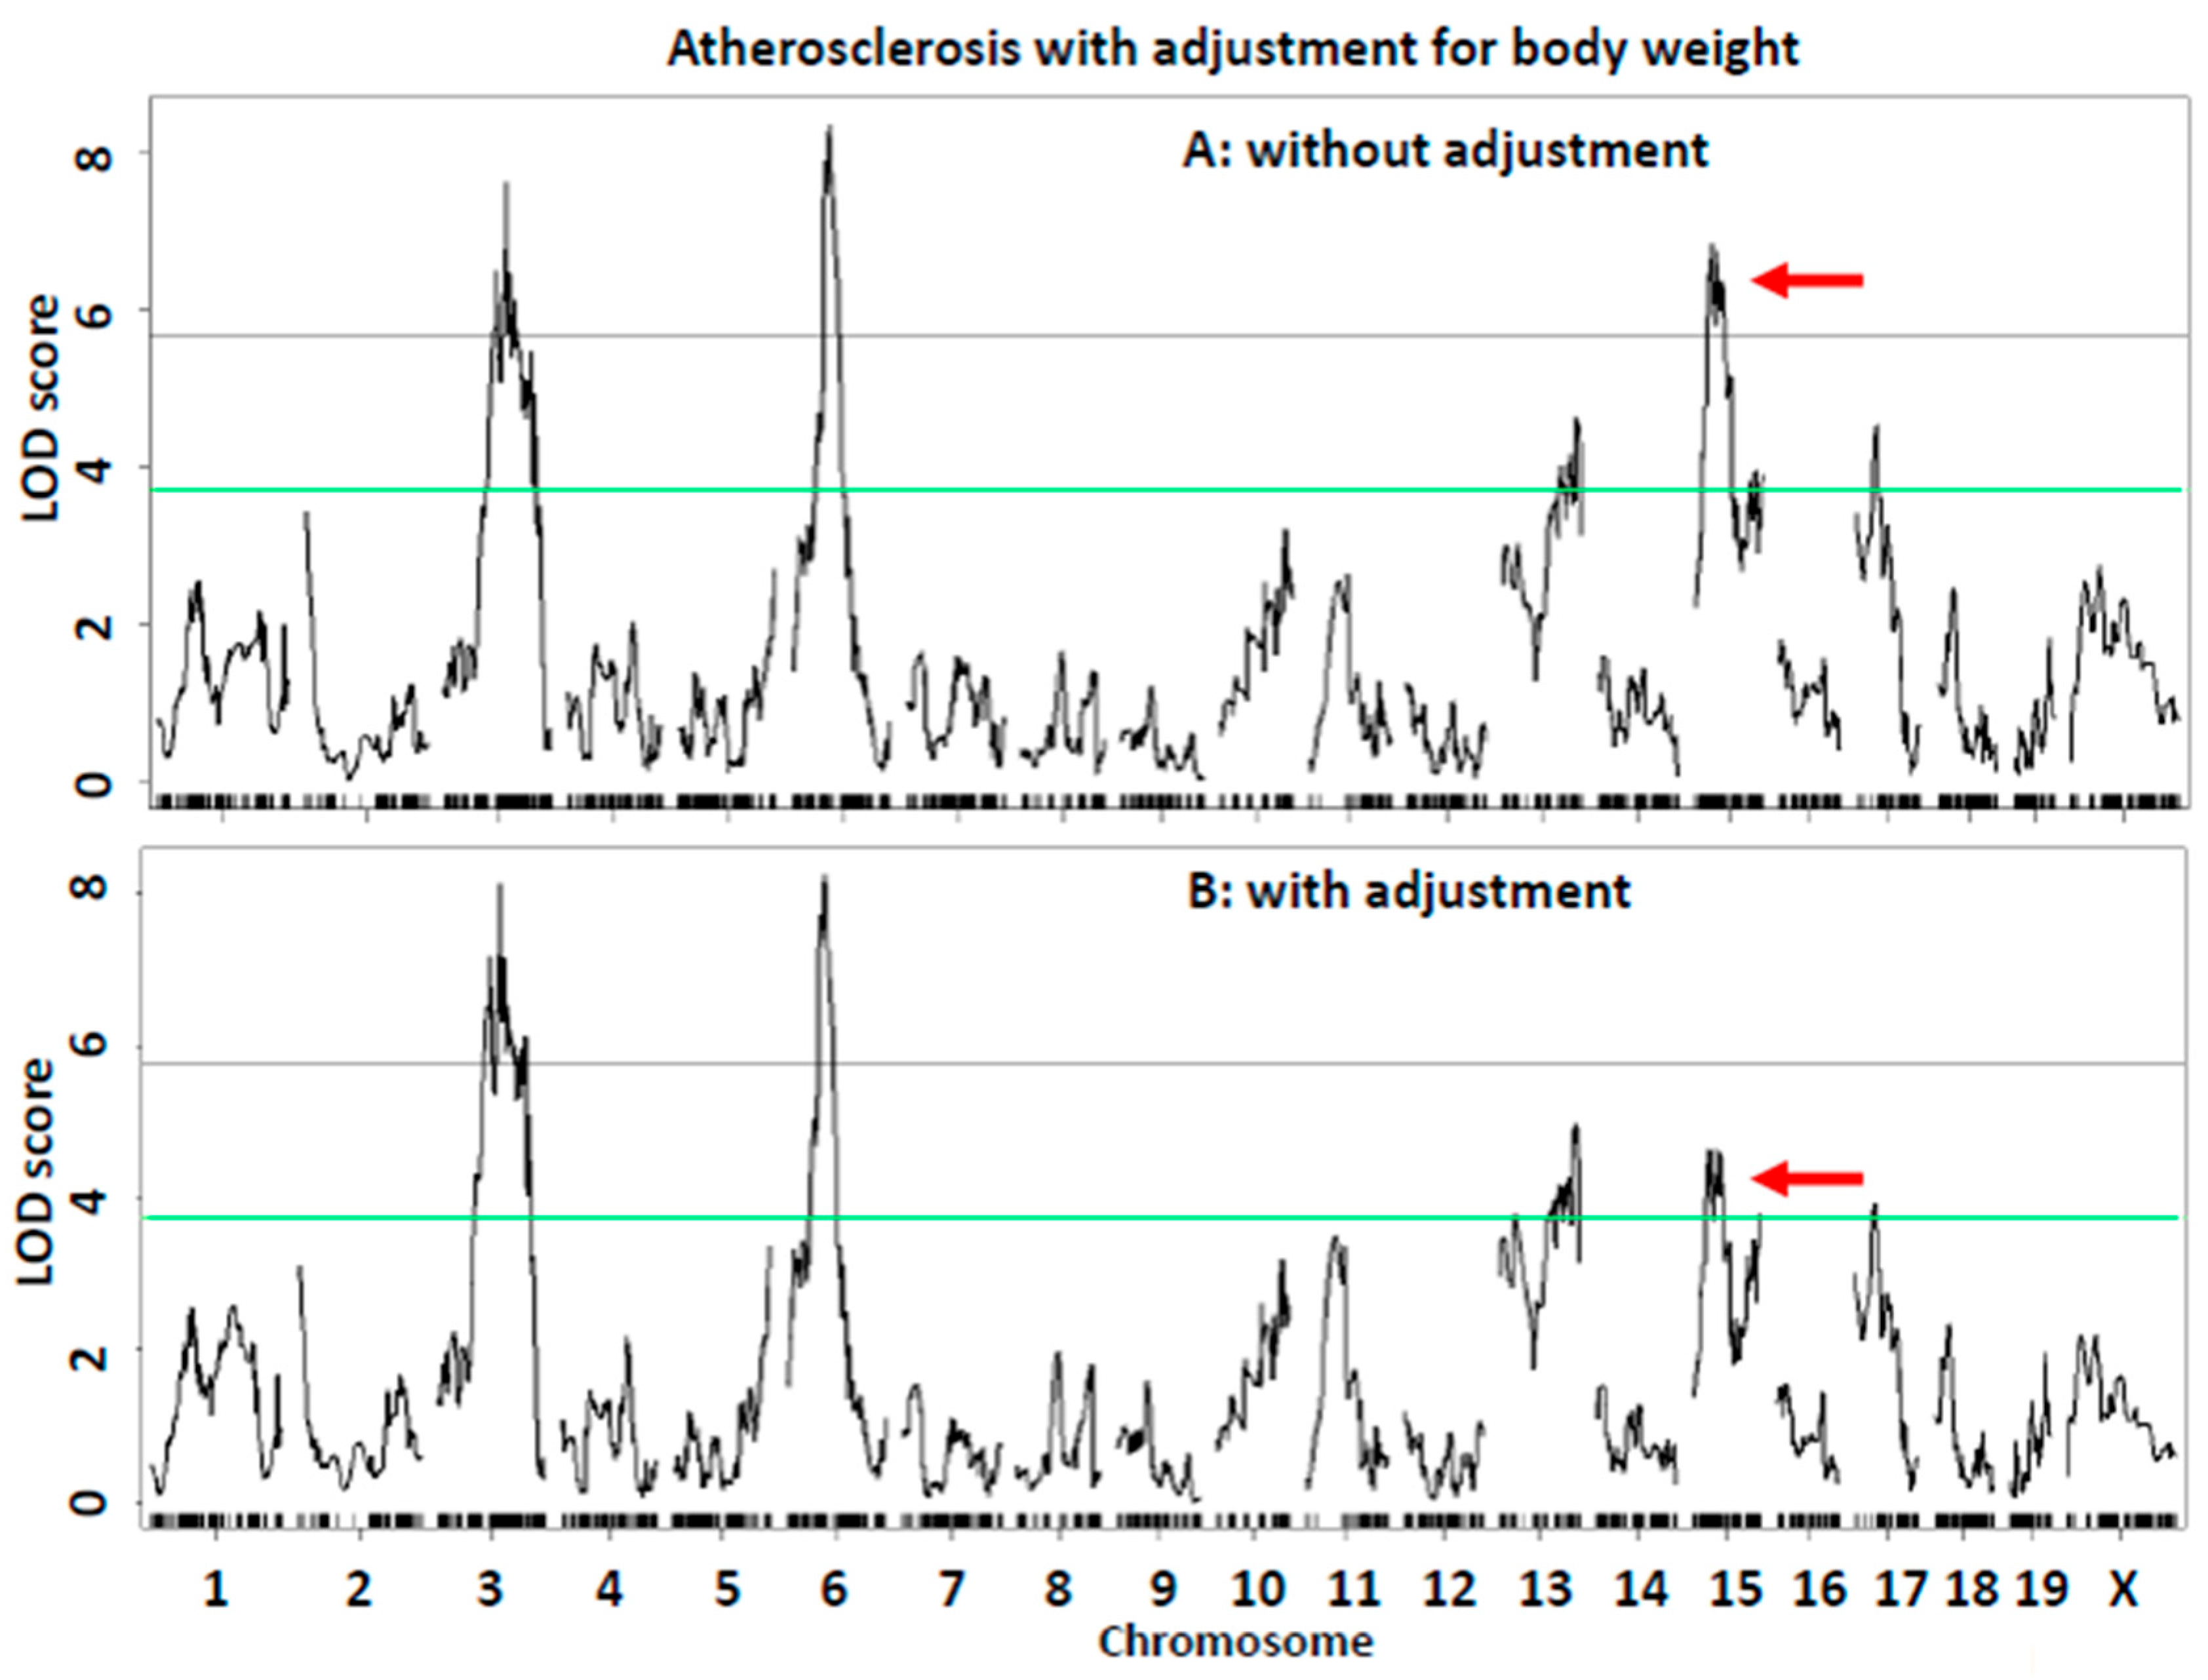
| Sex covariate | |||||||||||||
| Ath51 | 3 | 93.8 | 74.8–116.8 | UNC5770722 | 7.28 | 212,840 ± 116,611 | 171,698 ± 92,904 | 128,666 ± 56,805 | 158,888 ± 69,998 | 116,758 ± 71,078 | 100,806 ± 45,430 | Additive | BB |
| Ath54 | 6 | 59.7 | 51.7–67.7 | gUNC11198411 | 4.95 | 235,257 ± 122,379 | 146,388 ± 68,344 | 148,862 ± 79,622 | 130,516 ± 72,764 | 123,900 ± 69,539 | 112,808 ± 59,829 | Recessive/Additive | BB |
| Ath32 | 13 | 103.6 | 71.6–116.6 | S1L134123348 | 3.99 | 154,509 ± 80,705 | 162,087 ± 85,186 | 207,473 ± 123,053 | 98,310 ± 54,368 | 121,464 ± 72,885 | 153,892 ± 62,109 | Additive | LL |
| Ath52 | 15 | 36.7 | 23.4–44.8 | gUNCHS040036 | 6.60 | 124,002 ± 58,067 | 186,619 ± 106,087 | 185,455 ± 95,362 | 70,087 ± 49,812 | 129,263 ± 72,024 | 146,095 ± 55,165 | Dominant/Additive | LL |
| Ath53 | 15 | 92 | 80–100 | UNC26123163 | 3.9 | 136,612 ± 80,040 | 179,935 ± 96,562 | 182,968 ± 104,654 | 91,311 ± 59,418 | 127,199 ± 67387 | 147,370 ± 69,551 | Dominant/Additive | LL |
| Ath26 | 17 | 32.3 | 6.3–65.3 | gUNC27802572 | 2.76 | 180,256 ± 86,546 | 188,275 ± 103,668 | 124,302 ± 72,397 | 151,835 ± 74,658 | 118,809 ± 65,059 | 115,870 ± 68,972 | Dominant | BB |
| Sex interactive-covariate | |||||||||||||
| Ath51 | 3 | 93.8 | 73.8–130.8 | UNC5770722 | 7.62 | 212,840 ± 116,611 | 171,698 ± 92,904 | 128,666 ± 56,805 | 158,888 ± 69,998 | 116,758 ± 71,078 | 100,806 ± 45,430 | Additive/Recessive | BB |
| Ath54 | 6 | 59.7 | 52.7–65.7 | gUNC11198411 | 8.34 | 235,257 ± 122,379 | 146,388 ± 68,344 | 148,862 ± 79,622 | 130,516 ± 72,764 | 123,900 ± 69,539 | 112,808 ± 59,829 | Recessive/Additive | BB |
| Ath32 | 13 | 111.6 | 71.6–119.8 | SBC134492977 | 4.6 | 163,038 ± 85,089 | 153,337 ± 79,825 | 224,734 ± 126,127 | 99,580 ± 57,002 | 124,853 ± 72,461 | 144,358 ± 64,826 | Recessive/Additive | LL |
| Ath52 | 15 | 27.8 | 22.7–45.7 | gUNCHS040036 | 6.82 | 121,464 ± 57,122 | 191,388 ± 107,449 | 184,031 ± 91,425 | 80,325 ± 56,562 | 130,859 ± 72,157 | 143,704 ± 56,838 | Dominant/Additive | LL |
| Ath53 | 15 | 92 | 80–100 | UNC26123163 | 3.9 | 136,612 ± 80,040 | 179,935 ± 96,562 | 182,968 ± 104,654 | 91,311 ± 59,418 | 127,199 ± 67387 | 147,370 ± 69,551 | Dominant/Additive | LL |
| Ath26 | 17 | 32.3 | 3.3–51.3 | gUNC27802572 | 4.53 | 180,256 ± 86,546 | 188,275 ± 103,668 | 124,302 ± 72,397 | 151,835 ± 74,658 | 118,809 ± 65,059 | 115,870 ± 68,972 | Dominant | BB |
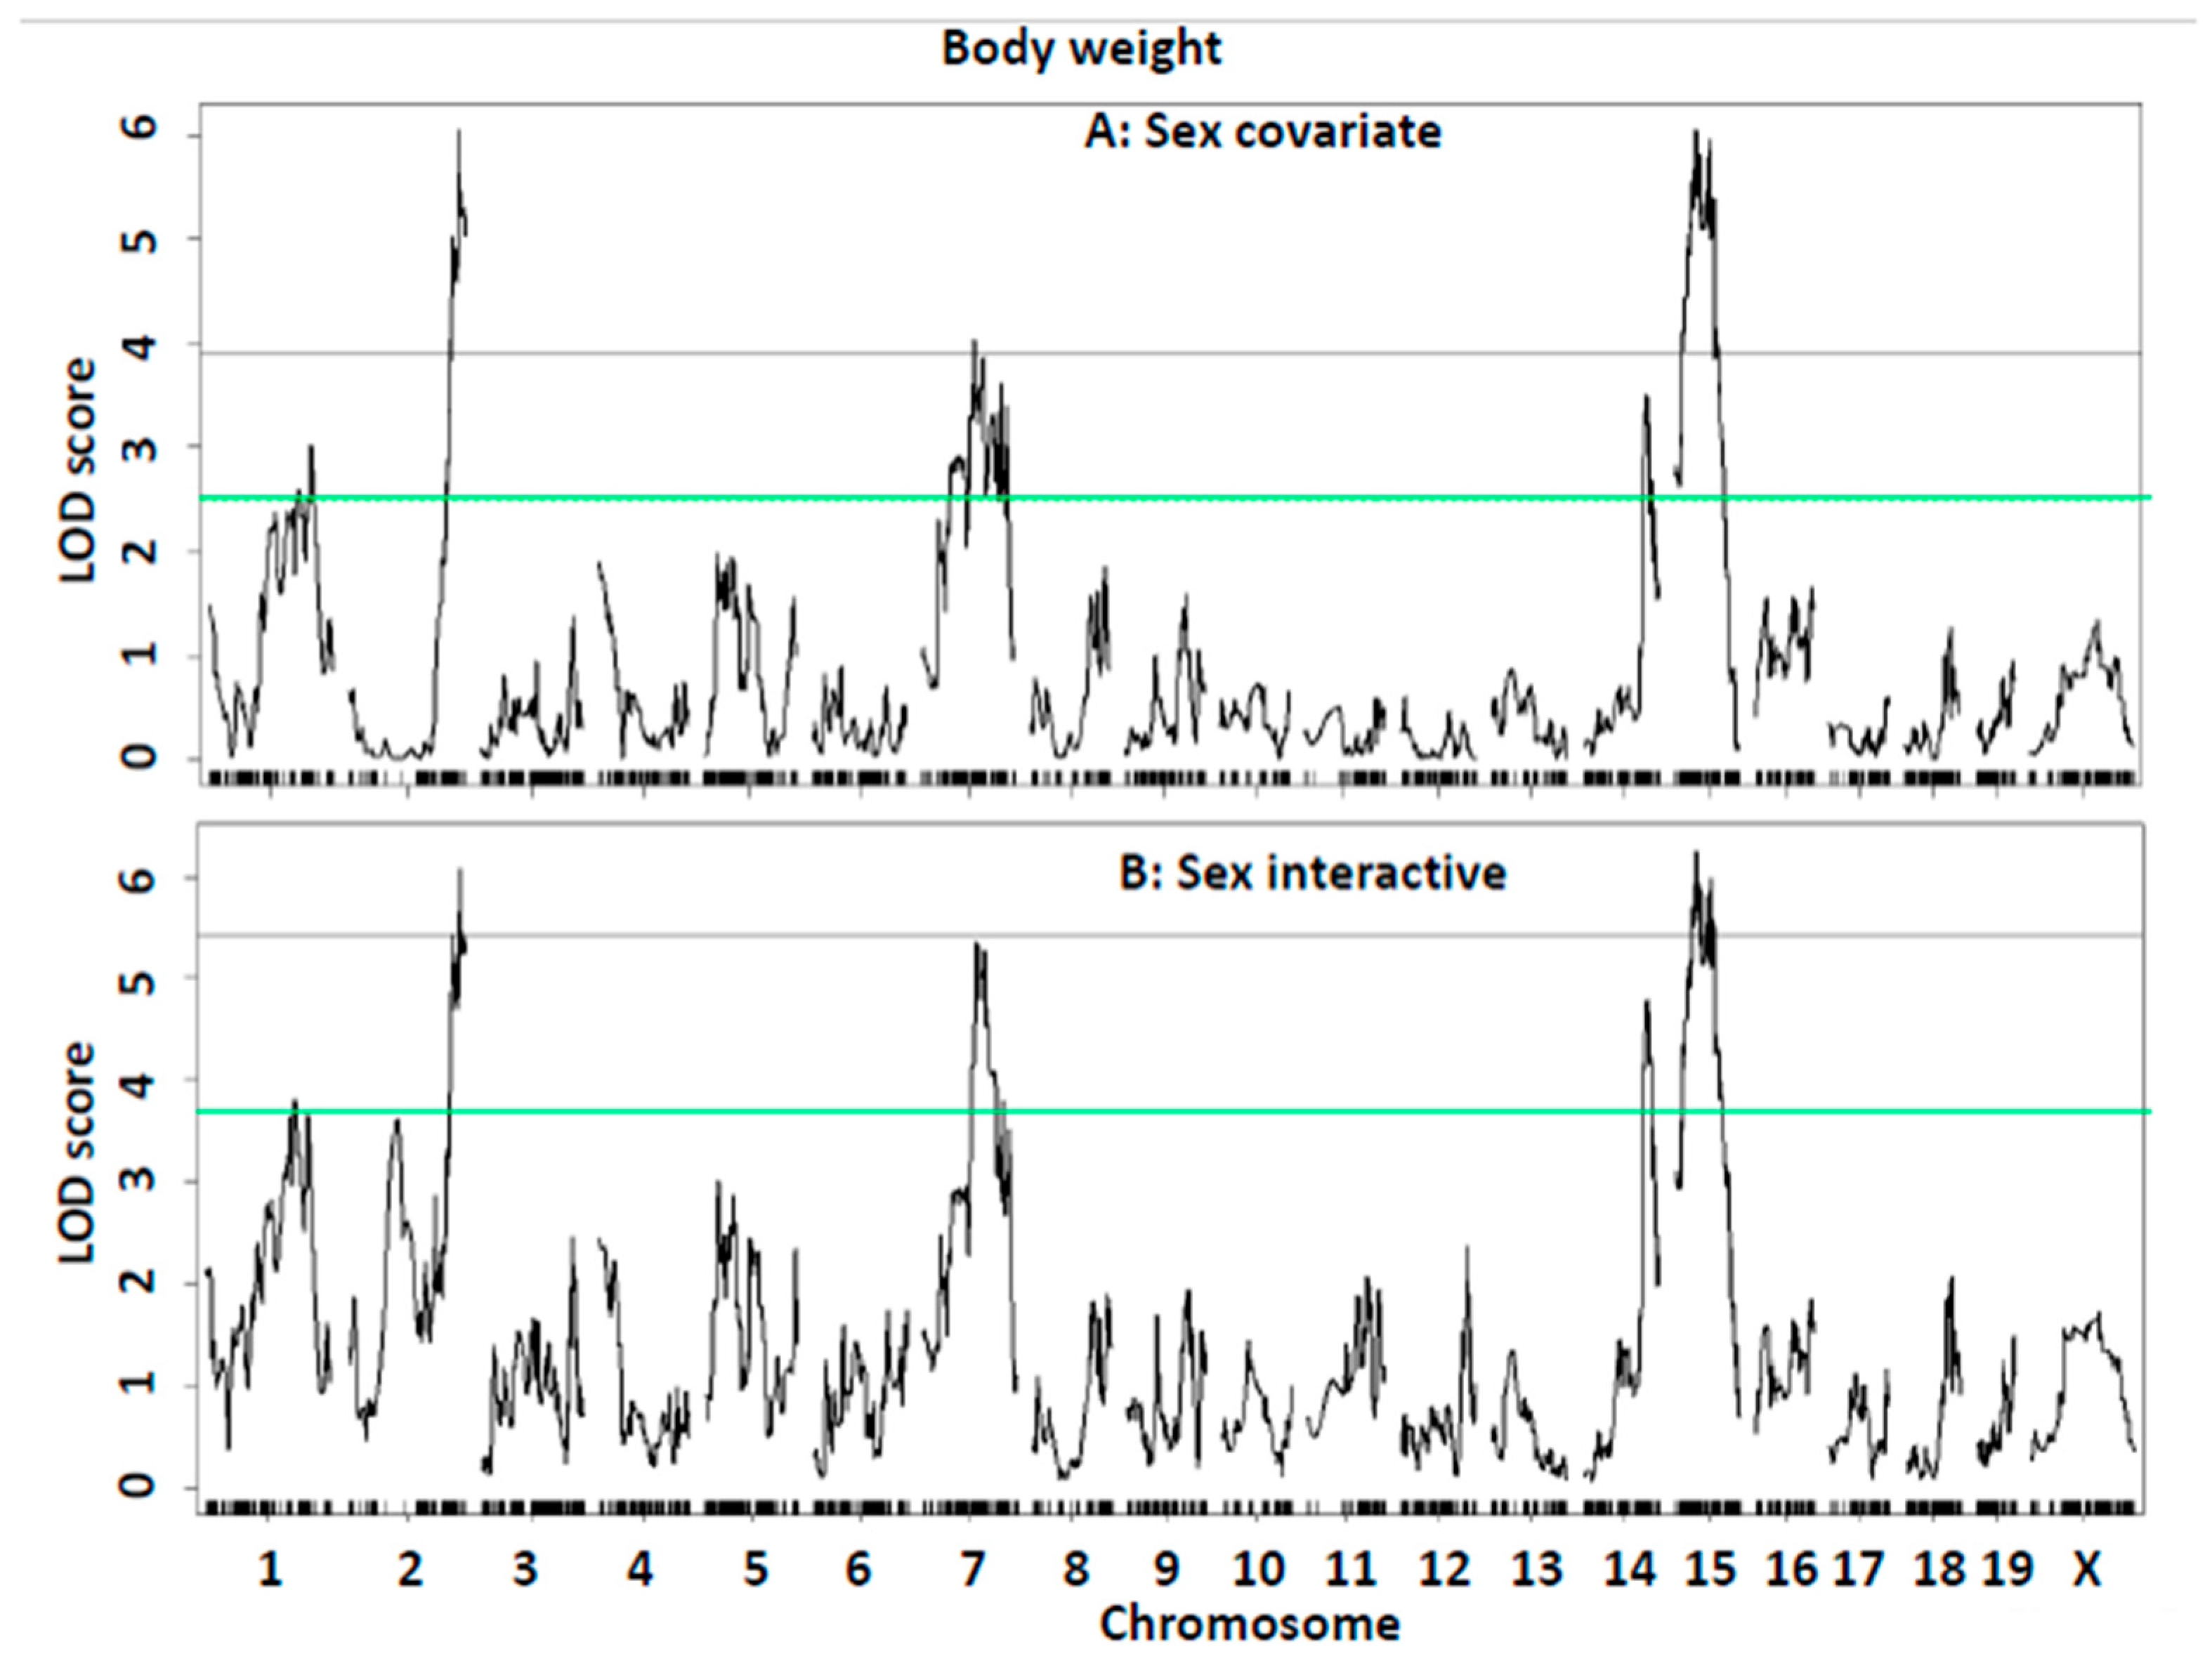
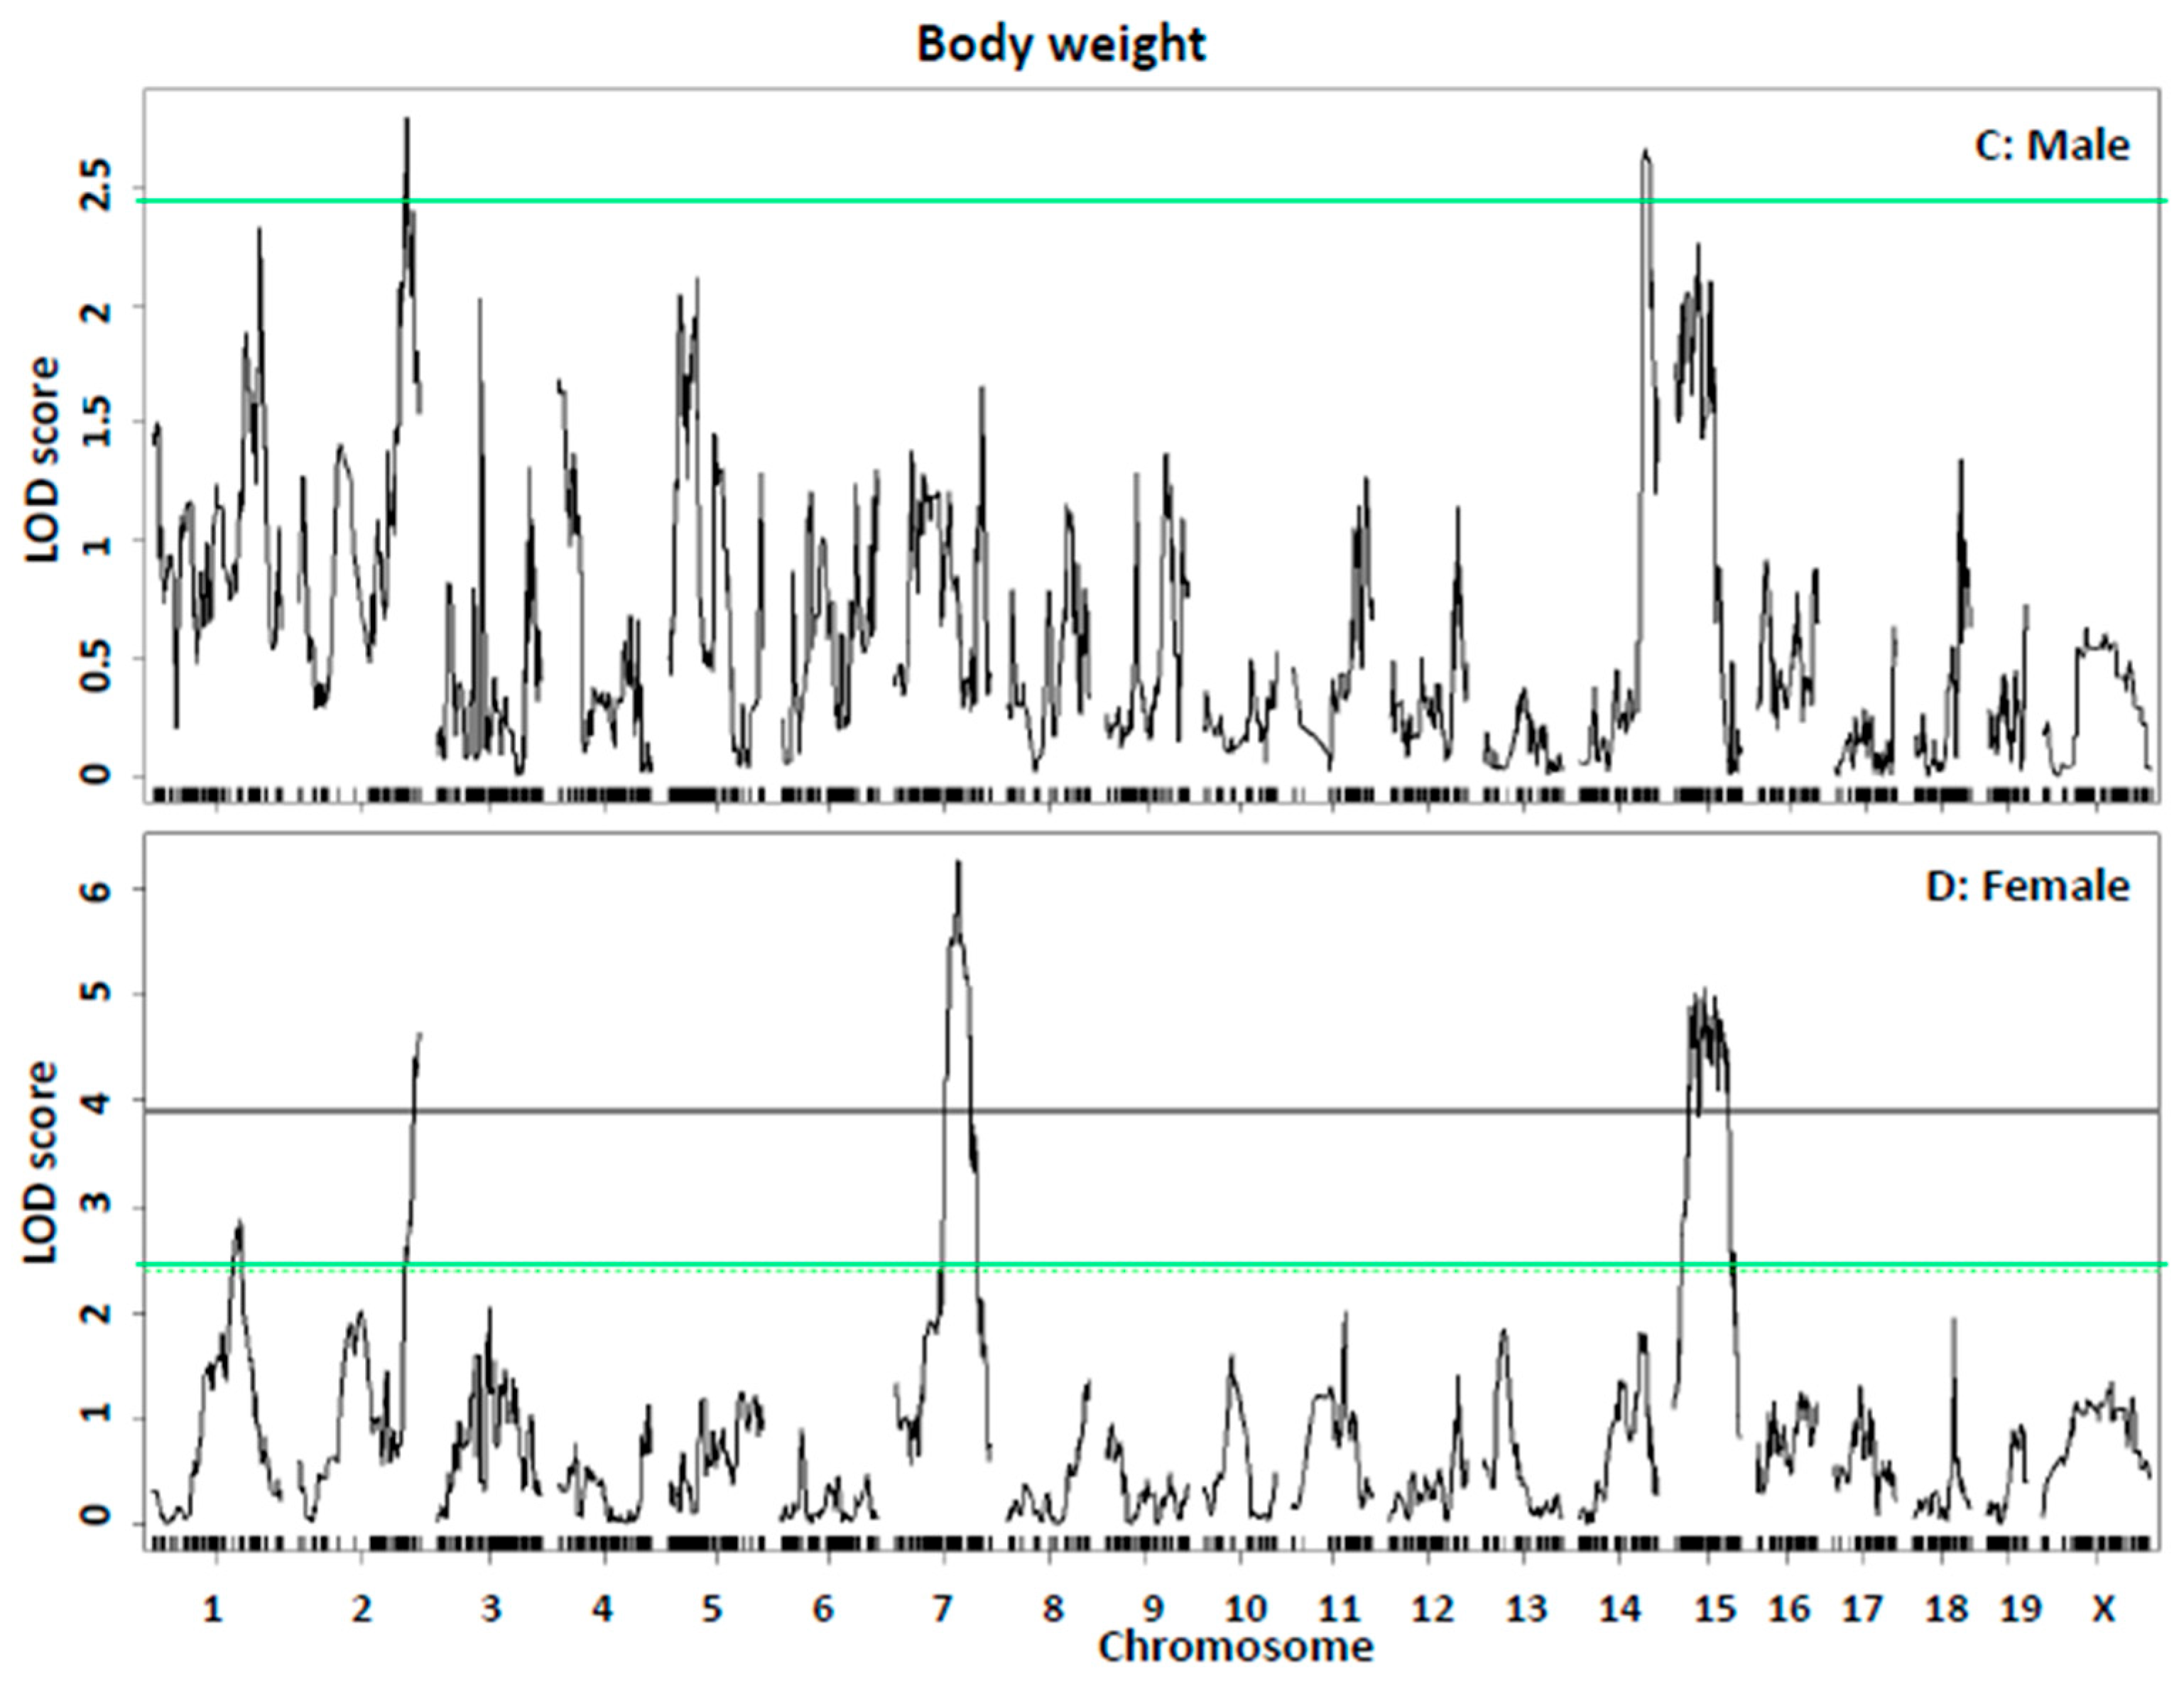
| Body weight: Sex covariate | |||||||||||||
| Bsbob5, Dob3, Dob9 | 15 | 35.4 | 23.4–62.7 | gUNC150117369 | 6.07 | 27.2 ± 5.2 | 25.4 ± 4.0 | 22.6 ± 4.2 | 36.7 ± 6.6 | 34.8 ± 5.9 | 32.2 ± 5.6 | Additive | BB |
| Bodwt1, Fatq1 | 1 | 161.4 | 3.4–172.4 | S3C016445465 | 3.02 | 23.3 ± 3.1 | 24.3 ± 4.2 | 25.4 ± 5.9 | 31.5 ± 5.7 | 35.2 ± 6.3 | 35.7 ± 5.9 | Additive/Dominant | LL |
| Adip26, Mob5 | 2 | 173.4 | 163.2–181.8 | gJAX00103339 | 6.05 | 26.9 ± 5.9 | 24.2 ± 3.9 | 22.6 ± 3.5 | 37.0 ± 6.5 | 34.2 ± 6.2 | 32.8 ± 5.6 | Additive | BB |
| Bw1n, Bdwtq | 7 | 83.1 | 46.1–135.1 | SX1073328646 | 4.03 | 23.9 ± 3.9 | 23.2 ± 3.5 | 27.6 ± 6.0 | 32.6 ± 5.5 | 34.8 ± 6.1 | 35.9 ± 7.0 | Recessive/Additive | LL |
| Bodwtq11 | 14 | 103.1 | 99.7–115.7 | gUNCHS039200 | 3.51 | 23.3 ± 4.2 | 25.5 ± 5.0 | 23.5 ± 4.1 | 34.9 ± 6.0 | 35.6 ± 5.9 | 31.0 ± 6.3 | Heterosis/Dominant | H/BB |
| Sex interactive-covariate | |||||||||||||
| Bsbob5, Dob3, Dob9 | 15 | 35.4 | 23.7–62.7 | gUNC150117369 | 6.27 | 27.2 ± 5.2 | 25.4 ± 4.0 | 22.6 ± 4.2 | 36.7 ± 6.6 | 34.8 ± 5.9 | 32.2 ± 5.6 | Additive | BB |
| Bodwt1, Fatq1 | 1 | 141.4 | 83.4–170.1 | mbHkupUNC010301903 | 3.81 | 23.2 ± 3.0 | 24.1 ± 4.3 | 25.9 ± 5.9 | 31.9 ± 5.5 | 35.4 ± 6.5 | 34.7 ± 5.7 | Additive | LL |
| Adip26, Mob5 | 2 | 173.4 | 159.6–181.8 | c2.loc169 | 6.09 | 23.3 ± 3.1 | 24.3 ± 4.2 | 25.4 ± 5.9 | 31.5 ± 5.7 | 35.2 ± 6.3 | 35.7 ± 5.9 | Additive/Dominant | LL |
| Bw1n, Bdwtq | 7 | 83.2 | 77.4–110.1 | SX1073328646 | 5.36 | 23.9 ± 3.9 | 23.2 ± 3.5 | 27.6 ± 6.0 | 32.6 ± 5.5 | 34.8 ± 6.1 | 35.9 ± 7.0 | Recessive/Additive | LL |
| Bodwtq11 | 14 | 105.6 | 100.2–110.7 | gUNC24672839 | 4.79 | 23.3 ± 4.2 | 25.5 ± 5.0 | 23.5 ± 4.1 | 34.9 ± 6.0 | 35.6 ± 5.9 | 31.0 ± 6.3 | Heterosis/Dominant | H/BB |
Disclaimer/Publisher’s Note: The statements, opinions and data contained in all publications are solely those of the individual author(s) and contributor(s) and not of MDPI and/or the editor(s). MDPI and/or the editor(s) disclaim responsibility for any injury to people or property resulting from any ideas, methods, instructions or products referred to in the content. |
© 2025 by the authors. Licensee MDPI, Basel, Switzerland. This article is an open access article distributed under the terms and conditions of the Creative Commons Attribution (CC BY) license (https://creativecommons.org/licenses/by/4.0/).
Share and Cite
Chen, M.-H.; Chagari, B.; Abramson, A.M.; Shi, L.J.; He, J.; Shi, W. The Genetic Elements of the Obesity Paradox in Atherosclerosis Identified in an Intercross Between Hyperlipidemic Mouse Strains. Int. J. Mol. Sci. 2025, 26, 4241. https://doi.org/10.3390/ijms26094241
Chen M-H, Chagari B, Abramson AM, Shi LJ, He J, Shi W. The Genetic Elements of the Obesity Paradox in Atherosclerosis Identified in an Intercross Between Hyperlipidemic Mouse Strains. International Journal of Molecular Sciences. 2025; 26(9):4241. https://doi.org/10.3390/ijms26094241
Chicago/Turabian StyleChen, Mei-Hua, Bilhan Chagari, Ashley M. Abramson, Lisa J. Shi, Jiang He, and Weibin Shi. 2025. "The Genetic Elements of the Obesity Paradox in Atherosclerosis Identified in an Intercross Between Hyperlipidemic Mouse Strains" International Journal of Molecular Sciences 26, no. 9: 4241. https://doi.org/10.3390/ijms26094241
APA StyleChen, M.-H., Chagari, B., Abramson, A. M., Shi, L. J., He, J., & Shi, W. (2025). The Genetic Elements of the Obesity Paradox in Atherosclerosis Identified in an Intercross Between Hyperlipidemic Mouse Strains. International Journal of Molecular Sciences, 26(9), 4241. https://doi.org/10.3390/ijms26094241