
Applying K-Means Cluster Analysis to Urinary Biomarkers in Interstitial Cystitis/Bladder Pain Syndrome: A New Perspective on Disease Classification


Abstract
1. Introduction
2. Results
2.1. Cluster Analysis and Clinical Characteristics
2.2. Urinary Biomarker Profiles in Different Clusters
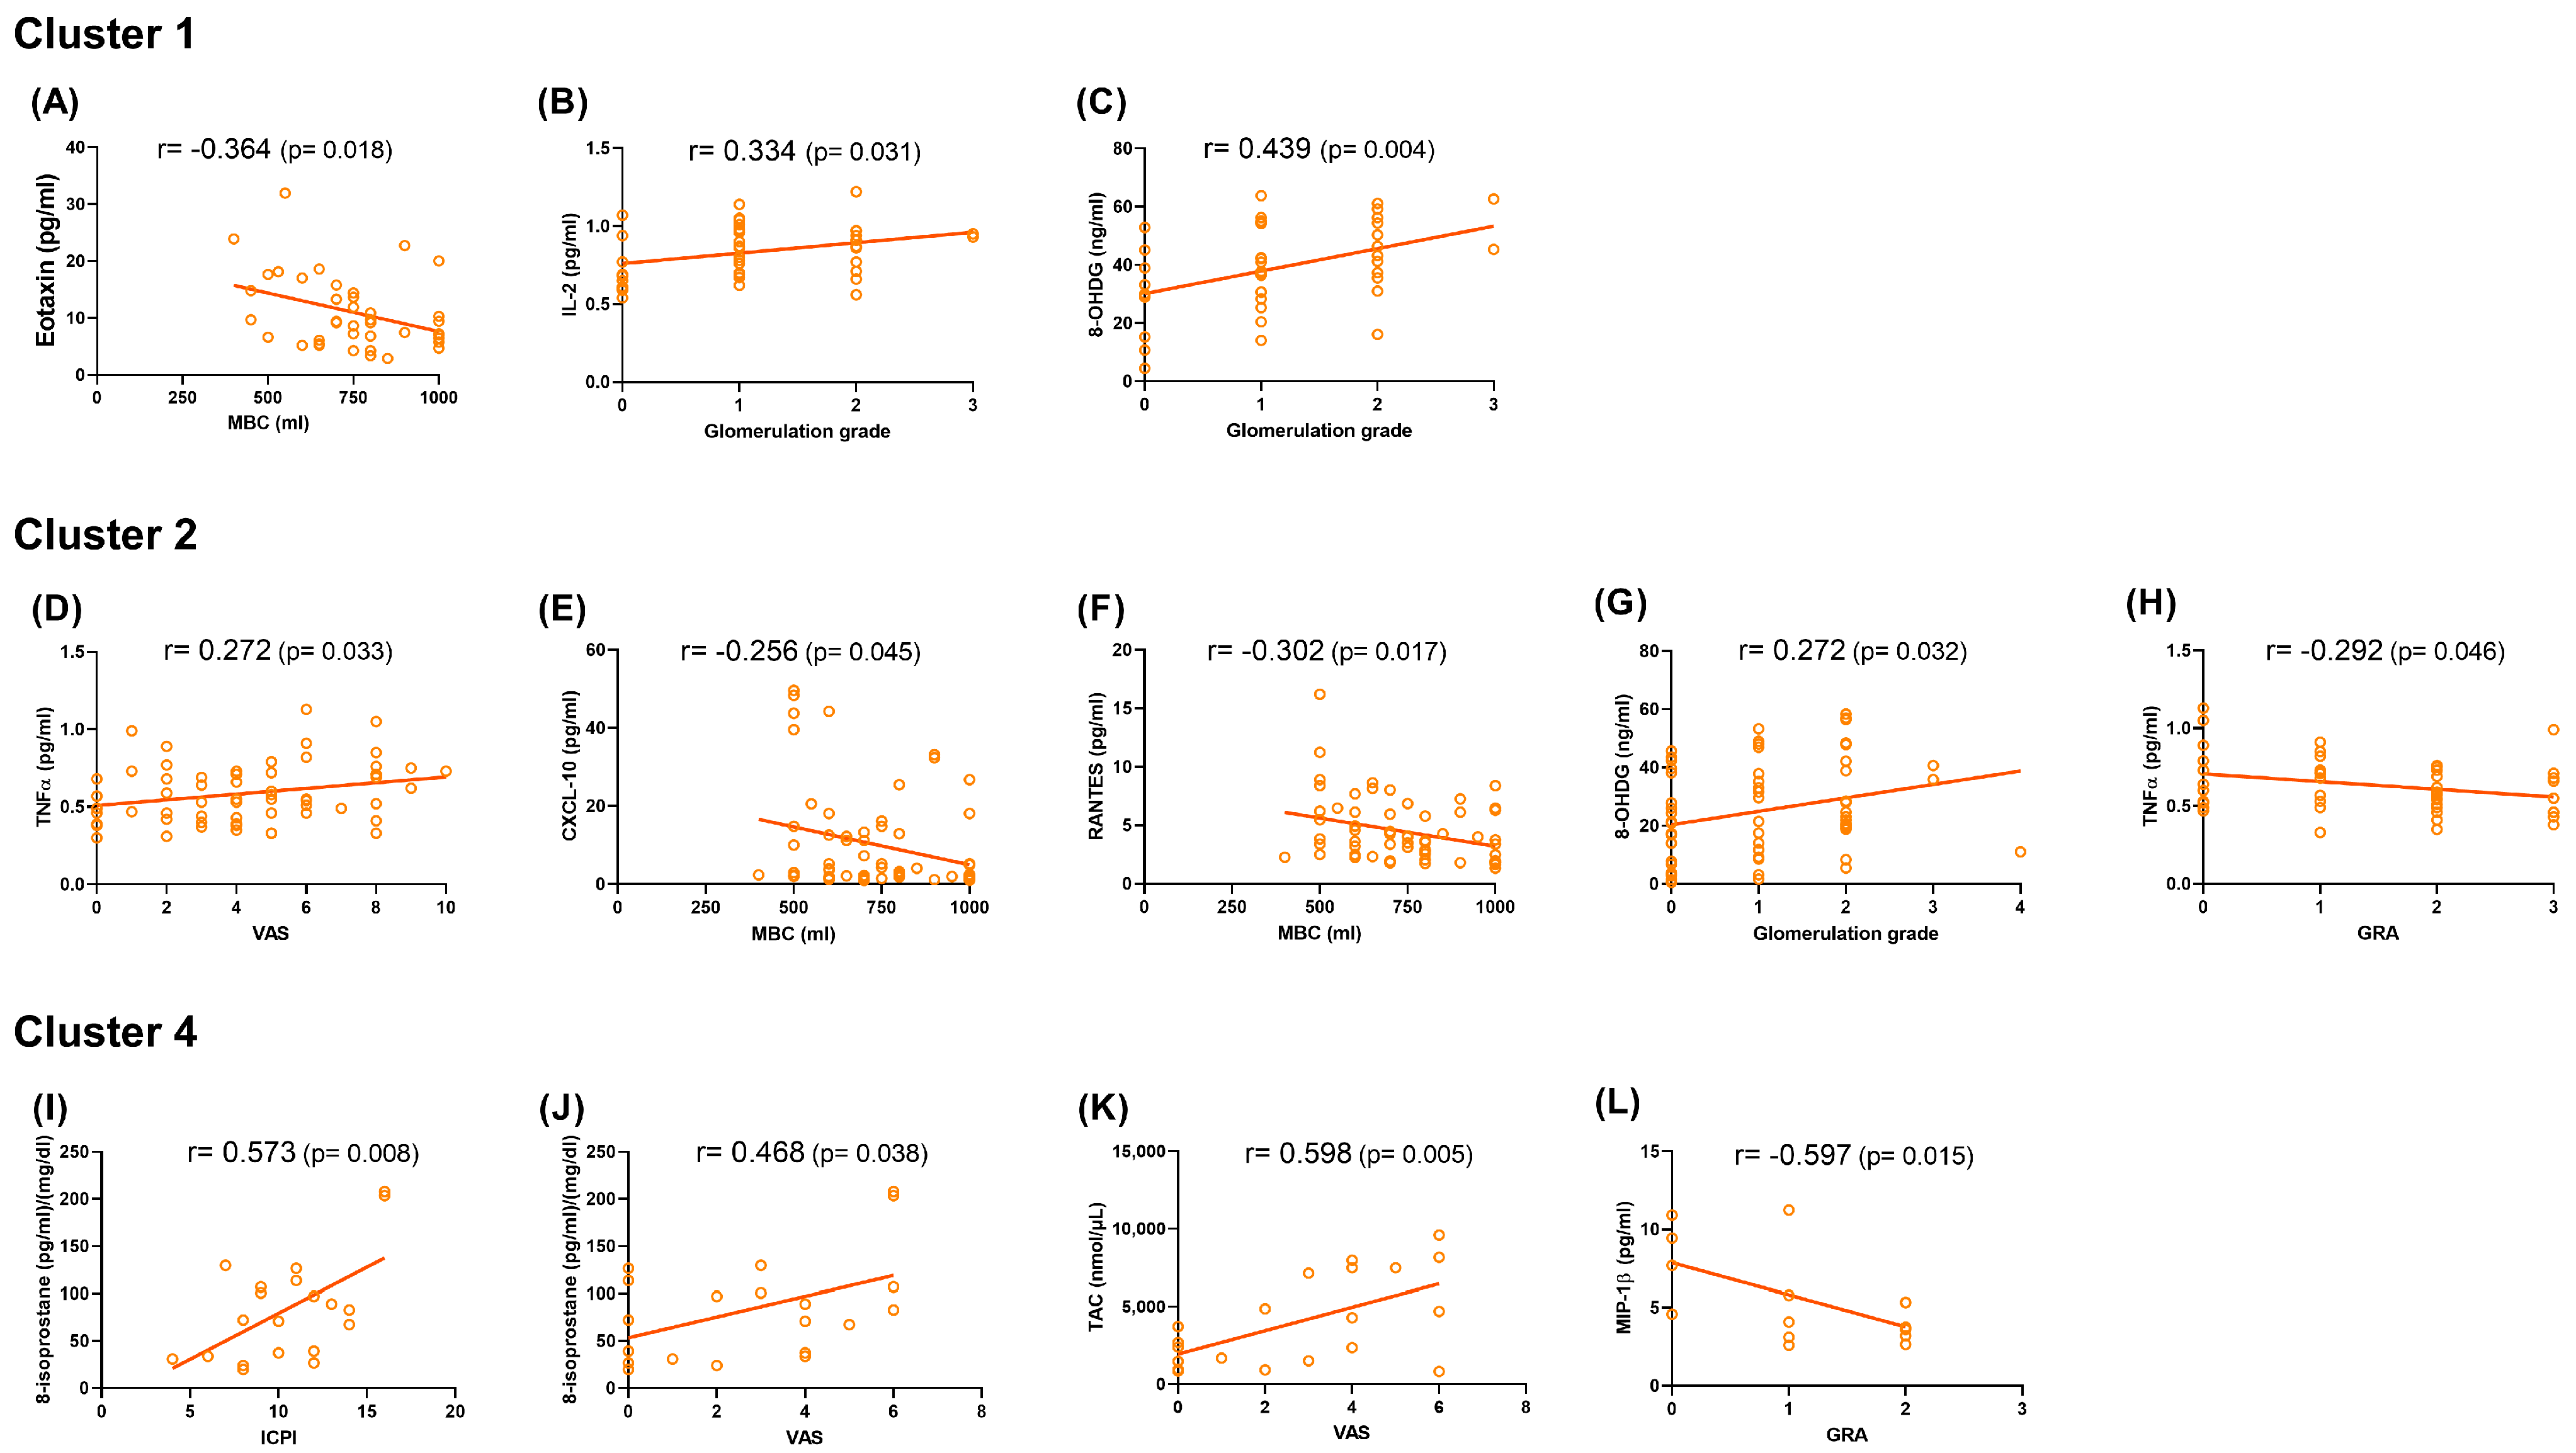
2.3. Correlations Between Urinary Biomarkers and Clinical Parameters
3. Discussion
4. Materials and Methods
4.1. Patients
4.2. Clinical Investigation
4.3. Urinary Biomarkers Investigation
4.4. Quantification of Urinary Inflammatory and Oxidative Stress Biomarkers
4.5. Statistical Analysis
4.6. Cluster Analysis Model
5. Conclusions
Supplementary Materials
Author Contributions
Funding
Institutional Review Board Statement
Informed Consent Statement
Data Availability Statement
Conflicts of Interest
References
- Pape, J.; Falconi, G.; De Mattos Lourenco, T.R.; Doumouchtsis, S.K.; Betschart, C. Variations in bladder pain syndrome/interstitial cystitis (IC) definitions, pathogenesis, diagnostics and treatment: A systematic review and evaluation of national and international guidelines. Int. Urogynecol. J. 2019, 30, 1795–1805. [Google Scholar] [CrossRef] [PubMed]
- Yoshimura, N.; Oguchi, T.; Yokoyama, H.; Funahashi, Y.; Yoshikawa, S.; Sugino, Y.; Kawamorita, N.; Kashyap, M.P.; Chancellor, M.B.; Tyagi, P.; et al. Bladder afferent hyperexcitability in bladder pain syndrome/interstitial cystitis. Int. J. Urol. 2014, 21 (Suppl. 1), 18–25. [Google Scholar] [CrossRef] [PubMed]
- Tripp, D.A.; Nickel, J.C.; Wong, J.; Pontari, M.; Moldwin, R.; Mayer, R.; Carr, L.K.; Doggweiler, R.; Yang, C.C.; Mishra, N.; et al. Mapping of pain phenotypes in female patients with bladder pain syndrome/interstitial cystitis and controls. Eur. Urol. 2012, 62, 1188–1194. [Google Scholar] [CrossRef] [PubMed]
- Malde, S.; Sahai, A. Phenotypes of BPS/IC. Curr. Bladder Dysfunct. Rep. 2020, 15, 203–213. [Google Scholar] [CrossRef]
- Siddiqui, N.Y.; Helfand, B.T.; Andreev, V.P.; Kowalski, J.T.; Bradley, M.S.; Lai, H.H.; Berger, M.B.; Mueller, M.G.; Bickhaus, J.A.; Packiam, V.T.; et al. Biomarkers Implicated in Lower Urinary Tract Symptoms: Systematic Review and Pathway Analyses. J. Urol. 2019, 202, 880–889. [Google Scholar] [CrossRef]
- Mohammad, A.; Laboulaye, M.A.; Shenhar, C.; Dobberfuhl, A.D. Mechanisms of oxidative stress in interstitial cystitis/bladder pain syndrome. Nat. Rev. Urol. 2024, 21, 433–449. [Google Scholar] [CrossRef]
- Jiang, Y.H.; Jhang, J.F.; Hsu, Y.H.; Ho, H.C.; Wu, Y.H.; Kuo, H.C. Urine cytokines as biomarkers for diagnosing interstitial cystitis/bladder pain syndrome and mapping its clinical characteristics. Am. J. Physiol. Renal Physiol. 2020, 318, F1391–F1399. [Google Scholar] [CrossRef]
- Jiang, Y.H.; Jhang, J.F.; Ho, H.C.; Chiou, D.Y.; Kuo, H.C. Urine Oxidative Stress Biomarkers as Novel Biomarkers in Interstitial Cystitis/Bladder Pain Syndrome. Biomedicines 2022, 10, 1701. [Google Scholar] [CrossRef]
- Jhang, J.F.; Yu, W.R.; Huang, W.T.; Kuo, H.C. Combination of urinary biomarkers and machine-learning models provided a higher predictive accuracy to predict long-term treatment outcomes of patients with interstitial cystitis/bladder pain syndrome. World J. Urol. 2024, 42, 173. [Google Scholar] [CrossRef]
- Alhawarat, M.; Hegazi, M. Revisiting K-Means and Topic Modeling, a Comparison Study to Cluster Arabic Documents. IEEE Access 2018, 6, 42740–42749. [Google Scholar] [CrossRef]
- Sinaga, K.P.; Yang, M.S. Unsupervised K-Means Clustering Algorithm. IEEE Access 2020, 8, 80716–80727. [Google Scholar] [CrossRef]
- Van de Merwe, J.P.; Nordling, J.; Bouchelouche, P.; Bouchelouche, K.; Cervigni, M.; Daha, L.K.; Elneil, S.; Fall, M.; Hohlbrugger, G.; Irwin, P.; et al. Diagnostic criteria, classification, and nomenclature for painful bladder syndrome/interstitial cystitis: An ESSIC proposal. Eur. Urol. 2008, 53, 60–67. [Google Scholar] [CrossRef] [PubMed]
- Nickel, J.C.; Shoskes, D.; Irvine-Bird, K. Clinical phenotyping of women with interstitial cystitis/painful bladder syndrome: A key to classification and potentially improved management. J. Urol. 2009, 182, 155–160. [Google Scholar] [CrossRef]
- Clemens, J.Q.; Erickson, D.R.; Varela, N.P.; Lai, H.H. Diagnosis and Treatment of Interstitial Cystitis/Bladder Pain Syndrome. J. Urol. 2022, 208, 34–42. [Google Scholar] [CrossRef]
- Lin, H.Y.; Lu, J.H.; Chuang, S.M.; Chueh, K.S.; Juan, T.J.; Liu, Y.C.; Juan, Y.S. Urinary Biomarkers in Interstitial Cystitis/Bladder Pain Syndrome and Its Impact on Therapeutic Outcome. Diagnostics 2021, 12, 75. [Google Scholar] [CrossRef]
- Yu, W.R.; Jiang, Y.H.; Jhang, J.F.; Kuo, H.C. Use of Urinary Cytokine and Chemokine Levels for Identifying Bladder Conditions and Predicting Treatment Outcomes in Patients with Interstitial Cystitis/Bladder Pain Syndrome. Biomedicines 2022, 10, 1149. [Google Scholar] [CrossRef]
- Ochodnicky, P.; Cruz, C.D.; Yoshimura, N.; Cruz, F. Neurotrophins as regulators of urinary bladder function. Nat. Rev. Urol. 2012, 9, 628–637. [Google Scholar] [CrossRef]
- Magalhaes, T.F.; Baracat, E.C.; Doumouchtsis, S.K.; Haddad, J.M. Biomarkers in the diagnosis and symptom assessment of patients with bladder pain syndrome: A systematic review. Int. Urogynecol. J. 2019, 30, 1785–1794. [Google Scholar] [CrossRef]
- Lai, H.H.; Thu, J.H.L.; Moh, F.V.; Paradis, A.; Vetter, J. Clustering of Patients with Interstitial Cystitis/Bladder Pain Syndrome and Chronic Prostatitis/Chronic Pelvic Pain Syndrome. J. Urol. 2019, 202, 546–551. [Google Scholar] [CrossRef]
- Lamb, L.E.; Janicki, J.J.; Bartolone, S.N.; Ward, E.P.; Abraham, N.; Laudano, M.; Smith, C.P.; Peters, K.M.; Zwaans, B.M.M.; Chancellor, M.B. Risk Classification for Interstitial Cystitis/Bladder Pain Syndrome Using Machine Learning Based Predictions. Urology 2024, 189, 19–26. [Google Scholar] [CrossRef]
- Janicki, J.J.; Zwaans, B.M.M.; Bartolone, S.N.; Ward, E.P.; Chancellor, M.B. Advancing Interstitial Cystitis/Bladder Pain Syndrome (IC/BPS) Diagnosis: A Comparative Analysis of Machine Learning Methodologies. Diagnostics 2024, 14, 2734. [Google Scholar] [CrossRef] [PubMed]
- Ens, G.; Garrido, G.L. Role of cystoscopy and hydrodistention in the diagnosis of interstitial cystitis/bladder pain syndrome. Transl. Androl. Urol. 2015, 4, 624–628. [Google Scholar] [PubMed]
- Wenzler, D.L.; Gulli, F.; Cooney, M.; Chancellor, M.B.; Gilleran, J.; Peters, K.M. Treatment of ulcerative compared to non-ulcerative interstitial cystitis with hyperbaric oxygen: A pilot study. Ther. Adv. Urol. 2017, 9, 263–270. [Google Scholar] [CrossRef] [PubMed]
- Chung, S.D.; Kuo, Y.C.; Kuo, H.C. Intravesical onabotulinumtoxinA injections for refractory painful bladder syndrome. Pain. Physician 2012, 15, 197–202. [Google Scholar]
- Charrad, M.; Ghazzali, N.; Boiteau, V.; Niknafs, A. NbClust: An R Package for Determining the Relevant Number of Clusters in a Data Set. J. Stat. Softw. 2014, 61, 1–36. [Google Scholar] [CrossRef]


| IC/BPS | Control | p Value | |
|---|---|---|---|
| Number | 127 | 30 | |
| Age | 54.6 ± 12.6 | 58.9 ± 10.8 | 0.083 |
| Hypertension | 29 (22.8%) | 6 (20.0%) | 0.737 |
| Diabetes mellitus | 16 (12.6%) | 4 (13.3%) | 1.000 |
| Sex | 0.075 | ||
| Male | 13 (10.2%) | 0 (0.0%) | |
| Female | 114 (89.8%) | 30 (100.0%) | |
| ESSIC type | |||
| Type I | 37 (29.1%) | ||
| Type II | 90 (70.9%) | ||
| Clinical characteristics | |||
| ICSI | 10.2 ± 4.5 | NA | |
| ICPI | 10.2 ± 4.0 | ||
| OSS | 20.6 ± 7.9 | ||
| VAS | 4.2 ± 2.7 | ||
| MBC (mL) | 711.4 ± 179.5 | ||
| Glomerulation grade | |||
| 0 | 37 (29.1%) | NA | |
| 1 | 41 (32.3%) | ||
| 2 | 43 (33.9%) | ||
| 3 | 5 (3.9%) | ||
| 4 | 1 (0.8%) | ||
| Treatment | |||
| Intravesical platelet-rich plasma injection | 66 (68.8%) | NA | |
| Intravesical botulinum toxin injection | 17 (17.7%) | ||
| Intravesical hyaluronic acid installation | 13 (13.5%) | ||
| GRA | NA | ||
| 0 | 21 (21.9%) | ||
| +1 | 28 (29.2%) | ||
| +2 | 31 (32.3%) | ||
| +3 | 16 (16.7%) |
| IC/BPS | Control | p Value | |
|---|---|---|---|
| Number | 127 | 30 | |
| Urine biomarkers * | |||
| Eotaxin | 9.46 ± 8.68 | 5.51 ± 4.32 | 0.017 |
| IL-2 | 0.76 ± 0.18 | 0.84 ± 0.23 | 0.032 |
| IL-6 | 2.52 ± 4.84 | 1.90 ± 3.50 | 0.509 |
| IL-8 | 15.70 ± 22.59 | 24.87 ± 57.57 | 0.163 |
| CXCL10 | 57.52 ± 116.84 | 50.69 ± 192.93 | 0.803 |
| MCP-1 | 358.76 ± 410.18 | 172.38 ± 131.90 | 0.015 |
| MIP-1β | 3.48 ± 3.36 | 2.77 ± 2.16 | 0.269 |
| RANTES | 10.02 ± 8.38 | 7.44 ± 8.01 | 0.129 |
| TNFα | 0.82 ± 0.61 | 0.93 ± 0.63 | 0.405 |
| NGF | 0.40 ± 0.27 | 0.26 ± 0.08 | 0.006 |
| 8-OHdG | 34.66 ± 18.53 | 18.89 ± 13.84 | <0.001 |
| 8-isoprostane | 42.49 ± 36.48 | 19.66 ± 19.29 | 0.001 |
| TAC | 1975.72 ± 1807.06 | 1207.35 ± 1037.81 | 0.027 |
| Cluster | p Value | |||||
|---|---|---|---|---|---|---|
| Cluster 1 | Cluster 2 | Cluster 3 | Cluster 4 | Total | ||
| Number | 53 (33.8%) | 80 (51.0%) | 4 (2.5%) | 20 (12.7%) | 157 (100%) | |
| Age | 55.68 ± 12.43 | 55.80 ± 12.48 | 64.00 ± 9.20 | 51.60 ± 11.39 | 55.43 ± 12.31 | 0.267 |
| Sex | 0.047 | |||||
| Male | 2 (3.8%) | 6 (7.5%) | 0 (0.0%) | 5 (25.0%) | 13 (8.3%) | |
| Female | 51 (96.2%) | 74 (92.5%) | 4 (100.0%) | 15 (75.0%) | 144 (91.7%) | |
| Type | 0.054 | |||||
| ESSIC type I IC/BPS | 10 (27.0%) | 23 (62.2%) | 1 (2.7%) | 3 (8.1%) | 37 (100%) | |
| ESSIC type II IC/BPS | 32 (35.6%) | 39 (43.3%) | 2 (2.2%) | 17 (18.9%) | 90 (100.0) | |
| Control | 11 (36.7%) | 18 (60.0%) | 1 (3.3%) | 0 (0.0%) | 30 (100.0%) | |
| Clinical characteristics * | ||||||
| ICSI | 10.2 ± 4.8 | 10.4 ± 4.5 | 6.7 ± 3.1 | 10.3 ± 3.9 | 10.2 ± 4.5 | 0.575 |
| ICPI | 9.8 ± 4.4 | 10.5 ± 3.9 | 7.3 ± 2.1 | 10.5 ± 3.2 | 10.2 ± 4.0 | 0.471 |
| OSS | 20.2 ± 8.6 | 20.9 ± 7.8 | 14.0 ± 4.6 | 21.2 ± 6.6 | 20.6 ± 7.9 | 0.495 |
| VAS | 4.9 ± 2.5 | 4.2 ± 2.8 | 5.3 ± 1.2 | 2.8 ± 2.3 | 4.2 ± 2.7 | 0.033 |
| MBC (mL) | 747.1 ± 169.9 | 731.5 ± 172.1 | 666.7 ± 57.7 | 581.0 ± 183.7 | 711.4 ± 179.5 | 0.003 |
| Glomerulation grade | 0.072 | |||||
| 0 | 10 (23.8%) | 23 (37.1%) | 1 (33.3%) | 3 (15.0%) | 37 (29.1%) | |
| 1 | 18 (42.9%) | 18 (29.0%) | 2 (66.7%) | 3 (15.0%) | 41 (32.3%) | |
| 2 | 12 (28.6%) | 18 (29.0%) | 0 (0.0%) | 13 (65.0%) | 43 (33.9%) | |
| 3 | 2 (4.8%) | 2 (3.2%) | 0 (0.0%) | 1 (5.0%) | 5 (3.9%) | |
| 4 | 0 (0.0%) | 1 (1.6%) | 0 (0.0%) | 0 (0.0%) | 1 (0.8%) | |
| Treatment * | 0.326 | |||||
| Intravesical platelet-rich plasma injection | 21 (70.0%) | 30 (63.8%) | 1 (33.3%) | 14 (87.5%) | 66 (68.8%) | |
| Intravesical botulinum toxin injection | 4 (13.3%) | 11 (23.4%) | 1 (33.3%) | 1 (6.3%) | 17 (17.7%) | |
| Intravesical hyaluronic acid installation | 5 (16.7%) | 6 (12.8%) | 1 (33.3%) | 1 (6.3%) | 13 (13.5%) | |
| GRA * | 0.348 | |||||
| 0 | 6 (20.0%) | 11 (23.4%) | 0 (0.0%) | 4 (25.0%) | 21 (21.9%) | |
| +1 | 11 (36.7%) | 12 (25.5%) | 0 (0.0%) | 5 (31.3%) | 28 (29.2%) | |
| +2 | 8 (26.7%) | 15 (31.9%) | 1 (33.3%) | 7 (43.8%) | 31 (32.3%) | |
| +3 | 5 (16.7%) | 9 (19.1%) | 2 (66.7%) | 0 (0.0%) | 16 (16.7%) | |
| GRA ≧ +2 (%) | 13 (43.3%) | 24 (51.1%) | 3 (100.0%) | 7 (43.8%) | 47 (49.0%) | 0.353 |
| GRA = +3 (%) | 5 (16.7%) | 9 (19.1%) | 2 (66.7%) | 0 (0.0%) | 16 (16.7%) | 0.036 * |
| Urine Biomarkers * | Cluster | p Value | Post Hoc | ||||
|---|---|---|---|---|---|---|---|
| Cluster 1 (n = 53, 33.8%) | Cluster 2 (n = 80, 51.0%) | Cluster 3 (n = 4, 2.5%) | Cluster 4 (n = 20, 12.7%) | Total (N = 157, 100%) | |||
| Eotaxin | 10.66 ± 6.06 | 3.94 ± 2.59 | 21.26 ± 18.97 | 20.09 ± 9.36 | 8.71 ± 8.17 | <0.001 | 2 < 1 < 3, 4 |
| IL-2 | 0.87 ± 0.20 | 0.69 ± 0.15 | 0.97 ± 0.17 | 0.85 ± 0.16 | 0.78 ± 0.19 | <0.001 | 2 < 1, 3, 4 |
| IL-6 | 2.34 ± 2.94 | 1.06 ± 1.02 | 17.33 ± 16.89 | 4.95 ± 6.34 | 2.40 ± 4.61 | <0.001 | 1, 2, 4 < 3 & 2 < 4 |
| IL-8 | 24.02 ± 22.45 | 6.56 ± 7.82 | 156.54 ± 112.50 | 15.84 ± 14.89 | 17.45 ± 32.27 | <0.001 | 1, 2, 4 < 3 & 2 < 1 |
| CXCL10 | 55.40 ± 41.70 | 8.85 ± 12.07 | 694.11 ± 480.81 | 120.23 ± 78.23 | 56.22 ± 133.99 | <0.001 | 2 < 1 < 4 < 3 |
| MCP-1 | 302.47 ± 158.07 | 145.63 ± 97.77 | 529.10 ± 362.76 | 1046.79 ± 603.13 | 323.14 ± 380.17 | <0.001 | 2 < 1, 3 < 4 |
| MIP-1β | 4.03 ± 2.55 | 1.98 ± 1.23 | 13.29 ± 10.58 | 5.02 ± 2.79 | 3.34 ± 3.17 | <0.001 | 2 < 1, 4 < 3 |
| RANTES | 12.11 ± 6.24 | 4.34 ± 2.62 | 11.66 ± 6.59 | 22.97 ± 10.34 | 9.52 ± 8.34 | <0.001 | 2 < 1 < 4 & 3 < 4 |
| TNFα | 1.12 ± 0.88 | 0.61 ± 0.19 | 1.98 ± 0.41 | 0.82 ± 0.27 | 0.84 ± 0.61 | <0.001 | 2 < 1 < 3 & 4 < 3 |
| NGF | 0.37 ± 0.22 | 0.40 ± 0.31 | 0.32 ± 0.11 | 0.31 ± 0.07 | 0.38 ± 0.25 | 0.512 | |
| 8-OHdG | 36.41 ± 15.07 | 22.78 ± 16.38 | 28.90 ± 18.83 | 55.04 ± 11.11 | 31.65 ± 18.76 | <0.001 | 2 < 1< 4 & 3 < 4 |
| 8-isoprostane | 33.70 ± 23.90 | 28.28 ± 23.46 | 64.22 ± 50.83 | 84.04 ± 54.55 | 38.13 ± 35.00 | <0.001 | 1, 2 < 4 |
| TAC | 1758.7 ± 1238.8 | 1290.0 ± 977.2 | 2432.8 ± 2199.1 | 4049.8 ± 2935.1 | 1828.9 ± 1711.6 | <0.001 | 1, 2 < 4 |
| Cluster 1 | Cluster 2 | Cluster 3 | Cluster 4 | |
|---|---|---|---|---|
| Composition |
|
|
|
|
| Clinical Characteristics * | Higher VAS pain score, higher MBC | Higher VAS pain score, higher MBC | Not discussed | Lower VAS pain score, lower MBC |
| Urine Biomarker Profiles | Intermediate biomarker levels (higher than Cluster 2 but lower than Cluster4): Eotaxin, IL-2, IL-8, CXCL10, RANTES, and 8-OHdG | Lowest levels of most biomarkers among all clusters | Considered outliers with unique biomarker expressions | Highest levels of oxidative stress biomarkers (8-OHdG, 8-isoprostane, and TAC) and inflammatory biomarkers (Eotaxin, IL-6, CXCL10, MCP-1, and RANTES) |
| Treatment Outcomes (GRA) * | 43.3% of patients achieving moderate to marked improvement (GRA ≧ +2) | 51.1% of patients achieving moderate to marked improvement (GRA ≧ +2) | Not discussed | 0% of patients achieving marked improvement (GRA = +3) (significantly lower compared to other clusters) |
| Clinical Correlations * | Weak to moderate correlations between urine biomarkers and cystoscopic hydrodistention parameters (MBC, glomerulation grade) | Weak correlations between urine biomarkers and various clinical parameters, including pain severity, cystoscopic hydrodistention parameters (MBC and glomerulation grade), and treatment response (GRA) | Not discussed | Moderate to strong correlations between urine biomarkers and clinical symptoms, pain severity, and treatment response (GRA) |
Disclaimer/Publisher’s Note: The statements, opinions and data contained in all publications are solely those of the individual author(s) and contributor(s) and not of MDPI and/or the editor(s). MDPI and/or the editor(s) disclaim responsibility for any injury to people or property resulting from any ideas, methods, instructions or products referred to in the content. |
© 2025 by the authors. Licensee MDPI, Basel, Switzerland. This article is an open access article distributed under the terms and conditions of the Creative Commons Attribution (CC BY) license (https://creativecommons.org/licenses/by/4.0/).
Share and Cite
Jiang, Y.-H.; Jhang, J.-F.; Wang, J.-H.; Wu, Y.-H.; Kuo, H.-C. Applying K-Means Cluster Analysis to Urinary Biomarkers in Interstitial Cystitis/Bladder Pain Syndrome: A New Perspective on Disease Classification. Int. J. Mol. Sci. 2025, 26, 3712. https://doi.org/10.3390/ijms26083712
Jiang Y-H, Jhang J-F, Wang J-H, Wu Y-H, Kuo H-C. Applying K-Means Cluster Analysis to Urinary Biomarkers in Interstitial Cystitis/Bladder Pain Syndrome: A New Perspective on Disease Classification. International Journal of Molecular Sciences. 2025; 26(8):3712. https://doi.org/10.3390/ijms26083712
Chicago/Turabian StyleJiang, Yuan-Hong, Jia-Fong Jhang, Jen-Hung Wang, Ya-Hui Wu, and Hann-Chorng Kuo. 2025. "Applying K-Means Cluster Analysis to Urinary Biomarkers in Interstitial Cystitis/Bladder Pain Syndrome: A New Perspective on Disease Classification" International Journal of Molecular Sciences 26, no. 8: 3712. https://doi.org/10.3390/ijms26083712
APA StyleJiang, Y.-H., Jhang, J.-F., Wang, J.-H., Wu, Y.-H., & Kuo, H.-C. (2025). Applying K-Means Cluster Analysis to Urinary Biomarkers in Interstitial Cystitis/Bladder Pain Syndrome: A New Perspective on Disease Classification. International Journal of Molecular Sciences, 26(8), 3712. https://doi.org/10.3390/ijms26083712