Abstract
Metformin, a widely used antidiabetic drug, modulates the cellular physiology and metabolism of various body tissues, including adipose tissue. Adipogenesis, a complex process in which mesenchymal stem cells (MSC) differentiate into functional adipocytes, plays a key role in metabolic health and represents a potential therapeutic target for diverse metabolic disorders. Notably, recent evidence suggests that metformin modulates adipocyte differentiation. This narrative review explores the effects of metformin on cellular metabolism, with a particular focus on adipogenesis. The findings compiled in this review show that metformin regulates glucose and lipid metabolism in multiple tissues, including skeletal muscle, adipose tissue, liver, and intestine. Furthermore, metformin modulates adipogenesis through AMP-activated protein kinase (AMPK)-dependent and independent mechanisms in 3T3-L1 cells and adipose-derived stem cells. The review also emphasizes that metformin can promote or inhibit adipogenesis and lipid accumulation, depending on its concentration. Additionally, metformin attenuates inflammatory pathways by reducing the production of proinflammatory cytokines such as IL-6, MCP-1, and COX-2. Finally, evidence supports that vitamin D enhances the anti-inflammatory actions of metformin and promotes cell differentiation toward a beige adipocyte phenotype. In summary, this review examines the molecular actions of metformin to propose potential new therapeutic strategies for managing obesity and related metabolic diseases.
1. Introduction
Type 2 diabetes mellitus (T2DM) and obesity are two of the major chronic non-communicable diseases that represent a significant global public health challenge. T2DM is characterised by chronic hyperglycaemia due to a combination of insulin resistance and insufficient insulin secretion from the β-cells of the pancreatic islets [1,2]. The prevalence of these diseases has risen alarmingly in recent decades, mainly due to unhealthy dietary patterns, sedentary lifestyles, and an aging population. It is estimated that more than 537 million adults will be living with diabetes in 2021, and this number is projected to reach 783 million by 2045 [3].
In 1957, Jean Sterne introduced metformin as a therapeutic option for T2DM, revolutionising the management of this chronic condition. The clinical benefits of metformin are strongly supported by evidence, including its long-term safety and efficacy, low risk of hypoglycaemia, and positive effects on cardiovascular health and mortality [4,5]. In addition, its therapeutic profile includes advantages such as moderate body weight reduction, low cost, and wide availability, making it an accessible and effective option [6]. More than 200 million people with T2DM worldwide use metformin as part of their daily treatment. It is used as monotherapy and with other antidiabetic agents, such as sulphonylureas or dipeptidyl peptidase-4 (DPP-4) inhibitors, showing additive or synergistic effects optimizing glycemic control. These characteristics consolidate metformin as a central pillar in the treatment of T2DM. Surprisingly, the mechanisms underlying its therapeutic action are complex and still not fully understood.
The effect of metformin on the AMPK pathway and other molecular mechanisms offers promising prospects for understanding and treating metabolic disorders. In this context, metformin has shown a significant impact on adipogenesis. Several experimental studies have suggested that metformin promotes triglyceride catabolism in adipocytes by activating AMP-activated protein kinase (AMPK) and inhibits lipid accumulation in preadipocytes, thereby reducing fat storage.
Adipogenesis is the process of cell differentiation that transforms mesenchymal stem cells into mature adipocytes, characterised by their ability to store lipids and regulate energy metabolism. This process occurs in several well-defined stages and is regulated by key transcription factors such as peroxisome proliferator-activated receptor gamma (PPARγ) and CCAAT/enhancer-binding proteins (C/EBPβ and C/EBPα). These factors, especially PPARγ, play a key role in adipocyte maturation and are associated with metabolic pathologies such as obesity and insulin resistance [7]. This article reviews recent findings on the effects of metformin on adipogenesis and its potential impact on metabolic health, focusing on its therapeutic applications in obesity and related disorders.
2. Metabolic Actions of Metformin: Mechanisms and Effects Across Key Tissues
Metformin, a drug from the biguanide family, is primarily prescribed for managing T2DM, especially in individuals with overweight or obesity, due to its metabolic benefits beyond glucose-lowering effects [6]. Additionally, it has been linked to several off-label uses, including the treatment of polycystic ovary syndrome, steatohepatitis, and metabolic disorders associated with HIV [8].
Metformin is administered orally and is available in immediate and extended-release formulations [9]. With a pKa of 12.3, metformin predominantly exists in a hydrophilic, positively charged form at physiological pH, a key factor influencing its pharmacokinetics [10]. This charge minimizes its ability to dissolve in lipids, reducing the likelihood of passive diffusion across cell membranes. As a result, metformin depends on specific transport proteins for its pharmacokinetics. PMAT (plasma membrane monoamine transporter) facilitates the absorption of metformin in the gastrointestinal tract. In contrast, OCT1 and OCT3 (organic cation transporters 1 and 3) are crucial for its distribution to the liver and its excretion in an unchanged form through the kidneys [9].
The most common adverse effects of metformin are gastrointestinal, including diarrhea, nausea, vomiting, and abdominal pain [6]. Reduced OCT1 activity has been associated with elevated intestinal levels of metformin, which can intensify these side effects [11,12]. These gastrointestinal reactions can negatively affect patient adherence to treatment, potentially compromising effective glycemic control. Another potential adverse effect of metformin is lactic acidosis, which results from the accumulation of lactate in the liver and muscle due to the inhibition of mitochondrial complex I [13]. Patients with impaired renal function are at a higher risk of developing lactic acidosis as reduced kidney clearance can exacerbate lactate accumulation. For this reason, metformin is contraindicated in patients with a glomerular filtration rate (GFR) below 30 mL/min per body surface area [14].
Metformin exerts its hypoglycemic effects by targeting various tissues, including the liver, skeletal muscle, and intestine. Metformin is transported into hepatocytes via OCT1 in the liver, inhibiting complex I of the mitochondrial electron transport chain [4]. This inhibition results in decreased ATP production and elevated AMP levels, activating AMP-activated protein kinase (AMPK), a key enzyme in regulating energy homeostasis. The activation of AMPK suppresses hepatic gluconeogenesis by inhibiting enzymes such as adenylate cyclase and fructose-1,6-bisphosphatase (FBP1). Furthermore, AMPK downregulates the expression of sterol regulatory element-binding protein-1C (SREBP-1C), thereby reducing the synthesis of fatty acids and minimizing fat accumulation in the liver [15]. In the intestine, metformin enhances glucagon-like peptide 1 (GLP-1) secretion through the AMPK signaling pathway, contributing to improved glucose regulation. In skeletal muscle, the activation of AMPK facilitates the translocation of GLUT4 glucose transporters to the cell membrane, promoting glucose uptake into muscle cells. This increase in glucose utilization helps to lower plasma glucose levels, further supporting its antidiabetic action [15].
2.1. Metabolic Actions of Metformin in the Liver
Metformin reaches high concentrations in the liver, and this tissue has been considered its central site of action for many years [16]. Metformin reduces hepatic gluconeogenesis by decreasing the respiratory chain’s mitochondrial complex I activity and reducing oxygen consumption [17,18]. The energetic imbalance produced by metformin blunted energy-consuming processes like glucose production. In rat primary hepatocytes, metformin activates AMPK, reduces the activity of its downstream target acetyl-CoA carboxylase (ACC), and stimulates fatty acid oxidation [19]. However, some recent evidence questioned the role of the AMPK pathway in metformin-induced gluconeogenesis inhibition [20]. Miller et al. propose that metformin antagonizes glucagon-induced hepatic glucose production via inhibition of PKA signaling in vitro and in vivo, in a mechanism independent of AMPK [21]. On the other hand, Madiraju et al. demonstrated that acute and chronic metformin treatment increases the cytosolic and reduces the mitochondrial redox state in the liver of Sprague-Dawley rats through non-competitive inhibition of mitochondrial glycerophosphate dehydrogenase (mGDP) [22]. The reduction in mGDP activity alters the use of glycerol and lactate as substrates for gluconeogenic flux [22]. Moreover, Duca et al. propose an interorgan axis that regulates hepatic glucose production that involves duodenal AMPK-dependent PKA activation, afferent signaling to the nucleus of the solitary tract (NTS) in the brain, and vagal stimulation of hepatic gluconeogenesis, revealing a complex system of glucose production regulation [23]. It has been proposed that metformin also regulates metabolism by modulating insulin signaling. Gunton et al. showed that metformin increases insulin receptor phosphorylation, insulin receptor substrate 2 (IRS-2) activation, GLUT1 translocation to the plasma membrane, and glucose uptake in the Huh7 cell line and primary human hepatocytes [24].
2.2. Metabolic Actions of Metformin in Skeletal Muscle
Skeletal muscle is the most abundant tissue in the human body, accounting for approximately 40% of body weight [25]. This tissue is the main responsible for glucose disposal in postprandial conditions, mainly in response to insulin [25]. In pathological conditions like obesity and type 2 diabetes, skeletal muscle insulin sensitivity is blunted, reducing its capacity to incorporate glucose and contributing to hyperglycemia [26]. Metformin enters muscle cells via organic cation transporter 3 (OCT3), although the intracellular concentrations achieved in muscle are lower than those achieved in the liver or kidney [26]. Regarding the metformin mechanism of action, Pavlovic et al. argued that the drug inhibits mitochondrial complex I and activates AMPK only in supra-therapeutic concentrations in C2C12 skeletal muscle cell line [27]. Conversely, Suwa et al. have demonstrated that the acute administration of metformin in rats increases AMPK phosphorylation at 6 h, while the chronic administration of metformin (14 days) increases the expression of PGC-1 alpha, cytochrome C and augments the activity of oxidative enzymes, suggesting that metformin stimulates the mitochondrial biogenesis in rat skeletal muscle [28]. Also, the oral administration of metformin for 2 weeks increases insulin-stimulated glucose uptake in the soleus muscle of mice, in a process dependent on AMPK and independent of changes in the insulin signaling pathway [29]. In a clinical context, it has been described that 10 weeks of metformin treatment in type 2 diabetic patients increases the activity and phosphorylation of AMPK at Thr-172 residue and reduces the activity of acetyl-CoA carboxylase (ACC-2) in skeletal muscle. The enhanced activity of AMPK is related to a decrease in ATP and phospho-creatine levels in diabetic patients treated with metformin [30]. Moreover, Polianskyte-Prause et al. showed that metformin potentiates insulin-induced GLUT4 translocation to plasma membrane and glucose uptake in L6 myotubes through the direct inhibition of Src homology 2 containing inositol 5-phosphatase 2 (SHIP-2) [31]. This enzyme dephosphorylates phosphatidylinositol 3,4,5-trisphosphate (PI(3,4,5)P3) to produce PI(3,4)P2, decreasing insulin-dependent signaling in plasma membrane [32]. Increased expression of SHIP-2 has been observed in insulin resistance and diabetes [32]. Concerning the actions of metformin in lipid metabolism, it has been demonstrated that metformin modifies the intramyocellular lipid profile, which plays an essential role in the development of insulin resistance in skeletal muscle [33]. Using [U-13C] palmitate and mass spectroscopy, Zabielski et al. showed that a high-fat diet increases intramyocellular levels of long-chain fatty acids, diacylglycerols, and ceramides in mice skeletal muscle [33]. In this context, the administration of metformin reduces the intracellular levels of these lipid mediators and improves systemic and muscular insulin sensitivity [33].
2.3. Metabolic Actions of Metformin in Adipose Tissue
The OCT3 transporter is expressed in adipocytes, possibly allowing metformin cellular transport [34]. Interestingly, metformin accumulates into brown adipose tissue (BAT), reaching levels comparable to the liver, kidney, and intestine [34]. Metformin stimulates glucose uptake in human adipocytes via AMPK-dependent GLUT4 translocation to the plasma membrane without affecting insulin signaling [35]. In 3T3-preadipocytes, Lee et al. showed that GLUT4 translocation to the plasma membrane depends on AMPK and Cbl/CAP signaling [36]. Metformin also regulates glucose metabolism by inhibiting the lipid phosphatase PTEN, which alters insulin signaling pathways in NIH3T3-preadipocytes [37]. Karise et al. evaluated the effect of metformin supplementation in C57Bl/6 mice fed with a high fructose diet [38]. Interestingly, metformin increases proliferation and differentiation markers in brown adipocytes, possibly through an AMPK-dependent mechanism [38]. Also, metformin induces mitochondrial biogenesis and thermogenesis and stimulates lipolysis and fatty acid uptake in BAT [38]. Moreover, Geerling et al. showed that metformin reduces total plasma cholesterol and triglycerides mainly by increasing VLDL triglyceride uptake in BAT, intracellular lipolysis, and mitochondrial fatty acid oxidation in mice [39]. Metformin treatment also reduces visceral fat mass in rats, which is related to increased fatty acid oxidation and UCP-1 overexpression in BAT [40].
2.4. Metabolic Actions of Metformin at the Intestinal Level
Recent works have shown that metformin reaches a high concentration in enterocytes, and its intestinal actions could play an essential role in systemic metabolic regulation [41,42]. Diverse reports indicate that metformin reduces the intestinal absorption of diet-administered glucose [43,44,45]. Zubiaga et al. [42] propose that metformin reduces the apical density of sodium-glucose transporter 1 (SGLT1), explaining the diminished glucose absorption [42]. This work also shows that the direct administration of metformin in the jejunum of minipigs increases the release of the intestinal hormone GLP-1 [42]. Consistent with these findings, Borg et al. have shown that the administration of metformin in the proximal and distal portions of the intestine reduces the plasma glucose, slows the gastric emptying, and increases the secretion of GLP-1 in type 2 diabetic patients [44]. On the other hand, it has been proposed that metformin stimulates plasma glucose transport into the enterocytes, helping to reduce plasma glucose levels in diabetic patients [45]. Tobar et al. demonstrate that metformin stimulates the basolateral transport of glucose into enterocytes in hyperglycemia through a mechanism that involves an AMPK-dependent increase in GLUT1 and GLUT2 glucose transporter expression [46]. Glucose in enterocytes is converted to lactate, reducing the portal vein’s pH and NaHCO3 levels. These processes decrease hepatic gluconeogenesis by inhibiting pyruvate carboxylase in the liver [46]. In the same direction, Schommers et al. observed that the beneficial effects of metformin in glycemic control and body weight in high-fat diet-fed mice are related to an accumulation of lactate in the intestinal wall and the venous portal circulation [47]. These authors hypothesized that the use of lactate as a substrate for hepatic gluconeogenesis generates a futile cycle of glucose-lactate-glucose, which has a high energetic cost and would explain, along with the energetic cost associated with maintaining pH homeostasis, the reduction in body weight and the reduction of insulin resistance in HFD feed mice treated with metformin [47].
3. Adipogenesis and Metabolic Health: Regulation, Implications, and the Role of Metformin
3.1. Mechanisms of Adipogenesis
Adipogenesis is the differentiation process by which a mesenchymal stem cell (MSC) develops into a functional adipocyte with specific phenotypic features. During this process, MSCs respond to extracellular signals and undergo stages of proliferation and clonal expansion that produce pre-adipocytes, cells with high plasticity that later differentiate into mature adipocytes [48,49]. Adipocytes are spherical in appearance, between 10 and 100 µm in diameter, with clustered organelles and a nucleus displaced towards the periphery of the cell due to a unilocular triglyceride vesicle that occupies most of the cytoplasm, limiting the presence of other organelles such as mitochondria and the Golgi apparatus [50,51].
Adipogenesis occurs in several well-defined stages, starting with the conversion of MSCs into preadipocytes. Although these preadipocytes are not morphologically differentiated from their progenitor cells, they show the activation of specific transcription factors. AP-1 family factors and C/EBPβ and C/EBPδ are activated in this first phase. These proteins induce a crucial second step in activating key differentiation genes, such as PPARγ and C/EBPα, which regulate adipocyte maturation and function [52,53].
PPARγ is considered the most essential transcription factor in adipogenic differentiation, as its activation induces both morphological changes and the expression of genes specific to mature adipocytes [54]. This factor is critical in white and brown adipose tissue and exists in two isoforms produced by alternative splicing. The PPARγ2 isoform is predominantly expressed in adipose tissue, promotes triglyceride storage, and is associated with obesity, insulin resistance, and dyslipidaemia. In contrast, the PPARγ1 isoform is found in several cell types and is more widely distributed [55]. The positive feedback between PPARγ and C/EBPα creates a loop that maintains sustained expression of genes essential for adipogenesis, including those involved in insulin sensitivity, lipolysis, and lipogenesis [54,56].
Adipocyte differentiation is a complex process tightly regulated by the temporal and specific expression of proteins and transcription factors. A thorough understanding of the molecular mechanisms that regulate adipogenesis is fundamental to understanding the pathogenesis of metabolic disorders such as metabolic syndrome, diabetes, and cardiovascular disease.
Adipogenesis influences the maintenance of metabolic health, particularly the metabolic processes associated with obesity. Understanding the mechanisms and regulators of adipogenesis is essential for developing effective strategies to improve metabolic health. Adipogenesis may counteract the detrimental metabolic effects of overweight and obesity by generating new adipocytes rather than expanding existing adipocytes, which tend to have a pro-inflammatory and hypoxic profile. The expansion of adipose tissue through adipogenesis results in a healthier profile characterised by smaller and more numerous adipocytes, with less inflammation and fibrosis, contributing to better metabolic health [57,58,59,60,61].
Multiple factors and events regulate adipogenesis and may contribute to the aetiology of obesity [62]. Recent evidence suggests that metformin, a hypoglycaemic agent, is emerging as a modulator of adipose tissue physiology, particularly adipogenesis. Here, we explore this topic in more detail by examining the mechanisms by which metformin may influence adipocyte differentiation and function.
3.2. Effect of Metformin on Adipogenesis
3.2.1. Metformin’s Biphasic Role in Adipogenesis: Dose-Dependent Effects and Mechanistic Insights
The first studies that have demonstrated the effect of metformin on differentiation into mature adipocytes have been carried out mainly in experimental models using cell cultures of the 3T3 L1 mouse line or human adipose tissue pre-adipocytes.
Among the first studies reported in scientific literature on the effect of metformin on adipogenesis is the work of the group of Alexandre [63]. This work is of interest because its methodological approach is close to that currently used to achieve MSC differentiation into adipocytes. In addition, the authors considered two antecedents to establish their hypothesis. The first background was that it had already been shown that metformin can stimulate triglyceride catabolism in adipocytes through activation of adenosine monophosphate-activated protein kinase (AMPK) [64], The second was that a synthetic AMPK activator, 5-aminoimidazole 4-carboxamide ribofuranoside (AICAR), inhibits adipogenesis in the preadipocyte cell line 3T3-L1 [63].
Alexandre [63] cultured 3T3-L1 cells for 8 days exposed to 1 mM AICAR in the presence of 2–16 mM metformin. These experiments found that preadipocytes in the presence of metformin showed increased phosphorylation of AMPK at Thr172 and decreased accumulation of significantly less lipid than in untreated cells, indirectly suggesting that metformin inhibits adipogenesis. By examining the role of metformin in adipogenesis and its influence on AMPK activation, the study contributes to understanding the molecular mechanisms underlying metabolic regulation and potential targets for drug development.
Metformin affects adipogenesis through both AMPK-dependent and AMPK-independent mechanisms. At higher concentrations, metformin activates AMPK, which suppresses adipogenesis by decreasing the phosphorylation of extracellular signal-regulated kinases (ERK) and Akt while increasing the phosphorylation of p38 and c-Jun N-terminal kinase (JNK). In addition to its AMPK-mediated effects, metformin also exerts AMPK-independent effects. For example, it inhibits mTOR/p70S6K signalling, which appears to occur independently of AMPK activation. These diverse mechanisms suggest that metformin’s effects on adipogenesis involve multiple signaling pathways beyond AMPK activation [65].
Metformin has a dual effect on adipogenesis, with lower concentrations (1.25 and 2.5 mM) promoting adipocyte differentiation and higher concentrations (5 and 10 mM) inhibiting this process. This biphasic response was evident in both gene expression and lipid accumulation in the cells. Metformin significantly increased the expression of key adipogenic and lipogenic genes at lower concentrations, including PPARγ, C/EBPα, FASN, FATCD36, SCD-1, and aP2. In contrast, higher concentrations decreased the expression of these genes, highlighting the dose-dependent nature of metformin’s effects on adipogenesis. Only higher concentrations of metformin induced the phosphorylation of AMPK, p38, and JNK while reducing the phosphorylation of ERK and Akt. This suggests that the inhibitory effects of metformin on adipogenesis at higher doses may be mediated through the activation of AMPK. In support of this, pretreatment with compound C, a specific AMPK inhibitor, reversed the inhibitory effects of high doses of metformin on adipogenesis, suggesting that the anti-adipogenic effects of metformin at higher doses are at least partially dependent on AMPK signalling [66].
3.2.2. Metformin’s Regulatory Effects on Adipogenesis: Modulation of Lipid Storage, Inflammation, and Epigenetic Mechanisms
Yang’s study [67] identified significant effects of metformin on adipose-derived stem cells (ADSCs), highlighting its potential to modulate fat storage and obesity-related mechanisms. One of the key findings was metformin’s ability to inhibit lipid accumulation in epididymal (Epi-ADSCs) and inguinal (Ing-ADSCs) adipose-derived stem cells, suggesting that this drug could effectively reduce fat storage.
In addition, the study showed that metformin inhibits the fusion and growth of lipid droplets in ADSCs. Consistently, metformin was found to down-regulate several proteins essential for adipogenesis, including Cidec, Perilipin1, and Rab8a. Cidec and Perilipin1 are involved in the fusion, growth, and stability of lipid droplets, while Rab8a is involved in lipid transport within cells. The reduced expression of these proteins is consistent with the inhibitory effect of metformin on lipid storage, suggesting that metformin interferes with pathways critical for the maturation and storage capacity of adipose cells. Activation of the AMPK pathway appears to be a key mediator of these effects, as it is associated with decreased expression of proteins such as Cidec, Perilipin1, and Rab8a. As this pathway is an essential regulator of energy balance and metabolism, the effect of metformin on lipid metabolism could be partly explained by its impact on AMPK signalling. The study also assessed cell viability using cell counting assay 8 (CCK-8) and showed a dose-dependent effect. While metformin concentrations of 1 mM, 2 mM, and 4 mM did not significantly affect cell viability, a concentration of 8 mM showed reduced cell viability. This suggests that the beneficial effects of metformin on lipid inhibition and adipogenesis regulation are maintained at moderate doses without compromising cell health [67].
Metformin can significantly affect the morphology, physiology, and gene expression of 3T3-L1 cells as they differentiate into adipocytes. Morphologically, metformin attenuates changes typical of adipogenesis and visibly affects the structure of lipid droplets. This change in lipid morphology suggests that metformin may reduce lipid accumulation during adipocyte differentiation, which may contribute to its anti-obesity effects. Regarding physiological changes, metformin may not only improve the appearance of adipocytes but also alter the functional properties of lipid droplets. These physiological adjustments highlight the effect of metformin on lipid metabolism and storage dynamics in adipocytes, suggesting that its action goes beyond superficial changes and extends to functional improvements in adipocytes [68]. In addition, metformin reduces pro-inflammatory cytokine secretion and enhances adipogenic differentiation in stem cells, promoting a shift to a more metabolically active phenotype. It suppresses inflammatory markers such as IL-6 and MCP-1 [69] and increases autophagy in ADSCs, reinforcing their role in regulating inflammation during adipogenesis [70].
A study by Liao [71] investigated how metformin affects FTO protein methylation and m6A modification in adipocytes. The objectives included assessing the effect of metformin on FTO expression and m6A methylation levels of key cell cycle genes, particularly those involved in mitotic clonal expansion (MCE), a crucial process in which pre-adipocytes proliferate before differentiating into mature adipocytes. The results showed that metformin inhibits FTO expression, which alters m6A methylation patterns. This change affects the interaction between m6A-modified RNAs and the YTHDF2 protein, an RNA stability and turnover regulator. Inhibition of FTO by metformin and the resulting change in the m6A methylation profile disrupts YTHDF2-mediated gene regulation. This mechanism effectively blocks the ECM, preventing pre-adipocytes from completing the cell cycle steps necessary for adipogenesis.
3.2.3. Metformin’s Multifaceted Effects on Adipose Tissue: Synergistic Interactions, Oxidative Stress Reduction, and Age-Related Adipogenesis
On the other hand, a study using omental adipose tissue from forty obese individuals undergoing weight loss surgery [72] investigated the effects of metformin, insulin, and the lipid peroxidation product 4-HNE on preadipocyte adipogenesis. The researchers compared preadipocytes from insulin-resistant (IR), type 2 diabetes mellitus (T2DM), and insulin-sensitive (IS) individuals and found significant differences in their adipogenic capacity. Preadipocytes from IR and T2DM individuals showed significantly altered adipogenesis compared to those from IS individuals, with increased levels of anti-adipogenic genes. This altered adipocyte development was associated with increased levels of 4-HNE, a marker of lipid peroxidation, which in turn correlated with smaller adipocyte size and increased macrophage infiltration in the adipose tissue of patients with T2DM.
In preadipocytes derived from individuals with T2DM, combined metformin and insulin treatment improved adipogenesis more effectively than metformin treatment alone, suggesting a synergistic effect between the two drugs. This improvement was associated with a reduced presence of macrophages and reduced levels of 4-HNE, an indicator of oxidative stress, suggesting that combining the two treatments may alleviate some of the inflammatory and oxidative stress markers in adipose tissue in people with T2DM [72]. In addition, the treatment of pre-adipocytes with 4-HNE alone was shown to reduce adipogenesis and increase cell proliferation, even in the presence of metformin. However, insulin partially counteracted these negative effects, highlighting its role in promoting cell differentiation under oxidative stress conditions. These findings suggest that the combination of metformin and insulin may promote adipogenesis by reducing oxidative stress and inflammation, which may be of therapeutic benefit in the treatment of adipose tissue dysfunction in T2DM and insulin resistance [72].
The synergistic effect of insulin and metformin was also investigated by the group of Szkudelski, Konieczna, and Szkudelska [73]. In this study, adipocytes isolated from rat epididymal adipose tissue were used to assess the combined effects of both drugs on glucose transport and lipid metabolism. When administered with insulin, the results showed that metformin significantly increased glucose transport into adipocytes, suggesting a synergistic effect that enhances glucose uptake and optimises glucose metabolism in adipocytes. In addition, metformin had a significant inhibitory effect on lipolysis, or the breakdown of fat, even when stimulated by agents such as adrenaline and dibutyryl-cAMP. This inhibition was observed both at 3 mM and 12 mM glucose concentrations and when glucose was replaced by alanine, suggesting that metformin can effectively limit lipolysis under different metabolic conditions. Regarding cellular metabolism, metformin was found to reduce lactate release in adipocytes, an effect that may be related to its influence on mitochondrial function, particularly in the electron transport chain. This reduction in lactate production suggests a mechanism by which metformin improves overall metabolic efficiency, optimizing cellular energy balance and reducing the by-products of anaerobic metabolism.
Another study investigated the effects of metformin on brown adipose tissue (BAT) in a high-fructose diet model, focusing on markers of BAT proliferation, differentiation, and thermogenesis. To this end, an isoenergetic mouse model was used for ten weeks, receiving either a control diet (C) or a high fructose diet (F). For a further eight weeks, the animals were treated with metformin hydrochloride (M, 250 mg/kg/day) or saline. Results showed no significant differences in body weight gain, white fat pads, or adiposity index between the groups. Energy intake was reduced in group F, and energy expenditure was lower in groups F and FM. Metformin treatment resulted in increased BAT mass in the CM and FM groups, associated with increased adipocyte proliferation -β1-adrenergic receptor, proliferating cell nuclear antigen, and vascular endothelial growth factor- and differentiation (PR domain containing 16, bone morphogenetic protein 7), partly through activation of AMPK. In addition, metformin increased thermogenic markers in BAT through adrenergic stimulation and fibroblast growth factor 21. Metformin can also increase mitochondrial biogenesis in BAT, lipolysis, and fatty acid uptake [38].
Aging is linked to central fat redistribution and insulin resistance. To investigate age-related changes in fat tissue, Le Pelletier’s group [74] examined the senescence and adipogenic potential of adipose-derived stromal cells (ASCs) from abdominal subcutaneous fat in healthy young women (under 25 years) and older women (over 60 years). As cell passages increased, ASCs from young donors (in vitro aging) developed senescence without oxidative stress. Adipocytes derived from these ASCs exhibited impaired adipogenesis but maintained early mitochondrial function. By contrast, early-passage ASCs from older donors displayed oxidative stress and mild senescence, with derived adipocytes showing both oxidative stress and early mitochondrial dysfunction, though adipogenesis remained intact. Extended in vitro aging of ASCs from older donors led to increased senescence, mitochondrial dysfunction, oxidative stress, and severe adipocyte dysfunction. Metformin treatment did not mitigate these effects in aged ASCs from young donors; however, it did reduce oxidative stress, mitochondrial dysfunction, and senescence in ASCs from older donors. This reduction of oxidative stress and senescence by metformin improved adipogenic capacity and insulin sensitivity, mediated through AMPK activation, as confirmed by specific inhibition and activation studies. Overall, adipocytes derived from aged ASCs showed impaired adipogenesis and insulin sensitivity, suggesting that targeting stress-induced senescence in ASCs with metformin may counteract age-related adipose tissue dysfunction [74].
At a concentration of 3 mM, metformin inhibits human umbilical cord-mesenchymal stem cells (UC-MSC) proliferation and colony formation. Concurrently, it enhances their adipogenic differentiation by increasing PPARγ expression, a key regulator in the adipogenesis pathway, while downregulating FABP4 expression, which plays a role in fatty acid binding and adipocyte function. Additionally, metformin appears to exert anti-inflammatory effects, evidenced by decreased expression levels of pro-inflammatory cytokines such as IL-6, MCP-1, and COX-2 [69]. Table 1 summarizes the different cell models utilized to investigate the effects of metformin on adipogenesis. These models include both murine and human-derived preadipocytes.

Table 1.
Cell models used to study the influence of metformin during adipogenesis.
Bioinformatics tools allow cross-referencing with databases of known genes and pathways, such as the AMPK pathway, which is frequently implicated in adipogenesis and is regulated by metformin. This integrated approach facilitates the robust identification of both up- and down-regulated genes and reveals potential targets that mediate the effects of metformin on lipid metabolism, inflammation, and cell differentiation. At the molecular level, high-throughput sequencing analysis revealed significant changes in the expression of adipogenesis-related genes, providing a detailed transcriptomic profile of the effect of metformin [68]. This change in the transcriptome is key to understanding how metformin affects adipocyte differentiation, involving different pathways and regulatory mechanisms (see Table 2).
Table 2.
Key genes involved in adipogenesis, their primary functions, and regulatory changes in response to metformin.
3.3. Effect of Metformin and Vitamin D on Adipogenesis
The combined effect of metformin and vitamin D has been extensively studied in various experimental models and clinical trials. These studies suggest a synergistic effect between the two substances under different physiological conditions, enhancing their effect on the body (Figure 1).
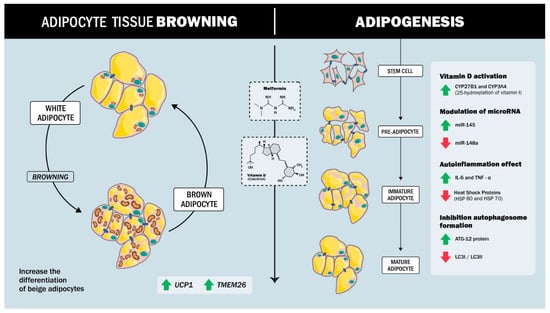
Figure 1.
Synergistic effect between metformin and vitamin D in regulating adipogenesis and inflammation. Metformin and Vitamin D promote a shift toward a metabolically active beige adipocyte phenotype and inhibit conventional white adipogenesis, inflammation, and autophagosome formation.
The synergistic regulation of adipogenesis by vitamin D and metformin involves complex molecular mechanisms that modulate stem cell differentiation and inflammatory responses. Both agents act on ADSCs, promoting a shift toward a beige adipocyte phenotype and inhibiting conventional adipogenesis. In the studies by Cruciani’s [75], both metformin and vitamin D were found to significantly reduce adipogenesis in ADSCs, demonstrating that these substances inhibit adipocyte formation and promote differentiation into beige adipocytes. Analysis of key markers of adipogenesis, such as aP2, LPL, and ACOT2, together with the thermogenic protein UCP1 and the beige adipocyte-specific marker TMEM26, showed that metformin and vitamin D increased the expression of these markers and supported the transition to a beige phenotype [75]. Previous studies by the same group had already shown that metformin inhibits adipogenesis in the presence of vitamin D. This research suggests that metformin modulates vitamin D metabolism through the expression of specific enzymes, in particular the cytochrome P450 isoforms CYP27B1 and CYP3A4, responsible for vitamin D metabolism, and in particular 25-hydroxylation (CYP3A4 and CYP27A1). This modulation is fundamental as it suggests a regulatory mechanism that could influence the response of ADSCs to adipogenic stimuli in the presence of metformin or vitamin D.
On the other hand, miRNAs have recently been found to be involved in several metabolic dysfunctions, especially in adipose tissue, where they control processes such as adipogenesis, insulin resistance, and inflammation. For example, miR-145 is downregulated during adipogenesis, and its overexpression inhibits this process by reducing the activity of PI3K/Akt and MAPK signalling pathways [76,77]. In contrast, miR-148a promotes adipogenic differentiation when up-regulated, while its down-regulation inhibits preadipocyte differentiation [78,79,80]. In a study by Cruciani [81], it was shown that, during adipogenesis in ADSCs isolated from subcutaneous adipose tissue of human patients (men and women), miR-145 is up-regulated, whereas miR-148a is down-regulated in the presence of metformin and vitamin D, with a synergistic effect between the two compounds.
Vitamin D, particularly in its active form 1,25-dihydroxyvitamin D3, is crucial in modulating inflammation and metabolic processes in adipose tissue. Some studies have shown that this active form of vitamin D can significantly reduce pro-inflammatory markers such as interleukin-6 (IL-6), monocyte chemoattractant protein-1 (MCP-1), and tumor necrosis factor-alpha (TNF-α) in adipocytes [82,83]. These anti-inflammatory effects are mediated by the vitamin D receptor (VDR), to which vitamin D binds to inhibit NF-κB signalling, a pathway often implicated in chronic inflammation. By blocking NF-κB, vitamin D also reduces the expression of specific microRNAs closely associated with inflammatory responses [83]. In addition to its immunomodulatory effects, vitamin D promotes glucose uptake and increases AKT phosphorylation, which are key steps in metabolism and cellular energy management. This dual role—suppressing inflammation and improving metabolic function—suggests that vitamin D may play an integrative role in reducing inflammation-induced metabolic dysfunction [82].
The combination of vitamin D and metformin has shown a synergistic effect in modulating the inflammatory response and promoting the differentiation of white adipocytes to a beige phenotype. This combination therapy attenuates inflammation by targeting specific pathways that decrease pro-inflammatory cytokines while activating anti-inflammatory mechanisms [75].
A study by Cruciani [81] explored the effects of metformin and vitamin D on inflammation, autophagy, and cellular responses to stress during ADSC differentiation. The findings indicate that metformin and vitamin D, both individually and in combination, modulate adipogenic differentiation, suggesting that these compounds may influence the process of ADSC to adipocyte conversion. In terms of inflammation, the study observed a marked reduction in the secretion of pro-inflammatory cytokines, including IL-6 and TNF-α, during ADSC differentiation. This anti-inflammatory effect is particularly relevant as chronic inflammation is linked to obesity and insulin resistance. The results suggest that metformin and vitamin D may help mitigate these risk factors during cell differentiation.
Autophagy, a process essential for cellular homeostasis, was also assessed using key proteins such as ATG12, LC3B I, and LC3B II by western blot analysis. The results indicated that metformin and vitamin D treatment promoted autophagy, crucial for maintaining cell integrity and function during differentiation [81].
In addition, the treatments modulated the expression of heat shock proteins (HSPs), which are involved in the cellular stress response, as reflected by changes in HSP60 and HSP70 mRNA levels. This effect suggests that metformin and vitamin D not only reduce inflammation and autophagy but also enhance resistance to cellular stress during ADSC differentiation. Taken together, these results highlight the multifaceted role of metformin and vitamin D in regulating key processes that may contribute to the development of healthier adipocytes and improved metabolic health [81].
4. Conclusions
Metformin affects adipogenesis via several molecular processes, altering essential signaling and gene expression pathways. This medication, used as part of the treatment of T2DM, even in the early stages of the disease (pre-diabetes or insulin resistance), also could moderate lipid metabolism and adipocyte differentiation.
Metformin activates the AMPK pathway, which is crucial in the homeostatic control of energy balance and lipid and glucose metabolism. AMPK activation involves the inhibition of lipid droplet fusion and growth during adipogenesis through the down-regulation of proteins such as Cidec, Perilipin1, and Rab8a [67].
Metformin alters the adipocyte transcriptome, reversing the expression patterns of genes associated with adipogenesis and thus preventing lipid accumulation [68].
It also inhibits the expression of FTO, a regulator of adipogenesis. This increases the m6A methylation levels of cyclin D1 and cyclin-dependent kinase 2, reducing protein levels and blocking mitotic clonal expansion [71].
Additionally, metformin reduces the production of inflammatory cytokines in adipose tissue. Maintaining an anti-inflammatory state is relevant to mitigate insulin resistance and promote healthier adipocyte function [69].
Furthermore, there is a synergistic effect of metformin and vitamin D, where both substances influence adipogenesis through different but complementary molecular mechanisms, mainly involving the modulation of gene expression, inflammatory responses, and lipid metabolism. Both metformin and vitamin D can promote differentiation of preadipocytes toward a beige adipocyte phenotype, which is associated with increased thermogenesis, reduced lipid accumulation, and increased numbers of mitochondria.
Although metformin shows promise in combating obesity and regulating adipogenesis, some studies suggest that its effects may vary depending on individual metabolic conditions and other factors influencing adipose tissue physiology.
Author Contributions
Conceptualization, J.E.G.-C. and D.M.R.-G.; formal analysis, D.M.R.-G. and M.N.-M.; investigation, D.M.R.-G. and M.N.-M.; resources, J.E.G.-C., D.M.R.-G., L.A. and S.D.-A.; writing—original draft preparation, J.E.G.-C., D.M.R.-G., M.N.-M. and T.S.-T.; writing—review and editing, J.E.G.-C., D.M.R.-G., L.A., H.F.-B., T.S.-T. and S.D.-A.; visualization, J.E.G.-C. and D.M.R.-G. supervision, M.N.-M., V.B. and D.M.R.-G.; project administration, J.E.G.-C. and V.B.; funding acquisition D.M.R.-G., S.D.-A., V.B. and LA. All authors have read and agreed to the published version of the manuscript.
Funding
This research received no external funding.
Conflicts of Interest
The authors declare no conflicts of interest.
References
- American Diabetes Association. Diagnosis and classification of diabetes mellitus. Diabetes Care 2010, 33 (Suppl. S1), S62–S69, Erratum in Diabetes Care 2010, 33, e57. https://doi.org/10.2337/dc10-S062. [Google Scholar] [CrossRef] [PubMed] [PubMed Central]
- World Health Organization. Obesity and Overweight; WHO: Geneva, Switzerland, 2023; Available online: https://www.who.int/news-room/fact-sheets/detail/obesity-and-overweight (accessed on 10 March 2025).
- ElSayed, N.A.; Aleppo, G.; Aroda, V.R.; Bannuru, R.R.; Brown, F.M.; Bruemmer, D.; Collins, B.S.; Hilliard, M.E.; Isaacs, D.; Johnson, E.L.; et al. On behalf of the American Diabetes Association. 2. Classification and Diagnosis of Diabetes: Standards of Care in Diabetes-2023. Diabetes Care 2023, 46 (Suppl. S1), S19–S40, Erratum in Diabetes Care 2023, 46, 1106. https://doi.org/10.2337/dc23-er05; Erratum in Diabetes Care 2023, 46, 1715. https://doi.org/10.2337/dc23-ad08. [Google Scholar] [CrossRef] [PubMed] [PubMed Central]
- Foretz, M.; Guigas, B.; Viollet, B. Metformin: Update on mechanisms of action and repurposing potential. Nat. Rev. Endocrinol. 2023, 19, 460–476. [Google Scholar] [CrossRef]
- Rena, G.; Hardie, D.G.; Pearson, E.R. The mechanisms of action of metformin. Diabetologia 2017, 60, 1577–1585. [Google Scholar] [CrossRef]
- Foretz, M.; Guigas, B.; Viollet, B. Understanding the glucoregulatory mechanisms of metformin in type 2 diabetes mellitus. Nat. Rev. Endocrinol. 2019, 15, 569–589. [Google Scholar] [CrossRef]
- Ghaben, A.L.; Scherer, P.E. Adipogenesis and metabolic health. Nat. Rev. Mol. Cell Biol. 2019, 20, 242–258. [Google Scholar] [CrossRef]
- Solini, A.; Tricò, D. Clinical efficacy and cost-effectiveness of metformin in different patient populations: A narrative review of real-world evidence. Diabetes Obes. Metab. 2024, 26, 20–30. [Google Scholar] [CrossRef] [PubMed]
- Hajjar, J.; Habra, M.A.; Naing, A. Metformin: An old drug with new potential. Expert. Opin. Investig. Drugs 2013, 22, 1511–1517. [Google Scholar] [CrossRef] [PubMed]
- Graham, G.G.; Punt, J.; Arora, M.; Day, R.O.; Doogue, M.P.; Duong, J.K.; Furlong, T.J.; Greenfield, J.R.; Greenup, L.C.; Kirkpatrick, C.M.; et al. Clinical pharmacokinetics of metformin. Clin. Pharmacokinet. 2011, 50, 81–98. [Google Scholar] [CrossRef]
- Yendapally, R.; Sikazwe, D.; Kim, S.S.; Ramsinghani, S.; Fraser-Spears, R.; Witte, A.P.; La-Viola, B. A review of phenformin, metformin, and imeglimin. Drug Dev. Res. 2020, 81, 390–401. [Google Scholar] [CrossRef]
- Dujic, T.; Zhou, K.; Donnelly, L.A.; Tavendale, R.; Palmer, C.N.; Pearson, E.R. Association of Organic Cation Transporter 1 with Intolerance to Metformin in Type 2 Diabetes: A GoDARTS Study. Diabetes 2015, 64, 1786–1793. [Google Scholar] [CrossRef]
- DeFronzo, R.; Fleming, G.A.; Chen, K.; Bicsak, T.A. Metformin-associated lactic acidosis: Current perspectives on causes and risk. Metabolism 2016, 65, 20–29. [Google Scholar] [CrossRef]
- Hsu, W.H.; Hsiao, P.J.; Lin, P.C.; Chen, S.C.; Lee, M.Y.; Shin, S.J. Effect of metformin on kidney function in patients with type 2 diabetes mellitus and moderate chronic kidney disease. Oncotarget 2018, 9, 5416–5423. [Google Scholar] [CrossRef] [PubMed]
- Dutta, S.; Shah, R.B.; Singhal, S.; Dutta, S.B.; Bansal, S.; Sinha, S.; Haque, M. Metformin: A Review of Potential Mechanism and Therapeutic Utility Beyond Diabetes. Drug Des. Devel Ther. 2023, 17, 1907–1932. [Google Scholar] [CrossRef] [PubMed]
- Gormsen, L.C.; Sundelin, E.I.; Jensen, J.B.; Vendelbo, M.H.; Jakobsen, S.; Munk, O.L.; Christensen, M.M.H.; Brøsen, K.; Frøkiær, J.; Jessen, N. In Vivo Imaging of Human 11C-Metformin in Peripheral Organs: Dosimetry, Biodistribution, and Kinetic Analyses. J. Nucl. Med. 2016, 57, 1920–1926. [Google Scholar] [CrossRef] [PubMed]
- Owen, M.R.; Doran, E.; Halestrap, A.P. Evidence that metformin exerts its anti-diabetic effects through inhibition of complex 1 of the mitochondrial respiratory chain. Biochem. J. 2000, 348 Pt 3, 607. [Google Scholar] [CrossRef]
- El-Mir, M.Y.; Nogueira, V.; Fontaine, E.; Avéret, N.; Rigoulet, M.; Leverve, X. Dimethylbiguanide inhibits cell respiration via an indirect effect targeted on the respiratory chain complex I. J. Biol. Chem. 2000, 275, 223–228. [Google Scholar] [CrossRef]
- Zhou, G.; Myers, R.; Li, Y.; Chen, Y.; Shen, X.; Fenyk-Melody, J.; Wu, M.; Ventre, J.; Doebber, T.; Fujii, N.; et al. Role of AMP-activated protein kinase in mechanism of metformin action. J. Clin. Investig. 2001, 108, 1167–1174. [Google Scholar] [CrossRef]
- Foretz, M.; Hébrard, S.; Leclerc, J.; Zarrinpashneh, E.; Soty, M.; Mithieux, G.; Sakamoto, K.; Andreelli, F.; Viollet, B. Metformin inhibits hepatic gluconeogenesis in mice independently of the LKB1/AMPK pathway via decreased hepatic energy state. J. Clin. Investig. 2010, 120, 2355–2369. [Google Scholar] [CrossRef]
- Miller, R.A.; Chu, Q.; Xie, J.; Foretz, M.; Viollet, B.; Birnbaum, M.J. Biguanides suppress hepatic glucagon signaling by decreasing the production of cyclic AMP. Nature 2013, 494, 256–260. [Google Scholar] [CrossRef]
- Miller, R.A.; Chu, Q.; Xie, J.; Foretz, M.; Viollet, B.; Birnbaum, M.J. Metformin suppresses gluconeogenesis by inhibiting mitochondrial glycerophosphate dehydrogenase. Nature 2014, 510, 542–546. [Google Scholar] [CrossRef]
- Duca, F.A.; Côté, C.D.; Rasmussen, B.A.; Zadeh-Tahmasebi, M.; Rutter, G.A.; Filippi, B.M.; Lam, T.K. Metformin activates a duodenal Ampk–dependent pathway to lower hepatic glucose production in rats. Nat. Med. 2015, 21, 506–511. [Google Scholar] [CrossRef] [PubMed]
- Gunton, J.E.; Delhanty, P.J.D.; Takahashi, S.I.; Baxter, R.C. Metformin Rapidly Increases Insulin Receptor Activation in Human Liver and Signals Preferentially through Insulin-Receptor Substrate-2. J. Clin. Endocrinol. Metab. 2003, 88, 1323–1332. [Google Scholar] [CrossRef] [PubMed]
- Sylow, L.; Tokarz, V.L.; Richter, E.A.; Klip, A. The many actions of insulin in skeletal muscle, the paramount tissue determining glycemia. Cell Metab. 2021, 33, 758–780. [Google Scholar] [CrossRef]
- Szymczak-Pajor, I.; Wenclewska, S.; Śliwińska, A. Metabolic Action of Metformin. Pharmaceuticals 2022, 15, 810. [Google Scholar] [CrossRef]
- Pavlovic, K.; Krako Jakovljevic, N.; Isakovic, A.M.; Ivanovic, T.; Markovic, I.; Lalic, N.M. Therapeutic vs. Suprapharmacological Metformin Concentrations: Different Effects on Energy Metabolism and Mitochondrial Function in Skeletal Muscle Cells in vitro. Front. Pharmacol. 2022, 13, 930308. [Google Scholar] [CrossRef]
- Suwa, M.; Egashira, T.; Nakano, H.; Sasaki, H.; Kumagai, S. Metformin increases the PGC-1α protein and oxidative enzyme activities possibly via AMPK phosphorylation in skeletal muscle in vivo. J. Appl. Physiol. 2006, 101, 1685–1692. [Google Scholar] [CrossRef]
- Kristensen, J.M.; Treebak, J.T.; Schjerling, P.; Goodyear, L.; Wojtaszewski, J.F.P. Two weeks of metformin treatment induces AMPK-dependent enhancement of insulin-stimulated glucose uptake in mouse soleus muscle. Am. J. Physiol. Endocrinol. Metab. 2014, 306, E1099–E1109. [Google Scholar] [CrossRef]
- Musi, N.; Hirshman, M.F.; Nygren, J.; Svanfeldt, M.; Bavenholm, P.; Rooyackers, O.; Zhou, G.; Williamson, J.M.; Ljunqvist, O.; Efendic, S.; et al. Metformin Increases AMP-Activated Protein Kinase Activity in Skeletal Muscle of Subjects With Type 2 Diabetes. Diabetes 2002, 51, 2074–2081. [Google Scholar] [CrossRef]
- Polianskyte-Prause, Z.; Tolvanen, T.A.; Lindfors, S.; Dumont, V.; Van, M.; Wang, H.; Dash, S.N.; Berg, M.; Naams, J.-B.; Hauntala, L.C.; et al. Metformin increases glucose uptake and acts renoprotectively by reducing SHIP2 activity. FASEB J. 2019, 33, 2858–2869. [Google Scholar] [CrossRef]
- Lehtonen, S. SHIPping out diabetes—Metformin, an old friend among new SHIP2 inhibitors. Acta Physiol. 2020, 228, e13349. [Google Scholar] [CrossRef] [PubMed]
- Zabielski, P.; Chacinska, M.; Charkiewicz, K.; Baranowski, M.; Gorski, J.; Blachnio-Zabielska, A.U. Effect of metformin on bioactive lipid metabolism in insulin-resistant muscle. J. Endocrinol. 2017, 233, 329–340. [Google Scholar] [CrossRef]
- Breining, P.; Jensen, J.B.; Sundelin, E.I.; Gormsen, L.C.; Jakobsen, S.; Busk, M.; Rolighed, L.; Bross, P.; Fernandez-Guerra, P.; Markussen, L.K.; et al. Metformin targets brown adipose tissue in vivo and reduces oxygen consumption in vitro. Diabetes Obes. Metab. 2018, 20, 2264–2273. [Google Scholar] [CrossRef]
- Grisouard, J.; Timper, K.; Radimerski, T.M.; Frey, D.M.; Peterli, R.; Kola, B.; Korbonits, M.; Herrmann, P.; Krähenbühl, S.; Zulewski, H.; et al. Mechanisms of metformin action on glucose transport and metabolism in human adipocytes. Biochem. Pharmacol. 2010, 80, 1736–1745. [Google Scholar] [CrossRef] [PubMed]
- Lee, J.O.; Lee, S.K.; Kim, J.H.; Kim, N.; You, G.Y.; Moon, J.W.; Kim, S.J.; Park, S.H.; Kim, H.S. Metformin regulates glucose transporter 4 (GLUT4) translocation through AMP-activated protein kinase (AMPK)-mediated Cbl/CAP signaling in 3T3-L1 preadipocyte cells. J. Biol. Chem. 2012, 287, 44121–44129. [Google Scholar] [CrossRef]
- Okamura, H.; Yoshida, K.; Sasaki, E.; Qiu, L.; Amorim, B.R.; Morimoto, H.; Haneji, T. Expression of PTEN and Akt phosphorylation in lipopolysaccharide-treated NIH3T3 cells. Cell Biol. Int. 2007, 31, 119–125. [Google Scholar] [CrossRef] [PubMed]
- Karise, I.; Bargut, T.C.; del Sol, M.; Aguila, M.B.; Mandarim-de-Lacerda, C.A. Metformin enhances mitochondrial biogenesis and thermogenesis in brown adipocytes of mice. Biomed. Pharmacother. 2019, 111, 1156–1165. [Google Scholar] [CrossRef]
- Geerling, J.J.; Boon, M.R.; van der Zon, G.C.; van den Berg, S.A.; van den Hoek, A.M.; Lombès, M.; Princen, H.M.; Havekes, L.M.; Rensen, P.C.; Guigas, B. Metformin lowers plasma triglycerides by promoting VLDL-triglyceride clearance by brown adipose tissue in mice. Diabetes 2014, 63, 880–891. [Google Scholar] [CrossRef]
- Tokubuchi, I.; Tajiri, Y.; Iwata, S.; Hara, K.; Wada, N.; Hashinaga, T.; Nakayama, H.; Mifune, H.; Yamada, K. Beneficial effects of metformin on energy metabolism and visceral fat volume through a possible mechanism of fatty acid oxidation in human subjects and rats. PLoS ONE 2017, 12, e0171293. [Google Scholar] [CrossRef]
- Ikeda, T.; Iwata, K.; Murakami, H. Inhibitory effect of metformin on intestinal glucose absorption in the perfused rat intestine. Biochem. Pharmacol. 2000, 59, 887–890. [Google Scholar] [CrossRef]
- Wu, T.; Xie, C.; Wu, H.; Jones, K.L.; Horowitz, M.; Rayner, C.K. Metformin reduces the rate of small intestinal glucose absorption in type 2 diabetes. Diabetes Obes. Metab. 2017, 19, 290–293. [Google Scholar] [CrossRef]
- Zubiaga, L.; Briand, O.; Auger, F.; Touche, V.; Hubert, T.; Thevenet, J.; Marciniak, C.; Quenon, A.; Bonner, C.; Peschard, S.; et al. Oral metformin transiently lowers post-prandial glucose response by reducing the apical expression of sodium-glucose co-transporter 1 in enterocytes. iScience 2023, 26, 106057. [Google Scholar] [CrossRef]
- Borg, M.J.; Bound, M.; Grivell, J.; Sun, Z.; Jones, K.L.; Horowitz, M.; Rayner, C.K.; Wu, T. Comparative effects of proximal and distal small intestinal administration of metformin on plasma glucose and glucagon-like peptide-1, and gastric emptying after oral glucose, in type 2 diabetes. Diabetes Obes. Metab. 2019, 21, 640–647. [Google Scholar] [CrossRef] [PubMed]
- Koffert, J.P.; Mikkola, K.; Virtanen, K.A.; Andersson, A.M.D.; Faxius, L.; Hällsten, K.; Heglind, M.; Guiducci, L.; Pham, T.; Silvola, J.M.; et al. Metformin treatment significantly enhances intestinal glucose uptake in patients with type 2 diabetes: Results from a randomized clinical trial. Diabetes Res. Clin. Pract. 2017, 131, 208–216. [Google Scholar] [CrossRef]
- Tobar, N.; Rocha, G.Z.; Santos, A.; Guadagnini, D.; Assalin, H.B.; Camargo, J.A.; Gonçalves, A.E.; Pallis, F.R.; Oliveira, A.G.; Rocco, S.A.; et al. Metformin acts in the gut and induces gut-liver crosstalk. Proc. Natl. Acad. Sci. USA 2023, 120, e2211933120. [Google Scholar] [CrossRef] [PubMed]
- Schommers, P.; Thurau, A.; Bultmann-Mellin, I.; Guschlbauer, M.; Klatt, A.R.; Rozman, J.; Klingenspor, M.; de Angelis, M.H.; Alber, J.; Gründemann, D.; et al. Metformin causes a futile intestinal–hepatic cycle which increases energy expenditure and slows down development of a type 2 diabetes-like state. Mol. Metab. 2017, 6, 737–747. [Google Scholar] [CrossRef]
- Mota de Sá, P.; Richard, A.J.; Hang, H.; Stephens, J.M. Transcriptional Regulation of Adipogenesis. Compr. Physiol. 2017, 7, 635–674. [Google Scholar] [CrossRef]
- Cristancho, A.G.; Lazar, M.A. Forming functional fat: A growing understanding of adipocyte differentiation. Nat. Rev. Mol. Cell Biol. 2011, 12, 722–734. [Google Scholar] [CrossRef]
- Sarjeant, K.; Stephens, J.M. Adipogenesis. Cold Spring Harb. Perspect. Biol. 2012, 4, a008417. [Google Scholar] [CrossRef] [PubMed]
- Amri, E.Z. Beige or brite adipocytes of the adipose organ: Link with white and brown adipocytes. Ann. Endocrinol. 2024, 85, 253–254. [Google Scholar] [CrossRef]
- Rosen, E.D.; Spiegelman, B.M. Molecular regulation of adipogenesis. Annu. Rev. Cell Dev. Biol. 2000, 16, 145–171. [Google Scholar] [CrossRef] [PubMed]
- Wu, Y.; Sun, Y.; Song, Y.; Wang, J.; Han, Y.; Yang, N.; Lin, H.; Yin, Y.; Han, X. PPA1 promotes adipogenesis by regulating the stability of C/EBPs. Cell Death Differ. 2024, 31, 1044–1056. [Google Scholar] [CrossRef]
- Tontonoz, P.; Hu, E.; Spiegelman, B.M. Stimulation of adipogenesis in fibroblasts by PPAR gamma 2, a lipid-activated transcription factor. Cell 1994, 79, 1147–1156. [Google Scholar] [CrossRef]
- Mueller, E.; Drori, S.; Aiyer, A.; Yie, J.; Sarraf, P.; Chen, H.; Hauser, S.; Rosen, E.D.; Ge, K.; Roeder, R.G.; et al. Genetic analysis of adipogenesis through peroxisome proliferator-activated receptor gamma isoforms. J. Biol. Chem. 2002, 277, 41925–41930. [Google Scholar] [CrossRef] [PubMed]
- Lefterova, M.I.; Haakonsson, A.K.; Lazar, M.A.; Mandrup, S. PPARγ and the global map of adipogenesis and beyond. Trends Endocrinol. Metab. 2014, 25, 293–302. [Google Scholar] [CrossRef]
- An, S.M.; Cho, S.H.; Yoon, J.C. Adipose Tissue and Metabolic Health. Diabetes Metab. J. 2023, 47, 595–611. [Google Scholar] [CrossRef]
- Hafidi, M.E.; Buelna-Chontal, M.; Sánchez-Muñoz, F.; Carbó, R. Adipogenesis: A Necessary but Harmful Strategy. Int. J. Mol. Sci. 2019, 20, 3657. [Google Scholar] [CrossRef] [PubMed]
- Nunn, E.R.; Shinde, A.B.; Zaganjor, E. Weighing in on Adipogenesis. Front. Physiol. 2022, 13, 821278. [Google Scholar] [CrossRef]
- Firmal Pant, R.P.; Shah, V.K.; Alam, A.; Chattopadhyay, S. Epigenetic Regulation of Adipogenesis in Development of Metabolic Syndrome. Front. Cell Dev. Biol. 2020, 8, 619888. [Google Scholar] [CrossRef]
- White, U. Adipose tissue expansion in obesity, health, and disease. Front. Cell Dev. Biol. 2023, 11, 1188844. [Google Scholar] [CrossRef]
- Bahmad, H.F.; Daouk, R.; Azar, J.; Sapudom, J.; Teo, J.C.M.; Abou-Kheir, W.; Al-Sayegh, M. Modeling Adipogenesis: Current and Future Perspective. Cells 2020, 9, 2326. [Google Scholar] [CrossRef]
- Alexandre, K.B.; Smit, A.M.; Gray, I.P.; Crowther, N.J. Metformin inhibits intracellular lipid accumulation in the murine pre-adipocyte cell line, 3T3-L1. Diabetes Obes. Metab. 2008, 10, 688–690. [Google Scholar] [CrossRef] [PubMed]
- Lenhard, J.M.; Kliewer, S.A.; Paulik, M.A.; Plunket, K.D.; Lehmann, J.M.; Weiel, J.E. Effects of troglitazone and metformin on glucose and lipid metabolism: Alterations of two distinct molecular pathways. Biochem. Pharmacol. 1997, 54, 801–808. [Google Scholar] [CrossRef] [PubMed]
- Chen, S.C.; Brooks, R.; Houskeeper, J.; Bremner, S.K.; Dunlop, J.; Viollet, B.; Logan, P.J.; Salt, I.P.; Ahmed, S.F.; Yarwood, S.J. Metformin suppresses adipogenesis through both AMP-activated protein kinase (AMPK)-dependent and AMPK-independent mechanisms. Mol. Cell Endocrinol. 2017, 440, 57–68. [Google Scholar] [CrossRef] [PubMed]
- Chen, D.; Wang, Y.; Wu, K.; Wang, X. Dual Effects of Metformin on Adipogenic Differentiation of 3T3-L1 Preadipocyte in AMPK-Dependent and Independent Manners. Int. J. Mol. Sci. 2018, 19, 1547. [Google Scholar] [CrossRef]
- Yang, L.; Jia, X.; Fang, D.; Cheng, Y.; Zhai, Z.; Deng, W.; Du, B.; Lu, T.; Wang, L.; Yang, C.; et al. Metformin Inhibits Lipid Droplets Fusion and Growth via Reduction in Cidec and Its Regulatory Factors in Rat Adipose-Derived Stem Cells. Int. J. Mol. Sci. 2022, 23, 5986. [Google Scholar] [CrossRef]
- Zhao, Z.; Wang, C.; Jia, J.; Wang, Z.; Li, L.; Deng, X.; Cai, Z.; Yang, L.; Wang, D.; Ma, S.; et al. Regulatory network of metformin on adipogenesis determined by combining high-throughput sequencing and GEO database. Adipocyte 2022, 11, 56–68. [Google Scholar] [CrossRef]
- Bajetto, A.; Pattarozzi, A.; Sirito, R.; Barbieri, F.; Florio, T. Metformin potentiates immunosuppressant activity and adipogenic differentiation of human umbilical cord-mesenchymal stem cells. Int. Immunopharmacol. 2023, 124 Pt B, 111078. [Google Scholar] [CrossRef]
- Cruciani, S.; Garroni, G.; Pala, R.; Cossu, M.L.; Ginesu, G.C.; Ventura, C.; Maioli, M. Metformin and Vitamin D Modulate Inflammation and Autophagy during Adipose-Derived Stem Cell Differentiation. Int. J. Mol. Sci. 2021, 22, 6686. [Google Scholar] [CrossRef]
- Liao, X.; Liu, J.; Chen, Y.; Liu, Y.; Chen, W.; Zeng, B.; Liu, Y.; Luo, Y.; Huang, C.; Guo, G.; et al. Metformin combats obesity by targeting FTO in an m6A-YTHDF2-dependent manner. J. Drug Target. 2022, 30, 983–991. [Google Scholar] [CrossRef]
- Jaganjac, M.; Almuraikhy, S.; Al-Khelaifi, F.; Al-Jaber, M.; Bashah, M.; Mazloum, N.A.; Zarkovic, K.; Zarkovic, N.; Waeg, G.; Kafienah, W.; et al. Combined metformin and insulin treatment reverses metabolically impaired omental adipogenesis and accumulation of 4-hydroxynonenal in obese diabetic patients. Redox Biol. 2017, 12, 483–490. [Google Scholar] [CrossRef] [PubMed]
- Szkudelski, T.; Konieczna, K.; Szkudelska, K. Regulatory Effects of Metformin, an Antidiabetic Biguanide Drug, on the Metabolism of Primary Rat Adipocytes. Molecules 2022, 27, 5250. [Google Scholar] [CrossRef] [PubMed]
- Pelletier, L.; Mantecon, M.; Gorwood, J.; Auclair, M.; Foresti, R.; Motterlini, R.; Laforge, M.; Atlan, M.; Fève, B.; Capeau, J.; et al. Metformin alleviates stress-induced cellular se-nescence of aging human adipose stromal cells and the ensuing adipocyte dysfunction. eLife 2021, 10, e62635. [Google Scholar] [CrossRef] [PubMed]
- Cruciani, S.; Garroni, G.; Pala, R.; Coradduzza, D.; Cossu, M.L.; Ginesu, G.C.; Capobianco, G.; Dessole, S.; Ventura, C.; Maioli, M. Metformin and vitamin D modulate adipose-derived stem cell differentiation towards the beige phenotype. Adipocyte 2022, 11, 356–365. [Google Scholar] [CrossRef]
- Guo, Y.; Chen, Y.; Zhang, Y.; Zhang, Y.; Chen, L.; Mo, D. Up-regulated miR-145 expression inhibits porcine preadipocytes differentiation by targeting IRS1. Int. J. Biol. Sci. 2012, 8, 1408–1417. [Google Scholar] [CrossRef]
- Wang, L.; Zhang, S.; Cheng, G.; Mei, C.; Li, S.; Zhang, W.; Junjvlieke, Z.; Zan, L. MiR-145 reduces the activity of PI3K/Akt and MAPK signaling pathways and inhibits adipogenesis in bovine preadipocytes. Genomics 2020, 112, 2688–2694. [Google Scholar] [CrossRef]
- Shi, C.; Zhang, M.; Tong, M.; Yang, L.; Pang, L.; Chen, L.; Xu, G.; Chi, X.; Hong, Q.; Ni, Y.; et al. miR-148a is Associated with Obesity and Modulates Adipocyte Differentiation of Mesenchymal Stem Cells through Wnt Signaling. Sci. Rep. 2015, 5, 9930. [Google Scholar] [CrossRef]
- He, H.; Cai, M.; Zhu, J.; Xiao, W.; Liu, B.; Shi, Y.; Yang, X.; Liang, X.; Zheng, T.; Hu, S.; et al. miR-148a-3p promotes rabbit preadipocyte differentiation by targeting PTEN. In Vitro Cell Dev. Biol. Anim. 2018, 54, 241–249. [Google Scholar] [CrossRef]
- Jin, X.; Hao, Z.; Zhao, M.; Shen, J.; Ke, N.; Song, Y.; Qiao, L.; Lu, Y.; Hu, L.; Wu, X.; et al. MicroRNA-148a Regulates the Proliferation and Differentiation of Ovine Preadipocytes by Targeting PTEN. Animals 2021, 11, 820. [Google Scholar] [CrossRef]
- Cruciani, S.; Garroni, G.; Balzano, F.; Pala, R.; Bellu, E.; Cossu, M.L.; Ginesu, G.C.; Ventura, C.; Maioli, M. Tuning Adipogenic Differentiation in ADSCs by Metformin and Vitamin D: Involvement of miRNAs. Int. J. Mol. Sci. 2020, 21, 6181. [Google Scholar] [CrossRef]
- Marcotorchino, J.; Gouranton, E.; Romier, B.; Tourniaire, F.; Astier, J.; Malezet, C.; Amiot, M.J.; Landrier, J.F. Vitamin D reduces the inflammatory response and restores glucose uptake in adipocytes. Mol. Nutr. Food Res. 2012, 56, 1771–1782. [Google Scholar] [CrossRef] [PubMed]
- Karkeni, E.; Marcotorchino, J.; Tourniaire, F.; Astier, J.; Peiretti, F.; Darmon, P.; Landrier, J.F. Vitamin D limits chemokine expression in adipocytes and macrophage migration in vitro and in male mice. Endocrinology 2015, 156, 1782–1793. [Google Scholar] [CrossRef] [PubMed]
Disclaimer/Publisher’s Note: The statements, opinions and data contained in all publications are solely those of the individual author(s) and contributor(s) and not of MDPI and/or the editor(s). MDPI and/or the editor(s) disclaim responsibility for any injury to people or property resulting from any ideas, methods, instructions or products referred to in the content. |
© 2025 by the authors. Licensee MDPI, Basel, Switzerland. This article is an open access article distributed under the terms and conditions of the Creative Commons Attribution (CC BY) license (https://creativecommons.org/licenses/by/4.0/).