Abstract
Flax (Linum usitatissimum L.) seed is rich in α-linolenic acid, lignans, and fiber, which have potential health benefits. However, the potential toxicity of its cyanogenic glycosides limits its widespread use. The cytochrome P450 gene family is one of the largest gene families in plants and is involved in synthesizing phytohormones, secondary metabolites, and various defense compounds. Two P450 genes have been found to be important enzymes for the biosynthesis of cyanogenic glycosides in common sorghum (Sorghum bicolor (L.) Moench). However, the P450 gene family and its involvement in cyanogenic glycoside synthesis have been less studied in flax. In previous studies, we assembled a high-quality flax genome. In this study, a total of 412 P450 genes were identified in the flax genome, with molecular weights in the range of 7.42 kDa to 154.5 kDa and encoding amino acid lengths between 67 and 1378. These genes belonged to 48 families under eight clans and were distributed across 15 chromosomes. The number of introns varied from 0 to 14. Thirty-nine cis-acting elements were identified within 1500 bp upstream of the promoter, mainly related to the light response. There were 147 segmental duplications and 53 tandem duplication events among these P450 genes. Eleven genes potentially related to cyanogenic glycoside synthesis were identified by transcriptome analysis, and the RT-qPCR results verified the reliability of the transcriptome analysis. This study lays the foundation for the classification and functional study of the flax P450 gene family. The results will be useful for breeding new low-cyanogenic-glycoside flax varieties by genetic engineering.
1. Introduction
Flax is an ancient plant that was cultivated in southwest Asia during the Neolithic period and later domesticated in Near Eastern agriculture [1]. Currently, it is widely cultivated in Asian, North American, South American, and European countries [2]. It can be divided into three main categories: fiber flax, oil flax, and dual-use flax. Flaxseed contains high levels of unsaturated fatty acids and nearly 30 anticancer compounds, which have been shown to lower cholesterol and blood pressure and reduce the risk of blood clots [3]. However, flax contains a potentially toxic substance called cyanogenic glycosides [4,5].
Cyanogenic glycosides are widely found in plants and play a role in their primary metabolisms. When plants are injured, cyanogenic glycosides release free toxic HCN from the wounds and inhibit the activity of heavy metal-containing enzymes and respiration [6]. This substance is also toxic to humans, which limits the widespread cultivation and utilization of flax [7].
Cytochrome P450 monooxygenase is one of the largest gene super-families in plants. It is named for the spectral absorbance peak of 450 nm that is produced when it binds carbon monoxide [8]. The modern cytochrome P450 gene originated from an ancestral gene some 3.5 billion years ago [9] and was first discovered in 1958 in rat and pig microsomes [9]. The plant P450 gene was first identified in cotton (Gossypium hirsutum L.) [10]. The P450 gene belongs to the group of oxidoreductases, which participates in NADPH− and O2−-dependent hydroxylation processes with the cofactor heme thiol salts [11]. Its products are involved in the oxidative metabolisms of various endogenous and exogenous compounds in organisms through epoxidation, sulfation, dehalogenation, and dealkylation [12]. It plays a role in the plant growth, development, and biosynthesis of secondary metabolites [13,14].
A previous study found that the products of two P450 genes, CYP79A1 and CYP71E1, are critical enzymes in synthesizing cyanogenic glycosides in common sorghum [15]. CYP17A1 catalyzes the conversion of Tyr to Z-p-hydroxyphenylacetaldehyde oxime, followed by the conversion of Z-p-hydroxyphenylacetaldehyde oxime to p-hydroxymandelonitrile catalyzed by CYP71E1. Finally, a soluble glycosyltransferase UDP-Glc p-hydroxymandelonitrile glycosyltransferase UGT85B1 converts p-hydroxymandelonitrile to cyanogenic glycosides dhurrin [16].
The synthesis of the two raw cyanogenic glycosides in flax, linamarin, and lotaustralin begins with Val and Ile, respectively. The first step is N-hydroxylation to 2-methyl-propanal oxime or 2-methylbutanal-oxime, respectively. Subsequent dehydration forms 2-methylpropionitrile or 2-methylbutylnitrile, respectively. Then, oxygenation forms acetone/butanon cyanohydrin, which is then glycosylated by UDPG-glucosyltransferase to form linamarin and lotaustralin [17].
The above studies did not explore which genes control the onset of transformation of these compounds. Based on the fact that the process of cyanogenic glycoside synthesis is similar in sorghum and flax, and two important P450 genes in sorghum are involved in cyanogenic glycoside synthesis. The question remains: are there P450 genes in flax that are also involved in cyanogenic glycoside synthesis?
In this study, based on our newly assembled high-quality flax genome, the flax P450 genes were identified at the genome-wide level, and a series analysis including physicochemical properties, phylogenetic tree, chromosomal localization, gene structure, subcellular localization, and protein–protein interactions was performed. In addition, the expression levels of the P450 gene were determined in two inbred lines of flax with different cyanogenic glycoside contents at different times. Some P450 genes that may be involved in the synthesis of cyanogenic glycosides in flax were screened out. This study provides a basis for the research and application of the P450 gene in flax, as well as the cultivation of low cyanogenic glycoside flax varieties.
2. Result
2.1. LuP450 Genes Identification and Chromosomal Localization
After structural domain confirmation by SMART and CDD database, a total of 412 LuP450 genes were identified in the flax genome (Table S1).
Chromosomal localization of the LuP450 genes showed that all LuP450 genes were unevenly distributed on 15 chromosomes. The highest number (68) was found on chromosome 11. The lowest number (three) was found on chromosome 14. Moreover, P450 is unevenly arranged in clusters on the chromosomes (Figure 1).
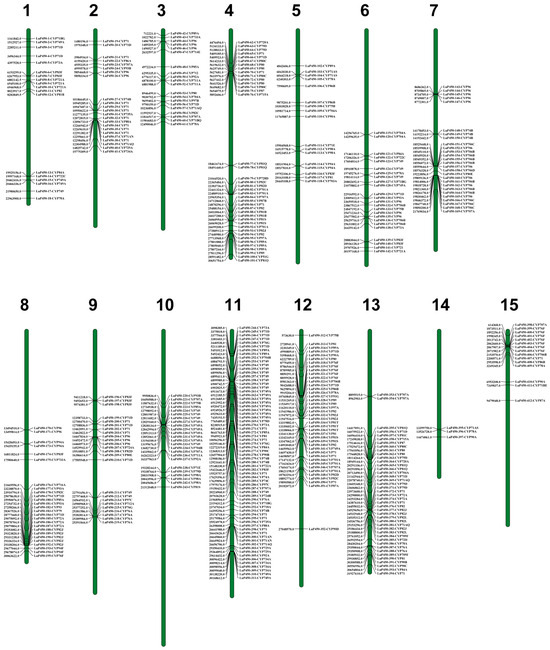
Figure 1.
Distribution of LuP450 on flax chromosomes.
These genes were renamed as LuP450-1-CYP71BG to LuP450-412-CYP87A, according to their locations on the chromosomes and subfamilies, respectively. The length of the LuP450 protein sequences showed a wide variation, ranging from 67 to 1378 amino acids. Their molecular weights ranged from 7.42 kDa to 154.5 kDa, and Pi ranged from 4.14 to 11.26.
A-type and non-A-type P450 genes were unevenly distributed across different chromosomes. Among them, 33 A-type genes and eight non-A-type genes were found on chromosome 12, and the ratio of the number of A-type genes/non-A-type genes was 4.12. There were 32 A-type genes and eight non-A-type genes found on chromosome 4, and the ratio was 4, while the number of A-type genes on chromosomes 3, 10, and 11 were fewer than that of non-A-type genes, and the ratio was 0.82, 0.60, and 0.35, respectively.
2.2. Phylogenetic and Classification Relationship of LuP450 Genes
To investigate the LuP450 gene’s phylogenetic relationships, we performed a phylogenetic analysis of 412 LuP450 genes using the maximum likelihood method. Of these genes, 248 (60.2%) belong to the A-type clade, and 164 (39.8%) belong to the non-A-type clade (Figure 2).
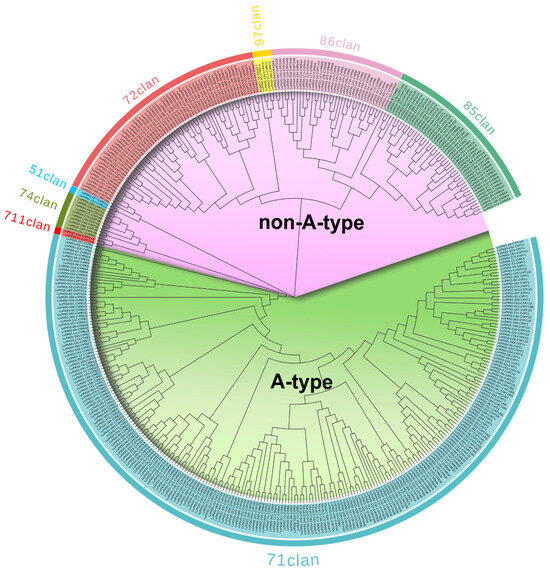
Figure 2.
Phylogenetic tree of LuP450 genes.
The A-type clade contains only one clan (71 clan), which was further divided into 19 families. The CYP71 family includes the largest number with 67 genes, and the CYP703 family has only one gene.
The non-A-type clade includes seven clans and was further divided into 29 families. Among them, CYP749 included the most genes at 40, while four families (CYP714, CYP716, CYP718, and CYP728) included only one gene.
To understand the location of the LuP450 gene action, subcellular localization prediction was performed using WoLF PSORT software (https://www.genscript.com/wolf-psort.html, accessed 29 March 2024). The results show that 63.11% (260/412) of the LuP450 protein was localized in chloroplasts, 18.45% (76/412) was localized in the cytoplasm, and 5.34% (22/412), and 5.10% (21/412) were localized in the plasma membrane and nucleus, respectively.
2.3. Conserved Motif and Gene Structure Analysis of LuP450 Genes
To further compare the LuP450 gene structures, we performed conserved domain and gene structure analyses. A total of 10 conserved motifs were identified through the MEME analysis (Figure S1).
The number of motifs of the protein sequences of the LuP450 genes varied from 1–24 (Table S2).
Among them, motif 2 (K-helix region), motif 1 (C-terminal heme-binding region), motif 3 (PXRX motif), and motif 6 (I-helix oxygen-binding region) appeared in 332,300,300 and 276 genes, respectively. Only 231 genes had all four typical domains. The distribution of motifs varies in different clans. Motif 4 was not identified in genes belonging to the 97 clan, motif 9 was not identified in genes belonging to the 51 clan, and motif 7 was found only in genes under the 71 clan. The results show that there is a certain degree of specificity in motifs among different clans and demonstrate the reliability of the phylogenetic tree construction.
To understand the LuP450 gene structure, we analyzed the introns–exons based on the gff files. The results show that the number of introns in the 412 LuP450 genes varied from 0 to 14 (Figure S1, Table S3). Among them, 104 genes had no introns, and 135 genes had only one intron. In addition, we found that exon–intron specificity may exist in some clans; for example, 72.6% of 71 clan genes have only 1–2 introns, while all 97 clan genes have more than seven introns.
2.4. Cis-Acting Elements Analysis of LuP450 Genes
Cis-acting elements play important roles in regulating gene expression. We analyzed cis-acting elements in the 1500 kb region upstream of the LuP450 gene promoter using the PlantCARE website.
A total of 8542 cis-acting elements were identified on 412 LuP450 genes, which were categorized into 29 classes, with 17 classes having more than 50 elements (Figure S1).
The light response elements were the most abundant (3448 in total) and were identified on 99% (408/412) of LuP450 genes (Figure 3). There were at least two light response elements in each gene, with a maximum of 20 identified in the LuP450-21-CYP71.
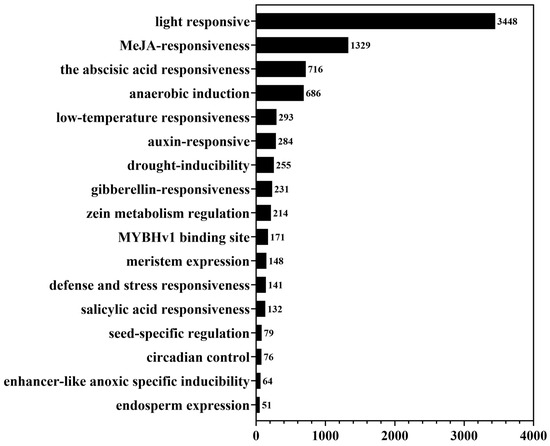
Figure 3.
Cis-acting element distribution of the LuP450 genes.
Hormone-responsive elements were also abundantly present upstream of the LuP450 promoter, such as MeJA responsiveness, abscisic acid responsiveness, auxin responsiveness, and gibberellin responsiveness, with total numbers of 1329, 716, 284, and 231 elements respectively.
There is also a high content of biotic stress-response components, such as anaerobic induction, low-temperature responsiveness, drought-inducibility, and defense and stress responsiveness, with total numbers of 686, 293, 255, and 141, respectively.
In addition, some elements related to growth and development were also identified, such as zein metabolism regulation, meristem expression, seed-specific regulation, circadian control, and endosperm expression, and their numbers were 214, 148, 79, 76, and 51, respectively.
2.5. Intragenomic Covariance Analysis of the LuP450 Gene
To explore the evolution and expansion of the LuP450 gene within the flax genome, we performed fragment-duplication and tandem-duplication event analyses using BLASTP (2.2.26) and MCscanX software.
There were 202 genes that formed 147 segmental duplication events through different combinations, of which 59 genes had multiple duplications (Figure 4, Table S4). These genes were distributed on 15 chromosomes. The maximum number of genes was 24 on chromosome 11, and the minimum number of genes was three on chromosome 14.
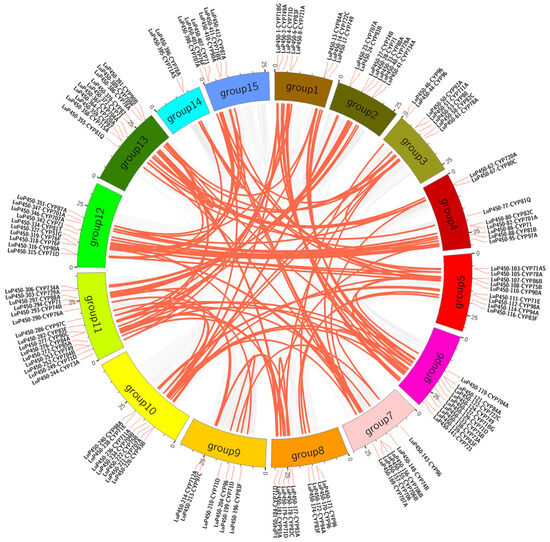
Figure 4.
Intragenomic covariance analysis of the LuP450 genes. The gray lines in the background indicate other gene collinear blocks of flax, and the red lines indicate the syntenic P450 gene pairs.
A total of 53 tandem duplications involving 97 genes were found (Table S5), of which seven tandem duplications were repeated three times (LuP450-28-CYP71+LuP450-30-CYP71, LuP450-224-CYP749+LuP450-226-CYP749, LuP450-334-CYP81T+LuP450-336-CYP81T, LuP450-403-CYP76F+LuP450-405-CYP76F, LuP450-71-CYP80C+LuP450-73-CYP80, LuP450-96-CYP89A+LuP450-98-CYP89A, and LuP450-143-CYP96+LuP450-145-CYP96) and one was repeated four times (LuP450-162-CYP706+LuP450-165-CYP706). The results suggest a complex co-collinearity among the LuP450 genes.
2.6. Analysis of P450 Gene Covariance Among Different Genomes
To investigate the selection pressure between segmental duplication and tandem duplication gene pairs, we performed Ka/Ks analysis on 201 of the gene pairs screened in the previous step. The results reveal that except for four gene pairs for which Ka/Ks was not calculated, all other gene pairs had Ka/Ks ratios of less than 1, indicating that the LuP450 gene was under purification selection pressure (Table S6).
To understand the phylogenetic relationship of P450 genes in flax and other species, we performed a collinearity analysis with the flax genome, using Arabidopsis and sunflower genomes. The results show that a total of 40 pairs of colinear P450 genes were identified in Arabidopsis and flax, and a total of 58 pairs of colinear P450 genes were identified in sunflower and flax (Figure 5).
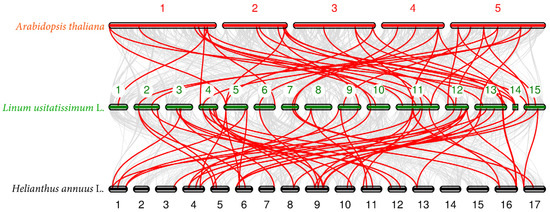
Figure 5.
Synteny analysis of P450 genes among three genomes. The gray lines in the background indicate other gene collinear blocks of flax, and the red lines indicate the syntenic P450 gene pairs.
2.7. Expression Pattern Analysis of LuP450 Genes
To investigate the expression of the LuP450 gene in A15 and A224, transcriptome analysis was carried out for three developmental periods (Figure S2). Differential expression analysis showed that there were 69 (53up/16down), 64 (34up/30down), and 94 (69up/25down) DEGs in A15S/A224S, A15M/A224M, and A15L/A224L, respectively (Figure 6).
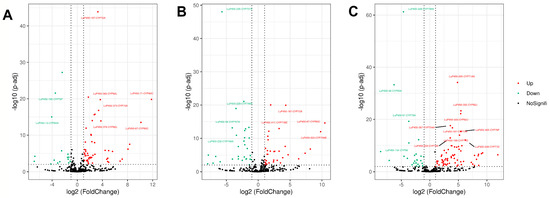
Figure 6.
LuP450 differentially expressed gene volcano plot. (A) A15S vs. A224S. (B) A15M vs. A224M. (C) A15L vs. A224L. Each dot represents a differentially expressed gene, and genes with -log(padj) > 10 while abs(log2FoldChange) > 3 were labeled.
Eleven genes (LuP450-383-CYP82L, LuP450-355-CYP81Q, LuP450-395-CYP71AS, LuP450-187-CYP72A, LuP450-357-CYP81C, LuP450-189-CYP82J, LuP450-389-CYP709F, LuP450-249-CYP71D, LuP450-411-CYP71BE, LuP450-71-CYP80C, and LuP450-67-CYP80C) were present in all three comparison groups simultaneously (Figure 7).
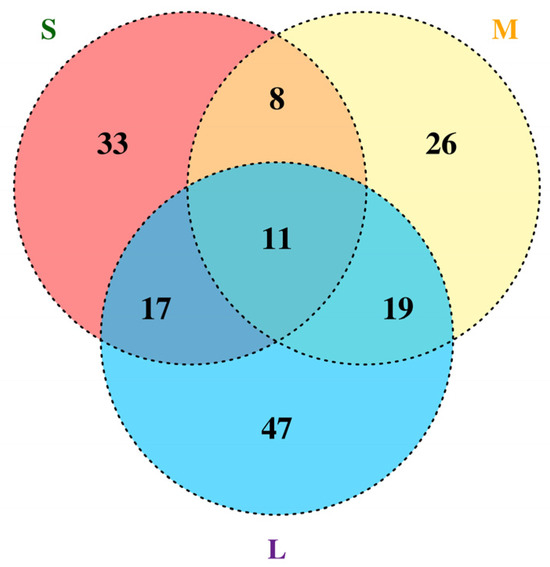
Figure 7.
Venn diagram of LuP450 differentially expressed genes at three developmental periods.
Nine of the genes belonged to the CYP71, CYP80, CYP81, and CYP824 subfamilies under the 71 clan, and two genes belonged to the CYP72 and CYP709 subfamilies under the 72 clan. All nine genes were upregulated for expression in A224, and the log2FoldChange for the LuP450-411-CYP71BE gene was greater than nine in all three comparison groups.
2.8. RT-qPCR Validation
The RT-qPCR results showed a consistent trend in the relative expressions of all genes between FPKM, proving the reliability of the transcriptome analysis (Figure 8).
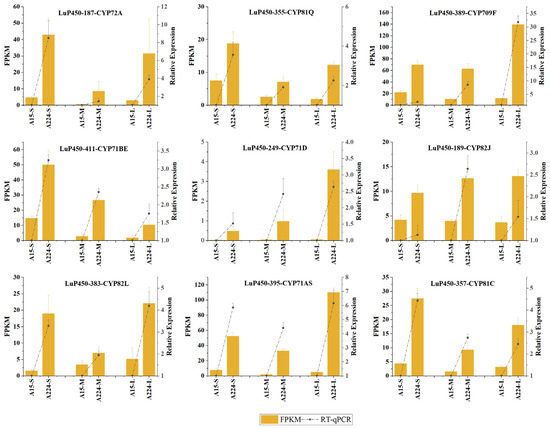
Figure 8.
The relative expression of nine genes was analyzed by RT-qPCR, and the dotted line plots are drawn jointly with the FPKM value.
2.9. Protein–Protein Interaction Analysis
To study the interactions among the LuP450 proteins and screen hub genes, we performed a protein–protein interaction (PPI) analysis and constructed a PPI network. This network contained 68 nodes and 186 edges (Figure 9A). We further calculated the hub genes using the MCODE plugin and obtained a new network containing 10 nodes and 37 edges (Figure 9B) with six LuP450 genes (LuP450-41-CYP734A, LuP450-272-CYP85A, LuP450-277-CYP90C, LuP450-278-CYP90B, LuP450-316-CYP90A, and LuP450-352-CYP90D). All these genes belong to the 85 clan except the LuP450-41-CYP734A gene, which belongs to the 72 clan.
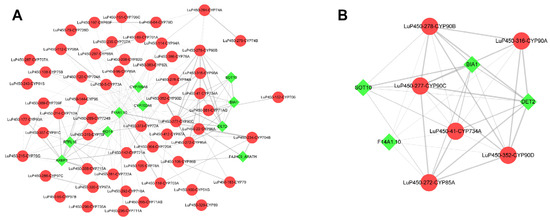
Figure 9.
LuP450 protein interactions network map. Red dots represent flax P450 genes and green diamonds represent other genes. (A) All LuP450 protein interactions network map. (B) Core network map calculated by the MCODE plugin.
3. Discussion
The cytochrome P450 (CYP) superfamily includes a wide range of hemeproteins, and it is the largest enzyme–protein superfamily among living organisms [18]. Originating in prokaryotes, the P450 gene has since been demonstrated to be widely distributed in plants, animals, fungi, yeasts, and algae. The P450 gene in plants was first discovered in cotton [10] and is significantly more abundant in higher plants than in other organisms [19]. Currently, there are more than 300,000 gene sequences in the P450 gene database, of which more than 16,000 plant P450 genes have been named [20]. P450 genes make up roughly 1% of the total number of plant genes, with the proportion varying in different plants. There were 245 P450 genes found in Arabidopsis thaliana (L.) [21], 74 in P. bretschneideri [22], 223 in tomato (Solanum lycopersicum L.) [23], 351 in sorghum [24], 273 in tea plant (Camellia sinensis) [14], 376 in alfalfa (Medicago sativa L.) [25], 589 in peanuts (Arachis hypogaea L.) [26], 478 in pepper (Capsicum annuum L.), and 279 in cabbage (Brassica oleracea) [27]. This study identified 412 P450 genes in the flax genome, accounting for 1.25% (412/32785) of the total number of genes. Compared with a decade-old study [28], 78 more genes were identified, which will help us to better understand and utilize P450 genes for genetic breeding at the molecular level.
P450 genes were initially categorized into two types, the A-type clade and non-A-type clade, with A-type encoding mainly plant-specific secondary product metabolizing enzymes, while non-A-type mainly function in lipid or hormone metabolisms [8]. However, the classification of the P450 gene into only two types is clearly insufficient for such a large gene family, and more detailed classification and nomenclature is required. Based on the phylogenetic tree clustering results, the nomenclature committee subdivided the P450 gene into 11 clans, including one clan (71 clan) under the A-type clade and the other 10 clans under the non-A-type clade.
The P450 genes under each clan were named according to the sequence consistency, and their names consist of “CYP + number + letter.” If two genes have more than 40% amino acid sequence identity, they are categorized into one family and use the same number. Furthermore, if the amino acid sequence identity is more than 55%, the last letter is also the same, and they are categorized into the same subfamily [29].
Based on this nomenclature rule, 147 families have been identified in 11 clans of plants (CYP71-CYP99 and CYP701-CYP999), of which four clans contain multiple families (71 clan, 72 clan, 85 clan, and 86 clan) and seven clans contain only one family (51 clan, 74 clan, 97 clan, 710 clan, 711 clan, 727 clan, and 746 clan) [21].
Of the 412 LuP450 genes identified in this study, 248 A-type genes were categorized into 17 families under the 71 clan, and 164 non-A-type genes were categorized into 29 families under seven clans. Forty CYP749 subfamily genes were identified in this study, whereas no genes belonging to this subfamily were identified in previous studies [28]. In addition, 10 more genes were identified in the CYP81 and CYP83 families, respectively. This study identified more P450 genes, probably because we used a more comprehensive new reference genome annotation, and we used two identification strategies.
The P450 gene has four highly conserved structural domains: 1. the PXRX motif (“FXPERF” for A-type and “FXPXRX” for non-A-type); 2. the I-helix oxygen-binding domain (“AGXDT” for A-type and “AGX[D/E]T” for non-A-type); 3. the C-terminal heme-binding region (“PFGXGRRXCXG” for A-type and “XFXXGXRXCXG” for non-A-type); 4. the K-helix region (EXXR), which is consistent with both A-type and non-A-type [27,30,31].
This study found that only 56% of the LuP450 genes have all four typical structural domains simultaneously, suggesting that some of the structural domains may not be essential for accomplishing specific functions.
The P450 superfamily found in plants has a thioredoxin catalytic center, usually attached to the endoplasmic reticulum (ER) [32]. In this study, most of the P450 genes were found to be localized to chloroplasts and followed by the ER. This result is consistent with the study of the P450 gene family in tea plant [14] and Medicago sativa L. [25]
Gene structure analysis revealed that the flax P450 gene structure is relatively simple, with 58% containing only 1–2 exons, a result similar to that reported in pear (Pyrus spp.) [33]. A study in Medicago truncatula found that intron–exon ratios were specific across families, e.g., most CYP71 family members contained only one zero-phase intron, whereas CYP97B13, CYP96J18, and CYP97A10 contained more than 10 introns [34]. This study found distributional specificity in individual clans, such as most 71 clan members contain less than one intron, while 97 clan members contain more introns and have complex structures, suggesting that members of the same clan may have similar structures and functions.
Cis-acting elements are critical units of transcriptional regulation and are involved in the regulation of molecular networks [35]. This study found that the cis-acting elements of the LuP450 genes are diverse, with the highest content of light-responsive elements, and the number of elements related to hormone response, abiotic stress response, and growth and development was also higher, indicating the diversity of LuP450 gene functions. This result is also supported by the studies of foxtail millet (Setaria italica L.) [36] and grapevine (Vitis vinifera L.) [11].
Gene duplication is a key factor driving the evolution of species, through which gene families are expanded and species acquire new functions to accommodate environments [37]. The main forms are tandem and segmental duplication, the former associated with the origin of polyploidy and the latter with rapid adaptation to unfavorable environmental pressures [38]. The diversity of the P450 gene superfamily was introduced through an extensive process of gene duplication [8].
In this study, 147 segmental duplication events and 53 tandem duplication events were observed, with a ratio of 2.77 (147/53). This ratio is similar to that of peanut (Arachis hypogaea L.) (2.63), suggesting that fragment duplication is the main form of gene duplication [26]. In other species, such as tea plant (Camellia sinensis), pepper (Capsicum annuum L.), and foxtail millet (Setaria italica L.), tandem duplication events are the dominant form of gene duplication, and the ratios between segmental duplication and tandem duplication events are 0.75, 0.22, and 0.34, respectively [14,36,39].
Ka/Ks represents the ratio between the rate of nonsynonymous substitutions (Ka) and the rate of synonymous substitutions (Ks) in two protein-coding genes. This ratio can indicate whether there is a selective pressure on this protein-coding gene [40].
Ka/Ks > 1 indicates that the gene is under positive selection, Ka/Ks = 1 indicates neutral evolution, and Ka/Ks < 1 indicates purify selection [41]. In this study, all the paired genes’ Ka/Ks were found to be less than 1, indicating that the genes were subject to purification selection.
Cyanogenic glycosides belong to a group of antimicrobial compounds that protect plants from infection by providing defense against fungi, bacteria, and viruses. Two P450 family genes, CYP79 and CYP71, have been proven to be involved in the synthesis of raw cyanogenic glycosides in Sorghum bicolor (L.) Moench [15] and cassava (Manihot esculenta) [42]. In sorghum, it is involved in dhurrin biosynthesis. In cassava, CYP79 family genes catalyze the conversion of L-valine and L-isoleucine to the corresponding oximes, which are then catalyzed by CYP71 to form the corresponding cyanohydrin and finally glycosylated by UDP glucosyltransferases. Six homologs of the CYP79D1 and two CYP71E1 genes were identified in flax, which may be involved in the synthesis of cyanogenic glycosides [42].
In this study, two flax inbred lines with large differences in cyanogenic glycoside contents were selected and sampled at three developmental periods. Transcriptome analysis was utilized to find differentially expressed LuP450 genes, and 69, 64, and 94 differentially expressed LuP450 genes were identified in the three periods, respectively. There were 11 differentially expressed genes that were present in all three periods simultaneously, and they were more highly expressed in varieties with lower cyanogenic glycoside contents. The accuracy of transcriptome analysis was verified by RT-qPCR experiments. Six hub genes were obtained by protein interaction analysis. These genes may be involved in the synthesis of cyanogenic glycosides in flax and are important targets for our following functional validation.
The results of this study will help to reveal the regulatory mechanism of flax cyanogenic glycoside synthesis. Additionally, it will provide a basis for using genetic engineering to cultivate new flax varieties with low cyanogenic glycosides.
4. Materials and Methods
4.1. Identification Physiological Features of LuP450 Genes
The flax genome, protein sequence, and annotation files use our previously assembled method and can be downloaded from the Zenodo website (https://zenodo.org/records/7811972, accessed on 8 October 2023) [43].
The Hidden Markov Model file (PF00067) was downloaded from the Pfam database (http://pfam.xfam.org/, accessed on 2 February 2024). The HMMER (V3.1b2) software was used to identify P450 genes with default parameters.
In addition, we used a BLAST method for the complementary identification of the P450 gene. Briefly, 255 Arabidopsis thaliana P450 protein sequences were downloaded from the TAIR website. The BLAST databases were built using the makeblastdb command. Then, the flax protein sequences were used as query sequences for a local BLASTP comparison analysis with an E-value threshold of 1 × 10⁻¹⁰.
The putative P450 gene protein sequences were then submitted to the CDD, SMART, and PFAM databases for conserved domain confirmation, and the genes that did not have P450 typical structural domains were deleted in subsequent analyses.
The finalized P450 genes were renamed as “LuP450” and numbered according to the order they appeared on the chromosomes plus the subfamily they belong to. For example, the “LuP450-22-CYP86A” indicates the 22nd occurrence of the flax P450 gene belonging to the CYP86A subfamily. The molecular weight (Mw) and isoelectric point (pI) were determined using SeqStats and the pICalculator Bioperl module [44].
4.2. Phylogenetic Analysis of LuP450 Genes
All LuP450 protein sequences were aligned using the ClustalW algorithm in the MEGA 7 software with default parameters to clear up the evolutionary relationship. The phylogenetic tree was constructed using the maximum likelihood method (Jones–Taylor–Thornton model with 1000 bootstrap replicates). The phylogenetic tree file was then submitted to the Evolview V2 website (https://evolgenius.info//evolview-v2/#login, accessed 29 March 2024) [45] for further visualization and annotation.
4.3. Conserved Domain and Motif Analysis of LuP450 Genes
The LuP450 conserved motif analysis was conducted using the Multiple Em for Motif Elicitation website (MEME; https://meme-suite.org/tools/meme, accessed 29 March 2024). The total number of motifs searched was set to 10, with a minimum length of six amino acids and a maximum length of 100 amino acids.
4.4. Gene Structure, Chromosomal Localization, and Cis-Acting Elements Analysis of LuP450 Genes
A Perl script was used to obtain information about the exon, CDS, and UTR positions of the LuP450 genes. The physical location of the LuP450 gene was retrieved from the gff3 file, and the chromosome lengths were obtained using SAMtools software (1.15.1). The gene chromosomal localization was visualized using MapChart software (2.3.2). To identify the cis-acting elements of the LuP450 genes, 1500 kb of gene sequence upstream of the start codon (ATG) was extracted. The cis-acting elements were identified using the Plant Cis-Acting Regulatory Element (PlantCARE, https://bioinformatics.psb.ugent.be/webtools/plantcare/html/, accessed 21 February 2024) [46].
The “gene structure view feature” function of the TBtools software (2.142) [47] was used to present the phylogenetic tree, motif, gene structure, and cis-acting elements in a single figure.
4.5. Subcellular Localization Prediction of LuP450 Genes
The advanced online computational tool WoLF PSORT [48] (PSORT II, http://www.genscript.com/wolf-psort.html, accessed 17 May 2024) program was used to predict the LuP450 gene subcellular localization.
4.6. Intragenomic Covariance Analysis of LuP450 Genes
Genome-wide segmental analysis and tandem deduplication event analysis were conducted using MCscanX software with default parameters. These events were visualized using Circos software (0.69-8). To determine the selection pressure of LuP450 genes, the synonymous (Ka) and non-synonymous (Ks) substitution rates between LuP450 gene pairs were calculated using the Kaks Calculator with the YN method. The divergence times of the LuP450 genes from their ancestors was estimated using the following equation: T = Ks/2λ, and for dicotyledons, λ = 1.5 × 10⁻⁸ [49].
4.7. Intergenomic Covariance Analysis of the LuP450 Gene
The synteny comparison among Linum usitatissimum L., Helianthus annuus L., and Arabidopsis thaliana was performed using MCscan (https://github.com/tanghaibao/jcvi/wiki/MCscan-(Python-version), accessed 29 March 2024).
The CDS sequences and gff annotation files were downloaded from the Phytozome website. The chromosome-scale pairwise synteny search was performed using the javi.compara.catalog command. The macrosynteny were visualized using jcvi.graphics.karyotype command.
4.8. LuP450 Gene Expression Analysis
To investigate the expression pattern of LuP450 genes, we chose flax inbred line A15 with high cyanogenic glycoside content and A224 with low cyanogenic glycoside content for transcriptome analysis. Flax capsules were sampled on the day of flowering, on the 15th day after flowering, and on the 30th day after flowering, respectively.
Total RNA was extracted using the TransZol Up Plus RNA kit (Transgen, Beijing, China), followed by cDNA first-strand synthesis using the MightyScript First Strand cDNA Synthesis Master Mix (Tailing Reaction, Auckland, New Zealand).
High-quality reads were aligned to the reference genome using Hisat2 (2.2.1) software. Gene expression levels were expressed using fragments per kilobase of the exon model per million mapped fragments (FPKM) values. The DESeq2 Rpackage (1.40.2) was used for differentially expressed gene (DEG) analysis.
Three comparison combinations, A15S/A224S, A15M/A224M, and A15L/A224L, were set up to represent the expression of the LuP450 genes in the two materials.
The letters S, M, and L indicate the day of flowering, 15 days after flowering, and 30 days after flowering, respectively. The threshold for DEG was set as padj < 0.05 and abs(log2FoldChange) > 1.
To verify the accuracy of transcriptome analysis, 9 differentially expressed LuP450 genes were randomly selected for RT-qPCR validation. The experiments were performed on a FTC-3000TM Real-Time Quantitative Thermal Cycler (Funglyn Biotech, Toronto, ON, Canada) instrument. Gene-specific primers were designed using the free online primer design tool (https://www.sangon.com/newPrimerDesign, accessed 29 March 2024).
Three replicates were performed for each sample, and gene expression was calculated by 2−△△Ct method, with EF1A-F gene as an endogenous control. The sequence information is shown in Table 1.

Table 1.
Primers for RT-qPCR validation analysis.
4.9. Protein–Protein Interaction Network Analysis of LuP450 Genes
To investigate the interactions between LuP450 proteins, we performed a protein–protein interaction (PPI) analysis. The homologs of the LuP450 genes in Arabidopsis were obtained using the OrthoVenn3 platform (https://orthovenn3.bioinfotoolkits.net/start/db, accessed 29 March 2024) [50]. Protein interaction networks were obtained using the STRING website (https://string-db.org, accessed 29 March 2024) [51]. The network was visualized and optimized using Cytoscape software (3.8.2) [52]. Then, we used the MCODE plugin [53] to screen for hub genes with node degreed cutoff = 5, cluster finding method = Haircut, score cutoff = 0.2, k-core = 2, and maximum depth = 100.
5. Conclusions
In this study, 412 LuP450 genes were identified on our assembled genome and were analyzed for physiological features, phylogenetic relationships, conserved domains, gene structures, cis-acting elements, fragments, and tandem duplication events, which help us to understand their classifications and properties. Transcriptome analysis was performed using two flax inbred lines with different raw cyanogenic glycoside contents at three time points, and 11 common DEGs were obtained (LuP450-383-CYP82L, LuP450-355-CYP81Q, LuP450-395-CYP71AS, LuP450-187-CYP72A, LuP450-357-CYP81C, LuP450-189-CYP82J, LuP450-389-CYP709F, LuP450-249-CYP71D, LuP450-411-CYP71BE, LuP450-71-CYP80C, and LuP450-67-CYP80C). Additionally, six hub genes were obtained using protein interaction analysis (LuP450-41-CYP734A, LuP450-272-CYP85A, LuP450-277-CYP90C, LuP450-278-CYP90B, LuP450-316-CYP90A, and LuP450-352-CYP90D). These genes will be made a focus for functional validation and used for low-cyanogenic glycoside flax breeding.
Supplementary Materials
The following supporting information can be downloaded at https://www.mdpi.com/article/10.3390/ijms26083637/s1.
Author Contributions
Y.W. and R.S. performed the experiments and finished drafting the initial manuscript. Y.M., Y.Z. and Z.L. edited the manuscript and performed the data collation and statistical analysis. X.S., L.T. and D.L. contributed suggestions and reviewed the literature and manuscript. L.Y. designed the research, supervision, and guidance and edited and reviewed the manuscript. All authors have read and agreed to the published version of the manuscript.
Funding
This study was supported by the National Natural Science Foundation of China (No. 32160448), the Inner Mongolia Natural Science Foundation (No. 2023MS03008, No. 2024MS03026), and the Basic Research Operating Expenses Program for Colleges and Universities directly under the Inner Mongolia Autonomous Region (No. BR231513).
Institutional Review Board Statement
Not applicable.
Informed Consent Statement
Not applicable.
Data Availability Statement
Data will be made available upon request.
Conflicts of Interest
The authors declare no conflict of interest.
References
- Fu, Y.B. Flax domesticationprocesses as inferred from genome-wide SNP data. Sci. Rep. 2025, 15, 8731. [Google Scholar] [CrossRef] [PubMed]
- Huis, R.; Hawkins, S.; Neutelings, G. Selection of reference genes for quantitative gene expression normalization in flax (Linum usitatissimum L.). BMC Plant Biol. 2010, 10, 71. [Google Scholar] [CrossRef]
- Jenab, M.; Thompson, L.U. The influence of flaxseed and lignans on colon carcinogenesis and beta-glucuronidase activity. Carcinogenesis 1996, 17, 1343–1348. [Google Scholar] [CrossRef]
- Wu, C.F.; Xu, X.M.; Huang, S.H.; Deng, M.C.; Feng, A.J.; Peng, J.; Yuan, J.P.; Wang, J.H. An efficient fermentation method for the degradation of cyanogenic glycosides in flaxseed. Food Addit. Contam. Part A Chem. Anal. Control Expo. Risk Assess. 2012, 29, 1085–1091. [Google Scholar] [CrossRef]
- Oomah, B.D.; Mazza, G.; Kenaschuk, E.O. Cyanogenic compounds in flaxseed. J. Agric. Food Chem. 1992, 40, 1346–1348. [Google Scholar] [CrossRef]
- Niedźwiedź-Siegień, I. Cyanogenic Glucosides In Linum Usitatissimum. Phytochemistry 1998, 49, 59–63. [Google Scholar] [CrossRef]
- Zuk, M.; Pelc, K.; Szperlik, J.; Sawula, A.; Szopa, J. Metabolism of the Cyanogenic Glucosides in Developing Flax: Metabolic Analysis, and Expression Pattern of Genes. Metabolites 2020, 10, 288. [Google Scholar] [CrossRef]
- Werck-Reichhart, D.; Feyereisen, R. Cytochromes P450: A success story. Genome Biol. 2000, 1, reviews3003.1. [Google Scholar] [CrossRef]
- Danielson, P.Á. The cytochrome P450 superfamily: Biochemistry, evolution and drug metabolism in humans. Curr. Drug Metab. 2002, 3, 561–597. [Google Scholar] [CrossRef]
- Frear, D.S.; Swanson, H.R.; Tanaka, F.S. N-demethylation of substituted 3-(phenyl)-1-methylureas: Isolation and characterization of a microsomal mixed function oxidase from cotton. Phytochemistry 1969, 8, 2157–2169. [Google Scholar] [CrossRef]
- Minerdi, D.; Savoi, S.; Sabbatini, P. Role of Cytochrome P450 Enzyme in Plant Microorganisms’ Communication: A Focus on Grapevine. Int. J. Mol. Sci. 2023, 24, 4695. [Google Scholar] [CrossRef] [PubMed]
- Schuler, M.A.; Werck-Reichhart, D. Functional Genomics of P450S. Annu. Rev. Plant Biol. 2003, 54, 629–667. [Google Scholar] [CrossRef] [PubMed]
- Lin, X.; Tang, B.; Li, Z.; Shi, L.; Zhu, H. Genome-wide identification and expression analyses of CYP450 genes in sweet potato (Ipomoea batatas L.). BMC Genom. 2024, 25, 58. [Google Scholar] [CrossRef] [PubMed]
- Shen, C.; Li, X. Genome-wide analysis of the P450 gene family in tea plant (Camellia sinensis) reveals functional diversity in abiotic stress. BMC Genom. 2023, 24, 535. [Google Scholar] [CrossRef]
- Kahn, R.A.; Fahrendorf, T.; Halkier, B.A.; Møller, B.L. Substrate specificity of the cytochrome P450 enzymes CYP79A1 and CYP71E1 involved in the biosynthesis of the cyanogenic glucoside dhurrin in Sorghum bicolor (L.) Moench. Arch. Biochem. Biophys. 1999, 363, 9–18. [Google Scholar] [CrossRef]
- Busk, P.K.; Møller, B.L. Dhurrin synthesis in sorghum is regulated at the transcriptional level and induced by nitrogen fertilization in older plants. Plant Physiol. 2002, 129, 1222–1231. [Google Scholar] [CrossRef]
- Davis, R. Cyanogens. In Toxic Substances in Crop Plants; DeMello, J.P., DeMello, F., Duffus, C.M., Duffus, J.M., Eds.; Royal Society of Chemistry; Cambridge University Press: Cambridge, UK, 1991; pp. 202–225. [Google Scholar]
- Pankov, K.V.; McArthur, A.G.; Gold, D.A.; Nelson, D.R.; Goldstone, J.V.; Wilson, J.Y. The cytochrome P450 (CYP) superfamily in cnidarians. Sci. Rep. 2021, 11, 9834. [Google Scholar] [CrossRef]
- Nelson, D.R. Cytochrome P450 diversity in the tree of life. Biochim. Biophys. Acta BBA—Proteins Proteom. 2018, 1866, 141–154. [Google Scholar] [CrossRef]
- Nelson, D.R. The cytochrome p450 homepage. Hum. Genom. 2009, 4, 59–65. [Google Scholar] [CrossRef]
- Nelson, D.; Werck-Reichhart, D. A P450-centric view of plant evolution. Plant J. 2011, 66, 194–211. [Google Scholar] [CrossRef]
- Ackah, M.; Boateng, N.A.S.; Dhanasekaran, S.; Zhang, H.; Yang, Q. Genome wide and comprehensive analysis of the cytochrome P450 (CYPs) gene family in Pyrus bretschneideri: Expression patterns during Sporidiobolus pararoseus Y16 enhanced with ascorbic acid (VC) treatment. Plant Physiol. Biochem. 2024, 206, 108303. [Google Scholar] [CrossRef] [PubMed]
- Vasav, A.P.; Barvkar, V.T. Phylogenomic analysis of cytochrome P450 multigene family and their differential expression analysis in Solanum lycopersicum L. suggested tissue specific promoters. BMC Genom. 2019, 20, 116. [Google Scholar] [CrossRef]
- Fang, Y.; Jiang, J.; Du, Q.; Luo, L.; Li, X.; Xie, X. Cytochrome P450 Superfamily: Evolutionary and Functional Divergence in Sorghum (Sorghum bicolor) Stress Resistance. J. Agric. Food Chem. 2021, 69, 10952–10961. [Google Scholar] [CrossRef] [PubMed]
- Zhang, X.; Xue, L.; Chen, R.; Ma, Q.; Ma, D.; Liu, X. Genome-wide identification of the cytochrome P450 family and analysis of CYP regarding salt tolerance in Medicago sativa L. Grass Res. 2023, 3, 21. [Google Scholar] [CrossRef]
- Zhang, K.; Qin, Y.; Sun, W.; Shi, H.; Zhao, S.; He, L.; Li, C.; Zhao, J.; Pan, J.; Wang, G.; et al. Phylogenomic Analysis of Cytochrome P450 Gene Superfamily and Their Association with Flavonoids Biosynthesis in Peanut (Arachis hypogaea L.). Genes 2023, 14, 1944. [Google Scholar] [CrossRef] [PubMed]
- Ji, J.; Cao, W.; Yang, L.; Fang, Z.; Zhang, Y.; Zhuang, M.; Lv, H.; Wang, Y.; Liu, Y.; Li, Z.; et al. Genome-wide analysis of cabbage cytochrome P450 genes and characterization of BoCYP704B1, a gene responsible for cabbage anther development. Sci. Hortic. 2021, 283, 110096. [Google Scholar] [CrossRef]
- Babu, P.R.; Rao, K.V.; Reddy, V.D. Structural organization and classification of cytochrome P450 genes in flax (Linum usitatissimum L.). Gene 2013, 513, 156–162. [Google Scholar] [CrossRef]
- Nelson, D.R.; Koymans, L.; Kamataki, T.; Stegeman, J.J.; Feyereisen, R.; Waxman, D.J.; Waterman, M.R.; Gotoh, O.; Coon, M.J.; Estabrook, R.W.; et al. P450 superfamily: Update on new sequences, gene mapping, accession numbers and nomenclature. Pharmacogenetics 1996, 6, 1–42. [Google Scholar] [CrossRef]
- Liu, X.-M.; Xu, X.; Li, B.-H.; Yao, X.-X.; Zhang, H.-h.; Wang, G.-Q.; Han, Y.-J. Genomic and transcriptomic insights into cytochrome P450 monooxygenase genes involved in nicosulfuron tolerance in maize (Zea mays L.). J. Integr. Agric. 2018, 17, 1790–1799. [Google Scholar] [CrossRef]
- Chen, Y.; Klinkhamer, P.G.L.; Memelink, J.; Vrieling, K. Diversity and evolution of cytochrome P450s of Jacobaea vulgaris and Jacobaea aquatica. BMC Plant Biol. 2020, 20, 342. [Google Scholar] [CrossRef]
- Dauda, W.P.; Abraham, P.; Glen, E.; Adetunji, C.O.; Ghazanfar, S.; Ali, S.; Al-Zahrani, M.; Azameti, M.K.; Alao, S.E.L.; Zarafi, A.B.; et al. Robust Profiling of Cytochrome P450s (P450ome) in Notable Aspergillus spp. Life 2022, 12, 451. [Google Scholar] [CrossRef]
- Zhang, W.; Li, H.; Li, Q.; Wang, Z.; Zeng, W.; Yin, H.; Qi, K.; Zou, Y.; Hu, J.; Huang, B.; et al. Genome-wide identification, comparative analysis and functional roles in flavonoid biosynthesis of cytochrome P450 superfamily in pear (Pyrus spp.). BMC Genom. Data 2023, 24, 58. [Google Scholar] [CrossRef]
- Xia, Y.; Yang, J.; Ma, L.; Yan, S.; Pang, Y. Genome-Wide Identification and Analyses of Drought/Salt-Responsive Cytochrome P450 Genes in Medicago truncatula. Int. J. Mol. Sci. 2021, 22, 9957. [Google Scholar] [CrossRef] [PubMed]
- Ibraheem, O.; Botha, C.E.J.; Bradley, G. In silico analysis of cis-acting regulatory elements in 5′ regulatory regions of sucrose transporter gene families in rice (Oryza sativa Japonica) and Arabidopsis thaliana. Comput. Biol. Chem. 2010, 34, 268–283. [Google Scholar] [CrossRef] [PubMed]
- Li, X.; Wang, L.; Li, W.; Zhang, X.; Zhang, Y.; Dong, S.; Song, X.; Zhao, J.; Chen, M.; Yuan, X. Genome-Wide Identification and Expression Profiling of Cytochrome P450 Monooxygenase Superfamily in Foxtail Millet. Int. J. Mol. Sci. 2023, 24, 11053. [Google Scholar] [CrossRef]
- Otto, S.P.; Yong, P. The evolution of gene duplicates. Adv. Genet. 2002, 46, 451–483. [Google Scholar] [PubMed]
- Hanada, K.; Zou, C.; Lehti-Shiu, M.D.; Shinozaki, K.; Shiu, S.H. Importance of lineage-specific expansion of plant tandem duplicates in the adaptive response to environmental stimuli. Plant Physiol. 2008, 148, 993–1003. [Google Scholar] [CrossRef]
- Hao, Y.; Dong, Z.; Zhao, Y.; Tang, W.; Wang, X.; Li, J.; Wang, L.; Hu, Y.; Fang, L.; Guan, X.; et al. Phylogenomic analysis of cytochrome P450 multigene family and its differential expression analysis in pepper (Capsicum annuum L.). Front. Plant Sci. 2022, 13, 1078377. [Google Scholar] [CrossRef]
- Hurst, L.D. The Ka/Ks ratio: Diagnosing the form of sequence evolution. Trends Genet. 2002, 18, 486. [Google Scholar] [CrossRef]
- Navarro, A.; Barton, N.H. Chromosomal speciation and molecular divergence–accelerated evolution in rearranged chromosomes. Science 2003, 300, 321–324. [Google Scholar] [CrossRef]
- Kannangara, R.; Motawia, M.S.; Hansen, N.K.; Paquette, S.M.; Olsen, C.E.; Moller, B.L.; Jorgensen, K. Characterization and expression profile of two UDP-glucosyltransferases, UGT85K4 and UGT85K5, catalyzing the last step in cyanogenic glucoside biosynthesis in cassava. Plant J. 2011, 68, 287–301. [Google Scholar] [CrossRef] [PubMed]
- Zhao, X.; Yi, L.; Zuo, Y.; Gao, F.; Cheng, Y.; Zhang, H.; Zhou, Y.; Jia, X.; Su, S.; Zhang, D.; et al. High-Quality Genome Assembly and Genome-Wide Association Study of Male Sterility Provide Resources for Flax Improvement. Plants 2023, 12, 2773. [Google Scholar] [CrossRef]
- Stajich, J.E.; Block, D.; Boulez, K.; Brenner, S.E.; Chervitz, S.A.; Dagdigian, C.; Fuellen, G.; Gilbert, J.G.; Korf, I.; Lapp, H.; et al. The Bioperl toolkit: Perl modules for the life sciences. Genome Res. 2002, 12, 1611–1618. [Google Scholar] [CrossRef]
- He, Z.; Zhang, H.; Gao, S.; Lercher, M.J.; Chen, W.-H.; Hu, S. Evolview v2: An online visualization and management tool for customized and annotated phylogenetic trees. Nucleic Acids Res. 2016, 44, W236–W241. [Google Scholar] [CrossRef] [PubMed]
- Lescot, M.; Déhais, P.; Thijs, G.; Marchal, K.; Moreau, Y.; Van de Peer, Y.; Rouzé, P.; Rombauts, S. PlantCARE, a database of plant cis-acting regulatory elements and a portal to tools for in silico analysis of promoter sequences. Nucleic Acids Res. 2002, 30, 325–327. [Google Scholar] [CrossRef]
- Chen, C.; Wu, Y.; Li, J.; Wang, X.; Zeng, Z.; Xu, J.; Liu, Y.; Feng, J.; Chen, H.; He, Y.; et al. TBtools-II: A “one for all, all for one” bioinformatics platform for biological big-data mining. Mol. Plant 2023, 16, 1733–1742. [Google Scholar] [CrossRef]
- Horton, P.; Park, K.J.; Obayashi, T.; Fujita, N.; Harada, H.; Adams-Collier, C.J.; Nakai, K. WoLF PSORT: Protein localization predictor. Nucleic Acids Res. 2007, 35, W585–W587. [Google Scholar] [CrossRef]
- Koch, M.A.; Haubold, B.; Mitchell-Olds, T. Comparative evolutionary analysis of chalcone synthase and alcohol dehydrogenase loci in Arabidopsis, Arabis, and related genera (Brassicaceae). Mol. Biol. Evol. 2000, 17, 1483–1498. [Google Scholar] [CrossRef] [PubMed]
- Sun, J.; Lu, F.; Luo, Y.; Bie, L.; Xu, L.; Wang, Y. OrthoVenn3: An integrated platform for exploring and visualizing orthologous data across genomes. Nucleic Acids Res. 2023, 51, W397–W403. [Google Scholar] [CrossRef]
- Szklarczyk, D.; Franceschini, A.; Kuhn, M.; Simonovic, M.; Roth, A.; Minguez, P.; Doerks, T.; Stark, M.; Muller, J.; Bork, P.; et al. The STRING database in 2011: Functional interaction networks of proteins, globally integrated and scored. Nucleic Acids Res. 2011, 39, D561–D568. [Google Scholar] [CrossRef]
- Shannon, P.; Markiel, A.; Ozier, O.; Baliga, N.S.; Wang, J.T.; Ramage, D.; Amin, N.; Schwikowski, B.; Ideker, T. Cytoscape: A software environment for integrated models of biomolecular interaction networks. Genome Res. 2003, 13, 2498–2504. [Google Scholar] [CrossRef] [PubMed]
- Bader, G.D.; Hogue, C.W. An automated method for finding molecular complexes in large protein interaction networks. BMC Bioinform. 2003, 4, 2. [Google Scholar] [CrossRef] [PubMed]
Disclaimer/Publisher’s Note: The statements, opinions and data contained in all publications are solely those of the individual author(s) and contributor(s) and not of MDPI and/or the editor(s). MDPI and/or the editor(s) disclaim responsibility for any injury to people or property resulting from any ideas, methods, instructions or products referred to in the content. |
© 2025 by the authors. Licensee MDPI, Basel, Switzerland. This article is an open access article distributed under the terms and conditions of the Creative Commons Attribution (CC BY) license (https://creativecommons.org/licenses/by/4.0/).