Article

Advancing Personalized Medicine in Alzheimer’s Disease: Liquid Biopsy Epigenomics Unveil APOE ε4-Linked Methylation Signatures

by
Mónica Macías
1,
Juan José Alba-Linares
2,3,4,5,
Blanca Acha
1,
Idoia Blanco-Luquin
1,
Agustín F. Fernández
2,3,4,5,
Johana Álvarez-Jiménez
1,
Amaya Urdánoz-Casado
1,
Miren Roldan
1,
Maitane Robles
1,
Eneko Cabezon-Arteta
1,
Daniel Alcolea
6,7,
Javier Sánchez Ruiz de Gordoa
1,8,
Jon Corroza
8,
Carolina Cabello
1,8,
María Elena Erro
1,8,
Ivonne Jericó
8,
Mario F. Fraga
2,3,4,5,9 and
Maite Mendioroz
1,8,*
1
Neuroepigenetics Unit, Navarrabiomed, Hospital Universitario de Navarra, Universidad Pública de Navarra, Navarra Institute for Health Research (IdiSNA), 31008 Pamplona, Spain
2
Cancer Epigenetics and Nanomedicine Laboratory, Nanomaterials and Nanotechnology Research Center (CINN CSIC), 33940 El Entrego, Spain
3
Health Research Institute of Asturias (ISPA FINBA), University of Oviedo, 33011 Oviedo, Spain
4
Institute of Oncology of Asturias (IUOPA), University of Oviedo, 33006 Oviedo, Spain
5
Rare Diseases CIBER (CIBERER) of the Carlos III Health Institute (ISCIII), 28029 Madrid, Spain
6
Department of Neurology, Institut d’Investigacions Biomèdiques Sant Pau (IIB Sant Pau), Hospital de la Santa Creu i Sant Pau, Universitat Autònoma de Barcelona, 08025 Barcelona, Spain
7
Centro de Investigación Biomédica en Red en Enfermedades Neurodegenerativas, CIBERNED, 28029 Madrid, Spain
8
Neurology Department, Hospital Universitario de Navarra, Universidad Pública de Navarra, Navarra Institute for Health Research (IdiSNA), 31008 Pamplona, Spain
9
Department of Organisms and Systems Biology (B.O.S.), University of Oviedo, 33006 Oviedo, Spain
*
Author to whom correspondence should be addressed.
Int. J. Mol. Sci. 2025, 26(7), 3419; https://doi.org/10.3390/ijms26073419
Submission received: 28 January 2025 / Revised: 31 March 2025 / Accepted: 3 April 2025 / Published: 5 April 2025

Abstract

:
Recent studies show that patients with Alzheimer’s disease (AD) harbor specific methylation marks in the brain that, if accessible, could be used as epigenetic biomarkers. Liquid biopsy enables the study of circulating cell-free DNA (cfDNA) fragments originated from dead cells, including neurons affected by neurodegenerative processes. Here, we isolated and epigenetically characterized plasma cfDNA from 35 patients with AD and 35 cognitively healthy controls by using the Infinium® MethylationEPIC BeadChip array. Bioinformatics analysis was performed to identify differential methylation positions (DMPs) and regions (DMRs), including APOE ε4 genotype stratified analysis. Plasma pTau181 (Simoa) and cerebrospinal fluid (CSF) core biomarkers (Fujirebio) were also measured and correlated with differential methylation marks. Validation was performed with bisulfite pyrosequencing and bisulfite cloning sequencing. Epigenome-wide cfDNA analysis identified 102 DMPs associated with AD status. Most DMPs correlated with clinical cognitive and functional tests including 60% for Mini-Mental State Examination (MMSE) and 80% for Global Deterioration Scale (GDS), and with AD blood and CSF biomarkers. In silico functional analysis connected 30 DMPs to neurological processes, identifying key regulators such as SPTBN4 and APOE genes. Several DMRs were annotated to genes previously reported to harbor epigenetic brain changes in AD (HKR1, ZNF154, HOXA5, TRIM40, ATG16L2, ADAMST2) and were linked to APOE ε4 genotypes. Notably, a DMR in the HKR1 gene, previously shown to be hypermethylated in the AD hippocampus, was validated in cfDNA from an orthogonal perspective. These results support the feasibility of studying cfDNA to identify potential epigenetic biomarkers in AD. Thus, liquid biopsy could improve non-invasive AD diagnosis and aid personalized medicine by detecting epigenetic brain markers in blood.

1. Introduction

Alzheimer’s disease (AD) represents the primary cause of age-related dementia and the seventh leading cause of mortality globally [1]. The majority of AD cases occur sporadically in adults older than 65 years, referred to as late-onset AD (LOAD). With the ever increasing aging of the population, this neurodegenerative disease currently affects 1 in 9 people over the age of 65, and its prevalence is projected to reach 152 million people worldwide by 2050 [2,3]. Despite its significant impact, the underlying mechanisms for AD pathogenesis remain unclear. Enhancing the accuracy of AD diagnosis would optimize early therapeutic intervention strategies, thereby reducing costs and the increasing burden that AD represents for our society.
Multiple factors, such as biological, environmental, and genetic susceptibility, appear to be associated with the development of LOAD. Within genetic factors, APOE ε4 polymorphism has been found to be the most consistently associated with LOAD development [4]. In recent years, epigenetics has emerged as a significant player in the pathogenesis of neurodegenerative diseases such as AD [5]. Among different epigenetic modifications, DNA methylation—where a methyl group attaches to the 5-carbon position of a cytosine base, typically in cytosine guanine dinucleotides (CpGs)—has been extensively studied. In the case of AD, gene candidate studies, along with the latest application of omics technologies to epigenetics, have revealed new DNA methylation variants in genes biologically relevant to AD in human brain tissue.
Our group and others have published epigenome-wide studies describing differentially methylated genes in various brain regions using postmortem human samples. These regions include the prefrontal cortex [6,7,8,9,10,11,12,13,14], frontal cortex [15], entorhinal cortex [9,10,11,14], hippocampus [14,16], or superior temporal gyrus and inferior frontal gyrus [11,13,17,18]. However, a major obstacle hinders the translation of these promising findings as biomarkers to clinical practice: the difficulty of accessing brain tissue from living individuals with AD. As a result, the AD specific epigenetic information remains “trapped” within the brain tissue and, therefore, rather inaccessible while the patient is alive. Studies performed on blood-derived genomic DNA have also identified differentially methylated marks between AD patients and controls [19,20,21,22]. Nonetheless, most of these marks do not match those observed in brain tissues.
It is widely acknowledged that cells undergo necrosis and apoptosis, among various processes of cell death, leading to the release of their DNA into the bloodstream. This DNA, characterized by specific molecular alterations, is commonly referred to as cell-free DNA (cfDNA). Liquid biopsy is a non-invasive technique involving a blood test that enables the isolation of cfDNA from plasma [23]. Under normal conditions, cfDNA primarily originates from the apoptosis of peripheral white blood cells [24]. However, as evidenced by the enrichment of tissue-specific methylation marks, a considerable proportion of cfDNA originates from damaged tissues during pathological processes [25].
To date, most liquid biopsy applications have mainly concentrated on the identification of genetic variants, such as tumor specific alterations. Nevertheless, liquid biopsy is emerging as a valuable tool in neurodegenerative diseases [26,27,28,29] where: (i) the blood–brain barrier is dysfunctional, increasing its permeability [30,31]; and (ii) there are no genetic modifications on the DNA of the affected cells. In these diseases, the analysis of epigenetic modifications in cfDNA specimens arises as a novel source of diagnostic biomarker. Variants in DNA methylation, in particular, are considered outstanding biomarkers because of their stability, potential reversibility, and accessibility in body fluids [32].
The liquid biopsy technique would provide access to this information “trapped” in the brain, enabling the identification of epigenetic biomarkers (specific methylation marks) in cfDNA from patients with AD. This molecular assessment of cfDNA specimens could be thus considered a potential surrogate for pathological studies of postmortem brain tissue, offering a potential source of epigenetic biomarkers that could assist in the clinical care of AD throughout the patient’s lifetime.
Hence, the aim of this study was to identify differential methylation signatures of plasma cfDNA in patients with AD compared with controls through a genome-wide methylation analysis.

2. Results

2.1. Characterization of Subjects and Samples

The Infinium® MethylationEPIC BeadChip microarray (EPIC array) was applied to a set of 35 controls and 35 patients with AD. No significant differences in age or sex were observed between the subjects with AD and the controls. Extended demographic and clinical features of the subjects are summarized in Table 1.

2.2. cfDNA Concentration and Quality

We managed to isolate plasma cfDNA from all the subjects included in this study. The amounts of cfDNA did not vary significantly between the controls and the patients with AD (median: 96 ng; IQR = 47–212 vs. median: 81 ng; IQR = 34–241; p-value = 0.445), respectively. First, we verified the cfDNA corresponding size in our sample set as described in the methods section using the DNF 477 High Small Fragment Analysis Kit (Agilent). The expected cfDNA size was confirmed in all samples. The median cfDNA size was 167 bp (IQR = 158 185) for patients with AD and 165 bp (IQR = 159 171) for controls, with no significant differences between groups (p-value = 0.451). An example electropherogram of a cfDNA sample is presented in Supplementary Materials: Figure S1.

2.3. Surrogate Variable Analysis

Surrogate variable analysis revealed one confounding variable of unknown significance (SV1) as the major source of variability affecting our series (Supplementary Materials: Figure S2). To ascertain the nature of this biological or technical variable, we decided to further characterize the cfDNA fragmentation pattern employing fragment analyzer technology. We found several samples with a carryover of non-sized cfDNA (Supplementary Materials: Figure S3a). To specifically quantify this cfDNA fraction and evaluate its impact, we decided to perform a more in depth characterization of the isolated cfDNA using the DNF 464 High Sensitivity Large Fragment 50 Kb Analysis Kit. This kit allows to track the cfDNA fragmentation pattern from 75 bp to 48,500 bp, covering both the expected cfDNA expected fragment size and an extended region with other potential non cfDNA fragments.
Interestingly, we noticed that non-sized cfDNA fragments were present in several samples, thus contributing to the total concentration. An example is shown in Supplementary Materials: Figure S3b. We observed that SV1 was negatively correlated with non-sized cfDNA. Global evaluation of non-sized cfDNA revealed a presence of 42.24% in controls and 54.89% in patients with AD, with no significant differences between groups (p-value = 0.07) (Supplementary Materials: Figure S4). Nevertheless, upon further examination of the influence of non-sized cfDNA on methylation levels, we observed a strong positive correlation between non-sized cfDNA and median β methylation values (r = 0.445; p-value < 0.001). Therefore, the non-sized cfDNA percentage was used to adjust all the subsequent analyses.

2.4. Differential Methylated Positions

After quality control and sample tracking, seven samples were discarded from downstream analysis. Finally, cfDNA from 30 controls and 33 patients with AD was used for differential methylation analysis. We confirmed that the loss of these subjects did not result in any changes leading to differences between patients with AD and controls in terms of phenotypical features, as illustrated in Supplementary Materials: Table S1. Genome-wide DNA methylation was investigated in the context of both differentially methylated positions (DMPs) and differentially methylated regions (DMRs). First, we built mixed linear models, adjusting for potential sources of variability, specifically including sex, age, batch, non-sized cfDNA (%), and cell type composition. After adjusting for Benjamini–Hochberg method (FDR) correction, we detected no significant DMPs associated with AD condition. When looking at the nominal significance level, analysis revealed 102 AD-related DMPs (absolute β difference ≥ 0.1 and p-value ≤ 0.05) annotated to 58 genes (Table 2), with an overrepresentation of hypomethylated positions in AD cases compared with controls (74%).
The genomic distribution of AD-related DMPs was assessed for differential enrichment in terms of CpG context and genomic regions (Figure 1). We observed that DMPs were more frequently located in CpG islands and shore regions, exhibiting a 1.3-fold enrichment (p-value < 0.05) compared with the random expectation based on all probes included in the analysis.

2.5. Correlation with AD Clinical Parameters and Biomarkers

Subsequently, Spearman’s coefficient was calculated to evaluate the potential correlation between DNA methylation levels of the top ten DMPs, ranked by the highest positive and negative β difference criteria, respectively, and main AD clinical features and biomarkers. Very interestingly, we found significant correlations between DNA methylation levels of DMPs and MMSE score in 12/20 (60%), and with GDS in 16/20 (80%) (Table 3 and Table 4).
Regarding biomarkers, we observed a significant correlation with the CSF Aβ42/Aβ40 ratio in 2/20 (10%) and with plasma pTau181 concentration in 7/20 (35%) (Table 3 and Table 4). We also observed several correlation trends, although without reaching significance for CSF pTau181 in up to 6/20 (30%). Interestingly, three genes significantly correlated with MMSE, GDS, and pTau181 levels, namely SMTNL2, GLRA1, and MORC2-AS1.

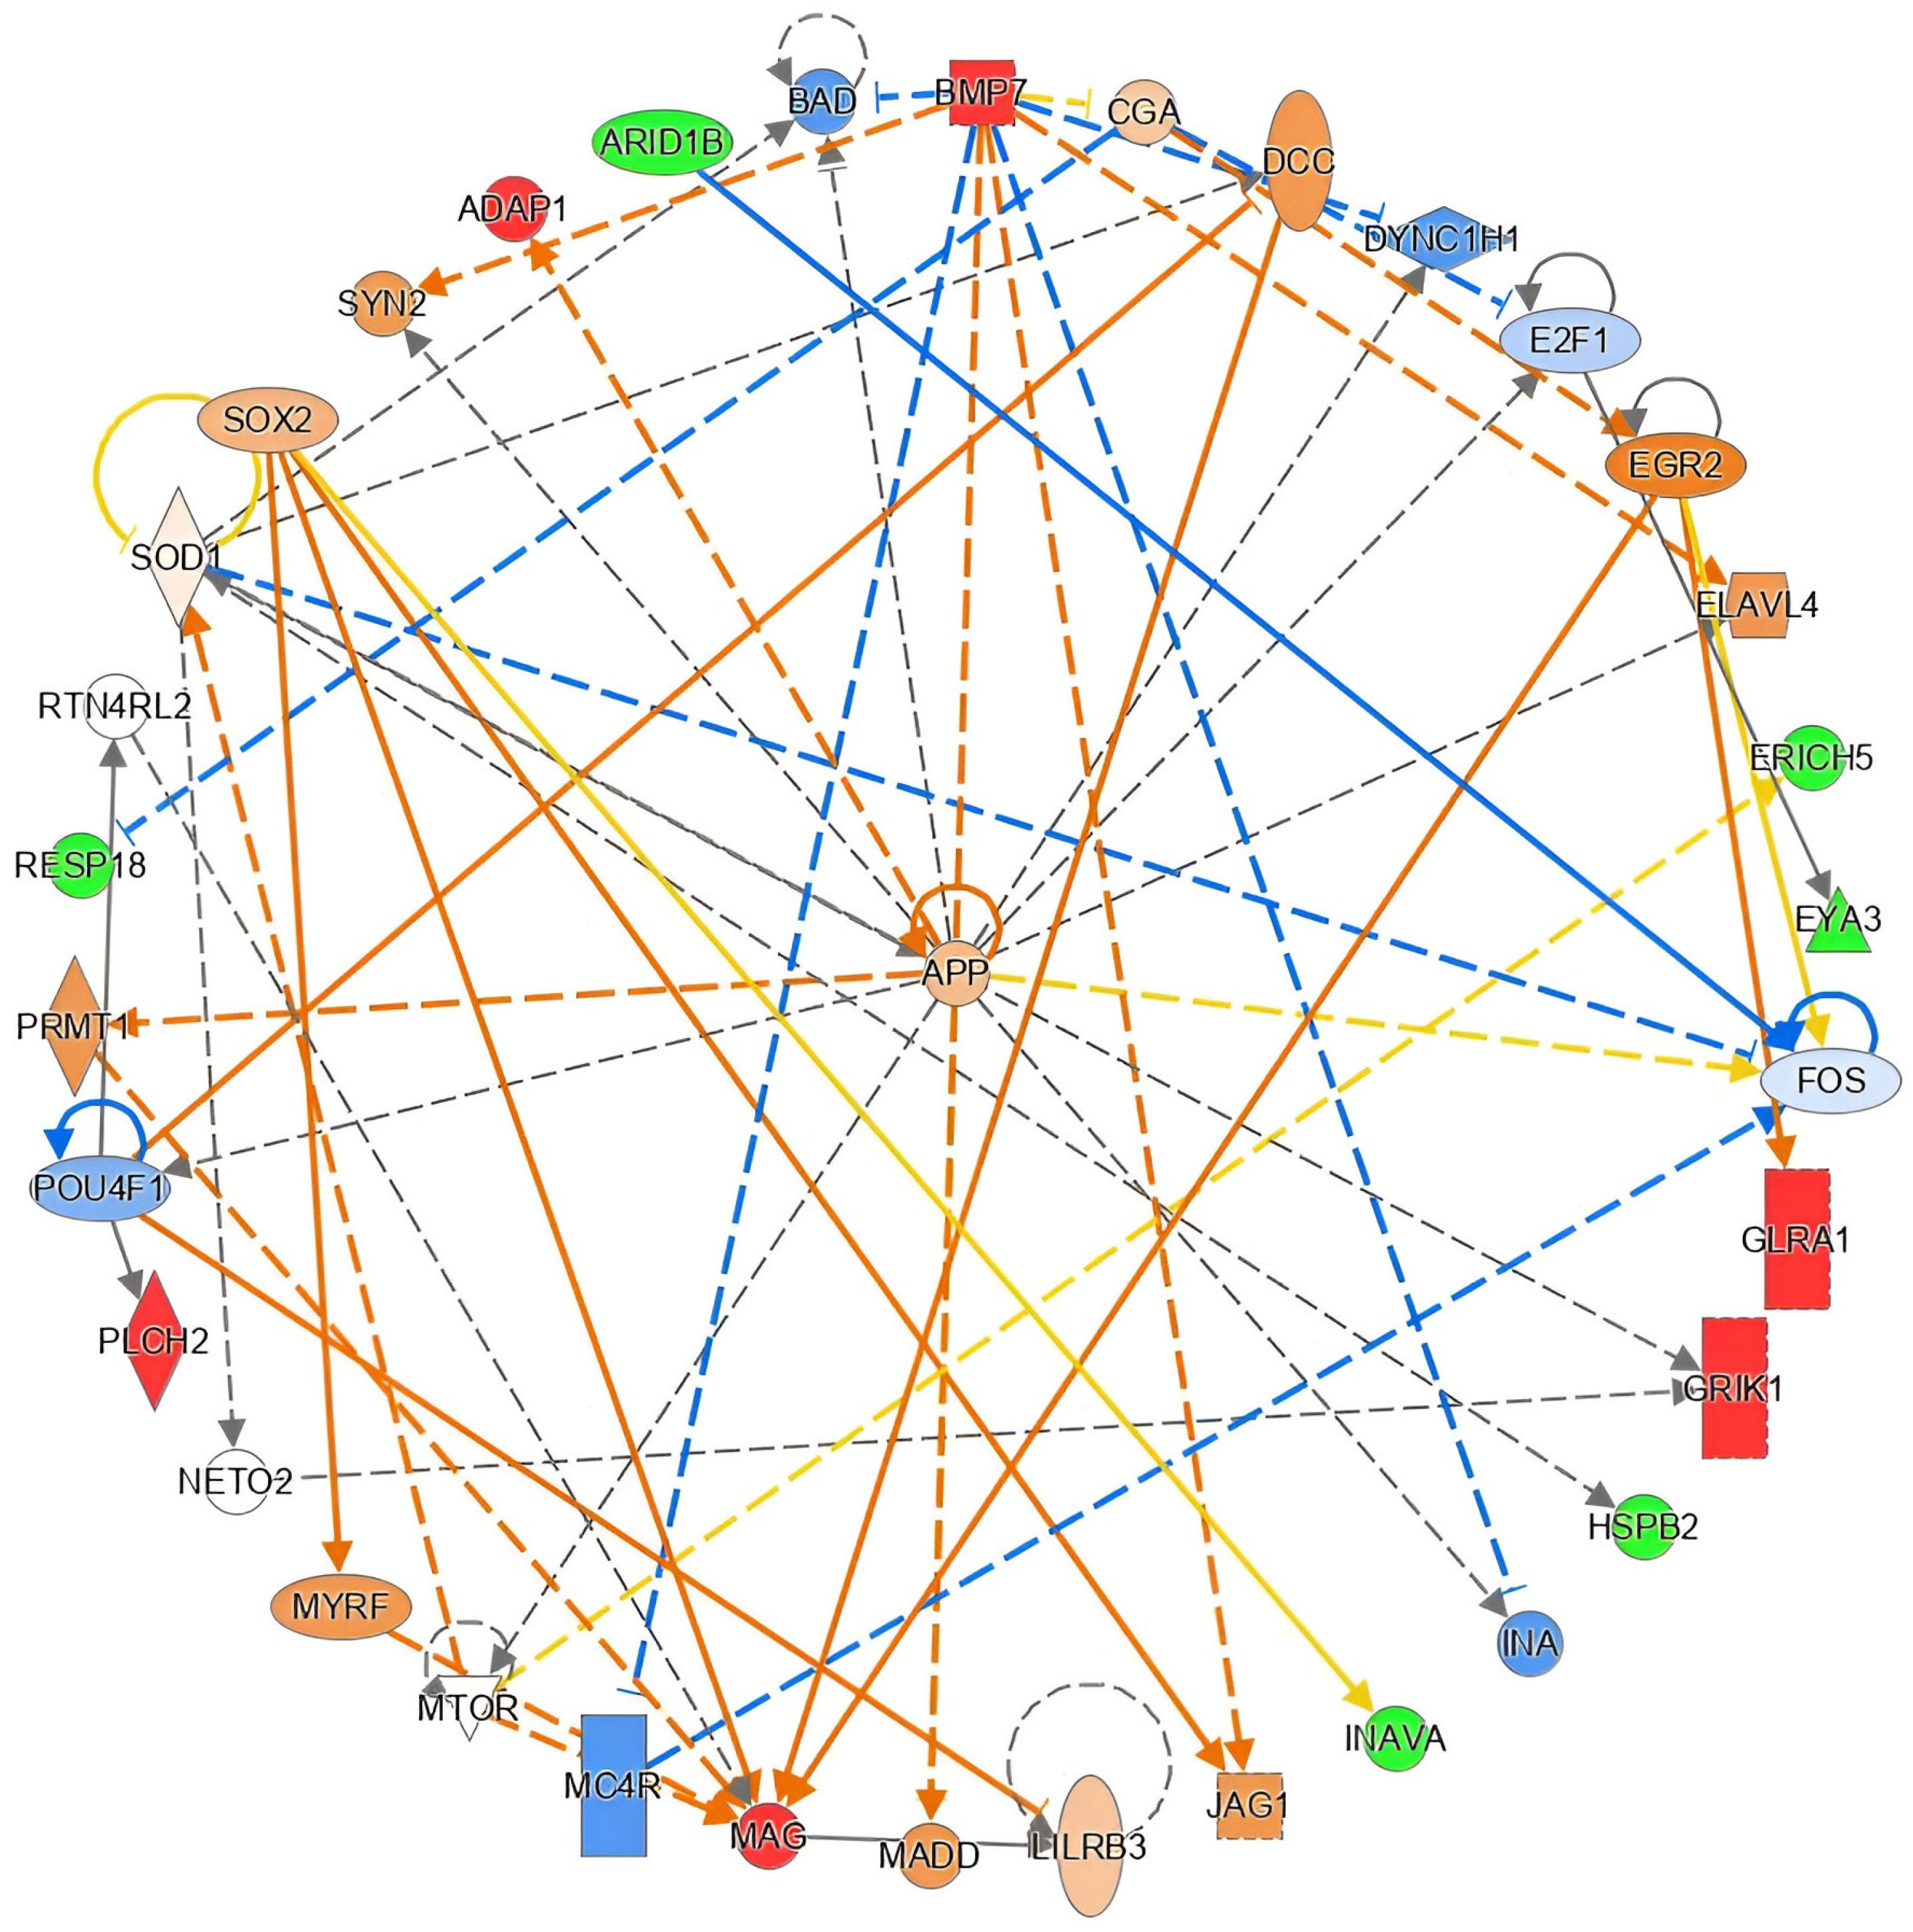
2.6. Functional in Silico Analysis of DMPs

We conducted ingenuity pathway analysis (IPA) to further explore the biological significance of AD-related DMPs identified in this study. Within the “diseases and functions” category, the analysis revealed that up to 30 molecules among our set of AD-related DMPs were associated with neurological disorders (p-value range = 4.53 × 10⁻²–1.10 × 10⁻³) (Supplementary Materials: Table S2). In the “physiological system development and function” category, we found that 11 molecules in our dataset were primarily mostly enriched in nervous system development and function (p-value range = 4.95 × 10⁻²–2.83× 10⁻⁵) (Supplementary Materials: Table S2).
Furthermore, IPA analysis predicted 24 upstream transcriptional regulators directly or indirectly linked to the genes in our dataset, prioritized by p-value. Among these, SPTBN4 (spectrin β non-erythrocytic 4), which encodes a brain cytoskeletal protein, emerged as the most significantly associated regulator (Supplementary Material: Table S3). Also remarkable was the presence of the APOE ε4 gene among these upstream regulators. Moreover, causal network analysis (CNA) [33] further connected upstream regulators to our dataset molecules, placing the APP gene (amyloid β precursor protein), which encodes a membrane protein mainly expressed in neuronal synapses and closely related to AD development, at the forefront of potential relationships (Figure 2).

2.7. Differential Methylated Positions According to APOE ε4 Status

As previously mentioned, the APOE ε4 genotype is considered the strongest genetic risk factor for LOAD, and DNA methylation has demonstrated to act closely with this factor, revealing DNA methylation differences between APOE ε4 carriers and non-carriers [34]. Therefore, to explore our results in greater depth, we divided our sample set regarding APOE ε4 status in each group of subjects as follows: patients with AD APOE ε4 carriers (n = 19; 58%), patients with AD APOE ε4 non-carriers (n = 14; 42%), control APOE ε4 carriers (n = 3; 10%), and control APOE ε4 non-carriers (n = 27; 90%). No comparison was performed with control APOE ε4 carriers due to the minimum number of APOE ε4 carriers in the control group.
When looking at the nominal significance level, major differences were found when comparing AD APOE ε4 carriers and control APOE ε4 non-carriers, represented by 980 DMPs (absolute β difference ≥ 0.1 and p-value ≤ 0.05) annotated to 668 genes (Supplementary Materials: Table S4). When comparing AD APOE ε4 non-carriers and control APOE ε4 non-carriers, we found 286 DMPs (absolute β difference ≥ 0.1 and p-value ≤ 0.05) annotated to 169 genes (Supplementary Materials: Table S5).

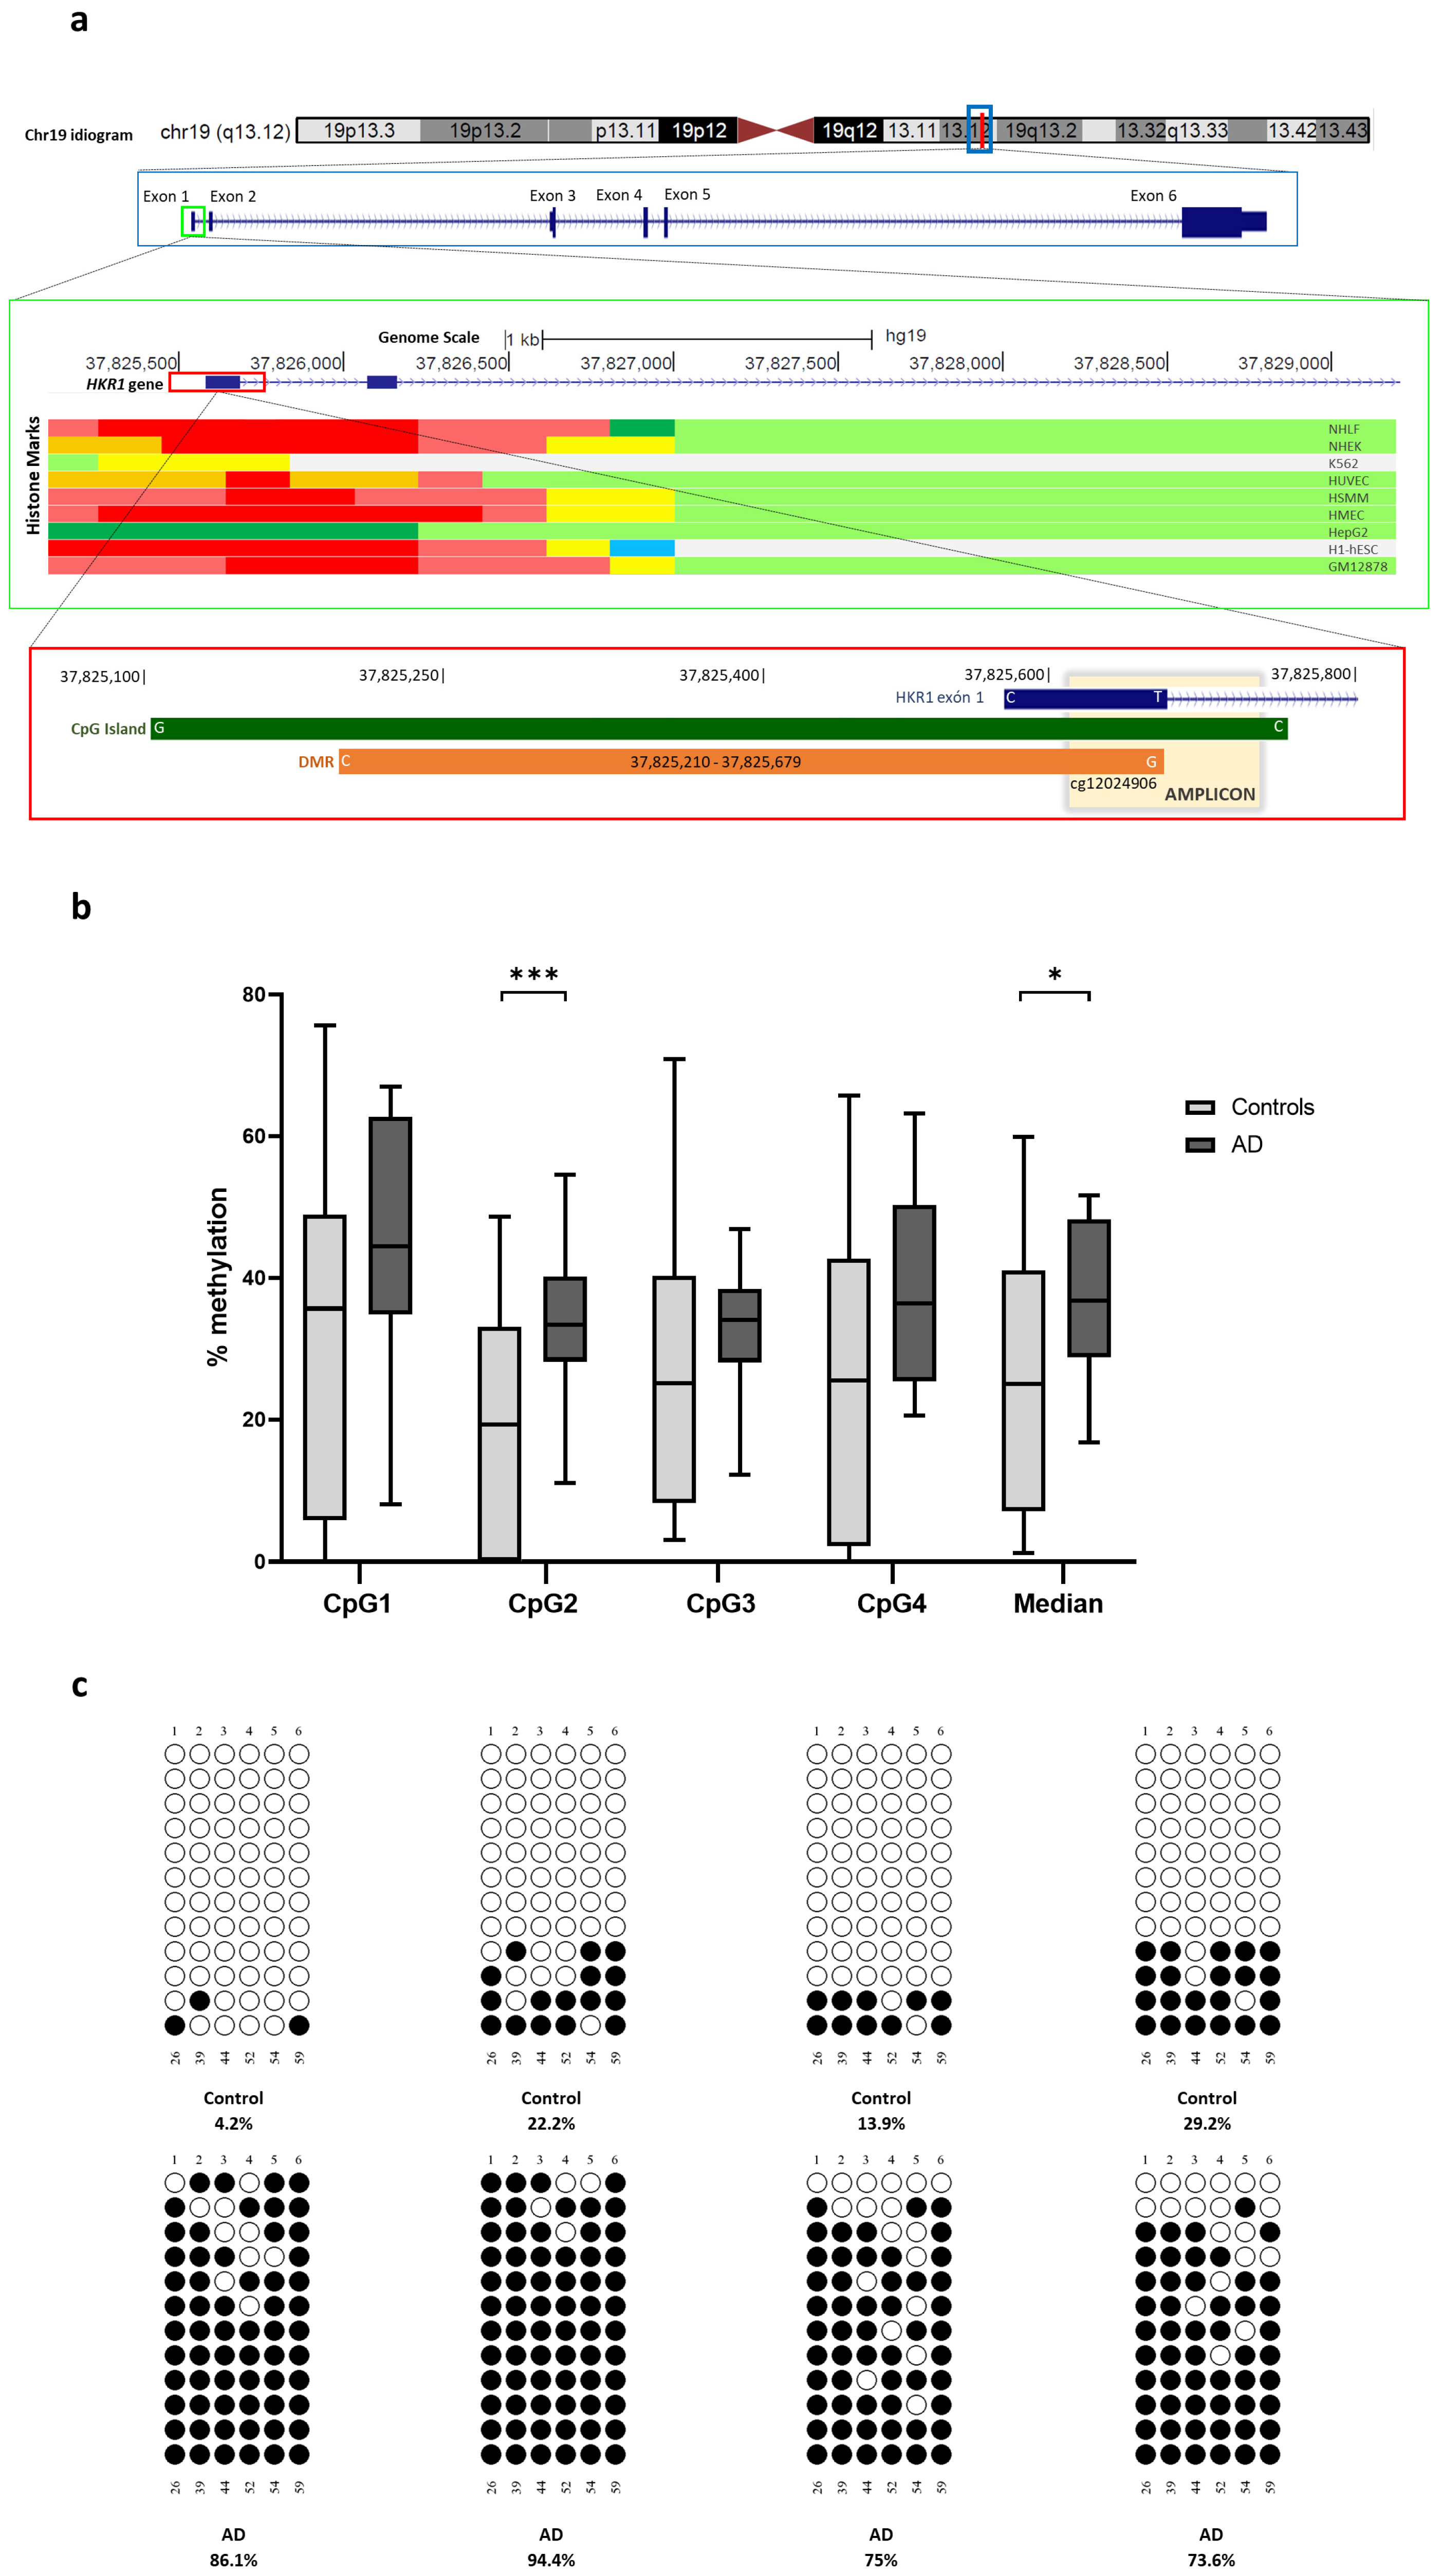
2.8. Differential Methylated Regions

At a regional level, differential analysis revealed one DMR significantly associated with AD status (Sidak corrected p-value < 0.05). This position (chr2:114,737,458–114,737,475) was located in a CpG island and annotated to a lncRNA (LOC100499194).
When stratifying by APOE ε4, we identified 17 DMRs (12% hypermethylated and 88% hypomethylated) comparing AD APOE ε4 carriers and control APOE ε4 non-carriers and 4 hypermethylated DMRs between AD APOE ε4 non-carriers and control APOE ε4 non-carriers (Sidak correction p-value < 0.05) (Table 5 and Table 6). Most interestingly, up to six DMRs were annotated to genes already addressed as differentially methylated in AD condition and mostly in brain tissue (Table 7).

2.9. Orthogonal Validation

A DMR found between AD APOE ε4 non-carriers and control non-carriers annotated to the HKR1 gene (ZNF875, zinc finger protein 875), a gene previously found to be differentially methylated in the hippocampus, was selected for further exploration (Figure 3a). This DMR consists of 469 bp containing 10 CpG dinucleotides. Considering that the expected cfDNA size is around 166 bp and further fragmentation likely occurs during the deamination step of the bisulfite conversion process, special caution was exercised in designing the region to be explored [35]. For primer design, we selected a CpG assayed in the EPIC array (cg12024906) located in the extreme of the DMR. Therefore, we designed primers to achieve amplicons contained in the DMR smaller than the estimated cfDNA size.
For pyrosequencing, we examined a 140 bp region covering four CpG dinucleotides, including cg12024906. We observed that DNA methylations levels at the selected CpG site (CpG2) and the average for the amplicon were significantly increased in patients with AD compared with the controls [30.74 ± 14.57% vs. 18.92 ± 16.41%, p-value < 0.01 and 36.51 ± 11.85% vs. 26.02 ± 19.48%, p-value < 0.05, respectively) (Figure 3b).
For bisulfite cloning sequencing, we analyzed an 86 bp region encompassing six CpG dinucleotides in eight representative samples. We observed that the average DNA methylation levels were strongly higher in patients with AD compared with the controls, both for the amplicon [82.28 ± 9.83% vs. 17.36 ± 10.78%; p-value < 0.001] and the selected CpG site (CpG4) [62.50 ± 17.33% vs. 14.58 ± 14.22%; p-value < 0.001] (Figure 3c).
Overall results of this orthogonal validation are detailed in Supplementary Materials: Table S6.

3. Discussion

The aim of this study was to identify differential methylation signatures in plasma cfDNA as a potential non-invasive source of epigenetic biomarkers for patients with AD. We hereby demonstrate that cfDNA can be efficiently isolated from plasma through liquid biopsy procedures and used to identify methylation differences between patients with AD and cognitively healthy controls. Specific cfDNA methylation differences seem to be APOE ε4 genotype-related. In particular, four DMRs were found in APOE ε4 non-carriers when comparing AD versus control subjects.
Methodologies to analyze cfDNA in biological fluids are greatly technologically demanding in terms of sensitivity, given the low levels of cfDNA (typically around 10 ng/mL). In neurological disorders, this challenge is compounded by the low relative abundance of the expected brain-derived fraction among the background cfDNA [27]. A way to achieve higher starting amounts of cfDNA could be by drawing larger volumes of plasma; however, there should be a plasma volume limitation for this technique to be transferable to neurological clinical practice in the near future, if differences in DNA methylation are intended to be used as biomarkers. Another approach could involve sample pooling techniques to increase the available starting material when using cfDNA, as previously suggested [36]. However, this approach only yields average methylation values. Additionally, cfDNA appears at higher levels in certain pathological conditions, such as cancer, trauma, stroke, autoimmune disorders, or insufficient renal clearance [37]. In this regard, we used as an exclusion criterion, for both controls and patients with AD, the co-existence of another pathological condition that could potentially overestimate plasma AD-related cfDNA concentrations. In our study cohort, we obtained cfDNA from the plasma of all patients with AD and the controls. Nevertheless, we did not find a significant increase in total plasma cfDNA levels in patients with AD compared with the controls in our cohort, which adds evidence in this regard, since previous studies showed conflicting results in terms of these differences [38,39]. This could be explained by the low relative abundance of the expected brain-derived cfDNA within the background cfDNA, making it challenging to detect any increase in the concentration of the brain-derived fraction in the total cfDNA.
A critical aspect for cfDNA analysis involves preanalytical factors, such as the type of collection tube, sample centrifugation protocol, and cfDNA extraction method [40]. Although commercial kit manufacturers usually claim efficient isolation of pure high quality cfDNA, this study highlights the significant impact of non-sized cfDNA carryover [41,42]. Non-sized cfDNA contamination often goes unnoticed when employing common cfDNA quantification methods, such as fluorometric techniques, which cannot distinguish between cfDNA and genomic DNA (gDNA) [42]. Our findings indicate that approximately half of the samples contained non-sized cfDNA carryover. Nevertheless, the presence of non-sized cfDNA did not significantly differ between patients with AD and the controls in our study cohort. Given that non-sized cfDNA was identified as a major source of variability in the surrogate variable analysis, we decided to adjust our statistical models to account for this variable as a latent source of noise.
Several research groups have conducted epigenome-wide studies on cfDNA from patients with AD using various methods, including targeted bisulfite sequencing [43], high throughput sequencing to map 5-hydroxymethylcytosine (5hmC) as another widely used epigenetic marker [44], and even EPIC array technology [45,46]. In recent years, the Illumina Infinium® MethylationEPIC BeadChip array has emerged as a widely used and accessible option. Similar to whole genome bisulfite sequencing (WGBS), this technology utilizes sodium bisulfite DNA conversion, followed by single-base resolution genotyping of specific CpG sites through microarray probes. The EPIC platform stands out for its efficiency, affordability, and consistency with DNA methylation results obtained from other methods [47].
In our cohort, and using this microarray technology, we found no significant DMPs associated with AD condition in cfDNA after applying a FDR < 0.05 correction. This finding aligns with previous epigenome studies performed on cfDNA [44,48]. Other than technical factors and analysis methodologies, bioinformatics filtering thresholds could represent a major source of discordance between assays. A recent paper by Bahado Singh et al. [45] reported significant differences in cfDNA between patients with AD and controls after FDR correction employing EPIC array technology and artificial intelligence algorithms for data analysis. However, in their study, only about 41% of the total probes assayed by the EPIC array passed quality control, whereas in our study, up to 86% of the overall probes were included in the subsequent differential methylation analysis. Another strategy employed by the same group was to focus bioinformatic data analysis on a specific subset of CpGs among all methylation sites across the genome, in this case, the methylation in cytochrome p450 (CYP) genes [46].
However, the analysis identified an interesting set of 102 differential cfDNA methylation marks at a nominal significance level. Among these methylation marks, hypomethylation in AD cases compared with controls was overrepresented. Regarding genomic location, these differential cfDNA methylation marks were predominantly localized in CpG islands and shores, concordant with previous findings in genomic DNA in patients with AD [17]. Moreover, we found strong correlations between the ten top-ranked nominally significant probes in our dataset and main cognitive and functional status indicators (MMSE and GDS), along with mild correlations with AD biomarkers in CSF and blood, such as Aβ42/Aβ40 ratio and pTau181 levels, respectively.
In the functional interpretation of results, IPA provides a comprehensive visualization of how a gene dataset impacts a pathway, presenting it as a network to enhance the understanding of the findings. The most significant upstream regulator identified the SPTBN4 gene, with ANK3 being its main target molecule in our dataset. SPTBN4 encodes for spectrin β non-erythrocytic 4 and, along with ANK3, a member of the ankyrin family, forms part of the axon initial segment [49]. The spectrin/ankyrin complex links the cytoskeleton and voltage gated channels, which are crucial for regulating neuronal polarity and synapsis [50]. Interestingly, Sánchez Mut et al. reported hypermethylation of SPTBN4 in the frontal cortex of human patients with AD [51]. Also remarkable is the presence of APOE ε4 among this gene list, interacting again with ANK3 and with ADGRB1 (adhesion G protein-coupled receptor B1, brain-specific angiogenesis inhibitor, BAI1), which mediates hippocampal spatial learning and memory [52].
To the best of our knowledge, this is the first APOE ε4-stratified study conducted with the Infinium EPIC array on cfDNA obtained from patients with AD. The APOE ε4 genotype is widely recognized as an important risk factor for AD and may affect the progression of the disease, potentially influencing the status of AD-associated DNA methylation marks [21]. Therefore, we decided to further include the APOE ε4 genotype into our linear models to analyze its contribution to the cfDNA methylation differences observed in this study. When stratifying patients with AD and controls based on the presence of the APOE ε4 genotype, we observed a substantial increase in differentially methylated positions by 10%. This finding aligns with previous methylation studies that have demonstrated clear and significant different methylation marks between patients with AD and controls when stratifying by the APOE ε4 genotype [34,53,54]. However, further research is required to clarify the mechanisms that connect DNA methylation with the presence of the ε4 allele.
Nevertheless, the most significant differences were found when exploring results at a regional level, probably because position level differences are often too subtle to be detectable [19]. In this regard, we identified several cfDNA methylation differences in regions associated with genes known to be important in AD. For instance, we found a hypermethylated region in AD APOE ε4 non-carriers annotated to the SLCO2A1 gene (solute carrier organic anion transporter family member 2A1). This gene encodes for prostaglandin transporter, which is reported to be localized in neurons, microglia, and astrocytes, and is poorly expressed in the AD human brain. This transporter has been suggested as a possible modulator of prostaglandin-driven neuroinflammation linked to AD [55]. In addition, we detected a hypomethylated region in AD APOE ε4 carriers spanning the DNMT3B gene, which encodes DNA methyltransferase 3 Β, an enzyme that catalyzes de novo DNA methylation in mammalian cells [56]. It would be interesting to check whether DNMT3B hypomethylation identified in AD APOE ε4 carriers may be related to the higher expression of these DNA methyltransferases with increasing age [57]. This deregulation in DNMT-mediated de novo methylation due to its own methylation state may help to explain the AD epigenetic misbalance [58]. Notably, we identified this DMR when comparing AD APOE ε4 carriers with control APOE ε4 non-carriers. The association between DNMT3B deregulation and the APOE ε4 genotype has been previously addressed, indicating synergistic effects on AD onset [59]. However, studies elsewhere have found no significant correlation between DNMT3B methylation and APOE ε4 status [60]. These findings within our dataset may help to uncover new underlying molecular changes associated with AD pathology.
Liquid biopsy has emerged as a non-invasive tool for reflecting molecular changes occurring in tissues. Interestingly, we observed how some of the AD-related regional changes identified in plasma cfDNA in our study cohort were consistent with changes previously reported in other studies performed on brain samples (Table 7). In particular, several DMRs identified in this study were associated with genes previously reported as differentially methylated in the hippocampus of patients with AD, such as HKR1 and ATG16L2. The HKR1 gene (ZNF875, zinc finger protein 875) gene is a transcriptional regulator, and its methylation levels have been proposed as an aging biomarker [61]. In this study, we observed that HKR1 methylation changes remained significant in patients with AD after adjusting for age, which may indicate underlying age-related epigenetic changes contributing to neurodegeneration in AD [62,63]. Moreover, both HKR1 and ATG16L2 methylation levels were found to correlate significantly with pTau burden in the AD hippocampus [16]. In this respect, we found no correlation between cfDNA methylation levels of these DMRs and tTau/pTau181 and pTau181 as surrogate biomarkers for Tau deposition in CSF and blood, respectively.
Our study adds evidence to using cfDNA to characterize methylation changes in neurological diseases, such as AD. Plasma cfDNA emerges as a novel source of epigenetic biomarker that may help to improve AD diagnosis in the clinical setting. Precision medicine based on liquid biopsy procedures is an innovative approach that merits further research. Validation of these candidate biomarkers in larger and multicentric cohorts will contribute to the design of panels of composite biomarkers from different origins that may significantly improve clinical tools in the dementia field. In this respect, ultra-sensitive technologies such as droplet digital PCR (ddPCR) have great potential for the validation of these candidate biomarkers in plasma cfDNA [64].

Limitations

The primary limitations of our study are those related to the nature of the cfDNA. In this work we have demonstrated that non-sized cfDNA carryover in standard cfDNA isolation protocols can go unnoticed, which should be considered when analyzing results [65]. A possible approach to overcome non-sized cfDNA carryover could be the further use of methods based on capillary electrophoresis to selectively elute DNA according to its base pair length [66]. Future investigations should aim to validate these results across larger diverse independent cohorts to definitively establish both the clinical utility and the reproducibility of our findings.

4. Materials and Methods

4.1. Study Design

We conducted an observational case control study including 70 subjects (35 patients with AD and 35 age- and sex-matched cognitively healthy controls) to identify cfDNA methylation differences between patients with AD and controls by using liquid biopsy procedures.

4.2. Subjects’ Characterization

Patients were prospectively enrolled from the dementia unit at the University Hospital of Navarra (a tertiary hospital) between March 2019 and December 2021. AD was diagnosed following the National Institute on Aging and Alzheimer’s Association (NIA-AA 2018) guidelines [67]. The diagnosis was made by neurologists based on the patient’s medical history, clinical examination, blood tests, neuropsychological assessments, and magnetic resonance imaging (MRI) scans. Cognitive function was evaluated by the Mini-Mental State Examination (MMSE) [68] and the Global Deterioration Scale (GDS) [69]. Healthy controls were recruited from relatives and volunteers matched for age and sex, and with no clinical signs of dementia or other neurodegenerative diseases, as confirmed through clinical interviews and MMSE (score > 27). Given that cfDNA concentrations increase in cancer stages [70], we exclusively enrolled controls and patients with AD who had not experienced any tumor disease within, at least, the last five years. This study was approved by the ethics committee, and all participants provided written informed consent prior to their involvement.
The sample size was calculated to provide 80% statistical power to detect a minimum significant difference of 10% in cfDNA methylation levels between AD cases and controls. It was assumed that both distributions followed a normal pattern with equal variance (σ = 0.15) and that an independent samples t test would be applied at a two-sided significance level of α = 0.05. Based on these parameters, the necessary sample size was determined to be 35 patients with AD and 35 controls, using the epiR library of the R statistical package (v.4.0.2) [71].

4.3. Blood and Cerebrospinal Fluid (CSF) Samples

Peripheral blood samples were obtained from each participant by venipuncture into 10 mL PAXgene® Blood DNA Tubes (QIAGEN, Redwood City, CA, USA), which contained a leukocyte stabilizer to prevent contamination with genomic DNA. The collected samples were centrifuged at 1900× g at room temperature for 15 min within 1 h of collection. Plasma was then transferred to plastic tubes, subjected to a second centrifugation at maximum speed, and stored at −80 °C until further analysis. For additional analysis, pTau181 was measured in additional EDTA plasma samples from both patients with AD and controls, whenever these samples were available. This measurement was performed using the commercially available pTau181 V2 Advantage kit (Quanterix Corp, Billerica, MA, USA), with single molecule array (Simoa) technology at Sant Pau Memory Unit’s laboratory (Barcelona, Spain).
As part of their clinical diagnosis, 21 out of 35 patients with AD underwent lumbar puncture for CSF biomarker testing to further classify their amyloid/tau/neurodegeneration (ATN) profile [67]. CSF samples were collected by lumbar puncture, centrifuged at 2000× g for 10 min at 4 °C within 4 h after collection, and the supernatants were aliquoted into 1.5 mL polypropylene tubes. These aliquots were stored at −80 °C until further use. Aβ42, Aβ40, pTau181, and tTau in CSF were measured using a Lumipulse G600II instrument (Fujirebio, Ghent, Belgium), according to the manufacturer’s instructions.

4.4. cfDNA Isolation and Quantification

cfDNA was isolated from 2 mL plasma by using QIAmp Circulating Nucleic Acid Kit (QIAGEN, Redwood City, CA, USA), following the manufacturer’s protocol. The concentration of double-stranded cfDNA was quantified using a Qubit 2.0 Fluorometer with the Qubit dsDNA HS Assay Kit (Thermo Fisher Scientific, Gilford, NH, USA), as per the manufacturer’s guidelines. The amounts of cfDNA used for the methylation differential analysis array were reported in nanograms (ng).

4.5. Characterization of cfDNA: Fragment Size Analysis

The purity and size distribution of cfDNA fragments were analyzed using the Fragment AnalyzerTM Automated CE with ProSize software v. 3.0 (Agilent, Technologies, Inc., Santa Clara, CA, USA). This analysis was conducted with the DNF 477 HS Small Fragment kit and the DNF 464 High Sensitivity Large Fragment 50 Kb Analysis Kit (Agilent), following the manufacturer’s instructions.

4.6. Genome-Wide cfDNA Methylation Analysis

cfDNA from 70 plasma samples was treated with sodium bisulfite using the Zymo EZ 96 DNA methylation kit (Zymo Research, Irvine, CA, USA), following the manufacturer’s protocol. Since cfDNA is highly fragmented, we treated our sample set with the Illumina Infinium FFPE restoration kit (Illumina, San Diego, CA, USA) prior to methylation analysis to protect the samples during the bisulfite conversion process, as previously described [72].
Subsequently, a methylome analysis was conducted on cfDNA samples using the Illumina Infinium® MethylationEPIC BeadChip microarray (850 K) and the Illumina HiScan System (Illumina). This approach allows for the quantitative detection of methylation levels at over 850,000 CpG sites across the genome, including more than 90% of the sites covered by the Illumina HumanMethylation450 BeadChip (Illumina) and over 300,000 methylation sites in enhancer regions identified by the ENCODE and FANTOM5 projects [47,73].

4.7. Array Data Preprocessing

The EPIC array methylation data were fully preprocessed using the minfi package (v.1.32.0) [74] in the R software environment (v.4.0.2). After importing the IDAT files, methylation data from sex chromosome probes were analyzed to verify the self-reported sex of the participants. Additionally, SNP/ethnicity probes from the sesame package (v.1.4.0) [75] were used to detect potential unwanted sources of variation. Samples that failed to meet the specified quality control criteria for intensity signals in both the methylated and unmethylated channels were excluded.
After completing the quality control steps, background noise signal was removed from the intensity values using the ssNoob method [76] in minfi. The extracted β values were then normalized using the β mixture quantile normalization (BMIQ) approach [77] implemented in ChAMP (v.2.16.2) [78]. Furthermore, to avoid spurious methylation signals, probes were filtered based on the following criteria: (a) having a detection p-value > 0.01 in any sample; (b) being cross-reactive or multi-mapping probes [72,79]; (c) being located on sex chromosomes; and (d) containing SNPs with a minor allele frequency (MAF) ≥ 0.01 at their CpG or single base extension (SBE) sites (dbSNP v.147). Finally, experiment-specific conflicting probes (n = 424) were identified using the clustered distribution approach implemented in the gaphunter function [80] of the minfi package (threshold = 0.20, outCutoff = 5/63) and were removed from subsequent analysis. The final number of probes that passed all filters for differential methylation analyses was 747,200 (Supplementary Materials: Figure S5).

4.8. cfDNA Cell-Type Deconvolution

The Houseman algorithm [81] implemented in the ENmix package (v.1.28.2) [82] and the FlowSorted.Blood. EPIC reference dataset [83] were used to estimate blood cell type composition from DNA methylation data. Moreover, the deconvolution algorithm and the reference atlas of Moss et al. [72] were applied to our methylome array data using Python software (v. 3.8.13) to reveal the tissular and cellular origins of cfDNA.

4.9. Surrogate Variable Analysis

Surrogate variable analysis was performed using the sva package (v.3.36.0) [84] in order to identify the main sources of variation in the high-dimensional data of EPIC array methylation. The surrogate variables identified by the Be method were then correlated with the clinicopathological features of the study participants.

4.10. Probe-Level Differential Methylation Analyses

Differentially methylated positions (DMPs) between patients with AD and controls were identified through the application of linear regression models, defined in the limma package (v.3.44.3) [85]. M-values were selected as the dependent variable in the models, since this logit transformation of methylation β-values achieves greater homoscedasticity for statistical inference [86]. Based on the results of the surrogate variable analysis, all models included the following fixed covariates: sex, age, percentage of non-sized cfDNA, batch effects (array position), and cell-type composition obtained from deconvolution analyses. Finally, empirical Bayes moderated t tests allowed us to perform contrasts to define DMPs, with p-values adjusted for multiple comparisons using the Benjamini–Hochberg method (FDR < 0.05). Differential enrichment of DMPs in relation to their genomic distribution was assessed using hypergeometric tests.

4.11. Region-Level Differential Methylation Analyses

To detect differentially methylated regions (DMRs), the limma p-values were fed in the comb p function [87] of the ENmix package (v.1.28.2) [82] using the default parameters. This method allowed the detection of spatially related CpG sites with statistical significance. The initial regions were first selected under an FDR < 0.05, and subsequently, the final DMRs were defined applying a Sidak corrected p-value threshold of < 0.05.

4.12. Probe Annotation

The IlluminaHumanMethylationEPICanno.ilm10b4.hg19 package (v.0.6.0) was used to assign each probe to its corresponding location within CpG islands (CGIs) and genes. For the annotation of regions, the probes belonging to each region were first individually annotated, as described above. A single annotation was then assigned to each region according to the following criteria:
(1) for CGI status, “Island” > “N_Shore” > “S_Shore” > “N_Shelf” > “S_Shelf” > “OpenSea”; and (2) for gene locations, “TSS1500” > “TSS200” > “5′UTR” > “1stExon” > “Body” > “3′UTR” > “Intergenic”.

4.13. Functional In Silico Analysis of DMPs

We employed ingenuity pathway analysis (IPA) software (v.23.0) from Ingenuity Systems® (QIAGEN, Redwood City, CA, USA) to further explore the biological significance of AD-related DMPs by means of causal analytics algorithms [33]. Using this tool, we were able to identify the biological functions and diseases most significantly related to the differentially methylated genes in our dataset. The p-value was calculated using Fisher’s exact test. Additionally, the upstream regulator analysis was utilized to identify upstream molecules that potentially regulate the differentially methylated genes within our dataset and to construct gene networks. Simultaneously, we conducted a systematic manual annotation using PubMed to determine whether the differentially methylated genes identified in patients with AD were particularly enriched in brain functions, as previously described [16].

4.14. Orthogonal Validation

Furthermore, pyrosequencing and bisulfite cloning sequencing techniques were performed to validate the methylation results obtained from the microarray analysis. Briefly, the EpiTect Bisulfite Kit (QIAGEN, Redwood City, CA, USA) was used to convert 200 ng of extracted cfDNA from each sample with sodium bisulfite according to the manufacturer’s instructions.
For pyrosequencing, primers were designed with PyroMark Assay Design version 2.0.1.15 (QIAGEN, Redwood City, CA, USA), and PCR amplifications were carried out on a VeritiTM Thermal Cycler (Applied Biosystems, Foster City, CA, USA). Next, the biotinylated PCR product was captured with streptavidin-coated Sepharose beads and the sequencing primer was annealed to cfDNA strands. Pyrosequencing was carried out using PyroMark Gold Q96 reagents (QIAGEN) on a PyroMarkTM Q96 ID System (QIAGEN). For each CpG studied within the amplicon (CpG1-CpG4), methylation levels were expressed as the percentage of methylated cytosines relative to the total cytosines. The EpiTect PCR Control DNA Set (QIAGEN) was used as fully methylated and unmethylated DNA controls for the pyrosequencing assay.
For bisulfite cloning sequencing, the MethPrimer tool was used to design primer pair sequences [88]. PCR products were cloned using the TopoTA Cloning System (Invitrogen, Carlsbad, CA, USA), and at least 12 independent clones were sequenced by Sanger sequencing for each individual and region studied. Methylation data and graphs were obtained using QUMA software (v1.1.13) [89]. The primers used for both pyrosequencing and bisulfite cloning sequencing are provided in Supplementary Materials: Table S7.

5. Conclusions

In summary, our study demonstrates that cfDNA is present in the plasma of patients with AD and can be readily isolated during their lifetime. We identified 102 differentially methylated positions (DMPs) associated with AD, with up to 80% showing correlations with cognitive performance and up to 35% with established AD biomarkers. Functional analyses linked 30 DMPs to neurological processes, pinpointing critical regulators such as SPTBN4 and the APOE gene. Additionally, APOE ε4-stratified analysis revealed six differentially methylated regions (DMRs) associated with genes previously implicated in epigenetic alterations in AD, including HKR1, ZNF154, HOXA5, TRIM40, ATG16L2, and ADAMST2. These findings provide valuable insights into the epigenetic landscape of AD and underscore the potential of cfDNA as a biomarker for advancing our understanding of the disease. The availability of blood sampling makes the analysis of epigenetic alterations in cfDNA a promising source of biomarkers in AD to be used in the practice of personalized medicine, with potential applications in identifying biomarkers, guiding targeted therapies, assessing disease risk, and linking environmental and genetic factors to optimize individualized healthcare for patients with AD. Some candidate epigenetic biomarkers seem to be related to the APOE genotype. Exploring the potential of liquid biopsy can enhance our understanding of this complex disorder. Moreover, this study highlights the critical importance of preanalytical factors, bioinformatics workflows, and thresholds when analyzing the cfDNA from an epigenome-wide perspective.

Supplementary Materials

The following supporting information can be downloaded at: https://www.mdpi.com/article/10.3390/ijms26073419/s1.

Author Contributions

Conceptualization, M.M. (Mónica Macías) and M.M. (Maite Mendioroz); formal analysis, J.J.A.-L., B.A., A.F.F. and A.U.-C.; investigation, M.M. (Mónica Macías), B.A., M.R. (Miren Roldan), M.R. (Maitane Robles), E.C.-A. and D.A.; resources, J.S.R.d.G., J.C., C.C. and M.E.E.; writing—original draft preparation, M.M (Mónica Macías) and J.J.A.-L.; writing—review and editing, I.B.-L., A.F.F. D.A., M.F.F. and M.M. (Maite Mendioroz); visualization, J.J.A.-L. and J.Á.-J.; supervision, A.F.F., M.F.F. and M.M. (Maite Mendioroz); project administration, M.M. (Maite Mendioroz); funding acquisition, I.J. and M.M. (Maite Mendioroz). All authors have read and agreed to the published version of the manuscript.

Funding

The authors sincerely appreciate the funding support from the Government of Navarra [GºNa 36/18], and the Spanish Government through grants from the Institute of Health Carlos III (FIS PI20/01701), co-funded by the European Regional Development Fund (ERDF), European Union, A way of shaping Europe. The project leading to these results has received funding from La Caixa Banking Foundation (ID 100010434) and Fundación Luzón (HR20 01109_BIOP ALS) under agreement LCF/PR/PR15/51100006. In addition, M.M. (Mónica Macías) is beneficiary of a Río Hortega grant from the Spanish Government (CM20/00240) and a Navarrabiomed postdoctoral research grant (2022). B.A. (Blanca Acha) is supported by a PFIS fellowship from the Spanish Government (FI18/00150). J.Á.-J. (Johana Álvarez-Jiménez) has received a Doctorandos industriales grant for 2023–2026. A.U.-C. (Amaya Urdánoz-Casado) received a Doctorandos industriales grant for 2018–2020 and a predoctoral research grant (2019) founded by the Department of Industry and Health of the Government of Navarra. D.A. was supported by research grants from the Institute of Health Carlos III (ISCIII), Spain INT19/00016 and INT23/00048. M.M. (Maite Mendioroz) received a Contrato de intensificación grant from the Institute of Health Carlos III (INT19/00029) and a grant (LCF/PR/PR15/51100006) founded by La Caixa Banking Foundation and Caja Navarra Banking Foundation.

Institutional Review Board Statement

This study was conducted in accordance with the Declaration of Helsinki, and approved by the Navarra Ethics Research Committee (2016/106).

Informed Consent Statement

Informed consent was obtained from all subjects involved in the study.

Data Availability Statement

All data generated and/or analyzed during this study are either included in this article or are available from the corresponding author on reasonable request.

Acknowledgments

We would like to thank all the subjects who participated in this study for their generous contribution. We would also like to thank Alba Leiza Dávila for English language editing.

Conflicts of Interest

D.A. participated in advisory boards from Fujirebio-Europe, Roche Diagnostics, Grifols S.A., and Lilly, and received speaker honoraria from Fujirebio-Europe, Roche Diagnostics, Nutricia, Krka Farmacéutica S.L., Zambon S.A.U., and Esteve Pharmaceuticals S.A. D.A. declares a filed patent application (WO2019175379 A1 markers of synaptopathy in neurodegenerative disease). The funders had no role in the design of this study; in the collection, analyses, or interpretation of data; in the writing of the manuscript; or in the decision to publish the results.

Abbreviations

The following abbreviations are used in this manuscript:
ADAlzheimer’s disease
APOEApolipoprotein E
cfDNACell-free DNA
CpGCytosine guanine dinucleotide
CSFCerebrospinal fluid
DMPDifferential methylated position
DMRDifferential methylated region
GDSGlobal Deterioration Scale
LOADLate-onset Alzheimer’s disease
MMSEMini-Mental State Examination

References

  1. 2024 Alzheimer’s disease facts and figures. Alzheimers Dement. 2024, 20, 3708–3821. [CrossRef] [PubMed]
  2. Alzheimers Disease International. World Alzheimer Report 2018. 2018. Available online: https://www.alz.co.uk/research/WorldAlzheimerReport2018.pdf (accessed on 2 April 2025).
  3. Alzheimers Disease International. World Alzheimer Report 2021. 2021. Available online: https://www.alzint.org/u/World-Alzheimer-Report-2021.pdf (accessed on 2 April 2025).
  4. Lambert, J.C.; Ibrahim-Verbaas, C.A.; Harold, D.; Naj, A.C.; Sims, R.; Bellenguez, C.; DeStafano, A.L.; Bis, J.C.; Beecham, G.W.; Grenier-Boley, B.; et al. Meta-analysis of 74,046 individuals identifies 11 new susceptibility loci for Alzheimer’s disease. Nat. Genet. 2013, 45, 1452–1458. [Google Scholar] [CrossRef] [PubMed]
  5. Sanchez-Mut, J.V.; Gräff, J. Epigenetic Alterations in Alzheimer’s Disease. Front. Behav. Neurosci. 2015, 9, 347. [Google Scholar] [CrossRef]
  6. Zhang, L.; Silva, T.C.; Young, J.I.; Gomez, L.; Schmidt, M.A.; Hamilton-Nelson, K.L.; Kunkle, B.W.; Chen, X.; Martin, E.R.; Wang, L. Epigenome-wide meta-analysis of DNA methylation differences in prefrontal cortex implicates the immune processes in Alzheimer’s disease. Nat. Commun. 2020, 11, 6114. [Google Scholar] [CrossRef]
  7. Zhang, L.; Young, J.I.; Gomez, L.; Silva, T.C.; Schmidt, M.A.; Cai, J.; Chen, X.; Martin, E.R.; Wang, L. Sex-specific DNA methylation differences in Alzheimer’s disease pathology. Acta Neuropathol. Commun. 2021, 9, 77. [Google Scholar] [CrossRef]
  8. De Jager, P.L.; Srivastava, G.; Lunnon, K.; Burgess, J.; Schalkwyk, L.C.; Yu, L.; Eaton, M.L.; Keenan, B.T.; Ernst, J.; McCabe, C.; et al. Alzheimer’s disease: Early alterations in brain DNA methylation at ANK1, BIN1, RHBDF2 and other loci. Nat. Neurosci. 2014, 17, 1156–1163. [Google Scholar] [CrossRef]
  9. Lunnon, K.; Smith, R.; Hannon, E.; De Jager, P.L.; Srivastava, G.; Volta, M.; Troakes, C.; Al-Sarraj, S.; Burrage, J.; Macdonald, R.; et al. Methylomic profiling implicates cortical deregulation of ANK1 in Alzheimer’s disease. Nat. Neurosci. 2014, 17, 1164–1170. [Google Scholar] [CrossRef]
  10. Gasparoni, G.; Bultmann, S.; Lutsik, P.; Kraus, T.F.J.; Sordon, S.; Vlcek, J.; Dietinger, V.; Steinmaurer, M.; Haider, M.; Mulholland, C.B.; et al. DNA methylation analysis on purified neurons and glia dissects age and Alzheimer’s disease-specific changes in the human cortex. Epigenetics Chromatin 2018, 11, 41. [Google Scholar] [CrossRef]
  11. Smith, R.G.; Pishva, E.; Shireby, G.; Smith, A.R.; Roubroeks, J.A.Y.; Hannon, E.; Wheildon, G.; Mastroeni, D.; Gasparoni, G.; Riemenschneider, M.; et al. A meta-analysis of epigenome-wide association studies in Alzheimer’s disease highlights novel differentially methylated loci across cortex. Nat. Commun. 2021, 12, 3517. [Google Scholar] [CrossRef]
  12. Sanchez-Mut, J.V.; Heyn, H.; Vidal, E.; Delgado-Morales, R.; Moran, S.; Sayols, S.; Sandoval, J.; Ferrer, I.; Esteller, M.; Gräff, J. Whole genome grey and white matter DNA methylation profiles in dorsolateral prefrontal cortex. Synapse 2017, 71, e21959. [Google Scholar] [CrossRef]
  13. Smith, R.G.; Hannon, E.; De Jager, P.L.; Chibnik, L.; Lott, S.J.; Condliffe, D.; Smith, A.R.; Haroutunian, V.; Troakes, C.; Al-Sarraj, S.; et al. Elevated DNA methylation across a 48-kb region spanning the HOXA gene cluster is associated with Alzheimer’s disease neuropathology. Alzheimers Dement. 2018, 14, 1580–1588. [Google Scholar] [CrossRef] [PubMed]
  14. Semick, S.A.; Bharadwaj, R.A.; Collado-Torres, L.; Tao, R.; Shin, J.H.; Deep-Soboslay, A.; Weiss, J.R.; Weinberger, D.R.; Hyde, T.M.; Kleinman, J.E.; et al. Integrated DNA methylation and gene expression profiling across multiple brain regions implicate novel genes in Alzheimer’s disease. Acta Neuropathol. 2019, 137, 557–569. [Google Scholar] [CrossRef] [PubMed]
  15. Rao, J.S.; Keleshian, V.L.; Klein, S.; Rapoport, S.I. Epigenetic modifications in frontal cortex from Alzheimer’s disease and bipolar disorder patients. Transl. Psychiatry 2012, 2, e132. [Google Scholar] [CrossRef] [PubMed]
  16. Altuna, M.; Urdanoz-Casado, A.; Sanchez-Ruiz de Gordoa, J.; Zelaya, M.V.; Labarga, A.; Lepesant, J.M.J.; Roldan, M.; Blanco-Luquin, I.; Perdones, A.; Larumbe, R.; et al. DNA methylation signature of human hippocampus in Alzheimer’s disease is linked to neurogenesis. Clin. Epigenetics 2019, 11, 91. [Google Scholar] [CrossRef]
  17. Li, Q.S.; Sun, Y.; Wang, T. Epigenome-wide association study of Alzheimer’s disease replicates 22 differentially methylated positions and 30 differentially methylated regions. Clin. Epigenetics 2020, 12, 149. [Google Scholar] [CrossRef]
  18. Watson, C.T.; Roussos, P.; Garg, P.; Ho, D.J.; Azam, N.; Katsel, P.L.; Haroutunian, V.; Sharp, A.J. Genome-wide DNA methylation profiling in the superior temporal gyrus reveals epigenetic signatures associated with Alzheimer’s disease. Genome Med. 2016, 8, 5. [Google Scholar] [CrossRef]
  19. Perez, R.F.; Alba-Linares, J.J.; Tejedor, J.R.; Fernandez, A.F.; Calero, M.; Roman-Dominguez, A.; Borras, C.; Vina, J.; Avila, J.; Medina, M.; et al. Blood DNA Methylation Patterns in Older Adults With Evolving Dementia. J. Gerontol. A Biol. Sci. Med. Sci. 2022, 77, 1743–1749. [Google Scholar] [CrossRef]
  20. Lardenoije, R.; Roubroeks, J.A.Y.; Pishva, E.; Leber, M.; Wagner, H.; Iatrou, A.; Smith, A.R.; Smith, R.G.; Eijssen, L.M.T.; Kleineidam, L.; et al. Alzheimer’s disease-associated (hydroxy)methylomic changes in the brain and blood. Clin. Epigenetics 2019, 11, 164. [Google Scholar] [CrossRef]
  21. Konki, M.; Malonzo, M.; Karlsson, I.K.; Lindgren, N.; Ghimire, B.; Smolander, J.; Scheinin, N.M.; Ollikainen, M.; Laiho, A.; Elo, L.L.; et al. Peripheral blood DNA methylation differences in twin pairs discordant for Alzheimer’s disease. Clin. Epigenetics 2019, 11, 130. [Google Scholar] [CrossRef]
  22. Chang, L.; Wang, Y.; Ji, H.; Dai, D.; Xu, X.; Jiang, D.; Hong, Q.; Ye, H.; Zhang, X.; Zhou, X.; et al. Elevation of peripheral BDNF promoter methylation links to the risk of Alzheimer’s disease. PLoS ONE 2014, 9, e110773. [Google Scholar] [CrossRef]
  23. Macías, M.; Alegre, E.; Díaz-Lagares, A.; Patiño, A.; Pérez-Gracia, J.L.; Sanmamed, M.; López-López, R.; Varo, N.; González, A. Liquid Biopsy: From Basic Research to Clinical Practice. Adv. Clin. Chem. 2018, 83, 73–119. [Google Scholar] [CrossRef] [PubMed]
  24. Sun, K.; Jiang, P.; Chan, K.C.; Wong, J.; Cheng, Y.K.; Liang, R.H.; Chan, W.K.; Ma, E.S.; Chan, S.L.; Cheng, S.H.; et al. Plasma DNA tissue mapping by genome-wide methylation sequencing for noninvasive prenatal, cancer, and transplantation assessments. Proc. Natl. Acad. Sci. USA 2015, 112, E5503–E5512. [Google Scholar] [CrossRef] [PubMed]
  25. Lehmann-Werman, R.; Neiman, D.; Zemmour, H.; Moss, J.; Magenheim, J.; Vaknin-Dembinsky, A.; Rubertsson, S.; Nellgård, B.; Blennow, K.; Zetterberg, H.; et al. Identification of tissue-specific cell death using methylation patterns of circulating DNA. Proc. Natl. Acad. Sci. USA 2016, 113, E1826–E1834. [Google Scholar] [CrossRef]
  26. Gaitsch, H.; Franklin, R.J.M.; Reich, D.S. Cell-free DNA-based liquid biopsies in neurology. Brain 2022, 146, 1758–1774. [Google Scholar] [CrossRef]
  27. Southwood, D.; Singh, S.; Chatterton, Z. Brain-derived cell-free DNA. Neural Regen. Res. 2022, 17, 2213–2214. [Google Scholar] [CrossRef]
  28. Khemka, S.; Sehar, U.; Manna, P.R.; Kshirsagar, S.; Reddy, P.H. Cell-Free DNA As Peripheral Biomarker of Alzheimer’s Disease. Aging Dis. 2024, 16, 787–803. [Google Scholar] [CrossRef]
  29. Pollard, C.; Aston, K.; Emery, B.R.; Hill, J.; Jenkins, T. Detection of neuron-derived cfDNA in blood plasma: A new diagnostic approach for neurodegenerative conditions. Front. Neurol. 2023, 14, 1272960. [Google Scholar] [CrossRef]
  30. Noe, C.R.; Noe-Letschnig, M.; Handschuh, P.; Noe, C.A.; Lanzenberger, R. Dysfunction of the Blood-Brain Barrier-A Key Step in Neurodegeneration and Dementia. Front. Aging Neurosci. 2020, 12, 185. [Google Scholar] [CrossRef]
  31. Zenaro, E.; Piacentino, G.; Constantin, G. The blood-brain barrier in Alzheimer’s disease. Neurobiol. Dis. 2017, 107, 41–56. [Google Scholar] [CrossRef]
  32. Costa-Pinheiro, P.; Montezuma, D.; Henrique, R.; Jerónimo, C. Diagnostic and prognostic epigenetic biomarkers in cancer. Epigenomics 2015, 7, 1003–1015. [Google Scholar] [CrossRef]
  33. Krämer, A.; Green, J.; Pollard, J., Jr.; Tugendreich, S. Causal analysis approaches in Ingenuity Pathway Analysis. Bioinformatics 2014, 30, 523–530. [Google Scholar] [CrossRef] [PubMed]
  34. Walker, R.M.; Vaher, K.; Bermingham, M.L.; Morris, S.W.; Bretherick, A.D.; Zeng, Y.; Rawlik, K.; Amador, C.; Campbell, A.; Haley, C.S.; et al. Identification of epigenome-wide DNA methylation differences between carriers of APOE epsilon4 and APOE epsilon2 alleles. Genome Med. 2021, 13, 1. [Google Scholar] [CrossRef]
  35. Darst, R.P.; Pardo, C.E.; Ai, L.; Brown, K.D.; Kladde, M.P. Bisulfite sequencing of DNA. Curr. Protoc. Mol. Biol. 2010, 91, 7.9.1–7.9.17. [Google Scholar] [CrossRef]
  36. Gallardo-Gomez, M.; Moran, S.; Paez de la Cadena, M.; Martinez-Zorzano, V.S.; Rodriguez-Berrocal, F.J.; Rodriguez-Girondo, M.; Esteller, M.; Cubiella, J.; Bujanda, L.; Castells, A.; et al. A new approach to epigenome-wide discovery of non-invasive methylation biomarkers for colorectal cancer screening in circulating cell-free DNA using pooled samples. Clin. Epigenetics 2018, 10, 53. [Google Scholar] [CrossRef] [PubMed]
  37. Siravegna, G.; Marsoni, S.; Siena, S.; Bardelli, A. Integrating liquid biopsies into the management of cancer. Nat. Rev. Clin. Oncol. 2017, 14, 531–548. [Google Scholar] [CrossRef]
  38. Pai, M.C.; Kuo, Y.M.; Wang, I.F.; Chiang, P.M.; Tsai, K.J. The Role of Methylated Circulating Nucleic Acids as a Potential Biomarker in Alzheimer’s Disease. Mol. Neurobiol. 2019, 56, 2440–2449. [Google Scholar] [CrossRef]
  39. Mendioroz, M.; Martínez-Merino, L.; Blanco-Luquin, I.; Urdánoz, A.; Roldán, M.; Jericó, I. Liquid biopsy: A new source of candidate biomarkers in amyotrophic lateral sclerosis. Ann. Clin. Transl. Neurol. 2018, 5, 763–768. [Google Scholar] [CrossRef]
  40. Bronkhorst, A.J.; Aucamp, J.; Pretorius, P.J. Cell-free DNA: Preanalytical variables. Clin. Chim. Acta 2015, 450, 243–253. [Google Scholar] [CrossRef]
  41. Kresse, S.H.; Brandt-Winge, S.; Pharo, H.; Flatin, B.T.B.; Jeanmougin, M.; Vedeld, H.M.; Lind, G.E. Evaluation of commercial kits for isolation and bisulfite conversion of circulating cell-free tumor DNA from blood. Clin. Epigenetics 2023, 15, 151. [Google Scholar] [CrossRef]
  42. Alcaide, M.; Cheung, M.; Hillman, J.; Rassekh, S.R.; Deyell, R.J.; Batist, G.; Karsan, A.; Wyatt, A.W.; Johnson, N.; Scott, D.W.; et al. Evaluating the quantity, quality and size distribution of cell-free DNA by multiplex droplet digital PCR. Sci. Rep. 2020, 10, 12564. [Google Scholar] [CrossRef]
  43. Guemri, J.; Pierre-Jean, M.; Brohard, S.; Oussada, N.; Horgues, C.; Bonnet, E.; Mauger, F.; Deleuze, J.F. Methylated ccfDNA from plasma biomarkers of Alzheimer’s disease using targeted bisulfite sequencing. Epigenomics 2022, 14, 451–468. [Google Scholar] [CrossRef] [PubMed]
  44. Chen, L.; Shen, Q.; Xu, S.; Yu, H.; Pei, S.; Zhang, Y.; He, X.; Wang, Q.; Li, D. 5-Hydroxymethylcytosine Signatures in Circulating Cell-Free DNA as Diagnostic Biomarkers for Late-Onset Alzheimer’s Disease. J. Alzheimers Dis. 2022, 85, 573–585. [Google Scholar] [CrossRef] [PubMed]
  45. Bahado-Singh, R.O.; Radhakrishna, U.; Gordevicius, J.; Aydas, B.; Yilmaz, A.; Jafar, F.; Imam, K.; Maddens, M.; Challapalli, K.; Metpally, R.P.; et al. Artificial Intelligence and Circulating Cell-Free DNA Methylation Profiling: Mechanism and Detection of Alzheimer’s Disease. Cells 2022, 11, 1744. [Google Scholar] [CrossRef] [PubMed]
  46. Bahado-Singh, R.O.; Vishweswaraiah, S.; Turkoglu, O.; Graham, S.F.; Radhakrishna, U. Alzheimer’s Precision Neurology: Epigenetics of Cytochrome P450 Genes in Circulating Cell-Free DNA for Disease Prediction and Mechanism. Int. J. Mol. Sci. 2023, 24, 2876. [Google Scholar] [CrossRef]
  47. Pidsley, R.; Zotenko, E.; Peters, T.J.; Lawrence, M.G.; Risbridger, G.P.; Molloy, P.; Van Djik, S.; Muhlhausler, B.; Stirzaker, C.; Clark, S.J. Critical evaluation of the Illumina MethylationEPIC BeadChip microarray for whole-genome DNA methylation profiling. Genome Biol. 2016, 17, 208. [Google Scholar] [CrossRef]
  48. Konki, M.; Lindgren, N.; Kylaniemi, M.; Venho, R.; Laajala, E.; Ghimire, B.; Lahesmaa, R.; Kaprio, J.; Rinne, J.O.; Lund, R.J. Plasma cell-free DNA methylation marks for episodic memory impairment: A pilot twin study. Sci. Rep. 2020, 10, 14192. [Google Scholar] [CrossRef]
  49. Huang, C.Y.; Rasband, M.N. Axon initial segments: Structure, function, and disease. Ann. N. Y. Acad. Sci. 2018, 1420, 46–61. [Google Scholar] [CrossRef]
  50. Grubb, M.S.; Burrone, J. Building and maintaining the axon initial segment. Curr. Opin. Neurobiol. 2010, 20, 481–488. [Google Scholar] [CrossRef]
  51. Sanchez-Mut, J.V.; Aso, E.; Panayotis, N.; Lott, I.; Dierssen, M.; Rabano, A.; Urdinguio, R.G.; Fernandez, A.F.; Astudillo, A.; Martin-Subero, J.I.; et al. DNA methylation map of mouse and human brain identifies target genes in Alzheimer’s disease. Brain 2013, 136, 3018–3027. [Google Scholar] [CrossRef]
  52. Zhu, D.; Li, C.; Swanson, A.M.; Villalba, R.M.; Guo, J.; Zhang, Z.; Matheny, S.; Murakami, T.; Stephenson, J.R.; Daniel, S.; et al. BAI1 regulates spatial learning and synaptic plasticity in the hippocampus. J. Clin. Investig. 2015, 125, 1497–1508. [Google Scholar] [CrossRef]
  53. Foraker, J.; Millard, S.P.; Leong, L.; Thomson, Z.; Chen, S.; Keene, C.D.; Bekris, L.M.; Yu, C.E. The APOE Gene is Differentially Methylated in Alzheimer’s Disease. J. Alzheimers Dis. 2015, 48, 745–755. [Google Scholar] [CrossRef] [PubMed]
  54. Panitch, R.; Sahelijo, N.; Hu, J.; Nho, K.; Bennett, D.A.; Lunetta, K.L.; Au, R.; Stein, T.D.; Farrer, L.A.; Jun, G.R. APOE genotype-specific methylation patterns are linked to Alzheimer disease pathology and estrogen response. Transl. Psychiatry 2024, 14, 129. [Google Scholar] [CrossRef] [PubMed]
  55. Choi, K.; Zhuang, H.; Crain, B.; Doré, S. Expression and localization of prostaglandin transporter in Alzheimer disease brains and age-matched controls. J. Neuroimmunol. 2008, 195, 81–87. [Google Scholar] [CrossRef]
  56. Gagliardi, M.; Strazzullo, M.; Matarazzo, M.R. DNMT3B Functions: Novel Insights From Human Disease. Front. Cell Dev. Biol. 2018, 6, 140. [Google Scholar] [CrossRef]
  57. Rajendran, G.; Shanmuganandam, K.; Bendre, A.; Muzumdar, D.; Goel, A.; Shiras, A. Epigenetic regulation of DNA methyltransferases: DNMT1 and DNMT3B in gliomas. J. Neurooncol. 2011, 104, 483–494. [Google Scholar] [CrossRef]
  58. Wang, K.; Liu, H.; Hu, Q.; Wang, L.; Liu, J.; Zheng, Z.; Zhang, W.; Ren, J.; Zhu, F.; Liu, G.H. Epigenetic regulation of aging: Implications for interventions of aging and diseases. Signal Transduct. Target. Ther. 2022, 7, 374. [Google Scholar] [CrossRef]
  59. de Bem, C.M.; Pezzi, J.C.; Borba, E.M.; Chaves, M.L.; de Andrade, F.M.; Fiegenbaum, M.; Camozzato, A. The synergistic risk effect of apolipoprotein epsilon4 and DNA (cytosine-5-)-methyltransferase 3 beta (DNMT3B) haplotype for Alzheimer’s disease. Mol. Biol. Rep. 2016, 43, 653–658. [Google Scholar] [CrossRef]
  60. Tannorella, P.; Stoccoro, A.; Tognoni, G.; Petrozzi, L.; Salluzzo, M.G.; Ragalmuto, A.; Siciliano, G.; Haslberger, A.; Bosco, P.; Bonuccelli, U.; et al. Methylation analysis of multiple genes in blood DNA of Alzheimer’s disease and healthy individuals. Neurosci. Lett. 2015, 600, 143–147. [Google Scholar] [CrossRef]
  61. Zeng, Q.; Chen, X.; Ning, C.; Zhu, Q.; Yao, Y.; Zhao, Y.; Luan, F. Methylation of the genes ROD1, NLRC5, and HKR1 is associated with aging in Hainan centenarians. BMC Med. Genom. 2018, 11, 7. [Google Scholar] [CrossRef]
  62. Berson, A.; Nativio, R.; Berger, S.L.; Bonini, N.M. Epigenetic Regulation in Neurodegenerative Diseases. Trends Neurosci. 2018, 41, 587–598. [Google Scholar] [CrossRef]
  63. Lardenoije, R.; Iatrou, A.; Kenis, G.; Kompotis, K.; Steinbusch, H.W.; Mastroeni, D.; Coleman, P.; Lemere, C.A.; Hof, P.R.; van den Hove, D.L.; et al. The epigenetics of aging and neurodegeneration. Prog. Neurobiol. 2015, 131, 21–64. [Google Scholar] [CrossRef] [PubMed]
  64. Olmedillas-López, S.; Olivera-Salazar, R.; García-Arranz, M.; García-Olmo, D. Current and Emerging Applications of Droplet Digital PCR in Oncology: An Updated Review. Mol. Diagn. Ther. 2022, 26, 61–87. [Google Scholar] [CrossRef] [PubMed]
  65. Nidadavolu, L.S.; Feger, D.; Wu, Y.; Grodstein, F.; Gross, A.L.; Bennett, D.A.; Walston, J.D.; Oh, E.S.; Abadir, P.M. Circulating Cell-Free Genomic DNA Is Associated with an Increased Risk of Dementia and with Change in Cognitive and Physical Function. J. Alzheimers Dis. 2022, 89, 1233–1240. [Google Scholar] [CrossRef] [PubMed]
  66. Wenz, H.M.; Dailey, D.; Johnson, M.D. Development of a high-throughput capillary electrophoresis protocol for DNA fragment analysis. Methods Mol. Biol. 2001, 163, 3–17. [Google Scholar] [CrossRef]
  67. Jack, C.R., Jr.; Bennett, D.A.; Blennow, K.; Carrillo, M.C.; Dunn, B.; Haeberlein, S.B.; Holtzman, D.M.; Jagust, W.; Jessen, F.; Karlawish, J.; et al. NIA-AA Research Framework: Toward a biological definition of Alzheimer’s disease. Alzheimers Dement. 2018, 14, 535–562. [Google Scholar] [CrossRef]
  68. Folstein, M.F.; Folstein, S.E.; McHugh, P.R. “Mini-mental state”. A practical method for grading the cognitive state of patients for the clinician. J. Psychiatr. Res. 1975, 12, 189–198. [Google Scholar] [CrossRef]
  69. Reisberg, B.; Ferris, S.H.; de Leon, M.J.; Crook, T. The Global Deterioration Scale for assessment of primary degenerative dementia. Am. J. Psychiatry 1982, 139, 1136–1139. [Google Scholar] [CrossRef]
  70. Leon, S.A.; Shapiro, B.; Sklaroff, D.M.; Yaros, M.J. Free DNA in the serum of cancer patients and the effect of therapy. Cancer Res. 1977, 37, 646–650. [Google Scholar]
  71. Stevenson, M.; Nunes, T.; Sanchez, J.; Thornton, R.; Reiczigel, J.; Robison-Cox, J.; Sebastiani, P. EpiR: An R Package for the Analysis of Epidemiological Data. 2013. Available online: https://www.researchgate.net/publication/303185003_EpiR_An_R_package_for_the_analysis_of_epidemiological_data (accessed on 2 April 2025).
  72. Moss, J.; Magenheim, J.; Neiman, D.; Zemmour, H.; Loyfer, N.; Korach, A.; Samet, Y.; Maoz, M.; Druid, H.; Arner, P.; et al. Comprehensive human cell-type methylation atlas reveals origins of circulating cell-free DNA in health and disease. Nat. Commun. 2018, 9, 5068. [Google Scholar] [CrossRef]
  73. Zhou, W.; Laird, P.W.; Shen, H. Comprehensive characterization, annotation and innovative use of Infinium DNA methylation BeadChip probes. Nucleic Acids Res. 2017, 45, e22. [Google Scholar] [CrossRef]
  74. Aryee, M.J.; Jaffe, A.E.; Corrada-Bravo, H.; Ladd-Acosta, C.; Feinberg, A.P.; Hansen, K.D.; Irizarry, R.A. Minfi: A flexible and comprehensive Bioconductor package for the analysis of Infinium DNA methylation microarrays. Bioinformatics 2014, 30, 1363–1369. [Google Scholar] [CrossRef] [PubMed]
  75. Zhou, W.; Triche, T.J., Jr.; Laird, P.W.; Shen, H. SeSAMe: Reducing artifactual detection of DNA methylation by Infinium BeadChips in genomic deletions. Nucleic Acids Res. 2018, 46, e123. [Google Scholar] [CrossRef] [PubMed]
  76. Triche, T.J., Jr.; Weisenberger, D.J.; Van Den Berg, D.; Laird, P.W.; Siegmund, K.D. Low-level processing of Illumina Infinium DNA Methylation BeadArrays. Nucleic Acids Res. 2013, 41, e90. [Google Scholar] [CrossRef]
  77. Teschendorff, A.E.; Marabita, F.; Lechner, M.; Bartlett, T.; Tegner, J.; Gomez-Cabrero, D.; Beck, S. A beta-mixture quantile normalization method for correcting probe design bias in Illumina Infinium 450 k DNA methylation data. Bioinformatics 2013, 29, 189–196. [Google Scholar] [CrossRef]
  78. Tian, Y.; Morris, T.J.; Webster, A.P.; Yang, Z.; Beck, S.; Feber, A.; Teschendorff, A.E. ChAMP: Updated methylation analysis pipeline for Illumina BeadChips. Bioinformatics 2017, 33, 3982–3984. [Google Scholar] [CrossRef]
  79. Chen, Y.A.; Lemire, M.; Choufani, S.; Butcher, D.T.; Grafodatskaya, D.; Zanke, B.W.; Gallinger, S.; Hudson, T.J.; Weksberg, R. Discovery of cross-reactive probes and polymorphic CpGs in the Illumina Infinium HumanMethylation450 microarray. Epigenetics 2013, 8, 203–209. [Google Scholar] [CrossRef]
  80. Andrews, S.V.; Ladd-Acosta, C.; Feinberg, A.P.; Hansen, K.D.; Fallin, M.D. “Gap hunting” to characterize clustered probe signals in Illumina methylation array data. Epigenetics Chromatin 2016, 9, 56. [Google Scholar] [CrossRef]
  81. Houseman, E.A.; Accomando, W.P.; Koestler, D.C.; Christensen, B.C.; Marsit, C.J.; Nelson, H.H.; Wiencke, J.K.; Kelsey, K.T. DNA methylation arrays as surrogate measures of cell mixture distribution. BMC Bioinform. 2012, 13, 86. [Google Scholar] [CrossRef]
  82. Xu, Z.; Niu, L.; Li, L.; Taylor, J.A. ENmix: A novel background correction method for Illumina HumanMethylation450 BeadChip. Nucleic Acids Res. 2016, 44, e20. [Google Scholar] [CrossRef]
  83. Salas, L.A.; Koestler, D.C.; Butler, R.A.; Hansen, H.M.; Wiencke, J.K.; Kelsey, K.T.; Christensen, B.C. An optimized library for reference-based deconvolution of whole-blood biospecimens assayed using the Illumina HumanMethylationEPIC BeadArray. Genome Biol. 2018, 19, 64. [Google Scholar] [CrossRef]
  84. Leek, J.T.; Johnson, W.E.; Parker, H.S.; Jaffe, A.E.; Storey, J.D. The sva package for removing batch effects and other unwanted variation in high-throughput experiments. Bioinformatics 2012, 28, 882–883. [Google Scholar] [CrossRef] [PubMed]
  85. Ritchie, M.E.; Phipson, B.; Wu, D.; Hu, Y.; Law, C.W.; Shi, W.; Smyth, G.K. limma powers differential expression analyses for RNA-sequencing and microarray studies. Nucleic Acids Res. 2015, 43, e47. [Google Scholar] [CrossRef] [PubMed]
  86. Du, P.; Zhang, X.; Huang, C.-C.; Jafari, N.; Kibbe, W.A.; Hou, L.; Lin, S.M. Comparison of Beta-value and M-value methods for quantifying methylation levels by microarray analysis. BMC Bioinform. 2010, 11, 587. [Google Scholar] [CrossRef] [PubMed]
  87. Pedersen, B.S.; Schwartz, D.A.; Yang, I.V.; Kechris, K.J. Comb-p: Software for combining, analyzing, grouping and correcting spatially correlated P-values. Bioinformatics 2012, 28, 2986–2988. [Google Scholar] [CrossRef]
  88. Li, L.C.; Dahiya, R. MethPrimer: Designing primers for methylation PCRs. Bioinformatics 2002, 18, 1427–1431. [Google Scholar] [CrossRef]
  89. Kumaki, Y.; Oda, M.; Okano, M. QUMA: Quantification tool for methylation analysis. Nucleic Acids Res. 2008, 36, W170–W175. [Google Scholar] [CrossRef]
Figure 1. Gene structure distribution of DMPs between patients with Alzheimer’s disease (AD) and controls. The bar chart shows results for the log2 ratios of observed (fraction of differentially methylated probes overlapping a given region) to expected (fraction of probes selected for analysis overlapping a given region) for a genomic region. Dark green boxes represent a significant enrichment (p-value < 0.05) for a particular feature. TSS = number of nucleotides upstream and downstream of the transcription start site.
Ijms 26 03419 g001
Figure 2. APP gene plays a central role in the principal network evolving our AD-related DMPs. The graph shows how amyloid precursor protein-encoding gene (APP) acts as a core regulator of 12 genes found in our dataset (IPA score = 23). Red and green coloring indicate increased/decreased measurement in our dataset, respectively. Orange and blue coloring indicate predicted activation/inhibition genes participating. The intensity of the color refers to the strength of the effect.
Ijms 26 03419 g002
Figure 3. Differential methylated region (DMR) annotated to HKR1 gene in plasma cfDNA from Alzheimer’s disease (AD) and control subjects. (a) The graph depicts the genomic location of the amplicon covering the DMR within the HKR1 gene’s promoter region analyzed by bisulfite cloning sequencing. Functional elements predicted for nine human cell lines, identified through chromatin immunoprecipitation (ChIP) combined with massively parallel DNA sequencing, are displayed in the middle of the graph. The track was obtained from chromatin state segmentation by HMM from ENCODE/Broad track, shown in the UCSC Genome Browser. At the bottom, the CpG island is represented by a green box, the DMR by an orange box, and the amplicon spanning the DMR is represented in yellow. (b) HKR1 cfDNA methylation levels measured by pyrosequencing. Box plot charts display the methylation levels for individual CpG sites within the amplicon and the average levels between patients with Alzheimer’s disease (AD) and controls. Horizontal lines represent median methylation values and interquartile range for each group. * p-value < 0.05; *** p-value < 0.001 (Student’s t test). (c) Representative examples of bisulfite cloning sequencing validation for the amplicon containing the CpG are shown. Black and white circles denote methylated and unmethylated cytosines, respectively. Each column symbolizes a unique CpG site in the examined amplicon and each line represents an individual DNA clone. CpG—cytosine guanine dinucleotide.
Ijms 26 03419 g003
Table 1. Blood sample set analyzed by Illumina Infinium MethylationEPIC BeadChip. The table shows the phenotypical features of the subjects included in this study. cfDNA—cell-free DNA; GDS—Global Deterioration Scale; MMSE—Mini-Mental State Examination.
Phenotypical FeaturesControls
(n = 35)
Patients with AD
(n = 35)
p-Value
Median (IQR)
Age (years)77 (72–80)79 (76–83)0.213
MMSE30 (29–30)22 (19–26)0.000
GDS1 (1–1)4 (4–4)0.000
cfDNA amount (ng)96 (47–212)81 (34–241)0.445
N (%)
Gender 0.811
Female17 (49)18 (51)
Male18 (51)17 (49)
APOE genotype 0.001
ε4 non-carriers31 (89)15 (43)
ε4 carriers3 (9)20 (57)
pTau181 (pg/mL)1.5 (1.2–1.8)3.0 (2.1–3.9)0.000
Table 2. Differentially methylated positions (DMPs) in cfDNA from patients with AD with respect to controls. The table shows 102 DMPs with difference > 0.100, prioritized by beta difference criteria. Each DMP (CpG site) was annotated by UCSC hg19 build. ID—identification.
DMPGenomic CoordinatesGene IDRelation to CpG ContextRelation to Gene Structurep-Valueβ-Difference
cg26023019chr2131311859GRIK1Island1stExon0.0130.155
cg19665696chr7949154ADAP1IslandBody0.0210.151
cg25069157chr644102572TMEM63BOpenSeaBody0.0400.148
cg13578160chr772813978 OpenSea 0.0070.139
cg11955641chr5151304999GLRA1S_ShoreTSS15000.0010.139
cg09465533chr332327675CMTM8OpenSeaBody0.0010.137
cg20601028chr2022738632 OpenSea 0.0060.133
cg24245216chr197004657 OpenSea 0.0440.130
cg23506049chr12103228185 OpenSea 0.0390.129
cg21550804chr874282865 OpenSea 0.0350.125
cg22597210chr1910172841C3P1IslandBody0.0080.125
cg17857094chr630907280DPCR1OpenSeaTSS15000.0290.119
cg00055434chr12415344PLCH2IslandBody0.0060.117
cg27416647chr1596630572 OpenSea 0.0270.117
cg11646124chr1182140416 OpenSea 0.0080.113
cg22238209chr1935800743MAGIslandBody0.0170.113
cg07983614chr1684587903 OpenSea 0.0240.111
cg21764456chr1610777077TEKT5OpenSeaBody0.0370.110
cg07812827chr874282708 OpenSea 0.0100.110
cg06572225chr117748353 OpenSea 0.0210.110
cg03463818chr894766468TMEM67N_ShoreTSS15000.0340.108
cg26802564chr130446406 OpenSea 0.0060.107
cg18056749chr2055836268BMP7N_ShelfBody0.0430.106
cg27454064chr1264215611 Island 0.0170.105
cg24699005chr191192342 N_Shelf 0.0220.104
cg26861034chr2226908874TFIP11S_ShoreTSS15000.0020.104
cg10411590chr1321900810 S_Shore 0.0320.102
cg00796424chr1254365966HOXC11N_ShoreTSS15000.0040.101
cg12906062chr13105462162 OpenSea 0.042−0.100
cg00242341chr1172447419ARAP1OpenSea5′UTR0.039−0.100
cg18955367chr1949002338LMTK3IslandBody0.030−0.100
cg26003334chr7100661866LOC102724094OpenSeaTSS15000.004−0.101
cg16419584chr10129947858 Island 0.027−0.101
cg13063165chr1579093076ADAMTS7S_ShoreBody0.017−0.101
cg01495416chr859085270 OpenSea 0.027−0.101
cg02258724chr1953832577 Island 0.020−0.101
cg04772328chr2170549930C2orf77N_ShoreBody0.002−0.101
cg16045681chr131575570 OpenSea 0.002−0.102
cg21210642chr9100881995TRIM14S_ShoreTSS15000.008−0.102
cg24463437chr128396758EYA3OpenSeaBody0.001−0.102
cg20212912chr4147557774 N_Shore 0.007−0.102
cg06311780chr186633544 OpenSea 0.012−0.103
cg21010821chr11111782679HSPB2OpenSeaTSS15000.004−0.103
cg14891200chr2220197664RESP18S_ShoreBody0.001−0.103
cg14520947chr1225942842 OpenSea 0.003−0.103
cg15086439chr1236563070EDARADDS_ShelfBody0.040−0.103
cg04855678chr3195946921OSTalphaOpenSeaBody0.010−0.104
cg19146301chr1235100790LOC101927851OpenSeaTSS15000.004−0.104
cg13443570chr899098126ERICH5OpenSeaBody0.042−0.105
cg02784823chr1949000897LMTK3IslandBody0.041−0.105
cg06398054chr153092881 OpenSea 0.019−0.106
cg20062681chr1194988642 OpenSea 0.001−0.106
cg09484559chr1712692246RICH2N_ShoreTSS15000.018−0.106
cg08986575chr5173235445 OpenSea 0.049−0.106
cg27159720chr97971612 OpenSea 0.002−0.106
cg07870920chr4121569769 OpenSea 0.049−0.106
cg02938172chr17185152RPH3ALIsland5′UTR0.021−0.106
cg27087112chr2114737475LOC100499194IslandBody0.000−0.107
cg03174228chr9124658583TTLL11N_ShoreBody0.010−0.107
cg24984452chr195261186LINC01057OpenSeaBody0.035−0.107
cg17566325chr12133022423 N_Shore 0.006−0.107
cg03465894chr11106342311 OpenSea 0.022−0.108
cg15410835chr8143125637 OpenSea 0.001−0.108
cg24760557chr1031986724 OpenSea 0.016−0.108
cg18625538chr687832609 Island 0.045−0.109
cg21933626chr3123026636ADCY5OpenSeaBody0.004−0.109
cg05800368chr9124658957TTLL11IslandBody0.036−0.109
cg02774630chr2154727554GALNT13N_ShoreTSS15000.002−0.109
cg06878111chr109999498 OpenSea 0.003−0.110
cg23213894chr117691961CYB5R2N_ShelfBody0.010−0.111
cg06957053chr7137533035DGKIS_ShoreTSS15000.024−0.111
cg10531073chr2238485757BAIAP2L2S_ShoreBody0.005−0.112
cg24104237chr345649408LIMD1OpenSeaBody0.010−0.112
cg10289324chr1860710970 OpenSea 0.007−0.113
cg15243027chr232784469BIRC6-AS2OpenSeaBody0.028−0.113
cg10092377chr1200880981C1orf106IslandBody0.001−0.117
cg01583753chr239470725 N_Shore 0.018−0.117
cg16127514chr1029273678 OpenSea 0.042−0.117
cg26496930chr1470186565 OpenSea 0.041−0.117
cg10305928chr1062426219ANK3OpenSeaBody0.043−0.117
cg14310109chr6157297510ARID1BOpenSeaBody0.005−0.119
cg16520701chr834606956 OpenSea 0.010−0.120
cg16210088chr2231318349C22orf27IslandBody0.009−0.122
cg24448113chr5140475611PCDHB2Island1stExon0.013−0.124
cg06862049chr1949001890LMTK3IslandBody0.023−0.125
cg12172631chr1954584915TARM1OpenSeaTSS15000.021−0.126
cg20548231chr2231318373C22orf27IslandBody0.001−0.127
cg09544050chr8143580965BAI1IslandBody0.003−0.128
cg18815398chr2061506981 N_Shore 0.000−0.128
cg26651782chr1951505779KLK9N_Shore3′UTR0.005−0.128
cg24061197chr2220108496GLB1LS_Shore5′UTR0.043−0.128
cg06260707chr142945689 OpenSea 0.022−0.128
cg15059639chr2171220061MYO3BOpenSeaBody0.022−0.128
cg24658778chr6152897280SYNE1OpenSeaBody0.013−0.130
cg20920357chr4116877727 OpenSea 0.002−0.133
cg02256650chr2231317287MORC2-AS1N_ShoreTSS15000.013−0.133
cg26140120chr8124219575FAM83AIslandBody0.014−0.135
cg06452258chr260597809 OpenSea 0.049−0.136
cg08431893chr2144864600 Island 0.004−0.139
cg16467921chr8128801108 OpenSea 0.004−0.139
cg04248279chr17184833RPH3ALN_Shore5′UTR0.007−0.142
cg24135491chr174487099SMTNL2N_ShoreTSS2000.015−0.147
Table 3. Correlation between DNA methylation of 10 top differential methylated positions (DMPs) ranked by highest positive beta difference (delta mean) criteria and clinical parameters. ID—identification; MMSE—Mini-Mental State Examination; GDS—Global Deterioration Scale. + p-value < 0.1; * p-value < 0.05; ** p-value < 0.01.
NoDMPβ-DifferenceGene IDMMSEGDSAβ42Aβ40Ratio Aβ42/Aβ40pTaut-TauPlasma pTau181
1cg260230190.155GRIK1−0.1550.224−0.044−0.032−0.1020.2900.0960.148
2cg196656960.151ADAP1−0.2040.328 **−0.1800.093−0.549 *0.075−0.1620.329 *
3cg250691570.148TMEM63B−0.242−0.2040.1560.0710.039−0.1640.0480.378 **
4cg135781600.139 −0.336 *0.338 **−0.050−0.0030.086−0.0500.0330.117
5cg119556410.139GLRA1−0.278 *0.452 **0.2750.444 +−0.0810.403 +0.2680.327 *
6cg094655330.137CMTM8−0.304 *0.413 **−0.331−0.233−0.1490.107−0.1170.141
7cg206010280.133 −0.317 *0.352 **−0.036−0.024−0.1160.221−0.0530.330 *
8cg242452160.130 −0.349 **0.273 *−0.353−0.659 **0.332−0.427 +−0.513 *0.229 +
9cg235060490.129 −0.502 **0.373 **0.177−0.0290.159−0.117−0.3130.199
10cg215508040.125 −0.1670.1370.1740.0930.3020.3020.3470.283 *
Table 4. Correlation between DNA methylation of 10 top differential methylated positions (DMPs) ranked by highest negative beta difference (delta) criteria and clinical parameters. ID—identification; MMSE—Mini-Mental State Examination; GDS—Global Deterioration Scale. + p-value < 0.1; * p-value < 0.05; ** p-value < 0.01.
NoDMPβ-DifferenceGene IDMMSEGDSAβ42Aβ40Ratio Aβ42/Aβ40pTaut-TauPlasma pTau181
1cg24135491−0.147SMTNL20.349 **−0.463 **−0.302−0.205−0.092−0.155−0.308−0.357 **
2cg04248279−0.142RPH3AL0.202−0.2330.188−0.0080.176−0.326−0.317−0.361 **
3cg16467921−0.139 0.258−0.346 **−0.0480.092−0.448 *0.3010.134−0.227 +
4cg08431893−0.139 0.278 *−0.338 **−0.170−0.1980.041−0.119−0.122−0.265 +
5cg06452258−0.136 0.341 *0.430 **−0.0840.039−0.1010.0390.122−0.231 +
6cg26140120−0.135FAM83A0.517 **−0.373 **0.1350.0920.1560.0320.233−0.217
7cg02256650−0.133MORC2-AS10.299 *−0.409 **−0.092−0.0260.0800.0360.189−0.253 +
8cg20920357−0.133 0.040−0.312 *0.397 +0.3650.1650.0710.095−0.194
9cg24658778−0.130SYNE10.311 *−0.296 *−0.0030.185−0.0960.2530.098−0.159
10cg15059639−0.128MYO3B0.203−0.252 *0.0920.1730.0030.1050.021−0.223 +
Table 5. Differentially methylated regions (DMRs) in cfDNA from AD APOE ε4 carriers and control APOE ε4 non-carriers. The table shows 17 DMRs after adjusting for Sidak correction, prioritized by beta difference criteria. Each region was annotated by UCSC hg19 build.
Genomic LocationFDRSidakCpGs in DMRGene IDRelation to CpG ContextRelation to Gene Structureβ-Difference
chr869243284692432932.41099 × 10−6 0.021cg06125462; cg03357798; cg19469068C8orf34; C8orf34-AS1Island1stExon; Intergenic0.038
chr1189867808898681046.55924 × 10−60.004cg14304817; cg09584827; cg12403137; cg05236757; cg05500015; cg21500966NAALAD2OpenSea5′UTR; TSS200; Body; 1stExon0.013
chr1955972854559732342.06981× 10−50.026cg12195369; cg02394686; cg23051792; cg18297529; cg19384825;cg13475732ISOC2Island5′UTR; TSS200−0.004
chr21683662681683663637.3012 × 10−60.021cg19288676; cg18683711 OpenSeaIntergenic−0.016
chr19185454818548196.55924 × 10−6 0.005cg08287334; cg22672431; cg08525314; cg01373896KLF16IslandBody−0.026
chr61163819031163821793.57858 × 10−6 0.002cg15226275; cg05304507; cg26893134; cg26557270; cg18764771FRKOpenSeaTSS200; 1stExon; TSS1500−0.027
chr5131603713162648.74148 × 10−6 0.017cg11624060; cg26209169 OpenSeaIntergenic−0.033
chr11550071651550072548.18998 × 10−6 0.038cg08472142; cg21596858DCST1;DCST2OpenSeaBody−0.038
chr51786926901786928068.18998 × 10−6 0.028cg06495631; cg01231141; cg10213542ADAMTS2OpenSeaBody−0.040
chr630103458301036997.53684 × 10−6 0.010cg12758147; cg12612406; cg13044052TRIM40OpenSeaTSS1500−0.044
chr2031366408313664868.18998 × 10−6 0.040cg00300969;cg09135144; cg24403338; cg17475857DNMT3BOpenSea5′UTR; TSS1500−0.046
chr1172533201725334878.18998 × 10−6 0.011cg13771313; cg24878173; cg04006327ATG16L2IslandBody−0.057
chr19798387679841711.60512 × 10−7 0.000cg26284544; cg10073052; cg00654322; cg03685315; cg03840143SNAPC2Island; S_ShoreTSS1500−0.058
chr101230703261230703927.53684 × 10−6 0.036cg16273546;cg21380925 OpenSeaIntergenic−0.064
chr630419490304195761.45527 × 10−150.000cg26570901; cg26715559; cg12078775; cg27572120;cg11491998 IslandIntergenic−0.074
chr5186797718682618.18998 × 10−6 0.012cg15595755; cg04156016; cg14773178 OpenSeaIntergenic−0.084
chr22201080932201084962.16849 × 10−6 0.000cg20314884; cg04945312; cg10602248; cg02258512; cg24061197; cg09715285GLB1LIsland; S_ShoreBody; 5′UTR; 1stExon−0.095
Table 6. Differentially methylated regions (DMRs) in cfDNA from AD APOE ε4 carriers and control APOE ε4 non-carriers. The table shows 4 DMRs after adjusting for Sidak correction, prioritized by beta difference criteria. Each region was annotated by UCSC hg19 build.
Genomic LocationFDRSidakCpGs in DMRGene IDRelation to CpG ContextRelation to Gene Structureβ-Difference
chr1321900391219005912.318 × 10−6 4.081 × 10⁻³cg13903179; cg19500098; cg00035636; cg04632378 IslandIntergenic0.100
chr1745949676459498782.318 × 10−6 4.887 × 10⁻³ cg01135546; cg09065876; cg16913064; cg23008871; cg05123976 IslandIntergenic0.037
chr1937825210378256791.743 × 10−8 7.935 × 10⁻⁶ cg26734888; cg23756236; cg12948621; cg12024906; cg08565796; cg24834889; cg14166009; cg10237978; cg05280698; cg13687570HKR1IslandTSS1500; TSS200;
1stExon
0.021
chr31337485041337488124.661 × 10−101.615 × 10⁻⁷ cg19591206; cg12118082; cg26556923; cg02496728SLCO2A1Island1stExon; Body0.010
Table 7. Differentially methylated genes reported in previous Alzheimer’s disease (AD) methylome studies. The table shows the genes that have been previously found associated with AD in methylome studies performed on different sample sources and techniques. ID—identification.
Gene IDSample SourceTechniqueAD Methylome Study
HKR1HippocampusInfinium HumanMethylation450 BeadChipPMID: 31217032
Prefrontal cortexInfinium MethylationEPIC BeadChipPMID: 33257653
BloodInfinium HumanMethylation450 BeadChipPMID: 29394898
ZNF154BloodInfinium HumanMethylation450 BeadChipPMID: 31775875
HOXA5Superior temporal gyrus and inferior frontal gyrusInfinium MethylationEPIC BeadChipPMID: 33069246
Prefrontal cortexInfinium HumanMethylation450 BeadChipPMID: 33902726
Superior temporal gyrusInfinium HumanMethylation450 BeadChipPMID: 29550519
TRIM40Superior temporal gyrusInfinium HumanMethylation450 BeadChipPMID: 26803900
Prefrontal cortexInfinium MethylationEPIC BeadChipPMID: 33257653
ATG16L2HippocampusInfinium HumanMethylation450 BeadChipPMID: 31217032
Dorsolateral prefrontal cortexInfinium HumanMethylation450 BeadChipPMID: 25129075
Prefrontal cortexInfinium HumanMethylation450 BeadChipPMID: 33902726
Prefrontal cortexInfinium MethylationEPIC BeadChipPMID: 33257653
ADAMST2Prefrontal cortexInfinium HumanMethylation450 BeadChipPMID: 35982059
Disclaimer/Publisher’s Note: The statements, opinions and data contained in all publications are solely those of the individual author(s) and contributor(s) and not of MDPI and/or the editor(s). MDPI and/or the editor(s) disclaim responsibility for any injury to people or property resulting from any ideas, methods, instructions or products referred to in the content.

