
Longitudinal Analysis of Placental IRS1 DNA Methylation and Childhood Obesity
 , , , ,
  , ,
, ,
Abstract
1. Introduction
2. Results
2.1. Participants Characteristics
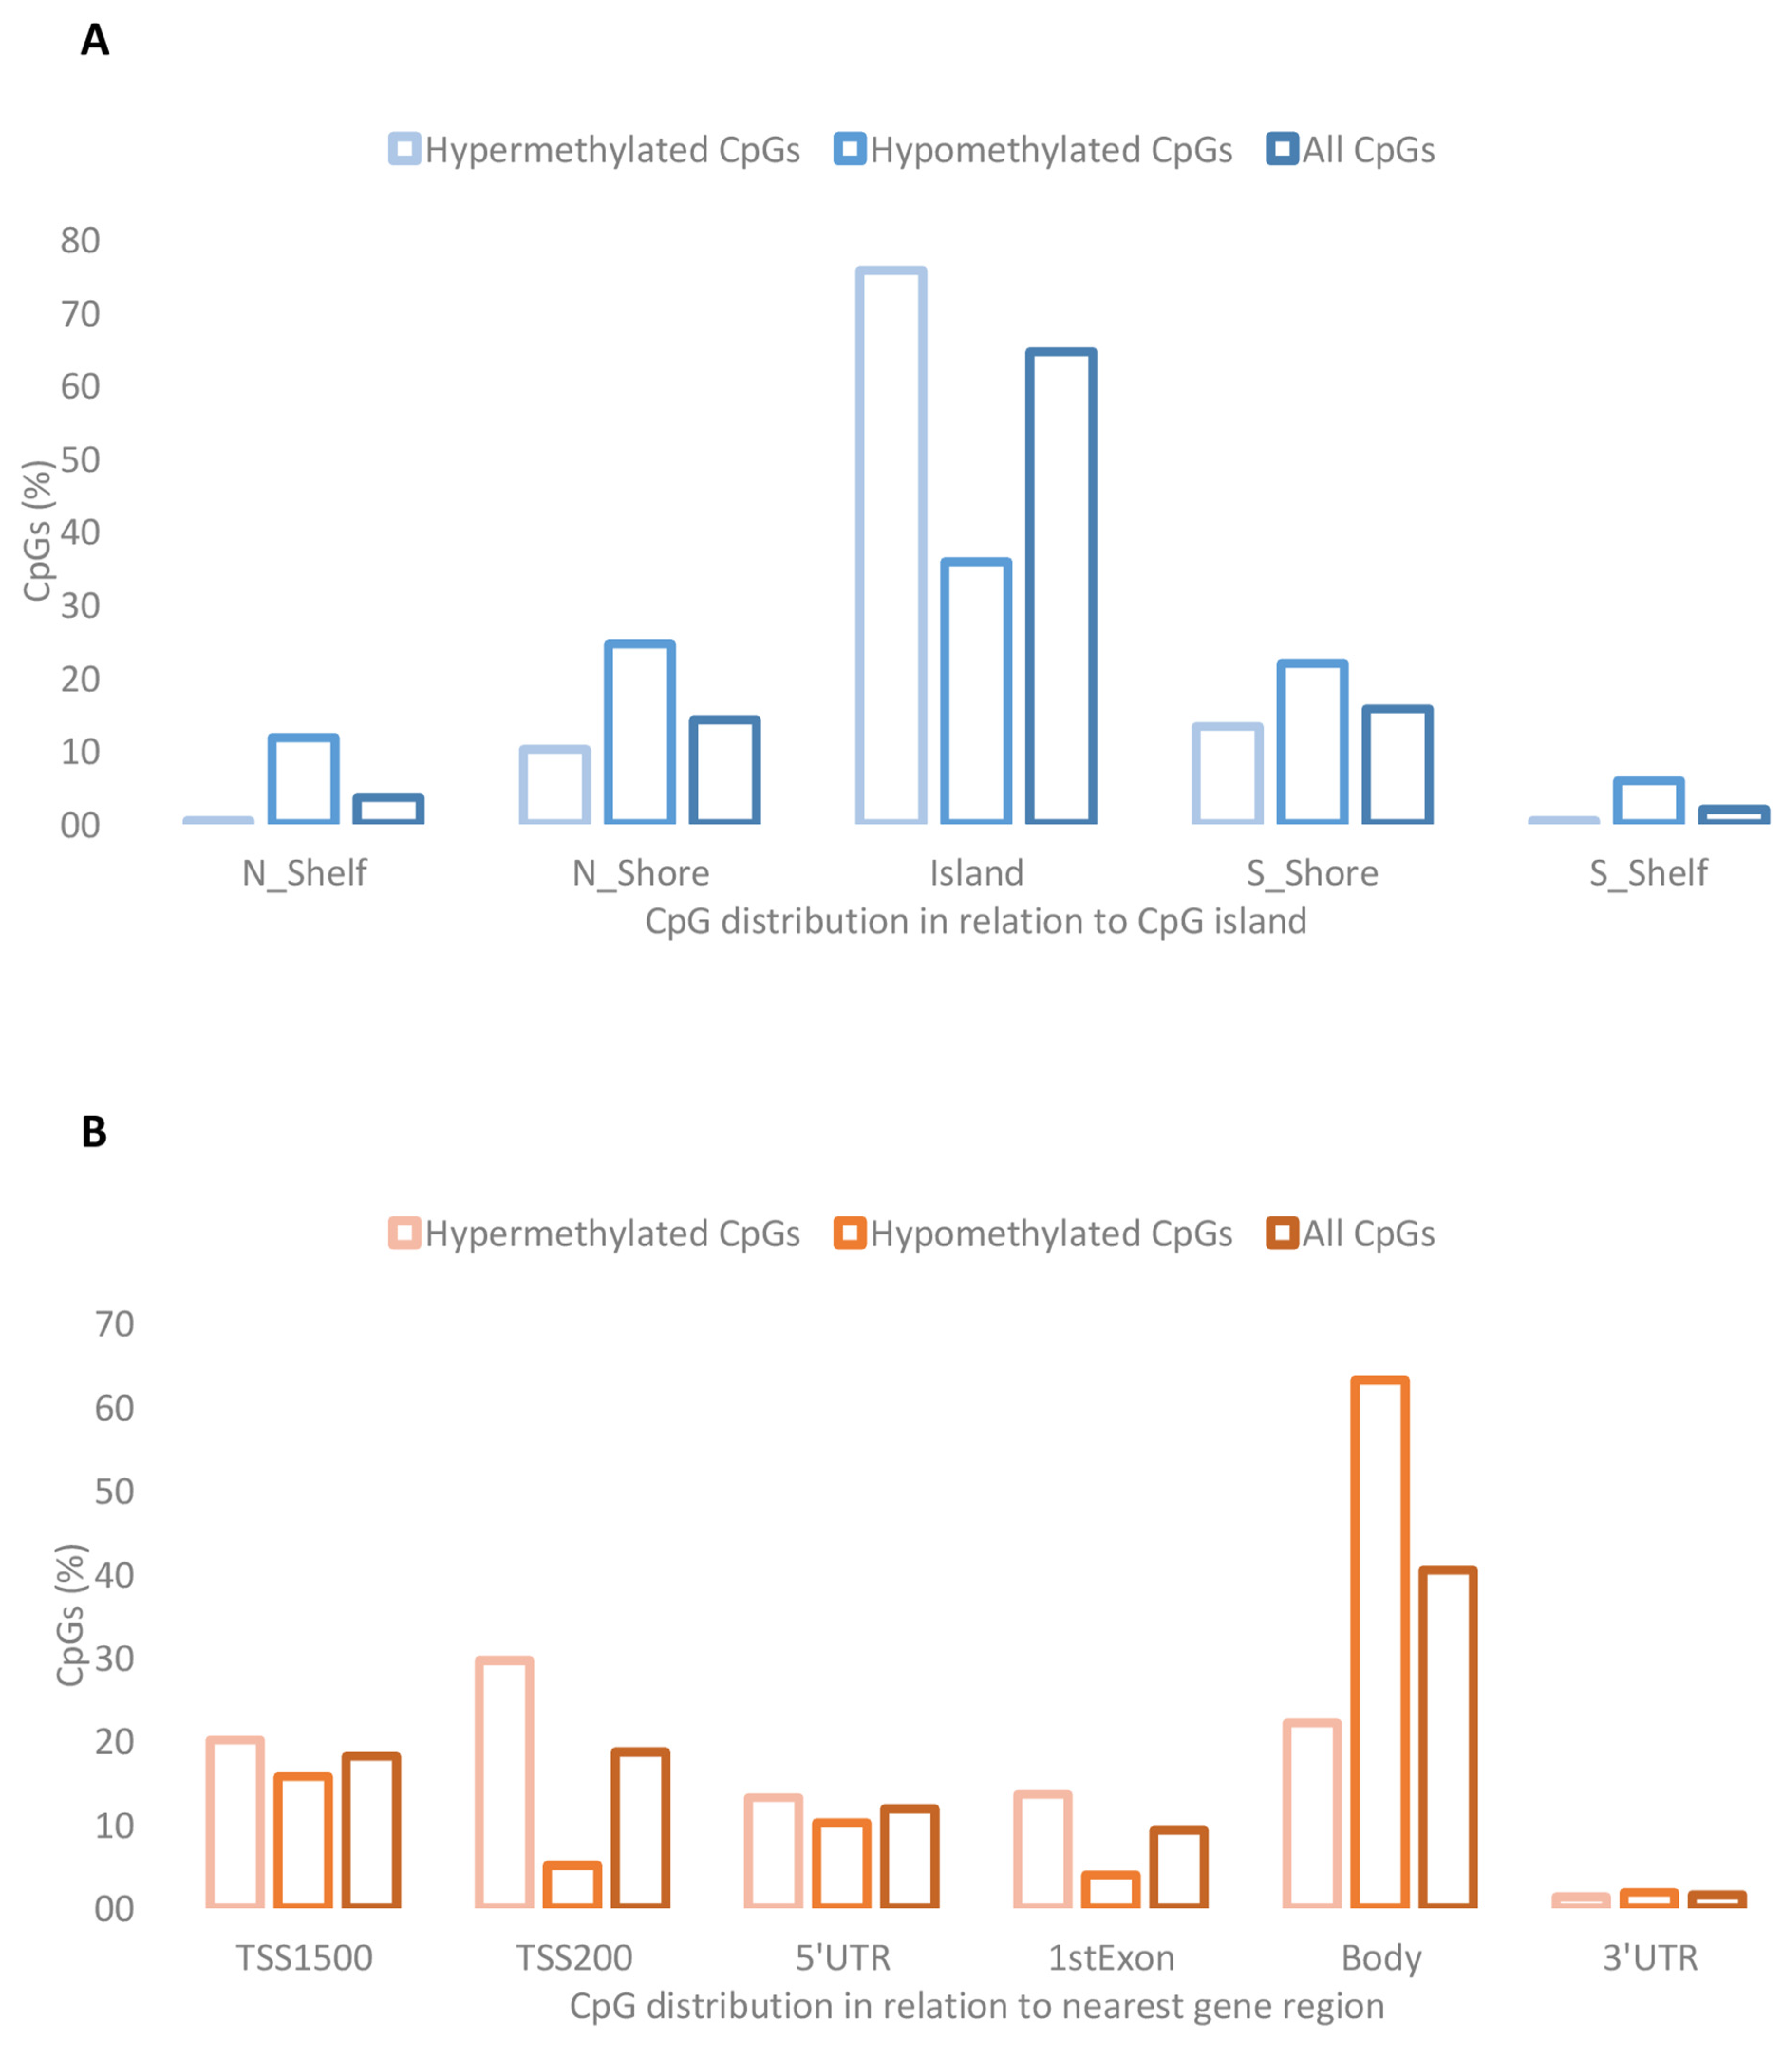
2.2. Placental DMCs Associated with Obesity Risk in Offspring
2.3. Placental IRS1 Methylation
2.4. Placental IRS1 Expression
2.5. Leukocyte IRS1 Methylation and Expression
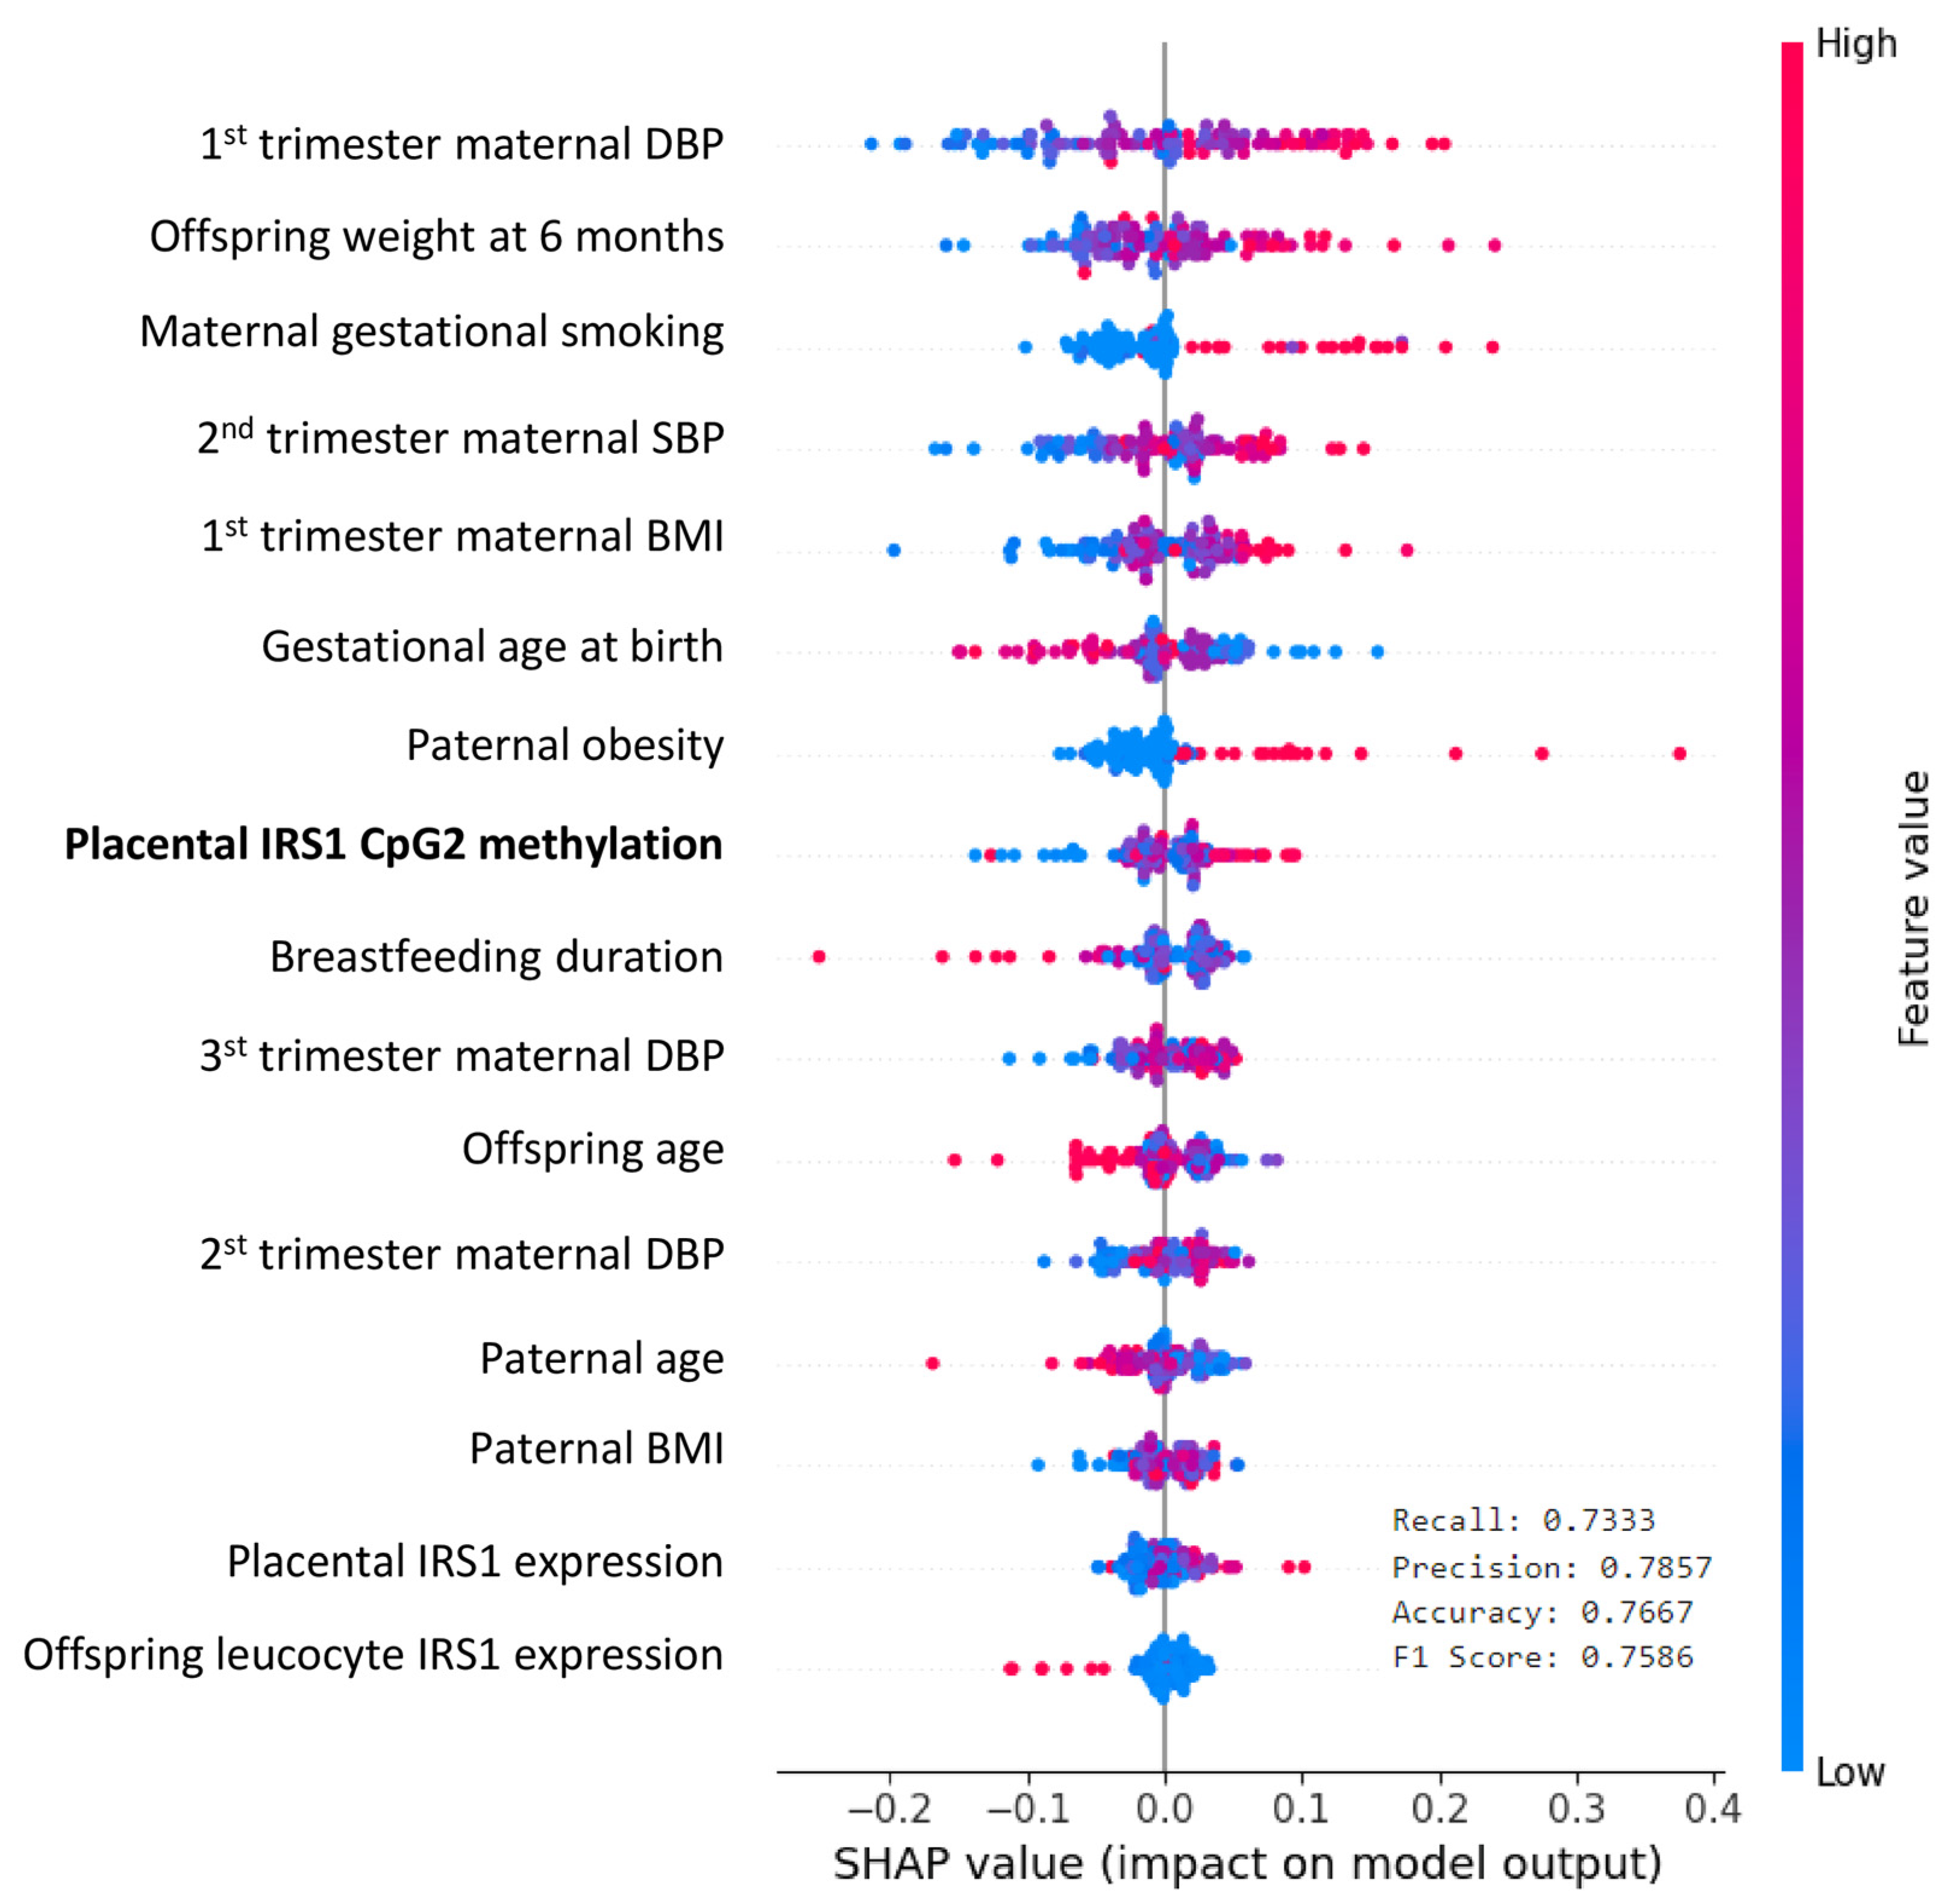
2.6. Prediction of Obesity-Related Parameters
3. Discussion
4. Materials and Methods
4.1. Study Participants
4.2. Biological Samples
4.3. Clinical Assessments
4.4. Infinium MethylationEPIC BeadChip Microarray
4.5. Pathway Analysis
4.6. DNA Methylation Assessment
4.7. Gene Expression Assessment
4.8. Statistical Analysis
4.9. Prediction Analysis
Supplementary Materials
Author Contributions
Funding
Institutional Review Board Statement
Informed Consent Statement
Data Availability Statement
Acknowledgments
Conflicts of Interest
References
- Garrido-Miguel, M.; Cavero-Redondo, I.; Álvarez-Bueno, C.; Rodríguez-Artalejo, F.; Moreno, L.A.; Ruiz, J.R.; Ahrens, W.; Martínez-Vizcaíno, V. Prevalence and Trends of Overweight and Obesity in European Children From 1999 to 2016: A Systematic Review and Meta-analysis. JAMA Pediatr. 2019, 173, e192430. [Google Scholar] [CrossRef] [PubMed]
- Lee, E.Y.; Yoon, K.H. Epidemic obesity in children and adolescents: Risk factors and prevention. Front. Med. 2018, 12, 658–666. [Google Scholar] [CrossRef]
- Novelli, G.; Cassadonte, C.; Sbraccia, P.; Biancolella, M. Genetics: A Starting Point for the Prevention and the Treatment of Obesity. Nutrients 2023, 15, 2782. [Google Scholar] [CrossRef]
- Sivakumar, S.; Lama, D.; Rabhi, N. Childhood obesity from the genes to the epigenome. Front. Endocrinol. 2024, 15, 1393250. [Google Scholar] [CrossRef]
- Alfano, R.; Robinson, O.; Handakas, E.; Nawrot, T.S.; Vineis, P.; Plusquin, M. Perspectives and challenges of epigenetic determinants of childhood obesity: A systematic review. Obes. Rev. 2022, 23 (Suppl. S1), e13389. [Google Scholar] [CrossRef] [PubMed]
- Gallardo-Escribano, C.; Buonaiuto, V.; Ruiz-Moreno, M.I.; Vargas-Candela, A.; Vilches-Perez, A.; Benitez-Porres, J.; Romance-Garcia, A.R.; Ruiz-Moreno, A.; Gomez-Huelgas, R.; Bernal-Lopez, M.R. Epigenetic approach in obesity: DNA methylation in a prepubertal population which underwent a lifestyle modification. Clin. Epigenetics 2020, 12, 144. [Google Scholar] [CrossRef] [PubMed]
- Mansell, T.; Ponsonby, A.L.; Collier, F.; Burgner, D.; Pezic, A.; Vuillermin, P.; Ryan, J.; Saffery, R.; Carlin, J.; Allen, K.; et al. Methylation of the LEP gene promoter in blood at 12 months and BMI at 4 years of age-a population-based cohort study. Int. J. Obes. 2020, 44, 842–847. [Google Scholar] [CrossRef]
- Mansell, T.; Burgner, D.; Ponsonby, A.L.; Collier, F.; Pezic, A.; Vuillermin, P.; Juonala, M.; Ryan, J.; Saffery, R. HIF3A cord blood methylation and systolic blood pressure at 4 years—A population-based cohort study. Epigenetics 2020, 15, 1361–1369. [Google Scholar] [CrossRef]
- Li, Y.; Zhou, Y.; Zhu, L.; Liu, G.; Wang, X.; Wang, X.; Wang, J.; You, L.; Ji, C.; Guo, X.; et al. Genome-wide analysis reveals that altered methylation in specific CpG loci is associated with childhood obesity. J. Cell. Biochem. 2018, 119, 7490–7497. [Google Scholar] [CrossRef]
- Vehmeijer, F.O.L.; Küpers, L.K.; Sharp, G.C.; Salas, L.A.; Lent, S.; Jima, D.D.; Tindula, G.; Reese, S.; Qi, C.; Gruzieva, O.; et al. DNA methylation and body mass index from birth to adolescence: Meta-analyses of epigenome-wide association studies. Genome Med. 2020, 12, 105. [Google Scholar] [CrossRef]
- Obri, A.; Serra, D.; Herrero, L.; Mera, P. The role of epigenetics in the development of obesity. Biochem. Pharmacol. 2020, 177, 113973. [Google Scholar] [CrossRef] [PubMed]
- Samblas, M.; Milagro, F.I.; Martínez, A. DNA methylation markers in obesity, metabolic syndrome, and weight loss. Epigenetics 2019, 14, 421–444. [Google Scholar] [CrossRef] [PubMed]
- Robinson, N.; Brown, H.; Antoun, E.; Godfrey, K.M.; Hanson, M.A.; Lillycrop, K.A.; Crozier, S.R.; Murray, R.; Pearce, M.S.; Relton, C.L.; et al. Childhood DNA methylation as a marker of early life rapid weight gain and subsequent overweight. Clin. Epigenetics 2021, 13, 8. [Google Scholar] [CrossRef] [PubMed]
- Dolinko, A.V.; Schultz, B.M.; Ghosh, J.; Kalliora, C.; Mainigi, M.; Coutifaris, C.; Sapienza, C.; Senapati, S. Disrupted methylation patterns at birth persist in early childhood: A prospective cohort analysis. Clin. Epigenetics 2022, 14, 129. [Google Scholar] [CrossRef]
- Rahman, M.F.; McGowan, P.O. Cell-type-specific epigenetic effects of early life stress on the brain. Transl. Psychiatry 2022, 12, 326. [Google Scholar] [CrossRef]
- Ma, B.; Wilker, E.H.; Willis-Owen, S.A.G.; Byun, H.M.; Wong, K.C.C.; Motta, V.; Baccarelli, A.A.; Schwartz, J.; Cookson, W.O.C.M.; Khabbaz, K.; et al. Predicting DNA methylation level across human tissues. Nucleic Acids Res. 2014, 42, 3515–3528. [Google Scholar] [CrossRef]
- Apsley, A.T.; Ye, Q.; Etzel, L.; Wolf, S.; Hastings, W.J.; Mattern, B.C.; Siegel, S.R.; Shalev, I. Biological stability of DNA methylation measurements over varying intervals of time and in the presence of acute stress. Epigenetics 2023, 18, 2230686. [Google Scholar] [CrossRef]
- Rönn, T.; Volkov, P.; Gillberg, L.; Kokosar, M.; Perfilyev, A.; Jacobsen, A.L.; Jørgensen, S.W.; Brøns, C.; Jansson, P.A.; Eriksson, K.F.; et al. Impact of age, BMI and HbA1c levels on the genome-wide DNA methylation and mRNA expression patterns in human adipose tissue and identification of epigenetic biomarkers in blood. Hum. Mol. Genet. 2015, 24, 3792–3813. [Google Scholar] [CrossRef]
- Eckstein, S.S.; Weigert, C.; Lehmann, R. Divergent Roles of IRS (Insulin Receptor Substrate) 1 and 2 in Liver and Skeletal Muscle. Curr. Med. Chem. 2017, 24, 1827–1852. [Google Scholar] [CrossRef]
- Irizarry, R.A.; Ladd-Acosta, C.; Wen, B.; Wu, Z.; Montano, C.; Onyango, P.; Cui, H.; Gabo, K.; Rongione, M.; Webster, M.; et al. Genome-wide methylation analysis of human colon cancer reveals similar hypo- and hypermethylation at conserved tissue-specific CpG island shores. Nat. Genet. 2009, 41, 178. [Google Scholar] [CrossRef]
- Angeloni, A.; Bogdanovic, O. Sequence determinants, function, and evolution of CpG islands. Biochem. Soc. Trans. 2021, 49, 1109. [Google Scholar] [CrossRef]
- Yoon, M.S. The Role of Mammalian Target of Rapamycin (mTOR) in Insulin Signaling. Nutrients 2017, 9, 1176. [Google Scholar] [CrossRef] [PubMed]
- Fradin, D.; Boëlle, P.Y.; Belot, M.P.; Lachaux, F.; Tost, J.; Besse, C.; Deleuze, J.F.; De Filippo, G.; Bougnères, P. Genome-Wide Methylation Analysis Identifies Specific Epigenetic Marks In Severely Obese Children. Sci. Rep. 2017, 7, 46311. [Google Scholar] [CrossRef]
- McGuire, M.H.; Herbrich, S.M.; Dasari, S.K.; Wu, S.Y.; Wang, Y.; Rupaimoole, R.; Lopez-Berestein, G.; Baggerly, K.A.; Sood, A.K. Pan-cancer genomic analysis links 3’UTR DNA methylation with increased gene expression in T cells. EBioMedicine 2019, 43, 127–137. [Google Scholar] [CrossRef]
- Peng, J.; He, L. IRS posttranslational modifications in regulating insulin signaling. J. Mol. Endocrinol. 2018, 60, R1–R8. [Google Scholar] [CrossRef]
- Miki, H.; Yamauchi, T.; Suzuki, R.; Komeda, K.; Tsuchida, A.; Kubota, N.; Terauchi, Y.; Kamon, J.; Kaburagi, Y.; Matsui, J.; et al. Essential role of insulin receptor substrate 1 (IRS-1) and IRS-2 in adipocyte differentiation. Mol. Cell. Biol. 2001, 21, 2521–2532. [Google Scholar] [CrossRef] [PubMed]
- Kilpeläinen, T.O.; Zillikens, M.C.; Stančákova, A.; Finucane, F.M.; Ried, J.S.; Langenberg, C.; Zhang, W.; Beckmann, J.S.; Luan, J.; Vandenput, L.; et al. Genetic variation near IRS1 associates with reduced adiposity and an impaired metabolic profile. Nat. Genet. 2011, 43, 753–760. [Google Scholar] [CrossRef]
- Rohde, K.; Klös, M.; Hopp, L.; Liu, X.; Keller, M.; Stumvoll, M.; Dietrich, A.; Schön, M.R.; Gärtner, D.; Lohmann, T.; et al. IRS1 DNA promoter methylation and expression in human adipose tissue are related to fat distribution and metabolic traits OPEN. Sci. Rep. 2017, 7, 12369. [Google Scholar] [CrossRef]
- Heid, I.M.; Jackson, A.U.; Randall, J.C.; Winkler, T.W.; Qi, L.; Ssteinthorsdottir, V.; Tthorleifsson, G.; Zillikens, C.; Sspeliotes, E.K.; Mägi, R.; et al. Meta-analysis identifies 13 new loci associated with waist-hip ratio and reveals sexual dimorphism in the genetic basis of fat distribution. Nat. Genet. 2010, 42, 949–960. [Google Scholar] [CrossRef]
- Lagou, V.; Mägi, R.; Hottenga, J.J.; Grallert, H.; Perry, J.R.B.; Bouatia-Naji, N.; Marullo, L.; Rybin, D.; Jansen, R.; Min, J.L.; et al. Sex-dimorphic genetic effects and novel loci for fasting glucose and insulin variability. Nat. Commun. 2021, 12, 24. [Google Scholar] [CrossRef]
- Arner, P.; Viguerie, N.; Massier, L.; Rydén, M.; Astrup, A.; Blaak, E.; Langin, D.; Andersson, D.P. Sex differences in adipose insulin resistance are linked to obesity, lipolysis and insulin receptor substrate 1. Int. J. Obes. 2024, 48, 934–940. [Google Scholar] [CrossRef]
- Carrascosa, A.; Fernández, J.M.; Fernández, C.; Ferrández, A.; López-Siguero, J.P.; Sánchez, E.; Sobradillo, B.; Yeste, Y.D. Spanish growth studies 2008. New anthropometric standards. Endocrinol. Nutr. 2008, 55, 484–506. [Google Scholar] [CrossRef] [PubMed]
- Gómez-Vilarrubla, A.; Mas-Parés, B.; Carreras-Badosa, G.; Xargay-Torrent, S.; Prats-Puig, A.; Bonmatí-Santané, A.; de Zegher, F.; Ibañez, L.; López-Bermejo, A.; Bassols, J. Placental epigenetic marks related to gestational weight gain reveal potential genes associated with offspring obesity parameters. Obesity 2023, 31, 1903–1912. [Google Scholar] [CrossRef] [PubMed]
- Hirooka, M.; Kumagi, T.; Kurose, K.; Nakanishi, S.; Michitaka, K.; Matsuura, B.; Horiike, N.; Onji, M. A technique for the measurement of visceral fat by ultrasonography: Comparison of measurements by ultrasonography and computed tomography. Intern. Med. 2005, 44, 794–799. [Google Scholar] [CrossRef] [PubMed]

| Screening | Validation | p-Value | |
|---|---|---|---|
| Mother (n) | 24 | 147 | |
| Age (yr) | 31 ± 1 | 31 ± 1 | NS |
| Height (cm) | 164 ± 1 | 163 ± 1 | NS |
| Pregestational weight (kg) | 68.5 ± 2.9 | 65.6 ± 1.0 | NS |
| Pregestational BMI (kg/m2) | 25.2 ± 1.0 | 24.7 ± 0.3 | NS |
| Pregestational obesity (%) | 30 | 34 | NS |
| Newborn (n) | 24 | 147 | |
| Gender (% female) | 50 | 52 | NS |
| Gestational age (wk) | 40 ± 0.1 | 40 ± 0.1 | NS |
| Birth weight (kg) | 3.4 ± 0.1 | 3.4 ± 0.1 | NS |
| Birth weight-SDS | 0.3 ± 0.1 | 0.2 ± 0.1 | NS |
| Birth length (cm) | 50.1 ± 0.2 | 49.7 ± 0.1 | NS |
| Birth length-SDS | 0.07 ± 0.1 | 0.01 ± 0.1 | NS |
| Offspring at 6 yr (n) | 24 | 147 | |
| Age (yr) | 6.2 ± 0.1 | 6.0 ± 0.1 | NS |
| Weight (kg) | 23.7 ± 1.0 | 22.4 ± 0.4 | NS |
| Weight-SDS | 0.22 ± 0.2 | 0.05 ± 0.1 | NS |
| Height (cm) | 120 ± 1 | 116 ± 1 | NS |
| Height-SDS | 0.58 ± 0.2 | 0.11 ± 0.1 | NS |
| BMI (kg/m2) | 16.3 ± 0.3 | 16.3 ± 0.1 | NS |
| BMI-SDS | −0.02 ± 0.1 | 0.01 ± 0.1 | NS |
| Δ BW-SDS to weight-SDS | −0.18 ± 0.2 | −0.15 ± 0.1 | NS |
| Waist (cm) | 57.1 ± 1.7 | 56.3 ± 0.6 | NS |
| Hip (cm) | 61.1 ± 1.8 | 59.6 ± 0.6 | NS |
| SBP (mmHg) | 96.9 ± 3.0 | 95.9 ± 1.0 | NS |
| DBP (mmHg) | 57.1 ± 1.1 | 57.0 ± 0.7 | NS |
| HDL-cholesterol (mg/dL) | 57.0 ± 2.7 | 55.8 ± 0.8 | NS |
| Triglycerides (mg/dL) | 49.5 ± 2.7 | 50.8 ± 1.2 | NS |
| Glucose (mg/dL) | 85.0 ± 1.7 | 82.9 ± 0.5 | NS |
| Insulin (mIU/L) | 6.2 ± 0.5 | 5.2 ± 0.2 | NS |
| HOMA-IR | 1.3 ± 0.1 | 1.1 ± 0.1 | NS |
| FBM (kg) | 5.9 ± 0.6 | 5.6 ± 0.2 | NS |
| LBM (kg) | 18.0 ± 0.6 | 17.0 ± 0.2 | NS |
| Subcutaneous fat (cm) | 0.41 ± 0.03 | 0.45 ± 0.02 | NS |
| Peritoneal fat (cm) | 0.45 ± 0.04 | 0.46 ± 0.01 | NS |
| Visceral fat (cm2) | 5.4 ± 0.2 | 5.2 ± 0.1 | NS |
| (A) Hypermethylated DMCs | ||||||
|---|---|---|---|---|---|---|
| Ilmn ID | Beta Coef. | FDR | OR | Chr | Position | Gene |
| cg00406870 | 1.03970511 | 4.35 × 10−43 | 2.82838283 | 11 | 124981741 | TMEM218 |
| cg07150062 | 1.03245317 | 2.74 × 10−39 | 2.80794576 | 14 | 104552032 | ASPG |
| cg10761315 | 0.98664557 | 7.57 × 10−37 | 2.68222203 | 14 | 104552034 | ASPG |
| cg11163620 | 0.97173534 | 5.92 × 10−36 | 2.64252615 | 4 | 157997554 | GLRB |
| cg01963620 | 0.97115961 | 6.50 × 10⁻³⁵ | 2.64100522 | 11 | 124981674 | TMEM218 |
| cg08626939 | 0.96229948 | 4.80 × 10⁻³³ | 2.61770892 | 2 | 227656417 | IRS1 |
| cg05665562 | 0.96004491 | 5.03 × 10−38 | 2.61181376 | 11 | 124981679 | TMEM218 |
| cg14874299 | 0.95164064 | 4.12 × 10−36 | 2.58995536 | 11 | 124981343 | TMEM218 |
| cg12163935 | 0.94020019 | 8.88 × 10⁻³² | 2.56049395 | 2 | 227656057 | IRS1 |
| cg05446424 | 0.92323155 | 3.13 × 10−43 | 2.51741242 | 2 | 14772734 | FAM84A |
| (B) Hypomethylated DMCs | ||||||
| Ilmn ID | Beta Coef. | FDR | OR | Chr | Position | Gene |
| cg10324224 | −1.13770315 | 6.06 × 10⁻¹¹ | 0.32055444 | 1 | 231115997 | TTC13 |
| cg24202000 | −1.09504286 | 2.49 × 10⁻¹⁰ | 0.33452527 | 8 | 129551766 | LINC00824 |
| cg21240123 | −0.98681175 | 1.42 × 10−08 | 0.37276326 | 3 | 20016987 | RAB5A |
| cg14730097 | −0.96058097 | 8.10 × 10−09 | 0.3826705 | 2 | 233632281 | GIGYF2 |
| cg18705155 | −0.86117235 | 7.25 × 10−09 | 0.42266628 | 6 | 39194077 | KCNK5 |
| cg20401473 | −0.81442859 | 7.13 × 10−07 | 0.44289233 | 6 | 88186912 | SLC35A1 |
| cg23691406 | −0.80357486 | 5.41 × 10⁻¹⁷ | 0.44772554 | 14 | 71112909 | TTC9 |
| cg10533159 | −0.77469288 | 8.47 × 10−40 | 0.4608453 | 1 | 207991937 | LOC148696 |
| cg17325094 | −0.77392864 | 2.08 × 10⁻²⁰ | 0.46119763 | 1 | 57809419 | DAB1 |
| cg04248557 | −0.74101842 | 1.63 × 10−06 | 0.47662826 | 7 | 69196758 | AUTS2 |
| Placental IRS1 (CpG2) Methylation | Placental IRS1 Expression | |||||||||||
|---|---|---|---|---|---|---|---|---|---|---|---|---|
| Offspring at 6 yr | All | Boys | Girls | All | Boys | Girls | ||||||
| r | p-Value | r | p-Value | r | p-Value | r | p-Value | r | p-Value | r | p-Value | |
| Weight-SDS | 0.227 | 0.006 | 0.254 | 0.03 | 0.249 | 0.02 | 0.054 | Ns | 0.319 | 0.006 | −0.011 | NS |
| Height-SDS | 0.160 | 0.05 | 0.214 | NS | 0.142 | NS | 0.134 | NS | 0.150 | NS | 0.091 | NS |
| BMI-SDS | 0.221 | 0.007 | 0.245 | 0.04 | 0.237 | 0.03 | 0.062 | NS | 0.118 | NS | −0.016 | NS |
| Δ BW-SDS to weight-SDS | 0.190 | 0.02 | 0.236 | 0.05 | 0.201 | NS | 0.039 | NS | 0.153 | NS | −0.063 | NS |
| Waist | 0.215 | 0.01 | 0.235 | 0.05 | 0.225 | 0.05 | 0.092 | NS | 0.168 | NS | 0.079 | NS |
| Hip | 0.217 | 0.01 | 0.270 | 0.03 | 0.163 | NS | 0.149 | NS | 0.287 | 0.02 | 0.030 | NS |
| Waist-to-height ratio | 0.181 | 0.03 | 0.155 | NS | 0.214 | NS | 0.098 | NS | 0.091 | NS | −0.115 | NS |
| LBM | 0.185 | 0.03 | 0.240 | 0.05 | 0.201 | NS | 0.168 | 0.05 | 0.317 | 0.01 | 0.123 | NS |
| FBM | 0.176 | 0.04 | 0.195 | NS | 0.164 | NS | 0.078 | NS | 0.198 | NS | −0.029 | NS |
| Subcutaneous fat | 0.248 | 0.003 | 0.270 | 0.02 | 0.244 | 0.03 | 0.045 | NS | 0.086 | NS | −0.137 | NS |
| Preperitoneal fat | 0.171 | 0.03 | 0.282 | 0.01 | 0.066 | NS | 0.086 | NS | 0.032 | NS | −0.182 | NS |
| Visceral fat | 0.143 | NS | 0.242 | 0.04 | 0.063 | NS | 0.248 | 0.003 | 0.408 | <0.0001 | 0.057 | NS |
| Insulin | 0.103 | NS | −0.041 | NS | 0.241 | 0.03 | 0.167 | 0.05 | 0.178 | NS | 0.249 | 0.03 |
| HOMA-IR | 0.063 | NS | −0.086 | NS | 0.204 | NS | 0.159 | 0.05 | 0.179 | NS | 0.264 | 0.02 |
| Offspring Leukocyte IRS1 Expression | ||||||
|---|---|---|---|---|---|---|
| Offspring at 6yr | All | Boys | Girls | |||
| r | p-Value | r | p-Value | r | p-Value | |
| Weight-SDS | 0.183 | NS | −0.074 | NS | 0.470 | 0.001 |
| Height-SDS | 0.094 | NS | 0.012 | NS | 0.186 | NS |
| BMI-SDS | 0.148 | NS | −0.152 | NS | 0.444 | 0.002 |
| Δ BW-SDS to weight-SDS | 0.028 | NS | −0.177 | NS | 0.283 | 0.05 |
| Waist | 0.120 | NS | −0.230 | NS | 0.460 | 0.002 |
| Hip | 0.025 | NS | −0.207 | NS | 0.258 | NS |
| Waist-to-height ratio | 0.214 | 0.05 | −0.157 | NS | 0.470 | 0.001 |
| LBM | 0.043 | NS | −0.109 | NS | 0.252 | NS |
| FBM | 0.084 | NS | −0.176 | NS | 0.431 | 0.004 |
| Subcutaneous fat | 0.107 | NS | −0.091 | NS | 0.313 | 0.03 |
| Preperitoneal fat | 0.100 | NS | 0.007 | NS | 0.178 | NS |
| Visceral fat | 0.226 | 0.03 | −0.099 | NS | 0.411 | 0.006 |
| Insulin | 0.080 | NS | −0.155 | NS | 0.383 | 0.009 |
| HOMA-IR | 0.066 | NS | −0.144 | NS | 0.335 | 0.02 |
Disclaimer/Publisher’s Note: The statements, opinions and data contained in all publications are solely those of the individual author(s) and contributor(s) and not of MDPI and/or the editor(s). MDPI and/or the editor(s) disclaim responsibility for any injury to people or property resulting from any ideas, methods, instructions or products referred to in the content. |
© 2025 by the authors. Licensee MDPI, Basel, Switzerland. This article is an open access article distributed under the terms and conditions of the Creative Commons Attribution (CC BY) license (https://creativecommons.org/licenses/by/4.0/).
Share and Cite
Gómez-Vilarrubla, A.; Niubó-Pallàs, M.; Mas-Parés, B.; Bonmatí-Santané, A.; Martínez-Calcerrada, J.-M.; López, B.; Peñas-Cruz, A.; de Zegher, F.; Ibáñez, L.; López-Bermejo, A.; et al. Longitudinal Analysis of Placental IRS1 DNA Methylation and Childhood Obesity. Int. J. Mol. Sci. 2025, 26, 3141. https://doi.org/10.3390/ijms26073141
Gómez-Vilarrubla A, Niubó-Pallàs M, Mas-Parés B, Bonmatí-Santané A, Martínez-Calcerrada J-M, López B, Peñas-Cruz A, de Zegher F, Ibáñez L, López-Bermejo A, et al. Longitudinal Analysis of Placental IRS1 DNA Methylation and Childhood Obesity. International Journal of Molecular Sciences. 2025; 26(7):3141. https://doi.org/10.3390/ijms26073141
Chicago/Turabian StyleGómez-Vilarrubla, Ariadna, Maria Niubó-Pallàs, Berta Mas-Parés, Alexandra Bonmatí-Santané, Jose-Maria Martínez-Calcerrada, Beatriz López, Aaron Peñas-Cruz, Francis de Zegher, Lourdes Ibáñez, Abel López-Bermejo, and et al. 2025. "Longitudinal Analysis of Placental IRS1 DNA Methylation and Childhood Obesity" International Journal of Molecular Sciences 26, no. 7: 3141. https://doi.org/10.3390/ijms26073141
APA StyleGómez-Vilarrubla, A., Niubó-Pallàs, M., Mas-Parés, B., Bonmatí-Santané, A., Martínez-Calcerrada, J.-M., López, B., Peñas-Cruz, A., de Zegher, F., Ibáñez, L., López-Bermejo, A., & Bassols, J. (2025). Longitudinal Analysis of Placental IRS1 DNA Methylation and Childhood Obesity. International Journal of Molecular Sciences, 26(7), 3141. https://doi.org/10.3390/ijms26073141