

Stimulus–Secretion Coupling Mechanisms of Glucose-Induced Insulin Secretion: Biochemical Discrepancies Among the Canonical, ADP Privation, and GABA-Shunt Models

Abstract
1. Introduction
- A membrane glucose transporter of high capacity and low affinity (GLUT2, km~15–20 mmol/L) [1] constantly maintains the intracellular (cytosolic) sugar concentration in equilibrium with its plasma concentration.
- Glucokinase (km~4–10 mmol/L) phosphorylates glucose at a much slower rate than GLUT2-mediated uptake without affecting its distribution equilibrium across the plasma membrane [2]. The cooperation between GLUT2 and GK constitutes a glucose sensor that transduces variations of the glucose plasma concentration in proportional rates of its metabolism. Phosphorylated glucose is then metabolized in the known pathways of glycolysis and citric acid cycle, which leads to proportional rates of ATP synthesis in both pathways with predominance of ATP synthesized by the mitochondrial oxidative phosphorylation. This results in an increase in the cellular ATP/ADP ratio.
- Increases in the ATP/ADP ratio are sensed by ATP-dependent K+-channels (K+ATP) of the plasma membrane that respond in opposite directions to ATP and ADP concentrations. The prevalence of ATP closes the channels, whereas ADP opens them, as has been demonstrated. ATP closing of the K+ATP channels suppresses K+-outward diffusion through the plasma membrane, decreases its electrochemical potential, and the membrane depolarizes, increasing its electrical potential to less negative values [3].
- Membrane depolarization activates a voltage-dependent Ca2+-channel that opens and allows the inward diffusion of Ca2+ ions, decreases its electrochemical potential, increasing the β-cell Ca2+ cytoplasmic concentration that occurs as oscillations of variable frequency and amplitude according to the degree of glucose stimulation [4].
- The mechanism of initiation of the insulin secretory response to glucose is subject to debate about the origin of the ATP supply required to close the K+ATP channels by glycolysis or mitochondrial oxidative phosphorylation. This review aims to describe and compare how the different metabolic alternatives of either glycolysis and citric acid cycle support the three known hypothetical models (canonical, ADP privation, and γ-aminobutyrate (GABA)-shunt models) of the stimulus–secretion coupling mechanism of stimulation of insulin secretion. Two recent publications are recommended to anticipate a general knowledge of the ADP privation [5] and GABA-shunt [6] models.
2. β-Cell Glycolysis in the Canonical Model
2.1. Generality
2.2. Islet LDH Activity
- Homogenates of rat pancreatic islets have a high content of mGPDH activity, as compared with other tissues, and this is inhibited by diazoxide [9]. It was concluded that the GPDH shuttle had a key role in the stimulus–secretion coupling of glucose-induced insulin release.
- It has been reported that islet LDH activity is much higher than hexokinase-like activity measured at 1 mM glucose and lower than cytosolic glycerophosphate dehydrogenase [10]. It was hypothesized that “lactate production from glucose is not restricted by the activity of LDH but rather by the availability of its endogenous substrates, cytosolic pyruvate and NADH”. Due to the highest catalytic activity found in the cGPDH, it was suggested that the glycerol phosphate shuttle might allow an efficient reoxidation of the cytoplasmic NADH generated by GAPDH and maintain a high glycolytic flux.
- “LDH activity in isolated β-cells was shown to be 8-fold lower than in islet non-βcells and some 122-fold lower than in liver cells” [11]. The activity ratio LDH/mGPDH measured in primary β-cells was much smaller than in INS-1, HIT-T15, RINm5F, and liver cells. It was suggested that the low LDH/GPDHm ratio might ensure a tight coupling between mitochondrial metabolism and glycolysis in β-cells and that an increase in LDH expression or a decrease in GPDH might lead to a reduced secretory response to glucose.
- Overexpression of LDH-A in isolated MIN6 β-cells by intranuclear cDNA microinjection or adenoviral infection, “diminished the response to glucose of both phases of increases in mitochondrial NAD(P)H, as well as increases in mitochondrial membrane potential, cytosolic free ATP, and cytosolic free Ca2+” [12]. These effects were most pronounced at submaximal glucose levels. The insulin responses to an increase of the glucose concentration from 3 to 11 or 30 mM were considerably reduced. However, the response to a basal glucose concentration (3 mM) was unaffected. The authors concluded that mitochondrial pyruvate oxidation plays a critical role in the stimulation of insulin secretion in the β-cell. It might be also inferred that an increase in β-cell LDHA derives pyruvate metabolism from aerobic to anaerobic glycolysis.
- According to previous studies, β-cells poorly express LDH and the plasma membrane monocarboxylic acid transporter (MCT). Overexpression of LDHA and MCT-1 in INS-1 cells did not affect glucose-induced insulin secretion [13]. However, LDH overexpression allowed external 2 mM uniformly labeled lactate to be metabolized to 14CO2 and stimulate insulin secretion, independently of the co-overexpression of MCT-1. A total of 20 mM lactate stimulated insulin secretion in control and LDHA-overexpressing INS-1 cells, irrespective of the concomitant overexpression of MCT-1. The authors suggest that the low β-cell expression of LDH and MCT-1 might prevent excessive stimulation of insulin secretion by an increase of blood lactate during intense exercise; an unexpected pyruvate stimulation of insulin secretion might also be prevented in primary β-cells.
- LDH is expressed in mammalian cells as tetrameric proteins composed of all the possible combinations of two different M (muscle) and H (heart) subunits. In islet endocrine cells, the homomeric isozymes LDH1 (4H) and LDH5 (4M), codified by the LDHB and LDHA genes, respectively, predominate [14]. Isozyme LDHB is specifically expressed in β-cells and LDHA in α-cells [14,15]. LDHB can be inhibited dose-dependently with the specific inhibitor AXKO-0046, which lacks any effect on LDHA [14]. Isolated human and rodent islets transduced with the β-cell-specific lactate FRET sensor, Ad-RIP-Laconic, were stimulated by an increase of glucose concentration from 3 to 17 mM. The presence of 10 µM AXKO-0046 increased slightly (10–20%) but significantly the stimulation of lactate production by glucose. A total of 10 µM AXKO-0046 did not affect glucose stimulation of the ATP/ADP ratio in human β-cells but partially suppressed both the amplitude and frequency of glucose- and K+-stimulated Ca2+ oscillations. In contrast with AXKO-0046, galloflavin (10 µM), an inhibitor of both LDHA and LDHB, diminished glucose-stimulated lactate production in human β-cells [15]. None of the two LDH inhibitors used (AXKO-0046 and galloflavin) significantly modified 17 mM glucose stimulation of insulin secretion in human β-cells. In apparent discrepancy, 10 µM AXKO-0046 strongly stimulated human β-cell insulin secretion in response to basal (3 mM) glucose but galloflavin had no effect. Some LDHB expression quantitative trait locus (cis-eEQTLs) for decreased LDBH expression is associated with increased fasting insulin concentration [15]. The authors concluded that “LDHA is the major driver of glucose-stimulated lactate generation in human β-cells, and that LDHB limits this effect to maintain lactate within a tight range”.
2.3. Lactate Release by Isolated Rat Islets
2.3.1. Mesaurement of Lactate Release by Incubated Rat and ob/ob Islets
2.3.2. D-Manoheptulose (MH)
3. β-Cell Glycolysis in the ADP Privation Model
4. Different Glycolysis Function in the Postulated Models of Stimulus–Secretion Coupling Mechanism of Glucose-Induced Insulin Secretion
- Substimulatory concentrations of glucose lower than 5 mM are mainly metabolized by anaerobic glycolysis as supported by the quantitative coincidence of the rate of glucose utilization with the rate of lactate production. These experimental data suggest that the omission of mitochondrial pyruvate metabolism does not allow sufficient synthesis of ATP to close K+ATP channels and imposes a threshold for the initiation of insulin secretion by glucose. At substimulatory glucose concentrations, glycolysis is also generating PEP, perhaps increasing its cytosolic concentration. Its failure to stimulate insulin secretion might be attributed to the requirement of a higher PEP concentration at a higher glycolytic rate (above 5 mM glucose) and/or to the cooperative synthesis of mitochondrial PEP in the citric acid cycle once exceeded the rate of pyruvate reduction to lactate. Above 5 mM glucose, both aerobic glycolysis and the citric acid cycle might be coupled and capable of generating both cytosolic and mitochondrial PEP. This idea seems compatible with the canonical and GABA-shunt models of the stimulus–secretion coupling mechanism of glucose-induced insulin release but poses a caveat for the idea that glycolysis is fully responsible for the closure of K+ATP channels by glucose in the ADP privation model.
- 2.
- Another argument supporting the above caveat (paragraph 1 above) is that the “allosteric” activation of PKM2 and PKL by a specific activator (TEPP-46 or PKa) lowers their Km and increases their enzyme activity [22]. In our opinion, PKa activation should be able to increase the glycolytic flux at the last step, despite lowering PKM2 substrate (PEP), as corresponds to a “regulatory enzyme” [24]. The same mechanism explains the beneficial effect of GK activators on insulin secretion in T2D β-cells [28]: as commented in the previous text, the GK activator (piragliatin) increased several metabolic islet parameters at 3 mM glucose. As already known, caution is needed to prevent intense hypoglycemia if the referred enzyme activators are used to treat T2D.
5. Islet Mitochondrial Metabolism in the Canonical Model
5.1. Secretory Activity of Exogenous Pyruvate on Insulin Secretion
5.2. Secretory Activity of Succinic Acid Methyl Esters on Insulin Secretion
6. Islet Mitochondrial Metabolism in the ADP Privation Model
7. Functional Metabolic Alternatives of the Citric Acid Cycle and OxPhos in the Three Models of the Stimulus–Secretion Mechanism of Glucose-Induced Insulin Secretion
- Succinic acid dimethyl ester (SAD) reproduces qualitatively and quantitively the effect of a maximum stimulus of glucose despite skipping glycolysis. However, SAD, at variance with glucose, did not show any threshold effect for stimulating insulin secretion. It is also evident that succinic acid is not a physiological stimulus of insulin secretion, but it supports the idea that direct stimulation of mitochondrial metabolism may trigger a full stimulation of insulin secretion.
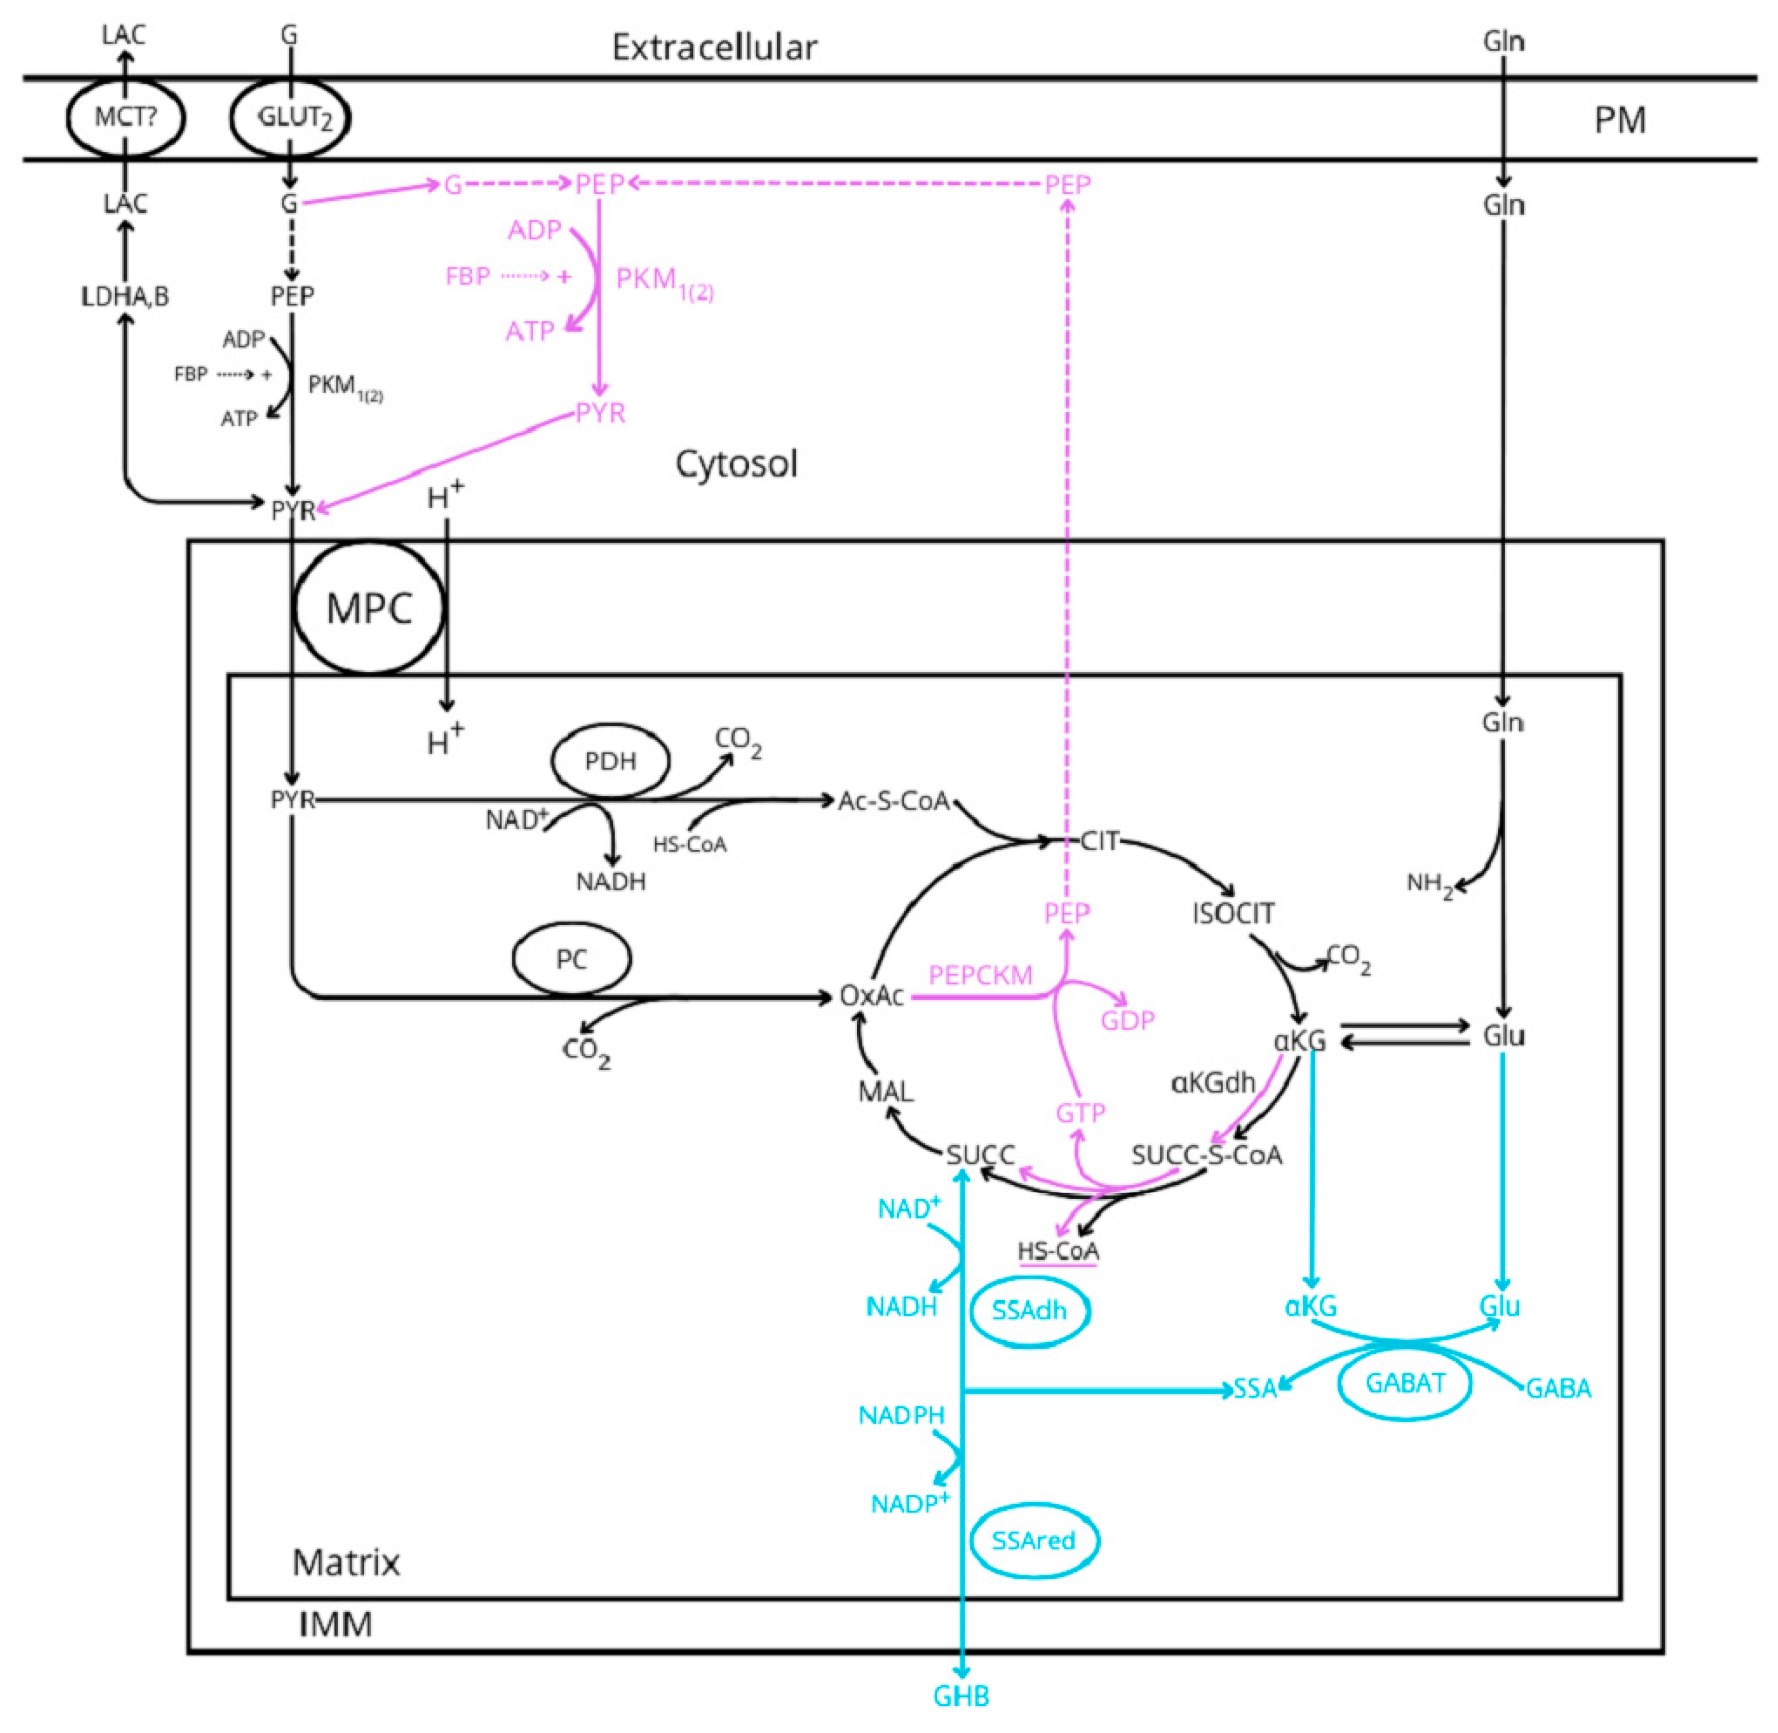
- Our previous proposal of the required use of the GABA-shunt for the oxidative metabolism of glycolytic-derived pyruvate [6] is compatible with the canonical model of the stimulus–secretion coupling of glucose-induced insulin release. However, the GABA-shunt pathway skips the synthesis of PEP by the GTP-dependent succinyl-CoA synthetase. As the “ADP privation” model [22] requires the mitochondrial supply of PEP to sustain the stimulation of insulin secretion by glucose, it would be interesting to know how much the limitation exerted by the low expression of α-ketoglutarate dehydrogenase (αKGdh in Figure 1) allows a significant citric acid cycle flux in the two pathways. It has been demonstrated in INS-1 832/13 cell line and rat islets [46,47] that the intracellular concentration of α-ketoglutarate (αKG or 2-OG) is increased more than 20-fold (more intensively than any other mitochondrial metabolite investigated) at 16.7 mM, as compared with 2.8 mM glucose, strongly supporting a strict control of the cyclic acid cycle flux by the αKGdh in β-cells.
- Even though it is out of the scope of this review, three possible mechanisms responsible for the oscillating behavior of sustained insulin secretion have been proposed. It is debated whether they are attributed to oscillations in the ATP/ADP ratio driven by ADP regulation of mitochondrial OxPhos (ADP privation model) [5], to cytosolic Ca2+ changes inducing cyclic variations of β-ell bioenergetics (canonical model) [48], or to K+ATP conductance oscillations “driving bursting electrical activity and pulsatile insulin secretion” [49].
8. Comments on Some Assertions About the Relative Irrelevance of OxPhos in the Initiation of Glucose Stimulation of Insulin Secretion
9. OxPhos Function Regulation and Its Participation in the Stimulation of Insulin Secretion
- Tamoxifen-inducible β-cell specific knockouts of the respiratory complexes CI, CIII, and CIV “had similar mitochondrial respiratory defects [55]. CIII knockout defects were the most diabetogenic; they caused early hyperglycemia, glucose intolerance, and loss of glucose-stimulated insulin secretion in vivo”. “Paradoxically”, 16.7 mM glucose stimulation of insulin secretion by perifused islets of CIII KO mice was apparently normal. There was also a small difference (p < 0.02) in the percentage of glucose cells responding with mitochondrial [Ca2+] increases to a 16.7 mM glucose stimulus between control and CIII KO cells. However, the biphasic dynamics of insulin secretion exhibited an almost complete loss of the second phase even in the controls. The percentage decrease (with respect to the basal rate) of islet respiration in response to 17 mM glucose was not as straightforward as expected from a complete knockout of the respiratory complexes; moreover, there were no significant differences in the relative (in percentage of the basal rate) rate of maximal respiration among the control and the three groups of knockout islets. The authors suggest that an increased anaerobic glycolysis rate might compensate for the suppressed rate of mitochondrial respiration by an elevated expression of the following mRNAs codifying for enzymes of glycolysis or other related enzymes: Glut2, GK, LDH-A and B, and the plasma membrane monocarboxylate transporter (MCT). However, according to some antecedents commented above, an increased rate of anaerobic glycolysis by LDHA overexpression [12] suppresses the stimulation of insulin secretion in the low glucose concentration range. The finding of downregulated expression of OxPhos complexes in islets from T2D patients suggests that mitochondrial respiration also plays some relevant role in the stimulus–secretion coupling mechanism of glucose stimulation of insulin secretion.
- The use of “sea horse” has uncovered that islet mitochondrial respiration is less coupled to OxPhos than in myocytes [54]. Rat INS1 cells and human islets have a lower degree of respiration uncoupling (around 38%) than mouse islets (between 49 and 59%). Myocytes have a smaller uncoupling degree (23%) than human islets and INS1 cells. The authors consider it counterintuitive that the ATP content of INS1 cells is much higher (more than five-fold) than in myocytes. They conclude that this striking difference might be attributed to the different physiological roles of β-cells (“fuel-sensors”) and myocytes (“fuel utilizers”). It is unknown which is the cellular mechanism regulating mitochondrial uncoupling in β-cells; there is recent evidence that the uncoupling protein 2 (UCP2) does not participate [56]. Perhaps the better the bioenergetic efficiency the higher the cellular ATP content, or the lower the metabolic cost for cellular survival (anaplerosis) the higher the ATP reservoir (cataplerosis). In other words, in our opinion, β-cell regulates its ATP production by ATP supply rather than by ATP demand [5].
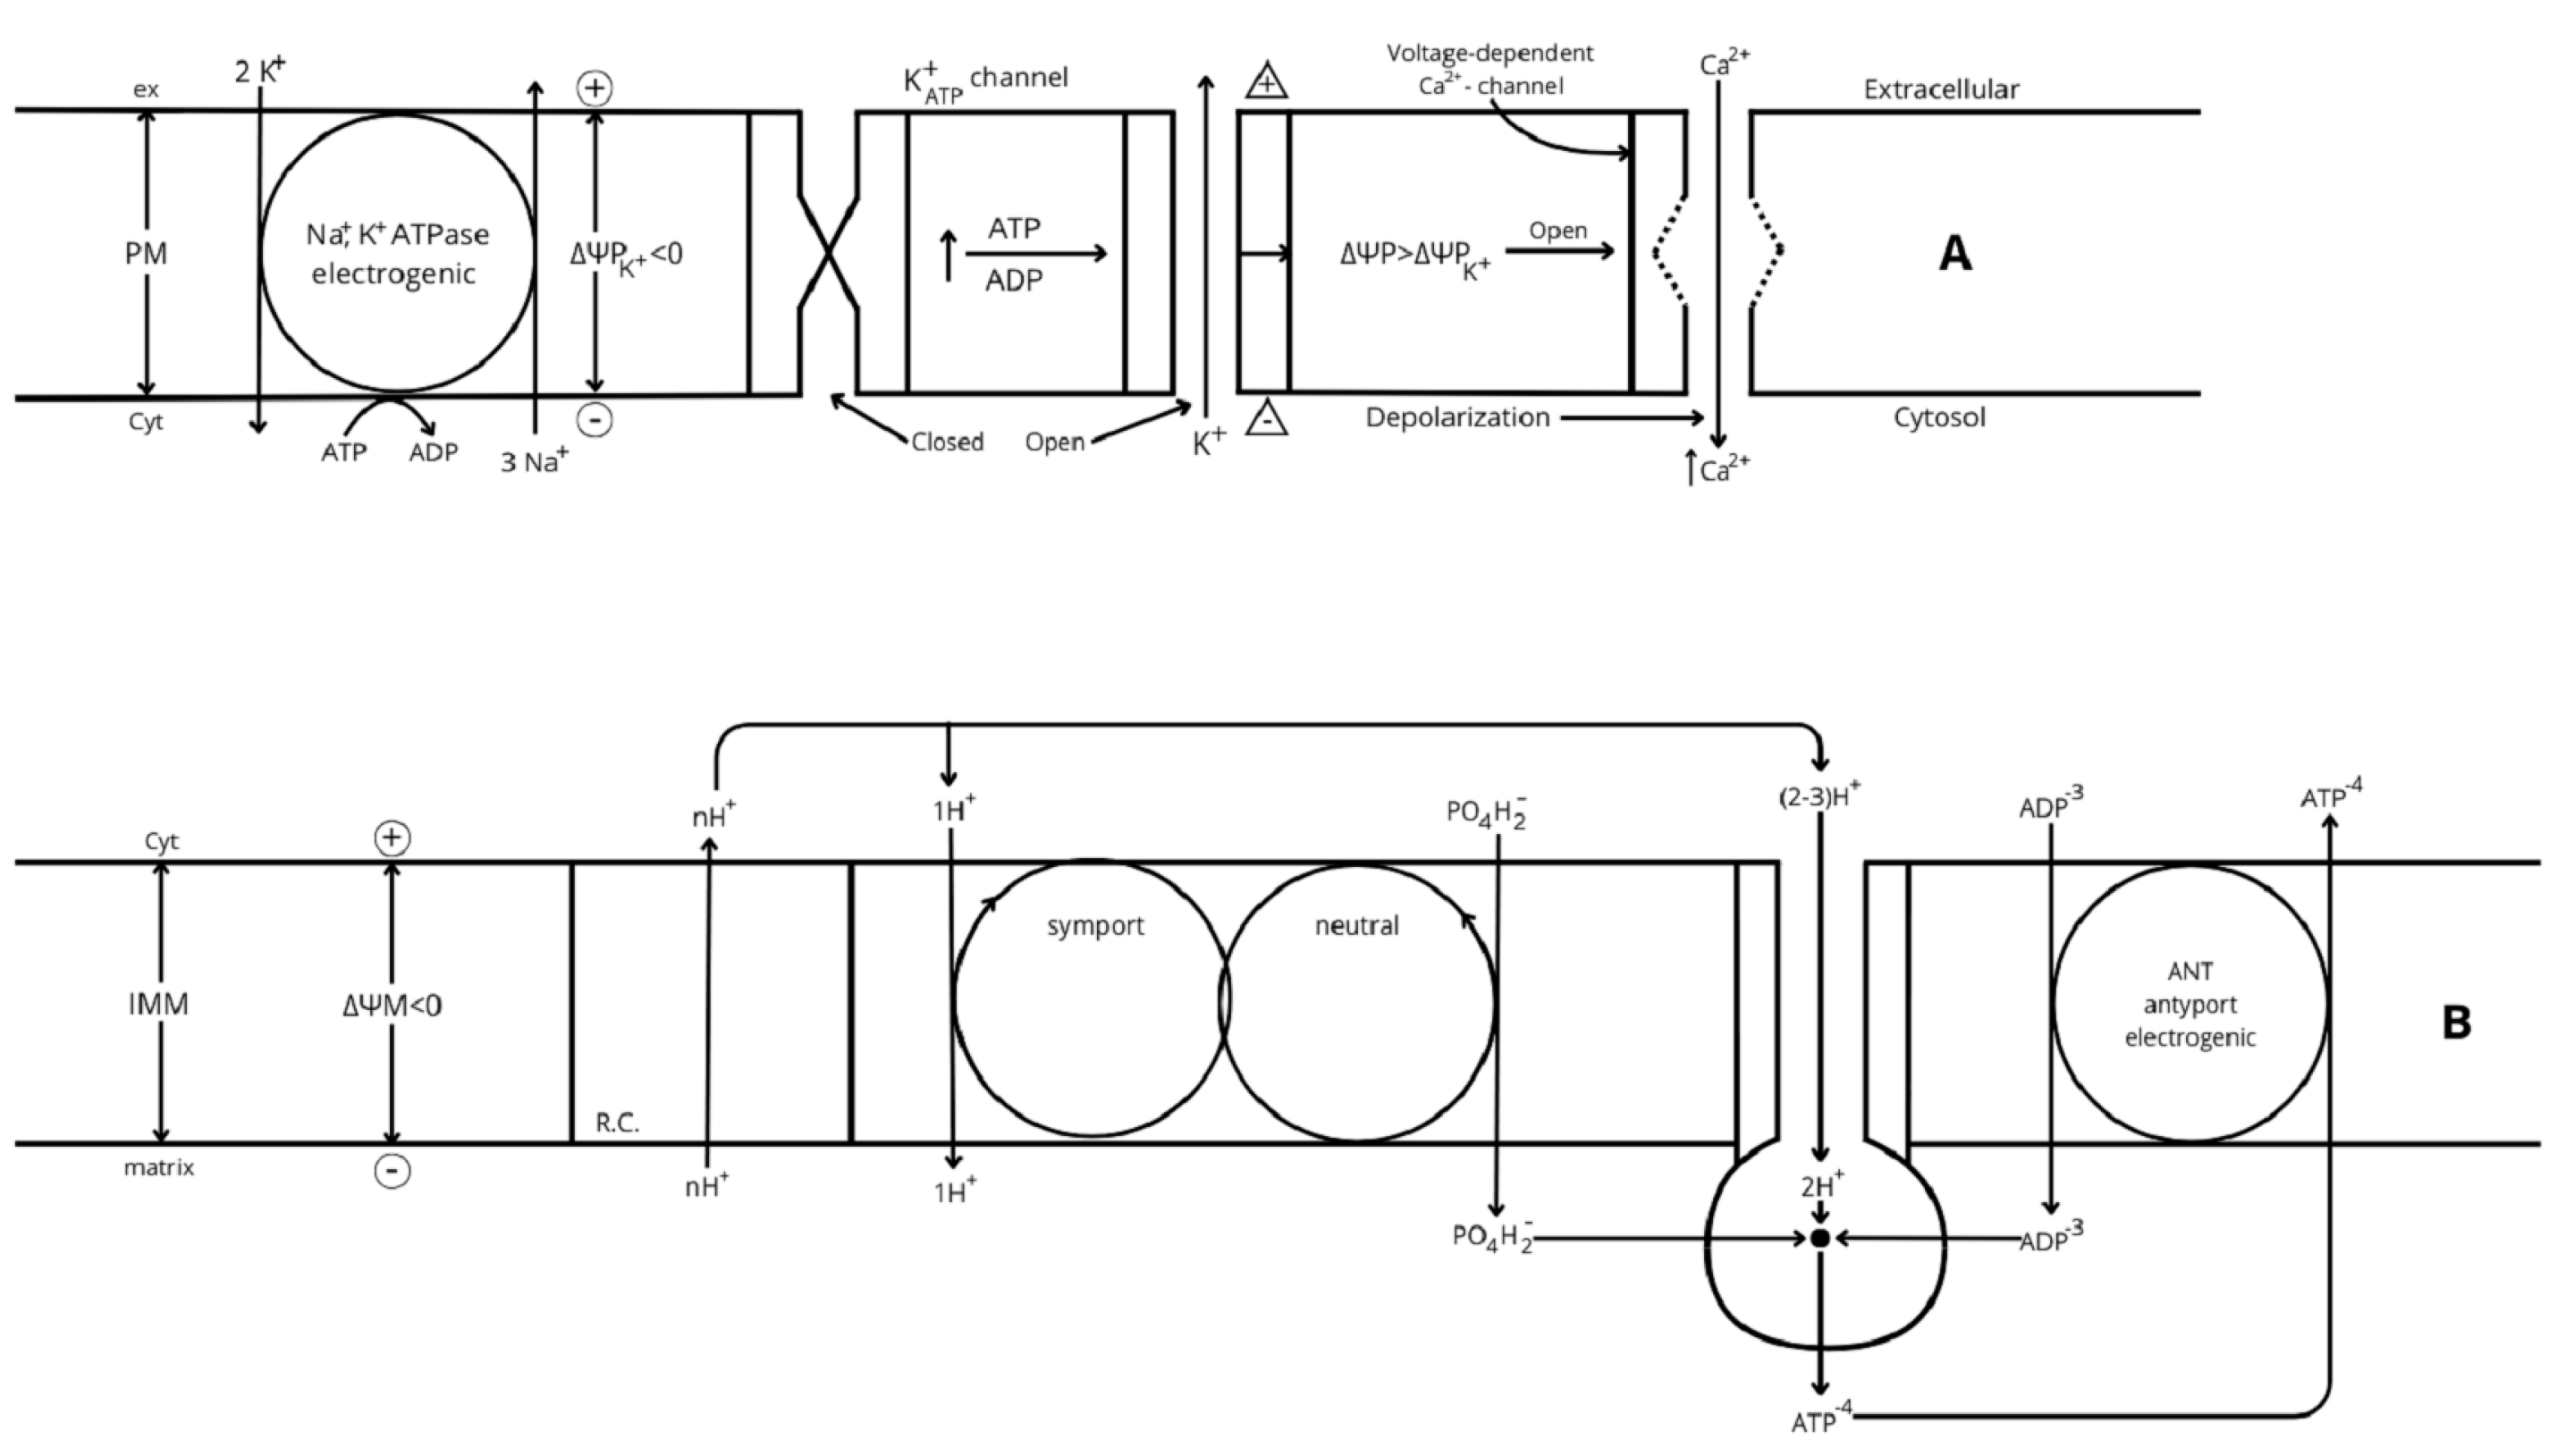
- Gerencser A. A. et al. [57] developed a model of fluorescent probe dynamics allowing the quantitation of the mitochondrial membrane potential (ΔΨM)) in a monolayer culture of individual cells. Δp represents the difference of an electrochemical potential whose value depends on two components: a chemical gradient of [H+] (ΔpH) and an electrical potential (ΔΨM) between matrix and cytosol (Figure 2). Its magnitude depends on the balance between the respiratory efflux of H+ to the cytosol by the respiratory complexes and their return to the matrix mediated by the F1F0-ATP synthase that transduces the energy accumulated in ΔΨM into the synthesis of ATP from matrix ADP + Pi (oxidative phosphorylation, OxPhos) or due to proton leakage (any uncoupling mechanism yet unknown). The regulation of cellular bioenergetics depends on the interaction between three mitochondrial modules: glucose oxidation (measured as oxygen consumption rate (ORC), phosphorylation (ATP synthesis), and proton leak (uncoupled respiration) [50,57].
10. Control of ATP Flux by ATP Demand
- The energetic consumption and dependence of the main ATP-demanding cellular processes on OxPhos [60] have been measured in some mammalian cells (categorized as “fuel utilizers”). The protocol followed was to measure the decrease in OCR induced by the specific inhibition of the different ATP-demanding processes individually. The results uncover a bioenergetic hierarchy in which the higher O2 (ATP) consumers were protein and RNA/DNA synthesis, followed by sodium cycling through the Na+/K+-ATPase, Ca+ ATPase, unidentified ATP consumers, and proton leak. “Together these identified processes account for 94% of the respiration of the cells” [57]. Titrating OCR progressively with myxothiazol (CRIII inhibitor), a scale of dependence of each ATP-demanding (-consumer) process on OxPhos could be determined by examining the decay of each individual process with the inhibition of OCR. The following assumption is made: “inhibition of one ATP consuming process does not stimulate the rate of the others through increases in cellular ATP levels”. All these consumer processes are in turn driven by the energy accumulated as mitochondrial membrane potential (ΔΨM) after its transduction to ATP (OxPhos). OxPhos controls 88% of the total flux through ATP, 20% through substrate oxidation, and 8% through proton leak. Correlatively with the previously defined hierarchy, protein and polynucleotide synthesis were the most sensitive to the ATP supply (30 and 21%, respectively). Sodium and calcium ATPase consumed 14 and 15%, respectively. In our modest opinion, there is not yet any exhaustive investigation of the β-cell bioenergetic needs. What is the position of the variable consumption of the exocytotic mechanism? Is there a need for a “leak” or any other mechanism to adapt on time the secretory ATP supply to the ATP demand? Is the high ATP content of β-cells (fuel “sensor” cells), compared with other “utilizer” cells, a reservoir allowing a fast triggering of insulin secretion once the cytosolic Ca2+ increases?
- Inhibition of mRNA translation
- (a)
- A total of 80 µg/mL puromycin (a translation inhibitor) suppressed by 95% 14C-valine incorporation into total islet protein that was unaffected by the reduction of extracellular calcium; insulin synthesis was assumed to be decreased in a similar percentage [61]. After 30 min exposure of perifused islet to 80 µg/mL puromycin, they were stimulated with 16.7 mM glucose in the absence and presence of 80 µg/mL puromycin. The latter depressed substantially the second phase of insulin secretion. The calculated percentage contribution of newly synthesized to the total insulin released was around 30%. The secretory response of perifused islets to 16.7 mM glucose was directly proportional to the perifusate Ca2+ concentration up to 4 mM. Tolbutamide (around 40 mg/mL) triggered a first phase of secretion and an almost absence of a second phase in the absence or presence of a substimulatory glucose concentration. It would be interesting to know whether variations of extracellular Ca2+ influence islet OCR.
- (b)
- Inhibition of mRNA translation by 5 µM cycloheximide suppresses acutely β-cell respiration in INS-1E cells and mouse islets stimulated by 11 and 28 mM glucose, and the suppression is reversed by an uncoupler of mitochondrial respiration [50]. As expected, cycloheximide suppression of protein synthesis decreases the corresponding ATP demand, and the ATP supply should also be proportionally reduced to reach a new steady state. It is unknown whether this balance is caused by a reduced glucose metabolism or is due to negative feedback by an alteration of the ATP/DP ratio. The fact that neither cycloheximide nor puromycin might exert their effects through unexpected translation inhibition of other proteins cannot be discarded.
11. Control of ATP Flux by Sulfonylureas
- (a)
- Tolbutamide (0.74 mM) inhibited 86Rb+net uptake and increased 22Na+uptake in rat islets in the absence of glucose. It also significantly increased the uptake of 45Ca2+ [62]. The authors attributed the effect to β-cell depolarization. Might the tolbutamide effect be due to an off-target action of the sulfonylurea?
- (b)
- A range of tolbutamide concentration (3–500 µM) was shown to potentiate insulin secretion by a range of glucose concentrations (5.10, 15, and 30 mM) in mouse islets. The sulfonylurea predominantly increased the first phase of insulin secretion. The second phase declined slowly to less than 60% of the peak rate after 10 min of islet perifusion. Tolbutamide’s half-maximum effective concentration was 10 to 30 µM [63]. Islet OCR was significantly increased by 100 µM tolbutamide in a range of glucose concentrations (from 5 to 30 mM). Tolbutamide (30 or 100 µM) lowered islet ATP content significantly at 5 or 10 mM glucose. This might be an example of increased ATP demand at low glucose (5 mM) that cannot be compensated by an increased ATP supply. However, it does not explain the tolbutamide suppressive effect at higher concentrations. Might the cause be related to an off-target effect of plasma membrane depolarization?
- (c)
- A rise of the glucose concentration from 1 to 10 mM glucose increased concomitantly the secretion of insulin and the ATP/ADP ratio in previously cultured mouse islets [64]. A total of 2 µM nimodipine (an inhibitor of voltage-dependent Ca2+ channels) increased the ATP/ADP ratio in a range of stimulatory glucose concentrations (over 6 mM). This unexpected effect of blocking voltage-dependent Ca2+ channels is difficult to reconcile with the expected stimulation of mitochondrial metabolism by a rise of the cytoplasmic Ca2+ concentration after glucose stimulation.
- (d)
- 10 µM glibenclamide significantly suppressed islet ATP and ADP contents in ob/ob islets at 0 mM glucose, and 10 mM glucose abolished its suppressive effect [65]. It had no effect on glucose oxidation in a wide concentration range of sulfonylureas (0.1, 1.0, and 10.0 µM) and glucose concentrations (1.0, 10.0, and 20.0 mM). A total of 20 mM glucose increased the ouabain-sensitive but suppressed the ouabain-resistant 86Rb+ uptake. Glibenclamide increased the ouabain-sensitive 5 min 86Rb+ uptake at 1.0 and 10.0 µM concentrations in the absence of glucose, but there was no additive effect with the addition of 20 mM glucose [66]. Glucose did not stimulate Na+-K+-dependent ATPase in islet homogenates [67]. A total of 1 mM ouabain suppressed progressively in time the ATP content of ob/ob islets at different glucose concentrations (0, 3, and 20 mM); after 30 min of ouabain exposure, the islet ATP content was significantly decreased at all the assayed glucose concentrations [68]. Similar results were obtained by 30 mM KCl at 3 and 20 mM glucose. The authors suggest that the sulfonylurea-induced decrease of islet ATP content is due to the (indirect?) stimulation of the Na+-K+-dependent ATPase by means of the resultant plasma membrane depolarization. If this cannot be confirmed by measuring the glibenclamide effects on mitochondrial ΔΨM, perhaps one might explore a possible off-target effect of the sulfonylurea. In current terms, sulfonylureas seem to decrease OxPhos by an increase in the ATP demand [68].
- (e)
- In β-HC9 cells, the sulfonylurea glyburide, at 5 mM glucose, increased OCR to a minor degree than 30 mM glucose but induced a greater insulin response [69]. 31P-NMR provides estimations of phosphocreatine (PCr) and inorganic phosphate (Pi) in live cells (ADP levels are below the detection limit), and PCr/Pi is a measure of energy state that is correlated with the ATP/ADP/Pi. A study of the 31P-NMR spectra of superfused β-HC9 cells showed that 1 µM glyburide, at 5 mM glucose, decreased cellular phosphocreatine and increased inorganic phosphate levels without affecting ATP content; opposite changes were induced by 30 mM glucose. Similar results were obtained in a 23Na-NMR spectroscopy study: 5 and 30 mM glucose decreased cellular cytosolic Na+, whereas 1µM glyburide, at 5 mM glucose, increased it substantially. Is sulfonylurea-induced Na+ loss caused by a decrease in cytosolic ATP?
- (f)
- In rat islets, 1 µM of the sulfonylurea glibenclamide, at 10 mM glucose, had little effect on cytochrome c reduction, increased OCR, and decreased the “calculated” ATP/ADP/Pi levels by 50% [70]. The authors interpret that glibenclamide ATP suppression is not due to a restriction of substrate availability (poor reduction of cytochrome c by the sulfonylurea as proof) but to a secondary increase of the energy demand triggered by an increased insulin secretion. It is difficult to understand that such a strong suppression of islet adenine nucleotides might be due to a huge increase of any ATP demand processes at a relatively high glucose concentration. One cannot discard that the repeated demonstration of a lowering effect of ATP and the ATP/ADP ratio by sulfonylureas or KCl depolarization might not be exclusively attributed to their capacity to increase insulin secretion.
12. Reported Alterations of the Bioenergetic Control in T2D β-Cells and Islets
- (a)
- Gerencser A.A. [75] performed a bioenergetic study on single β-cells from healthy and T2D humans. An increase of glucose concentration from 3 to 16 mM glucose induced consistently smaller effects on ΔΨP (variation of plasma membrane potential) and ΔΨM (variation of inner mitochondrial membrane potential) in T2D than in control β-cells: ΔΨP was less depolarized and ΔΨM was less hyperpolarized in T2D than in control β-cells. However, secretagogue mixtures of metabolites directly metabolized in the citric acid cycle (methyl-succinate + α-ketoisocaproate, and glutamine + BCH) hyperpolarized ΔΨM to the same extent in T2D as in control islets. A study of the relationship, or dependence, between ΔΨP and ΔΨM using glucose as the unique stimulus demonstrated no difference between the ΔΨP values of T2D and control cells corresponding to identical values of ΔΨM in both types of cells. This means that plasma membrane depolarization (ΔΨP less negative) is not affected in T2D cells. As confirmation, glibenclamide increased a similar ΔΨP depolarization (higher than that induced by glucose), corresponding to the same value of ΔΨM, in both types of cells.
- (b)
- Human T2D islets have a lower expression of the OxPhos gene set than healthy control islets [77]. Rosengren A. H. et al. [78] “identified four risk alleles that associate with impaired β-cell exocytosis and enabled us to form a novel genetic risk score for single β-cell dysfunction that involves impaired granule docking and defective Ca2+ sensitivity of exocytosis”. These two reports show that the cause of the development of T2D diabetes may be multifactorial and not only restricted to OxPhos impairment.
- (c)
- A report by Doliba N.M. et al. [28] demonstrates that piragliatin (RO4389620) is an allosteric GK activator that lowers the Km of the enzyme and increases OCR, usage, oxidation, and cytosolic Ca2+ concentration by/of glucose in a range of concentrations shifted to the left in mouse, rat, and human islets. A total of 3 µM piragliatin rescued the suppressed OCR, the stimulation of insulin secretion, and the cytosolic Ca2+ concentration in response to a staircase stimulus of glucose in T2D islets. What is impressive is that the GK activator was able to potentiate significantly OCR, insulin secretion, and cytosolic Ca2+ at substimulatory glucose concentrations. This experimental finding suggests that a defect in ATP supply, by diminished glucose metabolism, may cause a “diabetic conversion” of islet function. Caution should be taken with this GK activator for the treatment of T2D patients due to its potential to cause hypoglycemia.
Funding
Acknowledgments
Conflicts of Interest
References
- Berger, C.; Zdzieblo, D. Glucose transporters in pancreatic islets. Pflüg. Arch.-Eur. J. Physiol. 2020, 472, 1249–1272. [Google Scholar]
- Matschinsky, F.M.; Wilson, D.F. The central role of glucokinase in glucose homeostasis: A perspective 50 years after demonstrating the presence of the enzyme in islets of Langerhans. Front. Physiol. 2019, 10, 148. [Google Scholar]
- Ashcroft, F.M. KATP channels and the metabolic regulation of insulin secretion in health and disease: The 2022 Banting medal for scientific achievement Award Lecture. Diabetes 2023, 72, 693–702. [Google Scholar] [PubMed]
- Braun, M.; Ramracheya, R.; Bengtsson, M.; Zhang, Q.; Karanauskaite, J.; Partridge, C.; Johnson, P.L.; Rorsman, P. Voltage-gated ion channels in human pancreatic β-Cells: Electrophysiological characterization and role in insulin secretion. Diabetes 2008, 57, 1618–1628. [Google Scholar]
- Merrins, M.J.; Kibbey, R.G. Glucose regulation of β-cell K+ATP channels: It is time for a new model! Diabetes 2024, 73, 856–863. [Google Scholar]
- Tamarit-Rodriguez, J. Metabolic role of GABA in the secretory function of pancreatic β-cells: Its hypothetical implication in β-cell degradation in type 2 diabetes. Metabolites 2023, 13, 697. [Google Scholar] [CrossRef]
- Bricker, D.K. A mitochondrial pyruvate carrier required for pyruvate uptake in yeast, drosophila, and humans. Science 2012, 337, 96–100. [Google Scholar]
- Nagampalli, R.S.K.; Quesñay, J.E.N.; Adamoski, D.; Islam, Z.; Birch, J.; Sebinelli, H.G.; Girard, R.M.B.M.; Ascenção, C.F.R.; Fala, A.M.; Pauletti, B.A.; et al. Human mitochondrial pyruvate carrier 2 as an autonomous membrane transporter. Sci. Rep. 2018, 8, 3510. [Google Scholar]
- MacDonald, M.J. High content of mitochondrial glycerol-3-phosphate dehydrogenase in pancreatic islets and its inhibition by diazoxide. J. Biol. Chem. 1981, 256, 8287–8290. [Google Scholar]
- Jijakli, H.; Rasschaert, J.; Nadi, A.B.; Leclercq-Meyer, V.; Sener, A.; Willy, J. Malaisse Relevance of lactate dehydrogenase activity to the control of oxidative glycolysis in pancreatic islet B-cells. Arch. Biochem. Biophys. 1996, 327, 260–264. [Google Scholar]
- Sekine, N.; Cirulli, V.; Romano Regazzi, R.; Brown, L.J.; Gine, E.; Tamarit-Rodriguez, J.; Girotti, M.; Marie, S.; MacDonald, M.J.; Wollheim, C.B.; et al. Low lactate dehydrogenase and high mitochondrial glycerol phosphate dehydrogenase in pancreatic β-cells. JBC 1994, 269, 4895–4902. [Google Scholar] [CrossRef]
- Ainscow, E.K.; Ainscow, E.K.; Zhao, C.V.; Rutter, G.A. Acute overexpression of lactate dehydrogenase-A perturbs β-cell mitochondrial metabolism and insulin secretion. Diabetes 2000, 49, 1149–1155. [Google Scholar] [CrossRef] [PubMed]
- Ishihara, H.; Wang, H.; Drewes, L.R.; Wollheim, C.B. Overexpression of monocarboxylate transporter and lactate dehydrogenase alters insulin secretory responses to pyruvate and lactate in β cells. J. Clin. Investig. 1999, 104, 1621–1629. [Google Scholar] [CrossRef] [PubMed]
- Shibata, S.; Sogabe, S.; Miwa, M.; Fujimoto, T.; Takakura, N.; Naotsuka, A.; Kitamura, S.; Kawamoto, T.; Soga, T. Identification of the first highly selective inhibitor of human lactate dehydrogenase B. Sci. Rep. 2021, 11, 21353. [Google Scholar] [CrossRef]
- Cuozzo, F.; Viloria, K.; Shilleh, A.H.; Nasteska, D.; Frazer-Morris, C.; Tong, J.; Jiao, Z.; Boufersaoui, A.; Marzullo, B.; Rosoff, D.B.; et al. LDHB contributes to the regulation of lactate levels and basal insulin secretion in human pancreatic β cells. J. Cell Rep. 2024, 43, 114047. [Google Scholar] [CrossRef]
- Ashcroft, S.J.H.; Hedeskov, C.J.; Randle, P.J. Glucose metabolism in mouse pancreatic islets. Biochem. J. 1970, 118, 143–154. [Google Scholar] [CrossRef]
- Sener, A.; Malaisse, W.J. Measurement of lactic acid in nanomolar amounts. Reliability of such a method as an index of glycolysis in pancreatic islets. Biochem. Med. 1976, 15, 34–41. [Google Scholar] [CrossRef]
- Pace, C.S.; Ellerman, J.; Hover, B.A.; Stillings, S.N.; Matschinsky, F.M. Multiple Metabolic Functions of Glucose in Rat Pancreatic Islets. Diabetes 1976, 24, 476–488. [Google Scholar] [CrossRef]
- Simonides, W.S.; Zaremba, R.; Van Hardeveld, C.; Van der Laarse, W. A non enzymatic method for the determination of picomol amounts of lactate using HPLC: Its application to signal muscle fibers. Anal. Biochem. 1988, 169, 268–273. [Google Scholar] [CrossRef]
- Tamarit-Rodriguez, J.; Idahl, L.-Å.; Giné, E.; Alcázar, O.; Sehlin, J. Lactate production in pancreatic islets. Diabetes 1998, 47, 1219–1223. [Google Scholar] [CrossRef]
- Hellman, B. Studies in obese-hyperglycemic mice. Ann. N. Y. Acad. Sci. 1965, 131, 541–558. [Google Scholar] [CrossRef] [PubMed]
- Lewandowski, S.L.; Cardone, R.L.; Foster, H.R.; Ho, T.; Potapenko, E.; Poudel, C.; VanDeusen, H.R.; Sdao, S.M.; Alves, T.C.; Zhao, X.; et al. Pyruvate kinase controls signal strength in the insulin secretory pathway. Cell Metab. 2020, 32, 736–750. [Google Scholar] [CrossRef] [PubMed]
- Anastassiou, D.; Yu, Y.; Israelsen, W.J.; Jiang, J.-K.; Boxer, M.B.; Hong, B.S.; Tempel, W.; Dimov, S.; Shen, M.; Jha, A.; et al. Pyruvate kinase M2 activators promote tetramer formation and suppress tumorigenesis. Nat. Chem. Biol. 2012, 8, 839–847. [Google Scholar] [CrossRef]
- Newsholme, E.A.; Start, C. Regulation in Metabolism; John Wiley & Sons: Hoboken, NJ, USA, 1973; Chapter 1; p. 15. [Google Scholar]
- Tavoulari, S.; Thangaratnarajah, C.; Mavridou, V.; Harbour, M.E.; Jean-Claude Martinou, J.-C.; Kunji, E.R.S. The yeast mitochondrial pyruvate carrier is a hetero-dimer in its functional state. EMBO J. 2019, 38, e100785. [Google Scholar] [CrossRef]
- Zao, C.; Wilson, M.C.; Schuit, F.; Halestrap, A.P.; Rutter, G.A. Expression and distribution of lactate/monocarboxylate transporter isoforms in pancreatic islets and the exocrine pancreas. Diabetes 2001, 50, 361–366. [Google Scholar] [CrossRef]
- Granja, S.; Tavares-Valente, D.; Queirós, O.; Baltazar, F. Value of pH regulators in the diagnosis, prognosis and treatment of cancer. Semin. Cancer Biol. 2017, 43, 17–34. [Google Scholar] [CrossRef]
- Doliba, N.M.; Qin, W.; Najafi, H.; Liu, C.; Buettger, C.W.; Sotiris, J.; Collins, H.W.; Li, C.; Stanley, C.A.; Wilson, D.F.; et al. Glucokinase activation repairs defective bioenergetics of islets of Langerhans isolated from type 2 diabetics. Am. J. Physiol. Endocrinol. Metab. 2012, 302, E87–E102. [Google Scholar] [CrossRef]
- Sener, A.; Kawazu, S.; Hutton, J.C.; Boschero, A.C.; Devis, G.; Somers, G.; Herchuelz, A.; Malaise, W.M. The stimulus-secretion coupling of glucose-induced insulin release. Effect of exogenous pyruvate on islet function. Biochem. J. 1978, 176, 217–232. [Google Scholar] [CrossRef]
- Mertz, R.J.; Worley, J.F., III; Spencer, B.; Johnson, J.H.; Dukes, I.D. Activation of stimulus-secretion coupling in pancreatic β-cells by specific products of glucose metabolism. Evidence for privileged signaling by glycolysis. J. Biol. Chem. 1996, 271, 4838–4845. [Google Scholar] [CrossRef]
- Zawalich, W.S.; Zawalich, K.C. Influence of pyruvic acid methyl ester on rat pancreatic islets. Effects on insulin secretion, phosphoinositide hydrolysis, and sensitization of the beta cell. JBC 1997, 1272, 3527–3531. [Google Scholar] [CrossRef]
- MacDonald, M.J.; Fahien, L.A. Glyceraldehyde phosphate and methyl esters of succinic acid. Two “new” potent insulin secretagogues. Diabetes 1988, 37, 997–999. [Google Scholar] [PubMed]
- MacDonald, M.J.; Fahien, L.A.; Mertz, R.J.; Rana, R.S. Effect of esters of succinic acid and other citric acid cycle intermediates on insulin release and inositol phosphate formation by pancreatic islets. Arch. Biochem. Biophys. 1989, 269, 400–406. [Google Scholar]
- MacDonald, M.J. Metabolism of the insulin secretagogue methyl succinate by pancreatic islets. Arch. Biochem. Biophys. 1993, 300, 201–205. [Google Scholar] [PubMed]
- MacDonald, M.J. Differences between mouse and rat pancreatic islets: Succinate responsiveness, malic enzyme, and anaplerosis. Am. J. Physiol. Endocrinol. Metab. 2002, 283, E302–E310. [Google Scholar]
- Zawalich, W.S.; Zawalich, K.C. Biochemical mechanisms involved in monomethylsuccinate-induced insulin secretion. Endocrinolgy 1992, 131, 6491654. [Google Scholar]
- Zawalich, W.S.; Zawalich, K.C.; Cline, G.; Shulman, G.; Rasmussen, H. Comparative effects of monomethylsuccinate and glucose on insulin secretion from perifused rat islets. Diabetes 1993, 42, 843–850. [Google Scholar]
- Malaisse, W.J.; Rasschaert, J.; Villanueva-Penacarrillo, M.L.; Valverde, I. Respiratory, ionic, and functional effects of succinate esters in pancreatic islets. Am. J. Physiol. Endocrinol. Metab. 1993, 264, E428–E433. [Google Scholar] [CrossRef]
- Mukala-Nsengu, A.; Fernández-Pascual, S.; Martín, F.; Martín-del-Río, R.; Tamarit-Rodriguez, J. Similar effects of succinic aid dimethyl ester and glucose on islet calcium oscillations and insulin release. Biochem. Pharmacol. 2004, 67, 981–988. [Google Scholar]
- Stark, R.; Pasquel, F.; Turcu, A.; Pongratz, R.L.; Roden, M.; Cline, G.W.; Shulman, G.I.; GKibbey, R.G. Phosphoenolpyruvate cycling via mitochondrial phosphoenolpyruvate carboxykinase links anaplerosis and mitochondrial GTP with insulin secretion. J. Biol. Chem. 2009, 284, 26578–26590. [Google Scholar]
- Kibbey, R.G.; Pongratz, R.L.; Romanelli, A.J.; Wollheim, C.W.; Cline, G.W.; Shulman, G.I. Mitochondrial GTP regulates glucose-stimulated insulin secretion. Cell Metab. 2007, 5, 253–264. [Google Scholar]
- Jesinkey, S.R.; Madiraju, A.K.; Alves, T.C.; Yarborough, O.H.; Cardone, R.L.; Zhao, X.; Parsaei, Y.; Nasiri, A.R.; Butrico, G.; Liu, X.; et al. Mitochondrial GTP links nutrient sensing to β cell health, mitochondrial morphology, and insulin secretion independent of OxPhos. Cell Rep. 2019, 28, 759–772. [Google Scholar] [PubMed]
- Abulizi, A.; Cardone, R.L.; Stark, R.; Lewandowski, S.L.; Zhao, X.; Hillion, J.; Ma, L.; Andrews, Z.B.; Mason, G.F.; Rinehart, J.; et al. Multi-tissue acceleration of the mitochondrial phosphoenolpyruvate cycle improves whole-body metabolic health. Cell Rep. 2020, 32, 751–766. [Google Scholar]
- Chatertton, T.A.; Reynolds, C.H.; Lazarus, N.R.; Pogson, C.I. The role of phosphoenolpyruvate in insulin secretion: The effect of L-phenylalanine. Experientia 1984, 40, 1426–1427. [Google Scholar]
- Pizarro-Delgado, J.; Deeney, J.T.; Corkey, B.E.; Tamarit-Rodriguez, J. Direct stimulation of islet insulin secretion by glycolytic and mitochondrial metabolites in KCl-depolarized islets. PLoS ONE 2016, 11, e0166111. [Google Scholar]
- Spegel, P.; Andersson, L.E.; Storm, P.; Sharoyko, V.; Göhring, I.; Rosengren, A.H.; Muld, H. Unique and shared metabolic regulation in clonal β-cells and primary islets derived from rat revealed by metabolomics analysis. Endocrinology 2015, 156, 1995–2005. [Google Scholar]
- Nicholls, D.G. The pancreatic β-cell: A bioenergetic perspective. Physiol. Rev. 2016, 96, 1385–1447. [Google Scholar]
- Rutter, G.A.; Sweet, I.R. Glucose regulation of β-cell K+ATP channels: Is a new model needed? Diabetes 2024, 73, 849–855. [Google Scholar]
- Marinelli, M.; Thompson, B.M.; Parekh, V.S.; Fletcher, P.A.; Gerardo-Giorda Sherman, L.A.S.; Satin, L.S.; Bertram, R. Oscillations in K(ATP) conductance drive slow calcium oscillations in pancreatic β-cells. Biophys. J. 2022, 121, 1449–1464. [Google Scholar]
- Affourtit, C.; Alberts, B.; Barlow, J.; Carré, J.E.; Wynne, A.G. Control of pancreatic β-cell bioenergetics. Biochem. Soc. Trans. 2018, 46, 555–564. [Google Scholar] [CrossRef]
- Wu, C.Y.; Tso, S.-C.; Chuang, J.L.; Gui, W.-J.; Lou, M.; Sharma, G.; Khemtong, C.; Qi, X.; Wynn, R.M.; Chuang, D.T. Targeting hepatic pyruvate dehydrogenase kinases restores insulin signaling and mitigates ChREBP-mediated lipogenesis in diet-induced obese mice. Mol. Metab. 2018, 12, 12–24. [Google Scholar]
- Akhmedov, D.; De Marchi, U.; Wollheim, C.B.; Wiederkehr, A. Pyruvate dehydrogenase E1α phosphorylation is induced by glucose but does not control metabolism-secretion coupling in INS-1E clonal β-cells. Biochim. Biophys. Acta 2012, 1823, 1815–1824. [Google Scholar] [PubMed]
- Halestrap, A.P. The Mitochondrial Pyruvate Carrier. Kinetics and specificity for substrates and inhibitors. Biochem. J. 1978, 148, 85–96. [Google Scholar]
- Mann, W.R.; Dragland, C.J.; Vinluan, C.C.; Vedananda, T.R.; Bell, P.A.; Aicher, T.D. Diverse mechanisms of inhibition of pyruvate dehydrogenase kinase by structurally distinct inhibitors. Biochim. Biophys. Acta 2000, 1480, 283–292. [Google Scholar] [PubMed]
- Lang, A.L.; Nissanka, N.; Louzada, R.-A.; Tamayo, A.; Pereira, E.; Moraes, C.T.; Caicedo, A. A defect in mitochondrial complex III but not in complexes I or IV causes early β-cell dysfunction and hyperglycemia in mice. Diabetes 2023, 72, 1262–1276. [Google Scholar]
- Schwenke, W.-D.; Soboll, S.; Seitz, H.J.; Sies, H. Mitochondrial and cytosolic ATP/ADP ratios in rat liver in vivo. Biochem. J. 1981, 200, 405–408. [Google Scholar]
- Wikstrom, J.D.; Sereda, S.B.; Stiles, L.; Elorza, A.; Allister, E.M.; Neilson, A.; Ferrick, D.A.; Wheeler, M.B.; Shirihai, O.S. A novel high-throughput assay for islet respiration reveals uncoupling of rodent and human islets. PLoS ONE 2012, 7, e33023. [Google Scholar]
- Gerencser, A.A.; Chinopoulos, C.; Birket, M.B.; Jastroch, M.; Vitelli, C.; Nicholls, D.G.; Brand, M.D. Quantitative measurement of mitochondrial membrane potential in cultured cells: Calcium-induced de- and hyperpolarization of neuronal mitochondria. J. Physiol. 2012, 590, 2845–2871. [Google Scholar]
- Gerencser, A.A.; Mookerjee, S.A.; Jastroch, M.; Brand, M.D. Positive feedback amplifies the response of mitochondrial membrane potential to glucose concentration in clonal pancreatic beta cells. Biochim. Biophys. Acta 2017, 1863, 1054–1065. [Google Scholar]
- Buttgereit, F.; Brandt, M.D. A hierarchy of ATP-consuming processes in mammalian cells. Biochem. J. 1995, 312, 163–167. [Google Scholar]
- Curry, D.L.; Bennett, L.; Grodsky, G.M. Dynamics of insulin secretion by the perfused rat pancreas. Endocrinology 1968, 83, 572–584. [Google Scholar]
- Kawazu, S.; Sener, A.; Couturier, E.; Malaisse, W.J. Metabolic, cationic and secretory effects of hypoglycemic sulfonylureas in pancreatic islets. Naunyn-Schmiedeberg’s Arch. Pharmacol. 1980, 312, 277–283. [Google Scholar]
- Panten, U.; Zünkler, B.J.; Scheit, S.; Kirchhoff, K.; Lenzen, S. Regulation of energy metabolism in pancreatic islets by glucose and tolbutamide. Diabetologia 1986, 29, 648–654. [Google Scholar] [PubMed]
- Detimary, P.; Gilon, P.; Henquin, J.-C. Interplay between cytoplasmic Ca2+ and the ATP/ADP ratio: A feedback control mechanism in mouse pancreatic islets. Biochem. J. 1998, 333, 269–274. [Google Scholar] [PubMed]
- Elmi, A.; Idahl, L.Å.; Sehlin, J. Relationships between the Na+/K+ pump and ATP and ADP content in mouse pancreatic islets: Effects of meglitinide and glibenclamide. Brit. J. Pharmacol. 2000, 131, 1700–1706. [Google Scholar]
- Elmi, A.; Idahl, L.Å.; Sehlin, J. Modulation of β-cell ouabain-sensitive 86Rb+ influx (Na+/K+ pump) by D-glucose, glibenclamide or diazoxide. Int. Jnl. Exp. Diab. Res. 2001, 1, 265–274. [Google Scholar]
- Elmi, A.; Idahl, L.-Å.; Sandström, P.-E.; Sehlin, J. D-glucose stimulates the Na+/K+ pump in mouse pancreatic islet cells. Int. Jnl. Exp. Diab. Res. 2000, 1, 155–164. [Google Scholar]
- Elmi, A.; Elmi, A.; Idahl, L.Å.; Sehlin, J. Modulation of islet ATP content by inhibition or stimulation of the Na+/K+ pump. Eur. J Pharmacol. 2001, 426, 139–143. [Google Scholar]
- Doliba, N.M.; Vatamaniuk, M.Z.; Buettger, C.W.; Qin, W.; Collins, H.W.; Wehrli, S.L.; Carr, R.D.; Matschinsky, F.M. Differential effects of glucose and glyburide on energetics and Na+ levels of βHC9 cells. Nuclear magnetic resonance spectroscopy and respirometry studies. Diabetes 2003, 52, 394–402. [Google Scholar]
- Sweet, I.R.; Cook, D.L.; DeJulio, E.; Wallen, A.R.; Khalil, G.; Callis, J.; Reems, J.A. Regulation of ATP/ADP in pancreatic islets. Diabetes 2004, 53, 401–409. [Google Scholar]
- Pizarro-Delgado, J.; Fasciani, I.; Temperan, A.; Romero, M.; González-Nieto, D.; Alonso-Magdalena, P.; Nualart-Marti, A.; Estil’les, E.; Paul, D.L.; Martín-del-Río, R.; et al. Inhibition of connexin 36 hemichannels by glucose contributes to the stimulation of insulin secretion. Am. J. Physiol. Endocrinol. Metab. 2014, 306, E1354–E1366. [Google Scholar]
- Pizarro-Delgado, J.; Deeney, J.T.; Martín-del-Río, R.; Corkey, B.E.; Tamarit-Rodriguez, J. KCl-Permeabilized pancreatic islets: An experimental model to explore the messenger role of ATP in the mechanism of insulin Secretion. PLoS ONE 2015, 10, e0140096. [Google Scholar] [CrossRef]
- Bavamian, S.; Pontes, H.; Cancela, J.; Charollais, A.; Startchik, S.; Van De Ville, D.; Meda, P. The intercellular synchronization of Ca2+ oscillations evaluates Cx36-dependent coupling. PLoS ONE 2012, 7, e41535. [Google Scholar] [CrossRef] [PubMed]
- Puginier, E.; Leal-Fischer, K.; Gaitan, J.; Lallouet, M.; Scotti, P.-A.; Raoux, M.; Lang, J. Extracellular electrophysiology on clonal human β-cell spheroids. Front. Endocrinol. 2024, 15, 1402880. [Google Scholar]
- Gerencser, A.A. Bioenergetic analysis of single pancreatic β-cells indicates an impaired metabolic signature in type 2 diabetic subjects. Endocrinology 2015, 156, 3496–3503. [Google Scholar]
- Anello, M.; Lupi, R.; Spampinato, D.; Piro, S.; Masini, M.; Boggi Del Prato, U.S.; Rabuazzo, A.M.; Purrello, F.; Marchetti, P. Functional and morphological alterations of mitochondria in pancreatic beta cells from type 2 diabetic patients. Diabetología 2005, 48, 282–289. [Google Scholar]
- Olsson, A.H.; Yang, B.T.; Hall, E.; Taneera, J.; Salehi, A.; Nitert, M.-D.; Ling, C. Decreased expression of genes involved in oxidative phosphorylation in human pancreatic islets from patients with type 2 diabetes. Eur. J. Endocrinol. 2011, 165, 589–595. [Google Scholar]
- Rosengren, A.H.; Braun, M.; Mahdi, T.; Andersson, S.A.; Travers, M.E.; Shigeto, M.; Zhang, E.; Almgren, P.; Ladenvall, C.; Axelsson, A.S.; et al. Reduced insulin exocytosis in human pancreatic β-cells with gene variants linked to type 2 diabetes. Diabetes 2012, 61, 1726–1733. [Google Scholar]
Disclaimer/Publisher’s Note: The statements, opinions and data contained in all publications are solely those of the individual author(s) and contributor(s) and not of MDPI and/or the editor(s). MDPI and/or the editor(s) disclaim responsibility for any injury to people or property resulting from any ideas, methods, instructions or products referred to in the content. |
© 2025 by the author. Licensee MDPI, Basel, Switzerland. This article is an open access article distributed under the terms and conditions of the Creative Commons Attribution (CC BY) license (https://creativecommons.org/licenses/by/4.0/).
Share and Cite
Tamarit-Rodriguez, J. Stimulus–Secretion Coupling Mechanisms of Glucose-Induced Insulin Secretion: Biochemical Discrepancies Among the Canonical, ADP Privation, and GABA-Shunt Models. Int. J. Mol. Sci. 2025, 26, 2947. https://doi.org/10.3390/ijms26072947
Tamarit-Rodriguez J. Stimulus–Secretion Coupling Mechanisms of Glucose-Induced Insulin Secretion: Biochemical Discrepancies Among the Canonical, ADP Privation, and GABA-Shunt Models. International Journal of Molecular Sciences. 2025; 26(7):2947. https://doi.org/10.3390/ijms26072947
Chicago/Turabian StyleTamarit-Rodriguez, Jorge. 2025. "Stimulus–Secretion Coupling Mechanisms of Glucose-Induced Insulin Secretion: Biochemical Discrepancies Among the Canonical, ADP Privation, and GABA-Shunt Models" International Journal of Molecular Sciences 26, no. 7: 2947. https://doi.org/10.3390/ijms26072947
APA StyleTamarit-Rodriguez, J. (2025). Stimulus–Secretion Coupling Mechanisms of Glucose-Induced Insulin Secretion: Biochemical Discrepancies Among the Canonical, ADP Privation, and GABA-Shunt Models. International Journal of Molecular Sciences, 26(7), 2947. https://doi.org/10.3390/ijms26072947