
Harnessing Plasma Biomarkers to Predict Immunotherapy Outcomes in Hepatocellular Carcinoma: The Role of cfDNA, ctDNA, and Cytokines

 , , , , ,
Abstract

1. Introduction
2. Results
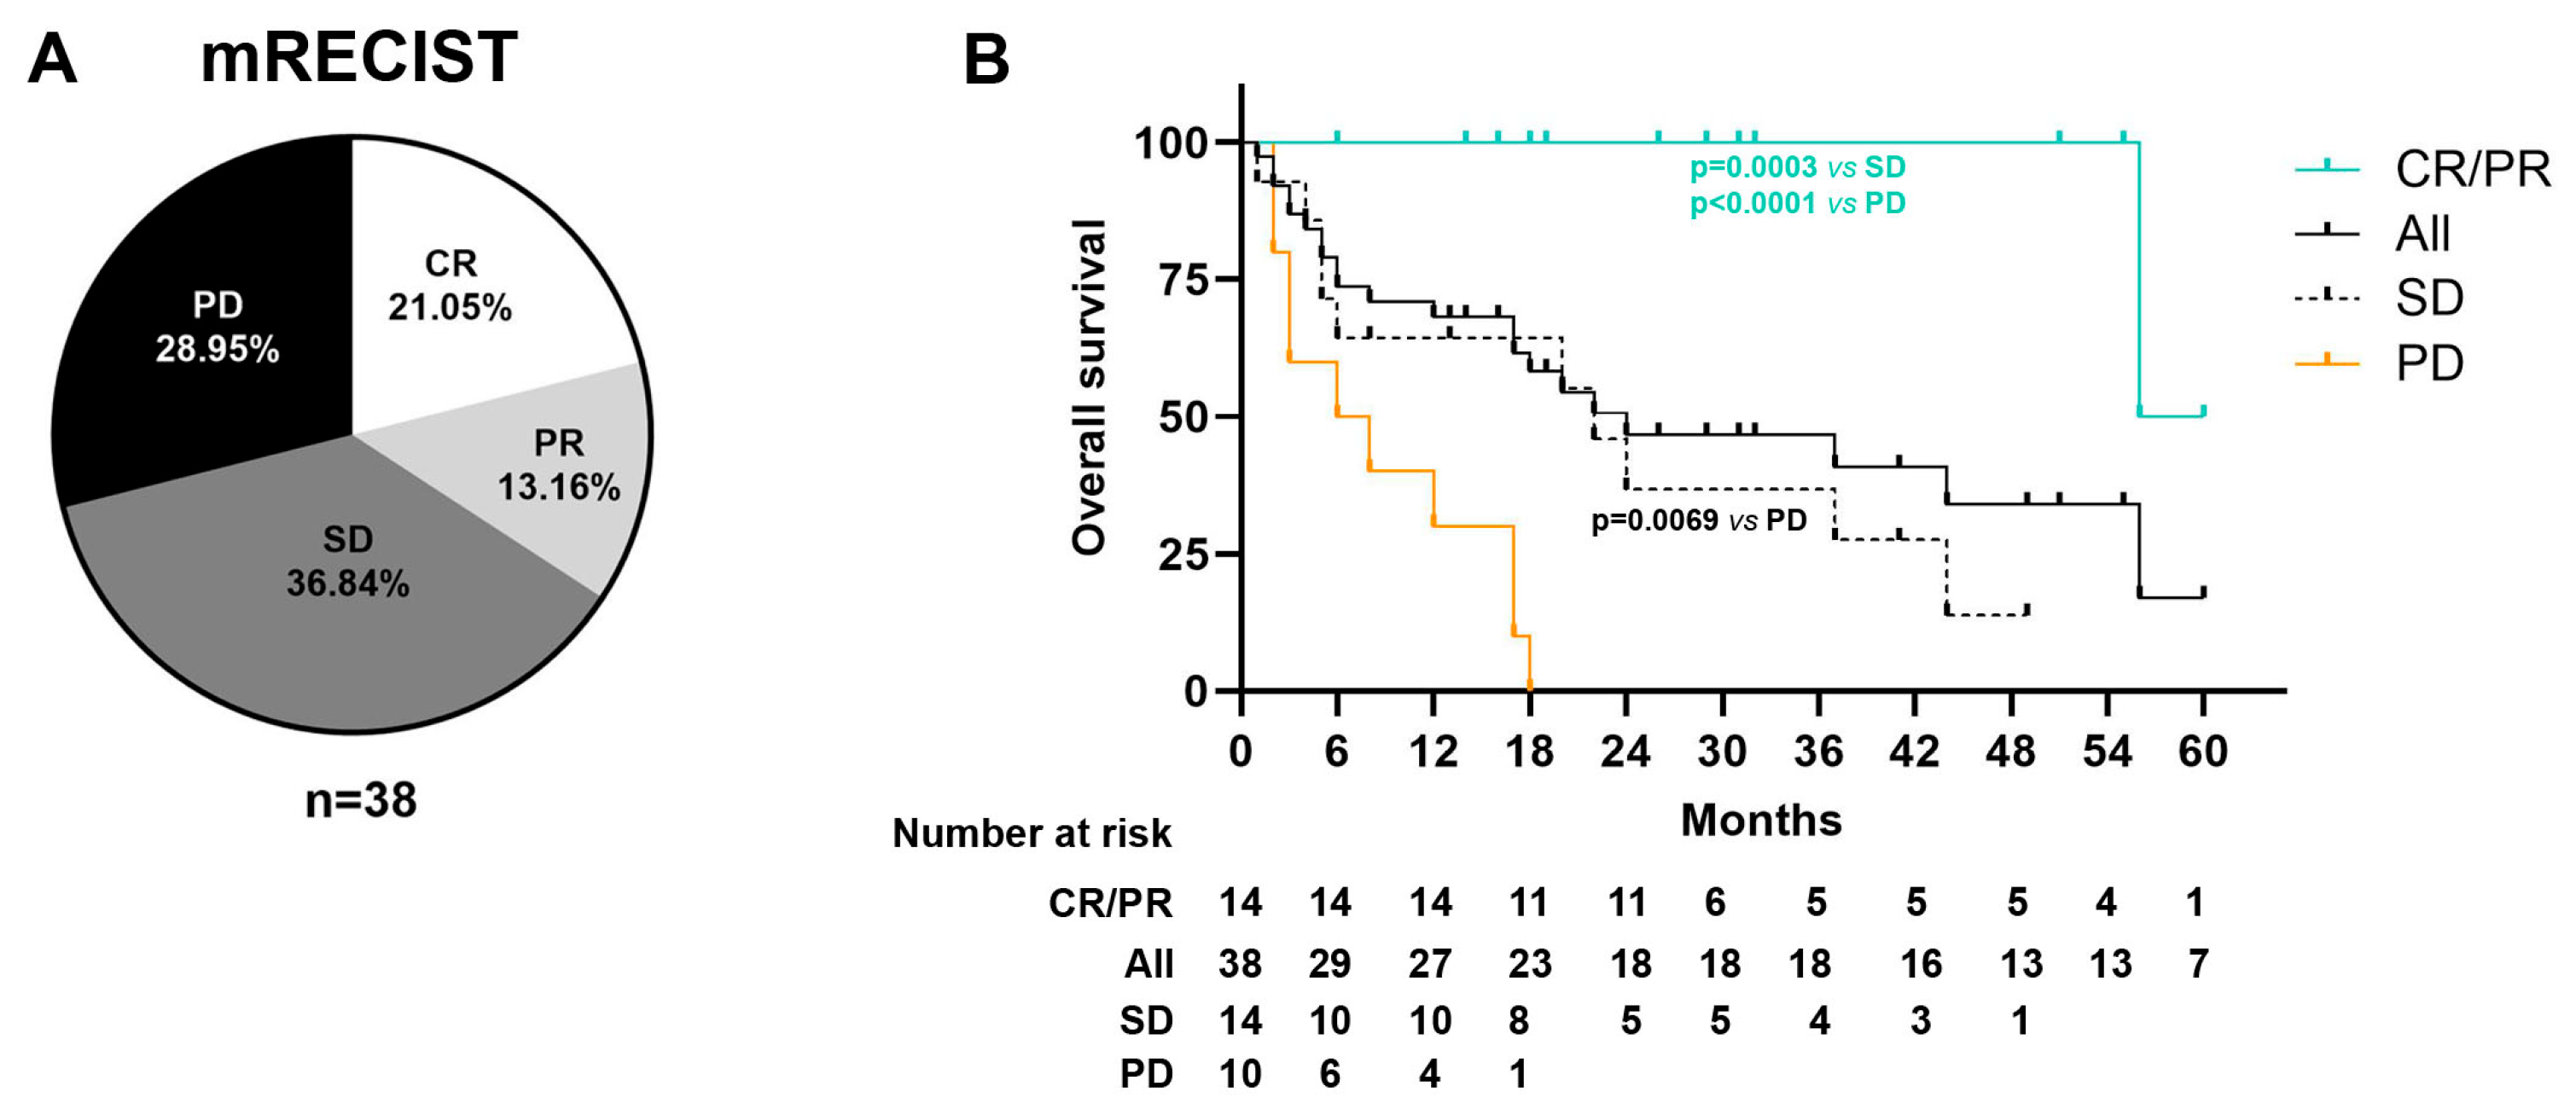
2.1. Patient Characteristics
2.2. Immune-Related Adverse Events (irAEs)
2.3. cfDNA Levels
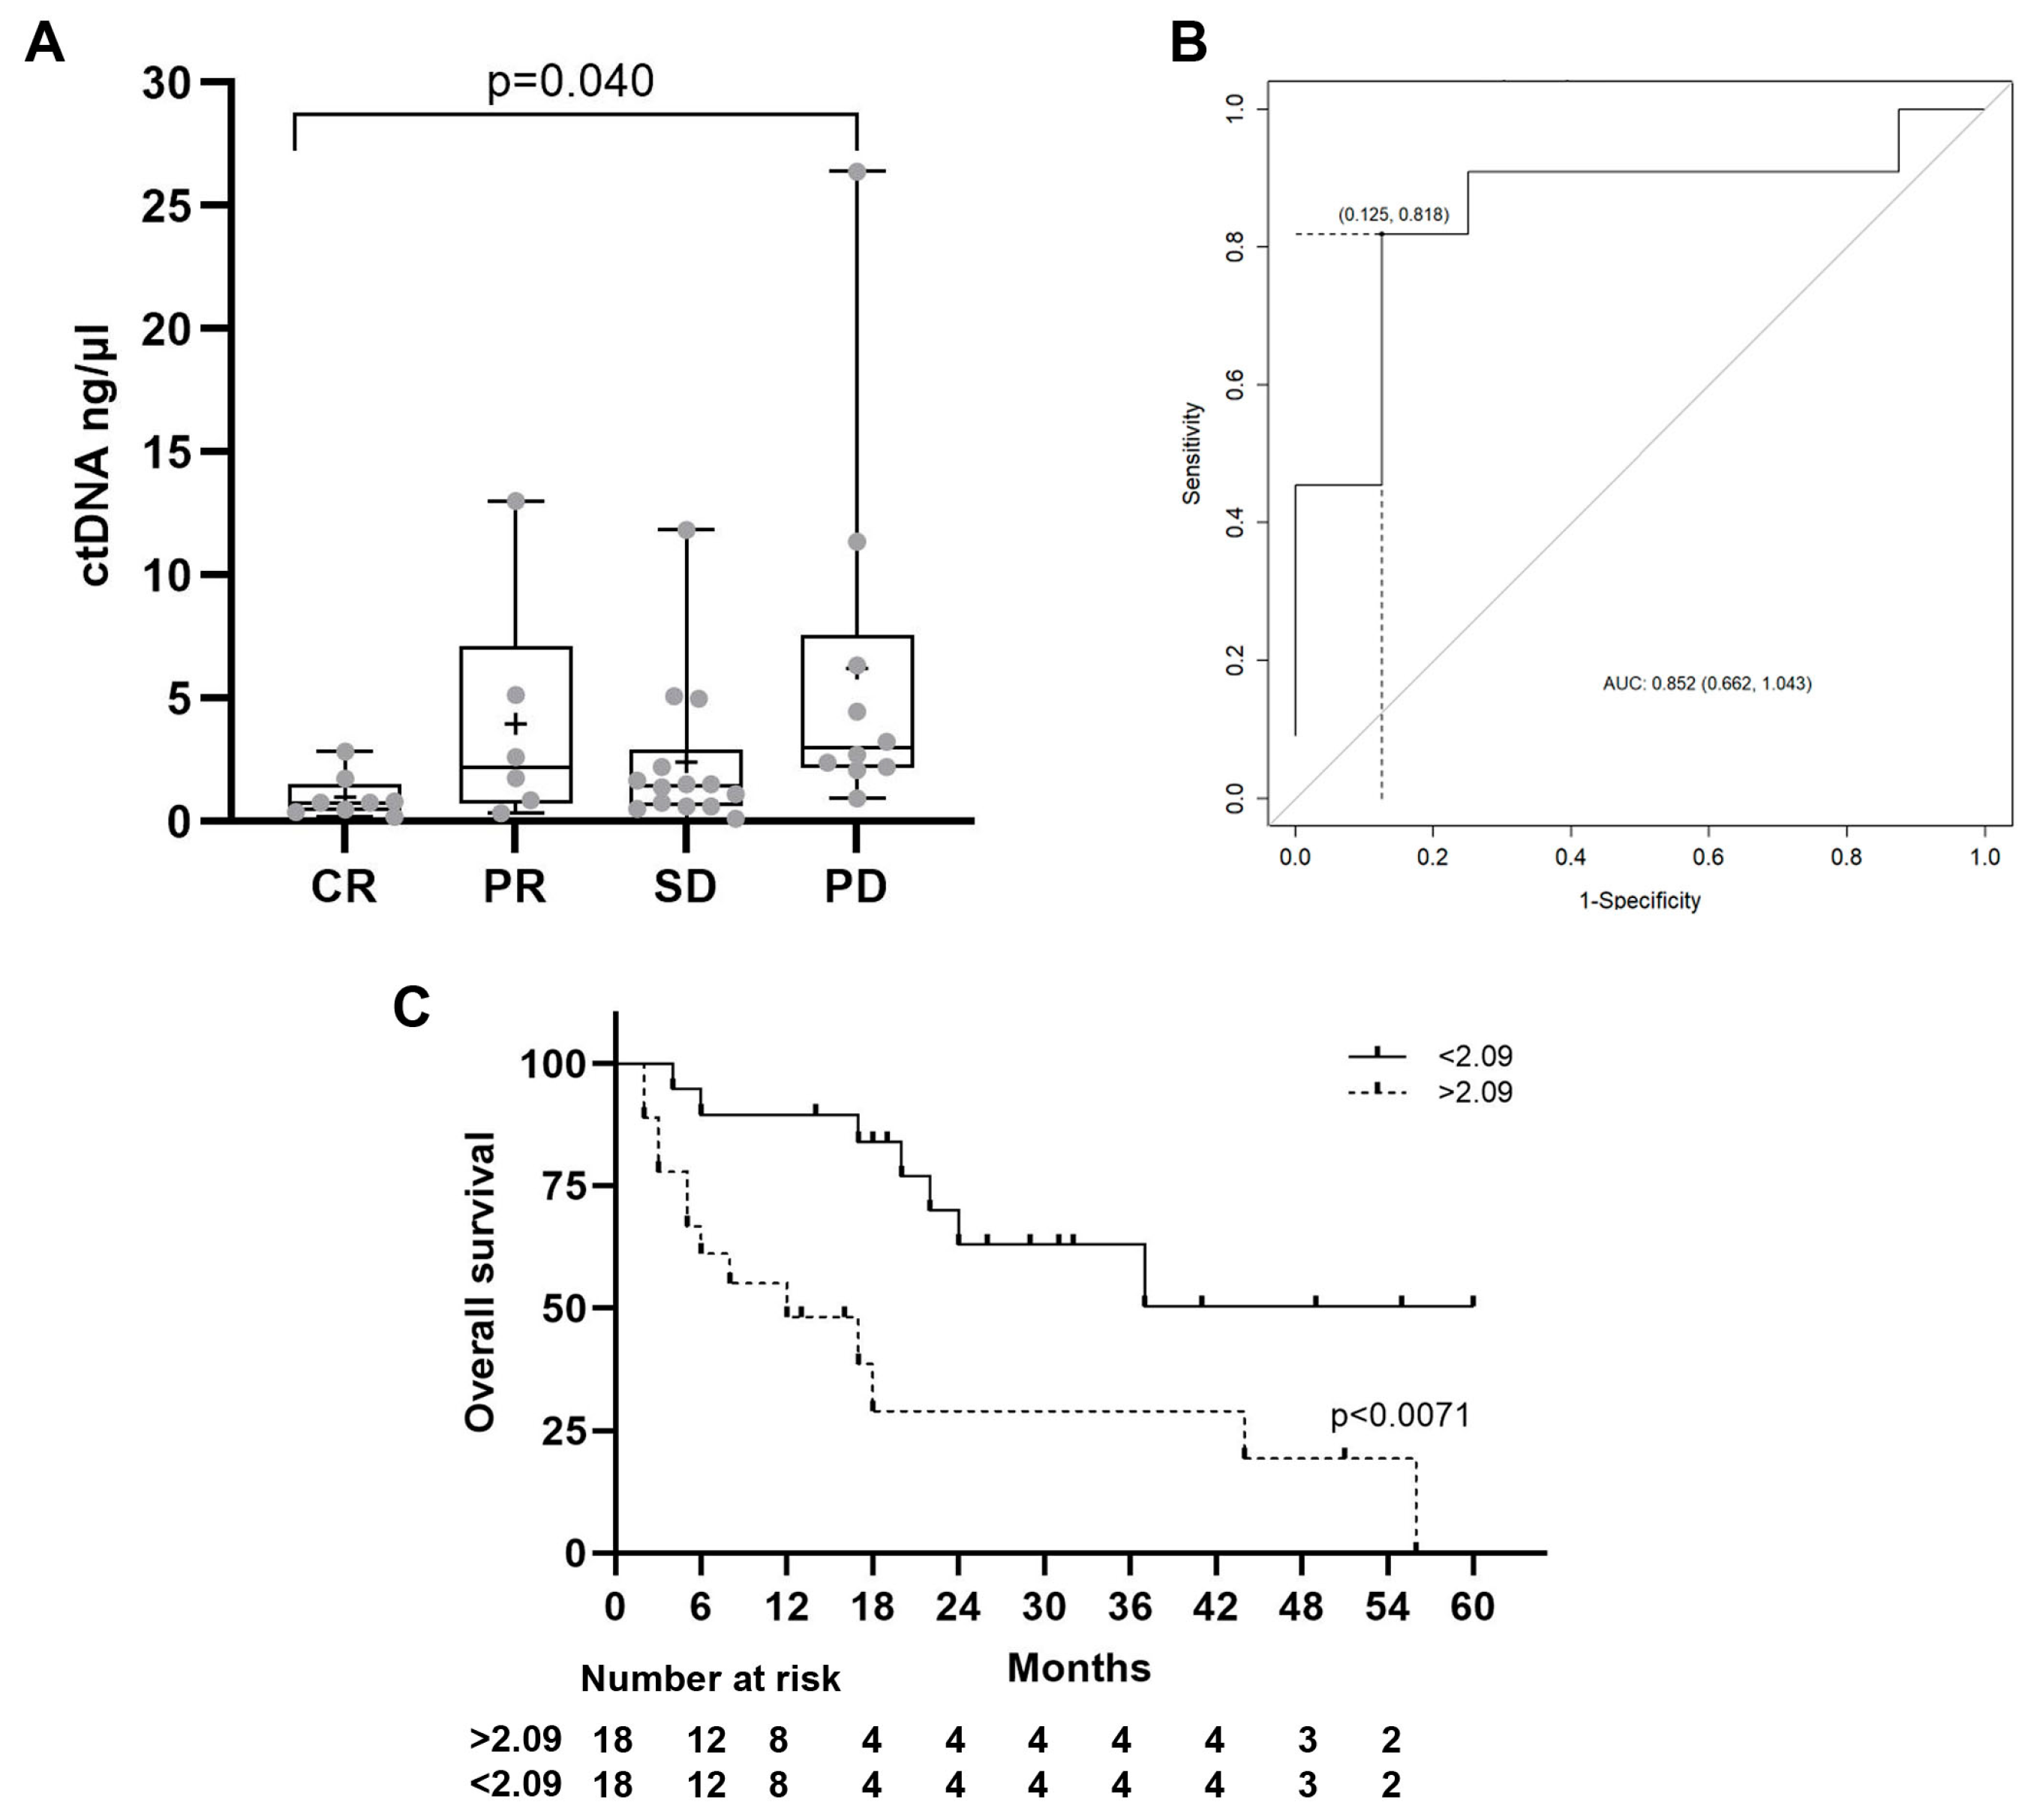
2.4. ctDNA Levels
2.5. Somatic Mutation Analysis
2.6. Copy Number Variation
2.7. Cytokine Levels
3. Discussion
4. Materials and Methods
4.1. Study Design and Participants
4.2. Plasma Collection
4.3. cfDNA and ctDNA Extraction and Quantification
4.4. Droplet Digital PCR (ddPCR)
4.5. Cytokines and Growth Factor Determination
4.6. Trusight
4.7. Statistical Analysis
Supplementary Materials
Author Contributions
Funding
Institutional Review Board Statement
Informed Consent Statement
Data Availability Statement
Conflicts of Interest
Abbreviations
| AFP | Alpha-fetoprotein |
| cfDNA | Cell-free DNA (cfDNA) |
| CNVs | Copy number variations |
| CR | Complete response |
| ctDNA | Circulating tumoral DNA |
| CTLA4 | Cytotoxic T-Lymphocyte Antigen 4 |
| GGT | Gamma-glutamyl transferase |
| HCC | Hepatocellular carcinoma |
| ICIs | Immune checkpoint inhibitors |
| irAEs | Immune-related adverse events |
| mRECIST | Modified Response Evaluation Criteria in Solid Tumors |
| ORR | Objective radiological response |
| PD | Progressive disease |
| PD-L1 | Programmed cell Death-ligand 1 |
| PFS | Progression-free survival |
| PR | Partial response |
| TMB | Tumor mutational burden |
| SD | Stable disease |
| OS | Overall survival |
References
- IARC. Available online: http://globocan.iarc.fr/pages/fact_sheets_population.aspx (accessed on 18 October 2024).
- Reig, M.; Forner, A.; Rimola, J.; Ferrer-Fàbrega, J.; Burrel, M.; Garcia-Criado, Á.; Kelley, R.K.; Galle, P.R.; Mazzaferro, V.; Salem, R.; et al. BCLC Strategy for Prognosis Prediction and Treatment Recommendation: The 2022 Update. J. Hepatol. 2022, 76, 681–693. [Google Scholar] [CrossRef] [PubMed]
- El-Khoueiry, A.B.; Sangro, B.; Yau, T.; Crocenzi, T.S.; Kudo, M.; Hsu, C.; Kim, T.Y.; Choo, S.P.; Trojan, J.; Welling, T.H.; et al. Nivolumab in Patients with Advanced Hepatocellular Carcinoma (CheckMate 040): An Open-Label, Non-Comparative, Phase 1/2 Dose Escalation and Expansion Trial. Lancet 2017, 389, 2492–2502. [Google Scholar] [CrossRef] [PubMed]
- Finn, R.S.; Ryoo, B.Y.; Merle, P.; Kudo, M.; Bouattour, M.; Lim, H.Y.; Breder, V.; Edeline, J.; Chao, Y.; Ogasawara, S.; et al. Pembrolizumab As Second-Line Therapy in Patients With Advanced Hepatocellular Carcinoma in KEYNOTE-240: A Randomized, Double-Blind, Phase III Trial. J. Clin. Oncol. 2020, 38, 193–202. [Google Scholar] [CrossRef] [PubMed]
- Yau, T.; Park, J.W.; Finn, R.S.; Cheng, A.L.; Mathurin, P.; Edeline, J.; Kudo, M.; Harding, J.J.; Merle, P.; Rosmorduc, O.; et al. Nivolumab versus Sorafenib in Advanced Hepatocellular Carcinoma (CheckMate 459): A Randomised, Multicentre, Open-Label, Phase 3 Trial. Lancet Oncol. 2022, 23, 77–90. [Google Scholar] [CrossRef]
- Finn, R.S.; Qin, S.; Ikeda, M.; Galle, P.R.; Ducreux, M.; Kim, T.-Y.; Kudo, M.; Breder, V.; Merle, P.; Kaseb, A.O.; et al. Atezolizumab plus Bevacizumab in Unresectable Hepatocellular Carcinoma. N. Engl. J. Med. 2020, 382, 1894–1905. [Google Scholar] [CrossRef]
- Abou-Alfa, G.K.; Lau, G.; Kudo, M.; Chan, S.L.; Kelley, R.K.; Furuse, J.; Sukeepaisarnjaroen, W.; Kang, Y.-K.; Van Dao, T.; De Toni, E.N.; et al. Tremelimumab plus Durvalumab in Unresectable Hepatocellular Carcinoma. NEJM Evid. 2022, 1, EVIDoa2100070. [Google Scholar] [CrossRef]
- Sangro, B.; Sarobe, P.; Hervás-Stubbs, S.; Melero, I. Advances in Immunotherapy for Hepatocellular Carcinoma. Nat. Rev. Gastroenterol. Hepatol. 2021, 18, 525–543. [Google Scholar] [CrossRef]
- Zhu, A.X.; Finn, R.S.; Edeline, J.; Cattan, S.; Ogasawara, S.; Palmer, D.; Verslype, C.; Zagonel, V.; Fartoux, L.; Vogel, A.; et al. Pembrolizumab in Patients with Advanced Hepatocellular Carcinoma Previously Treated with Sorafenib (KEYNOTE-224): A Non-Randomised, Open-Label Phase 2 Trial. Lancet Oncol. 2018, 19, 940–952. [Google Scholar] [CrossRef]
- Wang, F.; Wei, X.L.; Wang, F.H.; Xu, N.; Shen, L.; Dai, G.H.; Yuan, X.L.; Chen, Y.; Yang, S.J.; Shi, J.H.; et al. Safety, Efficacy and Tumor Mutational Burden as a Biomarker of Overall Survival Benefit in Chemo-Refractory Gastric Cancer Treated with Toripalimab, a PD-1 Antibody in Phase Ib/II Clinical Trial NCT02915432. Ann. Oncol. 2019, 30, 1479–1486. [Google Scholar] [CrossRef]
- Haber, P.K.; Castet, F.; Torres-Martin, M.; Andreu-Oller, C.; Puigvehí, M.; Miho, M.; Radu, P.; Dufour, J.-F.; Verslype, C.; Czauderna, C.; et al. Molecular Markers of Response to Anti-PD1 Therapy in Advanced Hepatocellular Carcinoma. Gastroenterology 2022, S0016-5085, 01039-3. [Google Scholar] [CrossRef]
- Zhu, A.X.; Abbas, A.R.; de Galarreta, M.R.; Guan, Y.; Lu, S.; Koeppen, H.; Zhang, W.; Hsu, C.-H.; He, A.R. Molecular Correlates of Clinical Response and Resistance to Atezolizumab in Combination with Bevacizumab in Advanced Hepatocellular Carcinoma. Nat. Med. 2022, 28, 1599–1611. [Google Scholar] [PubMed]
- Pinyol, R.; Sia, D.; Llovet, J.M. Immune Exclusion-WNT/CTNNB1 Class Predicts Resistance to Immunotherapies in HCC. Clin. Cancer Res. 2019, 25, 2021–2023. [Google Scholar] [CrossRef] [PubMed]
- Ogawa, K.; Kanzaki, H.; Chiba, T.; Ao, J.; Qiang, N.; Ma, Y.; Zhang, J.; Yumita, S.; Ishino, T.; Unozawa, H.; et al. Effect of Atezolizumab plus Bevacizumab in Patients with Hepatocellular Carcinoma Harboring CTNNB1 Mutation in Early Clinical Experience. J. Cancer 2022, 13, 2656–2661. [Google Scholar] [CrossRef] [PubMed]
- Wang, X.; Wang, Q. Alpha-Fetoprotein and Hepatocellular Carcinoma Immunity. Can. J. Gastroenterol. Hepatol. 2018, 2018, 9049252. [Google Scholar] [CrossRef]
- Shao, Y.Y.; Liu, T.H.; Hsu, C.; Lu, L.C.; Shen, Y.C.; Lin, Z.Z.; Cheng, A.L.; Hsu, C.H. Early Alpha-Foetoprotein Response Associated with Treatment Efficacy of Immune Checkpoint Inhibitors for Advanced Hepatocellular Carcinoma. Liver Int. 2019, 39, 2184–2189. [Google Scholar] [CrossRef]
- Paijens, S.T.; Vledder, A.; de Bruyn, M.; Nijman, H.W. Tumor-Infiltrating Lymphocytes in the Immunotherapy Era. Cell Mol. Immunol. 2021, 18, 842–859. [Google Scholar] [CrossRef]
- Sangro, B.; Melero, I.; Wadhawan, S.; Finn, R.S.; Abou-Alfa, G.K.; Cheng, A.L.; Yau, T.; Furuse, J.; Park, J.W.; Boyd, Z.; et al. Association of Inflammatory Biomarkers with Clinical Outcomes in Nivolumab-Treated Patients with Advanced Hepatocellular Carcinoma. J. Hepatol. 2020, 73, 1460–1469. [Google Scholar] [CrossRef]
- Tran, N.H.; Kisiel, J.; Roberts, L.R. Using Cell-Free DNA for HCC Surveillance and Prognosis. JHEP Rep. 2021, 3, 100304. [Google Scholar] [CrossRef]
- Tokuhisa, Y.; Iizuka, N.; Sakaida, I.; Moribe, T.; Fujita, N.; Miura, T.; Tamatsukuri, S.; Ishitsuka, H.; Uchida, K.; Terai, S.; et al. Circulating Cell-Free DNA as a Predictive Marker for Distant Metastasis of Hepatitis C Virus-Related Hepatocellular Carcinoma. Br. J. Cancer 2007, 97, 1399–1403. [Google Scholar] [CrossRef]
- Higuera, M.; Vargas-Accarino, E.; Torrens, M.; Gregori, J.; Salcedo, M.T.; Martínez-Campreciós, J.; Torres, G.; Bermúdez-Ramos, M.; Bilbao, I.; Guerrero-Murillo, M.; et al. Ultra Deep Sequencing of Circulating Cell-Free DNA as a Potential Tool for Hepatocellular Carcinoma Management. Cancers 2022, 14, 3875. [Google Scholar] [CrossRef]
- Matsumae, T.; Kodama, T.; Myojin, Y.; Maesaka, K.; Sakamori, R.; Takuwa, A.; Oku, K.; Motooka, D.; Sawai, Y.; Oshita, M.; et al. Circulating Cell-Free DNA Profiling Predicts the Therapeutic Outcome in Advanced Hepatocellular Carcinoma Patients Treated with Combination Immunotherapy. Cancers 2022, 14, 3367. [Google Scholar] [CrossRef] [PubMed]
- Nault, J.C.; Mallet, M.; Pilati, C.; Calderaro, J.; Bioulac-Sage, P.; Laurent, C.; Laurent, A.; Cherqui, D.; Balabaud, C.; Zucman-Rossi, J.; et al. High Frequency of Telomerase Reverse-Transcriptase Promoter Somatic Mutations in Hepatocellular Carcinoma and Preneoplastic Lesions. Nat. Commun. 2013, 4, 2218. [Google Scholar] [CrossRef] [PubMed]
- Pinyol, R.; Tovar, V.; Llovet, J.M. TERT Promoter Mutations: Gatekeeper and Driver of Hepatocellular Carcinoma. J. Hepatol. 2014, 61, 685–687. [Google Scholar] [CrossRef] [PubMed]
- Li, H.; Li, J.; Zhang, C.; Zhang, C.; Wang, H. TERT Mutations Correlate with Higher TMB Value and Unique Tumor Microenvironment and May Be a Potential Biomarker for Anti-CTLA4 Treatment. Cancer Med. 2020, 9, 7151–7160. [Google Scholar] [CrossRef]
- Hirai, M.; Kinugasa, H.; Nouso, K.; Yamamoto, S.; Terasawa, H.; Onishi, Y.; Oyama, A.; Adachi, T.; Wada, N.; Sakata, M.; et al. Prediction of the Prognosis of Advanced Hepatocellular Carcinoma by TERT Promoter Mutations in Circulating Tumor DNA. J. Gastroenterol. Hepatol. 2021, 36, 1118–1125. [Google Scholar] [CrossRef]
- Cancer Genome Atlas Research Network. Comprehensive and Integrative Genomic Characterization of Hepatocellular Carcinoma. Cell 2017, 169, 1327–1341. [Google Scholar] [CrossRef]
- Galarreta, M.R.; Bresnahan, E.; Molina-sánchez, P.; Lindblad, E.; Maier, B.; Sia, D.; Puigvehi, M.; Miguela, V.; Casanova-acebes, M.; Dhainaut, M.; et al. β-Catenin Activation Promotes Immune Escape and Resistance to Anti-PD-1 Therapy in Hepatocellular Carcinoma. Cancer Discov. 2019, 9, 1124–1141. [Google Scholar] [CrossRef]
- Harking, J.J.; Nandakumar, S.; Armenia, J.; Khalil, D.N.; Albano, M.; Ly, M.; Shia, J.; Hechtman, J.F.; Kundra, R.; El Dika, I.; et al. Prospective Genotyping of Hepatocellular Carcinoma: Clinical Implications of Next-Generation Sequencing for Matching Patients to Targeted and Immune Therapies. Clin. Cancer Res. 2020, 25, 2116–2126. [Google Scholar] [CrossRef]
- Xiao, Q.; Wu, J.; Wang, W.; Chen, S.; Zheng, Y.; Yu, X.; Chen, J.; Sexl, V.; Sun, L.; Li, L.; et al. DKK2 Imparts Tumor Immunity Evasion through β-Catenin-Independent Suppression of Cytotoxic Immune Cell Activation. Nat. Med. 2018, 24, 262–270. [Google Scholar] [CrossRef]
- Wallin, J.J.; Bendell, J.C.; Funke, R.; Sznol, M.; Korski, K.; Jones, S.; Hernandez, G.; Mier, J.; He, X.; Hodi, F.S.; et al. Atezolizumab in Combination with Bevacizumab Enhances Antigen-Specific T-Cell Migration in Metastatic Renal Cell Carcinoma. Nat. Commun. 2016, 7, 12624. [Google Scholar] [CrossRef]
- Gutiontov, S.I.; Turchan, W.T.; Spurr, L.F.; Rouhani, S.J.; Chervin, C.S.; Steinhardt, G.; Lager, A.M.; Wanjari, P.; Malik, R.; Connell, P.P.; et al. CDKN2A Loss-of-Function Predicts Immunotherapy Resistance in Non-Small Cell Lung Cancer. Sci. Rep. 2021, 11, 20059. [Google Scholar] [CrossRef]
- Lei, Y.; Zhang, G.; Zhang, C.; Xue, L.; Yang, Z.; Lu, Z.; Huang, J.; Zang, R.; Che, Y.; Mao, S.; et al. The Average Copy Number Variation (CNVA) of Chromosome Fragments Is a Potential Surrogate for Tumor Mutational Burden in Predicting Responses to Immunotherapy in Non-Small-Cell Lung Cancer. Clin. Transl. Immunol. 2021, 10, e1231. [Google Scholar] [CrossRef] [PubMed]
- Yang, X.; Hu, Y.; Yang, K.; Wang, D.; Lin, J.; Long, J.; Xie, F.; Mao, J.; Bian, J.; Guan, M.; et al. Cell-Free DNA Copy Number Variations Predict Efficacy of Immune Checkpoint Inhibitor-Based Therapy in Hepatobiliary Cancers. J. Immunother. Cancer 2021, 9, e001942. [Google Scholar] [CrossRef] [PubMed]
- Suzuki, K.; Yasui, Y.; Tsuchiya, K.; Matsumoto, H.; Yamazaki, Y.; Uchihara, N.; Tanaka, Y.; Miyamoto, H.; Yamada-Shimizu, M.; Keitoku, T.; et al. Impact of Immune-Related Adverse Events in Patients with Hepatocellular Carcinoma Treated with Atezolizumab plus Bevacizumab. J. Gastroenterol. Hepatol. 2024, 39, 1183–1189. [Google Scholar] [CrossRef]
- Ng, K.Y.Y.; Tan, S.H.; Tan, J.J.E.; Tay, D.S.H.; Lee, A.W.X.; Ang, A.J.S.; Wong, L.W.J.; Choo, S.P.; Tai, D.W.M.; Lee, J.J.X. Impact of Immune-Related Adverse Events on Efficacy of Immune Checkpoint Inhibitors in Patients with Advanced Hepatocellular Carcinoma. Liver Cancer 2022, 11, 9–21. [Google Scholar] [CrossRef]
- Reck, M. Pembrolizumab as First-Line Therapy for Metastatic Non-Small-Cell Lung Cancer. Immunotherapy 2018, 10, 93–105. [Google Scholar] [CrossRef]
- Paz-Ares, L.; Spira, A.; Raben, D.; Planchard, D.; Cho, B.C.; Özgüroğlu, M.; Daniel, D.; Villegas, A.; Vicente, D.; Hui, R.; et al. Outcomes with durvalumab by tumour PD-L1 expression in unresectable, stage III non-small-cell lung cancer in the PACIFIC trial. Ann. Oncol. 2020, 31, 798–806. [Google Scholar] [CrossRef]
- Balar, A.V.; Castellano, D.; O’Donnell, P.H.; Grivas, P.; Vuky, J.; Powles, T.; Plimack, E.R.; Hahn, N.M.; de Wit, R.; Pang, L.; et al. First-Line Pembrolizumab in Cisplatin-Ineligible Patients with Locally Advanced and Unresectable or Metastatic Urothelial Cancer (KEYNOTE-052): A Multicentre, Single-Arm, Phase 2 Study. Lancet Oncol. 2017, 18, 1483–1492. [Google Scholar] [CrossRef]
- Ding, W.; LaPlant, B.R.; Call, T.G.; Parikh, S.A.; Leis, J.F.; He, R.; Shanafelt, T.D.; Sinha, S.; Le-Rademacher, J.; Feldman, A.L.; et al. Pembrolizumab in Patients with CLL and Richter Transformation or with Relapsed CLL. Blood 2017, 129, 3419–3427. [Google Scholar] [CrossRef]
- Guigue, P.A.; Brezinov, Y.; Yasmeen, A.; Mbarik, M.; Salvador, S.; Lau, S.; Gotlieb, W.H.; Brodeur, M.N. Ascites and Serum Interleukin-10 Levels as a Prognostic Tool for Ovarian Cancer Outcomes. Cancers 2024, 16, 2840. [Google Scholar] [CrossRef]
- Sharafeldin, M.A.; Suef, R.A.; Mousa, A.A.; Ziadah, D.H.; Farag, M.M.S. Serum Interleukin-10 and Alpha-Fetoprotein: A Combined Diagnostic Approach for Hepatocellular Carcinoma in Egyptians with HCV. Pathol. Res. Pract. 2024, 258, 155327. [Google Scholar] [CrossRef] [PubMed]
- El-Serag, H.; Kanwal, F.; Ning, J.; Powell, H.; Khaderi, S.; Singal, A.G.; Asrani, S.; Marrero, J.A.; Amos, C.I.; Thrift, A.P.; et al. Serum Biomarker Signature Is Predictive of the Risk of Hepatocellular Cancer in Patients with Cirrhosis. Gut 2024, 73, 1000–1007. [Google Scholar] [CrossRef]
- Feun, L.G.; Li, Y.Y.; Wu, C.; Wangpaichitr, M.; Jones, P.D.; Richman, S.P.; Madrazo, B.; Kwon, D.; Garcia-Buitrago, M.; Martin, P.; et al. Phase 2 Study of Pembrolizumab and Circulating Biomarkers to Predict Anticancer Response in Advanced, Unresectable Hepatocellular Carcinoma. Cancer 2019, 125, 3603–3614. [Google Scholar] [CrossRef] [PubMed]
- Li, H.; Durbin, R. Fast and Accurate Short Read Alignment with Burrows-Wheeler Transform. Bioinformatics 2009, 25, 1754–1760. [Google Scholar] [CrossRef]
- Li, H.; Handsaker, B.; Wysoker, A.; Fennell, T.; Ruan, J.; Homer, N.; Marth, G.; Abecasis, G.; Durbin, R. The Sequence Alignment/Map Format and SAMtools. Bioinformatics 2009, 25, 2078–2079. [Google Scholar] [CrossRef]
- Van der Auwera, G.A.; Carneiro, M.O.; Hartl, C.; Poplin, R.; del Angel, G.; Levy-Moonshine, A.; Jordan, T.; Shakir, K.; Roazen, D.; Thibault, J.; et al. From FastQ Data to High Confidence Variant Calls: The Genome Analysis Toolkit Best Practices Pipeline. Curr. Protoc. Bioinform. 2013, 43, 11.10.1–11.10.33. [Google Scholar] [CrossRef]


| Demographic | Cases (n = 38) | |
|---|---|---|
| Clinicopathological characteristics | ||
| Gender, n (%) | Male | 31 (81.6%) |
| Age, median (range) | 68.7 (62.1–76.7) | |
| Etiology, n (%) | HCV | 21 (55.3%) |
| MASLD | 5 (13.2%) | |
| HBV | 2 (5.3%) | |
| ALD | 3 (7.9%) | |
| Others | 1 (2.6%) | |
| No liver disease | 6 (15.8%) | |
| BCLC, n (%) | BCLC B | 8 (21.1%) |
| BCLC C | 30 (78.9%) | |
| ECOG, n (%) | ECOG 0 | 32 (84.2%) |
| ECOG 1 | 6 (15.8%) | |
| Child Pugh, n (%) | A | 32 (84.2%) |
| B | 6 (15.8%) | |
| Previous treatment, n (%) | Locoregional or surgery | 22 (57.89%) |
| TKI | 17 (44.7%) | |
| No previous treatment | 10 (26.3%) | |
| ICI therapy, n(%) | Nivolumab | 15 (39.5%) |
| Atezolizumab/Bevacizumab | 19 (50%) | |
| Durvalumab/Tremelimumab | 1 (2.6%) | |
| Lenvatinib/Pembrolizumab | 1 (2.6%) | |
| Pembrolizumab | 1 (2.6%) | |
| Laboratory values | ||
| AFP (ng/dL), median (range) | 17.9 (4.5–1082.3) | |
| Bilirubin (mg/dL), median (range) | 0.8 (0.6–1.2) | |
| Albumin (g/L), median (range) | 4 (3.7–4.2) | |
| Platelet count (109/L), median (range) | 186 (102–245) | |
| INR | 1 (1–1.1) | |
| AST (UI/L) | 51 (39–2.81) | |
| ALT (UI/L) | 39 (27.5–55.5) | |
| Radiological response | ||
| Best Radiological response mRECIST, n (%) | Complete response (CR) | 8 (21.1%) |
| Partial response (PR) | 5 (13.2%) | |
| Stable disease (SD) | 14 (36.8%) | |
| Progressive disease (PD) | 11 (28.9%) | |
| Events, n (%) | Deceased | 21 (55.3%) |
| Time to radiological progression, median months (range) | 14 (2.5–25.4) | |
| Survival, median months (range) | 24 (2.3–45.6) | |
| Follow-up, median months (range) | 16.5 (2–60) |
| Immune-Related Adverse Events (irAEs) | ||
|---|---|---|
| irAEs, n (%) | 19 (50%) | |
| Number of AEs, n (%) | 0 | 19 (50%) |
| 1 | 11 (28.9%) | |
| 2 | 5 (13.2%) | |
| 3 | 3 (7.9%) | |
| Transaminases increase, n (%) | 25 (65.8) | |
| Diarrhea or colitis, n (%) | 9 (23.7%) | |
| Endocrine disorders, n (%) | 8 (21.1%) | |
| Dermatological, n (%) | 6 (15.8%) | |
| cfDNA | ctDNA | |||
|---|---|---|---|---|
| Radiological Response | Basal | 3 m | Basal | 3 m |
| CR | 1.9 (0.8) | 3 (2.3) | 1(0.9) | 1.4 (1.9) |
| PR | 7.5 (6.3) | 13.8 (23) | 4.7 (4.9) | 3.5 (4.4) |
| SD | 4.7 (5) | 3.3 (2.8) | 2.4 (3.1) | 6.4 (7.8) |
| PD | 9.3 (7.1) | 11.4 (13) | 5.7 (7.5) | 4.5 (4.8) |
| Status | Basal | 3 m | Basal | 3 m |
| Alive | 4 (5) | 9.5 (21.7)) | 2.4 (3.2) | 4 (6) |
| Death | 8.5 (6.4) | 9.3 (9.9) | 4.1 (6) | 4.7 (5.8) |
Disclaimer/Publisher’s Note: The statements, opinions and data contained in all publications are solely those of the individual author(s) and contributor(s) and not of MDPI and/or the editor(s). MDPI and/or the editor(s) disclaim responsibility for any injury to people or property resulting from any ideas, methods, instructions or products referred to in the content. |
© 2025 by the authors. Licensee MDPI, Basel, Switzerland. This article is an open access article distributed under the terms and conditions of the Creative Commons Attribution (CC BY) license (https://creativecommons.org/licenses/by/4.0/).
Share and Cite
Vargas-Accarino, E.; Higuera, M.; Bermúdez-Ramos, M.; Soriano-Varela, A.; Torrens, M.; Pons, M.; Aransay, A.M.; Martín, J.E.; Rodríguez-Frías, F.; Merino, X.; et al. Harnessing Plasma Biomarkers to Predict Immunotherapy Outcomes in Hepatocellular Carcinoma: The Role of cfDNA, ctDNA, and Cytokines. Int. J. Mol. Sci. 2025, 26, 2794. https://doi.org/10.3390/ijms26062794
Vargas-Accarino E, Higuera M, Bermúdez-Ramos M, Soriano-Varela A, Torrens M, Pons M, Aransay AM, Martín JE, Rodríguez-Frías F, Merino X, et al. Harnessing Plasma Biomarkers to Predict Immunotherapy Outcomes in Hepatocellular Carcinoma: The Role of cfDNA, ctDNA, and Cytokines. International Journal of Molecular Sciences. 2025; 26(6):2794. https://doi.org/10.3390/ijms26062794
Chicago/Turabian StyleVargas-Accarino, Elena, Mónica Higuera, María Bermúdez-Ramos, Agnès Soriano-Varela, María Torrens, Mònica Pons, Ana María Aransay, José Ezequiel Martín, Francisco Rodríguez-Frías, Xavier Merino, and et al. 2025. "Harnessing Plasma Biomarkers to Predict Immunotherapy Outcomes in Hepatocellular Carcinoma: The Role of cfDNA, ctDNA, and Cytokines" International Journal of Molecular Sciences 26, no. 6: 2794. https://doi.org/10.3390/ijms26062794
APA StyleVargas-Accarino, E., Higuera, M., Bermúdez-Ramos, M., Soriano-Varela, A., Torrens, M., Pons, M., Aransay, A. M., Martín, J. E., Rodríguez-Frías, F., Merino, X., & Mínguez, B. (2025). Harnessing Plasma Biomarkers to Predict Immunotherapy Outcomes in Hepatocellular Carcinoma: The Role of cfDNA, ctDNA, and Cytokines. International Journal of Molecular Sciences, 26(6), 2794. https://doi.org/10.3390/ijms26062794