Article

Genome-Wide Analysis of AGC Genes Related to Salt Stress in Soybeans (Glycine max)

Guangdong Key Laboratory of Plant Adaptation and Molecular Design, Innovative Center of Molecular Genetics and Evolution, School of Life Sciences, Guangzhou University, Guangzhou 510006, China
*
Authors to whom correspondence should be addressed.
These authors contributed equally to this work.
Int. J. Mol. Sci. 2025, 26(6), 2588; https://doi.org/10.3390/ijms26062588
Submission received: 28 January 2025 / Revised: 10 March 2025 / Accepted: 11 March 2025 / Published: 13 March 2025
(This article belongs to the Section Molecular Plant Sciences)

Abstract

:
The AGC protein kinase family plays a crucial role in regulating plant growth, immunity, and cell death, as well as responses to abiotic stresses such as salt-induced stress, which impact plant development and productivity. While the functions of AGC kinases have been thoroughly studied in model plants such as Arabidopsis thaliana, their roles in soybeans (Glycine max) remain poorly understood. In this study, we identified 69 AGC kinase genes in soybeans, which are unevenly distributed across 19 chromosomes and classified into five subfamilies: PDK1, AGCVI, AGCVII, AGCVIII, and AGC (other). Each subfamily shares similar exon–intron structures and specific motifs. Gene duplication and selection pressure analyses revealed that the GmAGC gene family is primarily expanded through segmental or whole-genome duplication, with all genes undergoing purifying selection during evolution. Promoter analysis identified numerous cis-regulatory elements associated with light, hormonal, and abiotic stress responses, including salt stress. The gene expression analysis demonstrated tissue-specific patterns, with the highest expression levels found in roots (19.7%). Among the 54 GmAGC genes analyzed using RT-qPCR, significant changes in expression were observed in the roots and leaves treated with sodium chloride, with most genes showing increased expression. These results illustrate the critical role of the soybean AGC kinase gene family in regulating responses to salinity stress. Our findings suggest that targeting specific GmAGC genes may enhance soybean resistance to salt toxicity, offering valuable insights for future crop improvement strategies.

1. Introduction

Effectively sensing and responding to external environmental stimuli is a vital process for plants’ survival and adaptation. Protein kinases play a key role in integrating developmental and environmental signals into specific cellular responses, enabling plants to adapt to diverse environmental conditions such as salinity, drought, and cold stress [1,2]. These enzymes catalyze the transfer of the γ-phosphate group from adenosine triphosphate (ATP) to specific serine, threonine, or tyrosine residues on target proteins, thereby altering their activity and functionality [3]. The plant protein kinase superfamily is one of the largest and most diverse gene families in plants, and it includes several key groups: protein kinase A/protein kinase G/protein kinase C (AGC), calcium/calmodulin-dependent kinase (CAMK), calcium-dependent protein kinases (CDPKs), sucrose non-fermenting1-related protein kinases (SnRKs), mitogen-activated protein kinases (MAPKs), and receptor-like kinases (RLKs) [4]. The AGC kinase subfamily, a group of serine/threonine protein kinases, includes cAMP-dependent protein kinase A (PKA), cGMP-dependent protein kinase G (PKG), and phospholipid-dependent protein kinase C (PKC), all of which are widely distributed in eukaryotes [5]. AGC kinases are critical in transmitting cellular signals, which they achieve by phosphorylating target proteins, thus regulating key processes such as cell division, membrane dynamics, and cell polarity [6]. In plants, AGC kinases play a critical role in regulating auxin transport and localization, responding to light signals, and adapting to both biotic and abiotic stresses, highlighting their versatile functions in maintaining cellular homeostasis and facilitating stress adaptation [7,8,9,10]. It has been established that SnRK2 kinases, which are activated by abscisic acid (ABA), play a pivotal role in drought tolerance by regulating protective mechanisms such as stomatal closure, reduced transpiration, and the activation of drought-responsive genes [11]. Similarly, MAPKs and salt overly sensitive (SOS) pathway kinases are essential for salt stress adaptation, as they maintain ion homeostasis and facilitate stress responses [12]. AGC kinases, particularly those that are activated by lipid signals through pathways involving Phosphoinositide-Dependent Kinase 1 (PDK1), are involved in various stress response pathways, including immune responses and growth regulation under abiotic stress [13].
To date, the importance of the AGC kinase family in stress tolerance has been investigated in several plant species such as Arabidopsis thaliana, wheat, rice, Brassica rapa, and cotton [14,15,16,17,18,19,20]. In A. thaliana, the AGC kinase family comprises 39 members that are categorized into five subfamilies: PDK1, AGCVI, AGCVII, AGCVIII, and AGC (other) [21]. The PDK1 subfamily includes two highly conserved members, PDK1 and PDK2, which function as master regulators by integrating lipid signals and activating other AGC kinases [22]. While initial studies suggested mild developmental defects in A. thaliana PDK1/PDK2 double mutants, recent CRISPR/Cas9 knockout lines revealed severe auxin-related developmental abnormalities, highlighting their critical roles in plant growth [23,24,25]. Similarly, knockout of multiple NtPDK1 alleles in tobacco led to severe developmental defects [26]. In rice, the OsPdk1 AGC kinase plays a key role in maintaining basal resistance to salt-induced stress by regulating phosphorylation cascades that activate plant defense mechanisms [19]. The AGCVI subfamily contains two p70 ribosomal S6 Kinase genes (S6K), S6K1 and S6K2, which regulate cell growth, proliferation, and stress responses [27]. Expression analysis indicates that AtS6K1 is induced by UV-B and oxidative and genotoxic stresses, while AtS6K2 is predominantly expressed in roots under salt stress [14]. The AGCVII subfamily consists of eight Nuclear Dbf2-related (NDR) kinases, which are conserved across plants, animals, and yeast and are involved in cell division, patterning, and programmed cell death [28]. In A. thaliana, NDR2, NDR4, and NDR5 regulate late-stage pollen development and germination, with mutants displaying abnormal callose deposition and reduced fertilization rates [29]. In wheat (Triticum aestivum), TaAGC1 (NDR homolog) is involved in immunity against Rhizoctonia cerealis by modulating reactive oxygen species (ROS)-related and defense-associated genes [17]. The AGC (other) subfamily includes four incomplete root hair elongation (IRE) kinases, which regulate root hair development and other processes. For example, AtIREH1 regulates root deflection angles and stabilizes microtubule networks in A. thaliana, while MtIRE promotes the formation of nitrogen-fixing nodules in Medicago truncatula [30,31]. In cucumber, CsIREH1 phosphorylates DELLA proteins to prevent their overaccumulation, ensuring normal growth [32]. Additionally, AtIRE1a and AtIRE1b mediate plant immunity via the unfolded protein response pathway, with IRE1a predominantly involved in pathogen-induced PR protein secretion and IRE1b primarily responding to tunicamycin-triggered stress [15]. The AGCVIII subfamily, which is unique to plants, is the largest AGC group in soybeans, consisting of 23 members [33]. This subfamily can be further separated into four subgroups: AGC1, AGC2, AGC3, and AGC4, each with distinct roles [34]. The AGC1 subgroup regulates plant growth, development, and hormone signaling. For instance, the AtAGC1–4 genes influence seed size by controlling cell proliferation and embryo development [35]. In A. thaliana, four AGC2 kinases, including Oxidative Signal-inducible 1 (OXI1)/AGC2-1, AGC2-2, Unicorn (UCN)/AGC2-3, and Unicorn-like (UCNL)/AGC2-4, are involved in root growth, oxidative stress signaling, and pathogen defense [22,36]. AGC3 kinases, including PINOID (PID), Wavy Root Growth 1 (WAG1), and WAG2, phosphorylate auxin efflux carriers (PIN proteins), regulating auxin transport and distribution, which are essential for plant development [37]. AGC4 kinases, including PHOTOTROPIN1 (PHOT1) and PHOT2, mediate blue light signaling and photomorphogenesis [38]. In cotton, the gene expression of the genes GhAGC2, GhAGC8, GhAGC9, GhAGC10, GhAGC22, GhAGC23, and GhAGC24 is elevated by salt stress, indicating the involvement of AGCs in cotton’s response to salinity [18]. In B. rapa, the gene expression of BrAGC21, BrAGC33, BrAGC37, BrAGC41, BrAGC55, and BrAGC56 is downregulated under salt stress, while the gene expression of BrAGC09, BrAGC19, BrAGC26, and BrAGC44 is upregulated, emphasizing their crucial and multiple roles in response to salt stress [20].
Soybean (Glycine max) is a globally significant food and oil crop and a major source of plant protein for both human consumption and animal feed [39]. Salt toxicity is a major abiotic stress that negatively impacts soybean growth and development, resulting in reduced yields and limiting cultivation in saline-prone regions. Therefore, enhancing soybeans’ salt tolerance is crucial for sustaining productivity and expanding cultivation into these challenging environments. However, the role of the AGC gene family in soybeans’ response to salinity stress remains poorly understood. To address this gap, we performed a genome-wide analysis of the AGC kinase gene family in G. max, focusing on its roles in sodium chloride stress. By identifying and functionally characterizing the GmAGC gene family, this study aims to clarify its contributions to salinity stress tolerance. These findings provide a foundation for developing strategies aimed at enhancing soybeans’ resilience to environmental stresses, particularly salinity, and support the breeding of soybean cultivars with improved salt tolerance.

2. Results

2.1. Sequence Identification and Retrieval

A total of 39 AGC family genes were retrieved from A. thaliana using the TAIR database (Table S1). These sequences were then used as queries to identify homologous genes in G. max (Williams 82) via the Phytozome database, resulting in the identification of 69 homologous genes for further analysis (Table 1). To ensure the accuracy of the dataset, all retrieved sequences were re-examined for the presence of the conserved AGC domain using HMMER tools (Table S2).

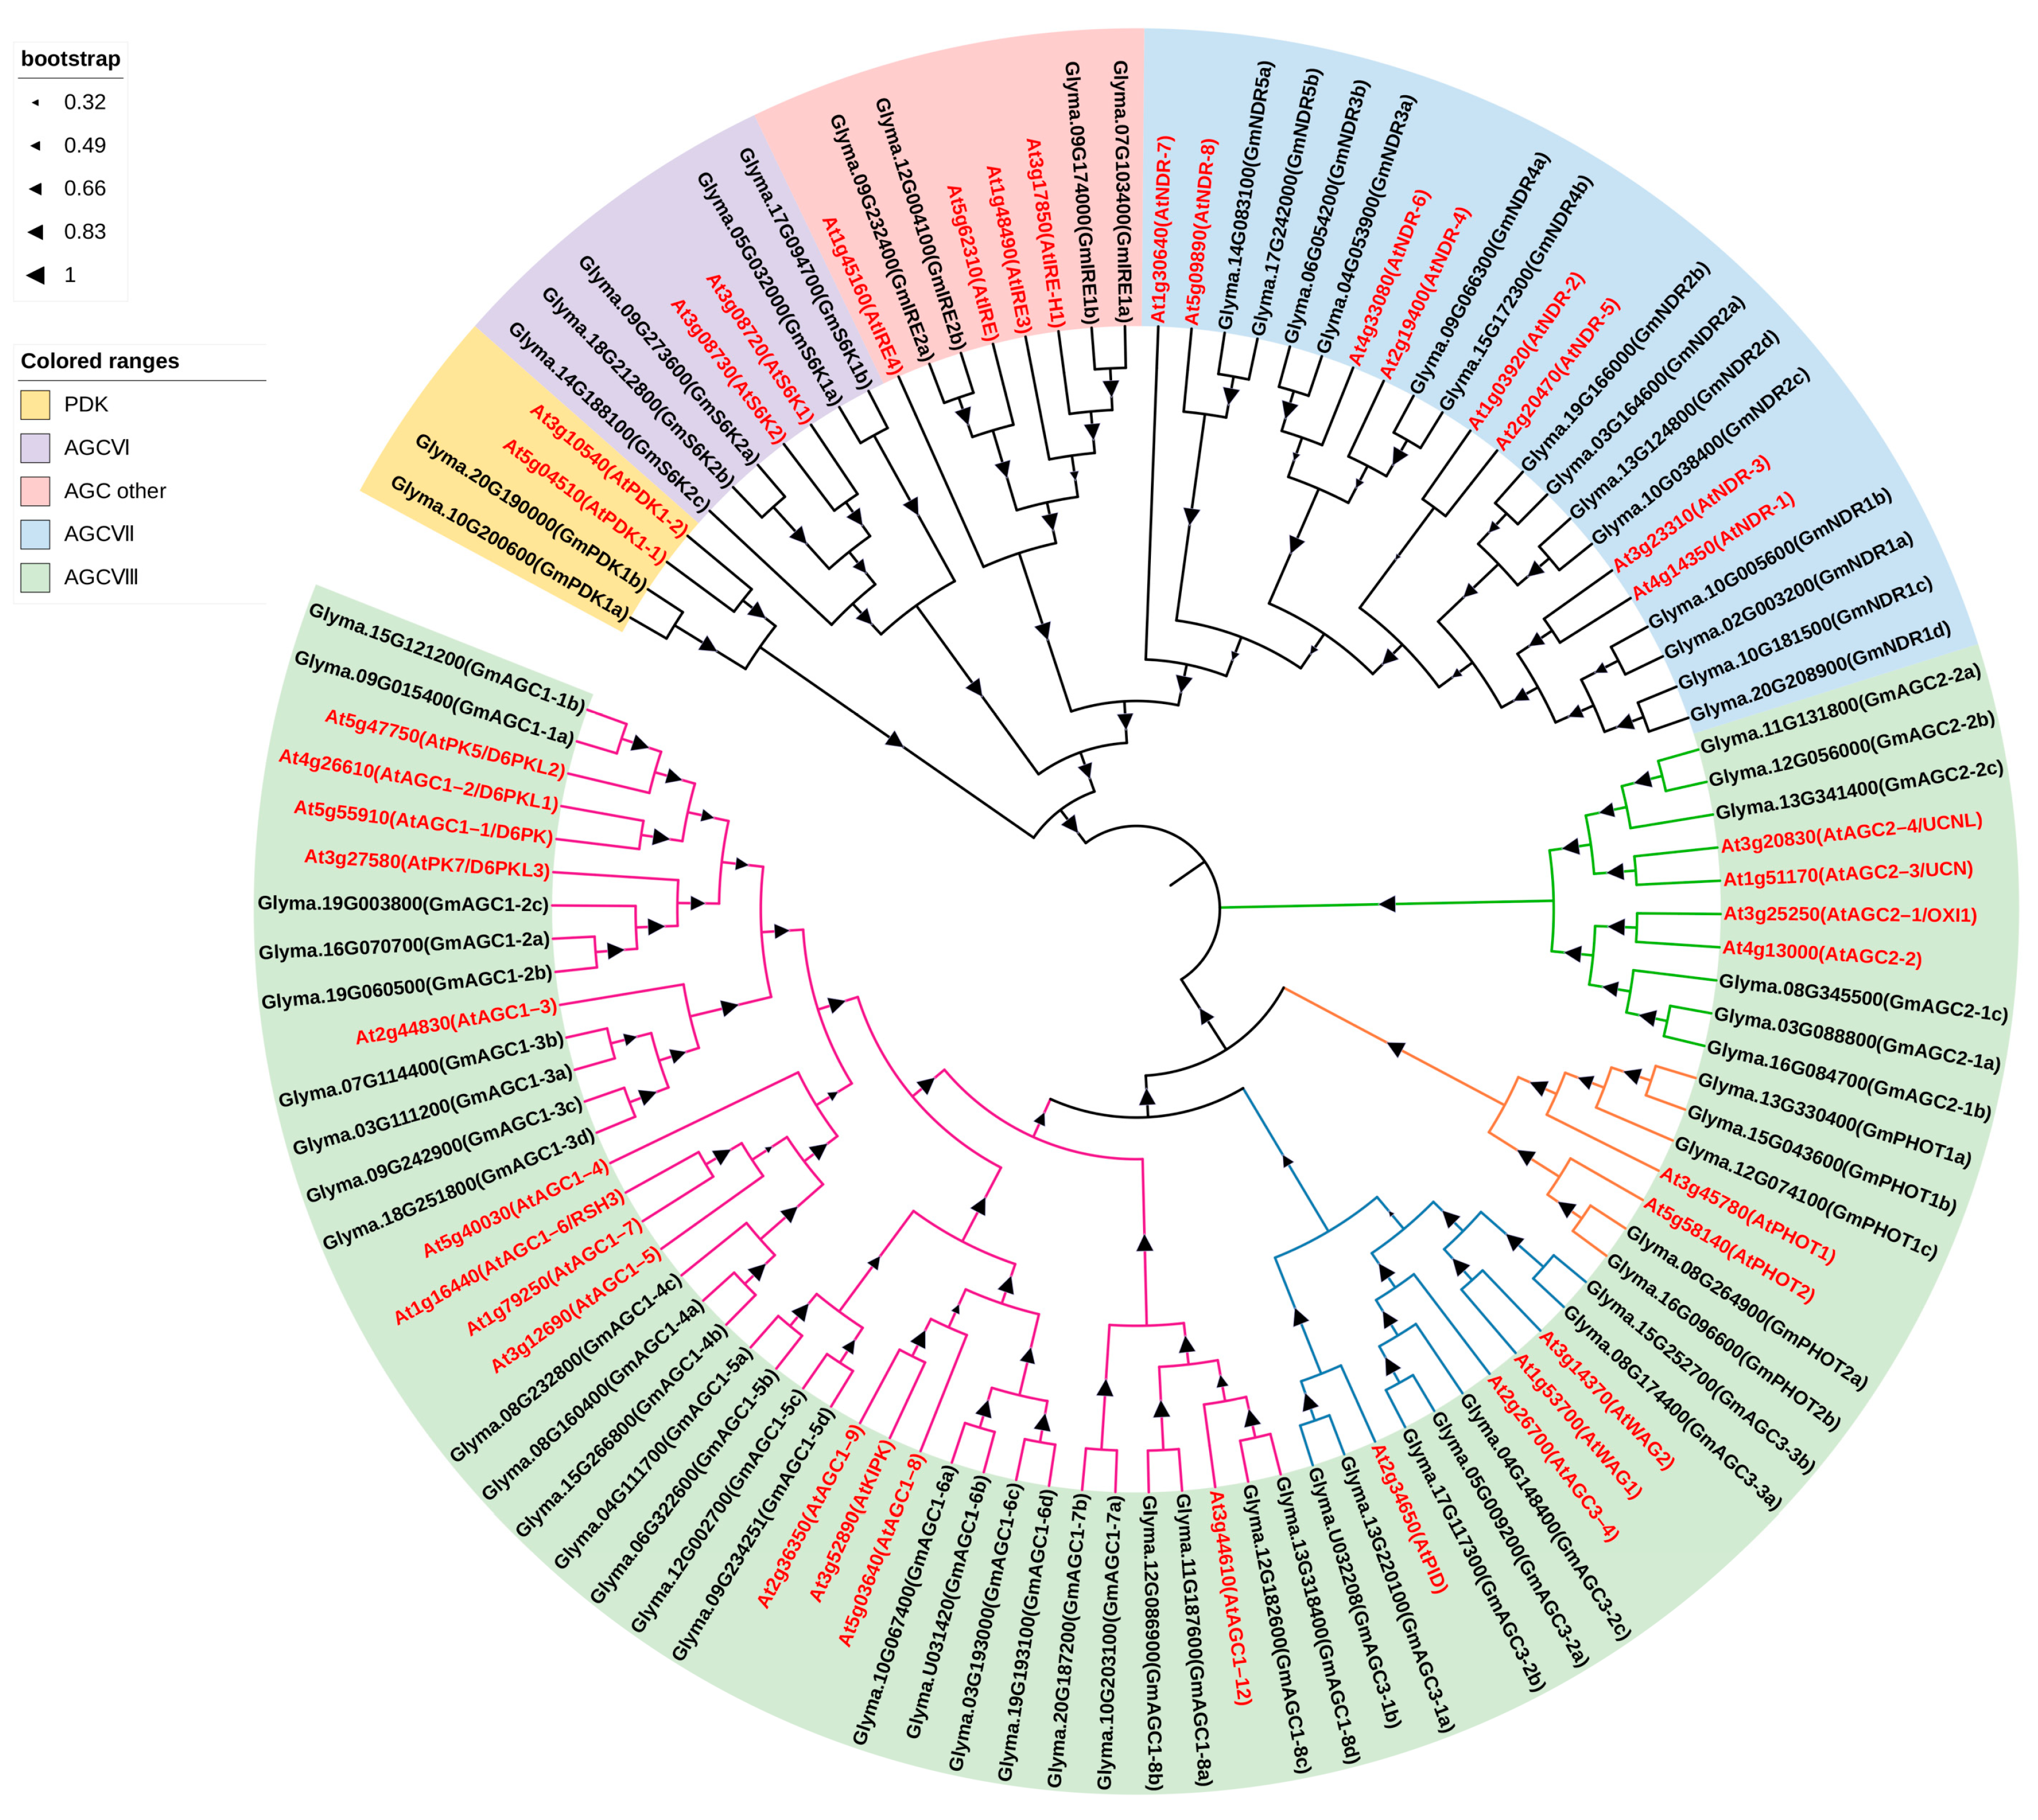
2.2. Sequence Alignment and Phylogeny

Phylogenetic analysis is an essential tool for elucidating the evolutionary relationships between genes. To investigate the AGC kinase gene family, a phylogenetic tree was constructed using protein sequences from A. thaliana and its homologs in G. max. A. thaliana was selected as the reference species due to its well-characterized status as a model plant, with a fully sequenced genome and classified AGC genes. This approach enabled the classification of soybean AGC genes based on clustering patterns observed in the phylogenetic tree. The analysis revealed that the 69 soybean AGC genes are grouped into five subfamilies (Figure 1). In accordance with established nomenclature, the soybean AGC genes were named based on their phylogenetic relationship and corresponding subfamilies (Table 1).
Within the PDK1 subfamily, two soybean genes, GmPDK1a and GmPDK1b, were identified as the closest homologs of the A. thaliana PDK1 gene. Five genes homologous to the A. thaliana S6K gene were identified in the AGCVI subfamily: GmS6K1a, GmS6K1b, GmS6K2a, GmS6K2b, and GmS6K2c. Additionally, 14 soybean genes homologous to the A. thaliana NDR gene were classified into the AGCVII subfamily and designated as GmNDR1a/b/c/d, GmNDR2 a/b/c/d, GmNDR3a/b, GmNDR4a/b, and GmNDR5a/b. Four genes homologous to the A. thaliana IRE gene were assigned to the AGC (other) subfamily and named GmIRE1a/b and GmIRE2a/b. The remaining 44 genes were found in the AGCVIII subfamily, which was further classified into four groups: 26 genes in the AGC1 group, 6 in the AGC2 group, 7 in the AGC3 group, and 5 in the AGC4 group (Figure 1 and Table 1). The AGC2 and AGC4 (GmPHOTs) groups are located in the basal clade of AGCVIII. A phylogenetic analysis revealed that the AGC gene family has undergone significant expansion in G. max, particularly within the AGCVI, AGCVII, and AGCVIII subfamilies, where there were more members than in A. thaliana. These variations suggest that the soybean AGC kinase gene family has undergone different evolutionary paths or species-specific adaptations.

2.3. Physicochemical Properties of the GmAGC Kinase Family

The physicochemical properties of the GmAGC and AtAGC proteins were analyzed and are summarized in Table 1. The lengths of the GmAGC proteins ranged from 182 to 1302 amino acids, with molecular weights ranging from 19.99 kDa to 143.14 kDa. The isoelectric points (pI) of these proteins spanned from 5.41 to 9.71, with an average predicted pI of 7.41. Notably, certain proteins, including GmIREs, GmS6K2a, and GmPHOTs, exhibit higher molecular weights.
Subcellular localization predictions for the 69 GmAGC proteins, performed using the Softberry online tool, indicated that these proteins are distributed across various cellular compartments, including the nucleus, cytoplasm, plasma membrane, and extracellular spaces (Table 1). This diverse localization suggests that the GmAGC proteins play roles in a wide array of cellular processes.

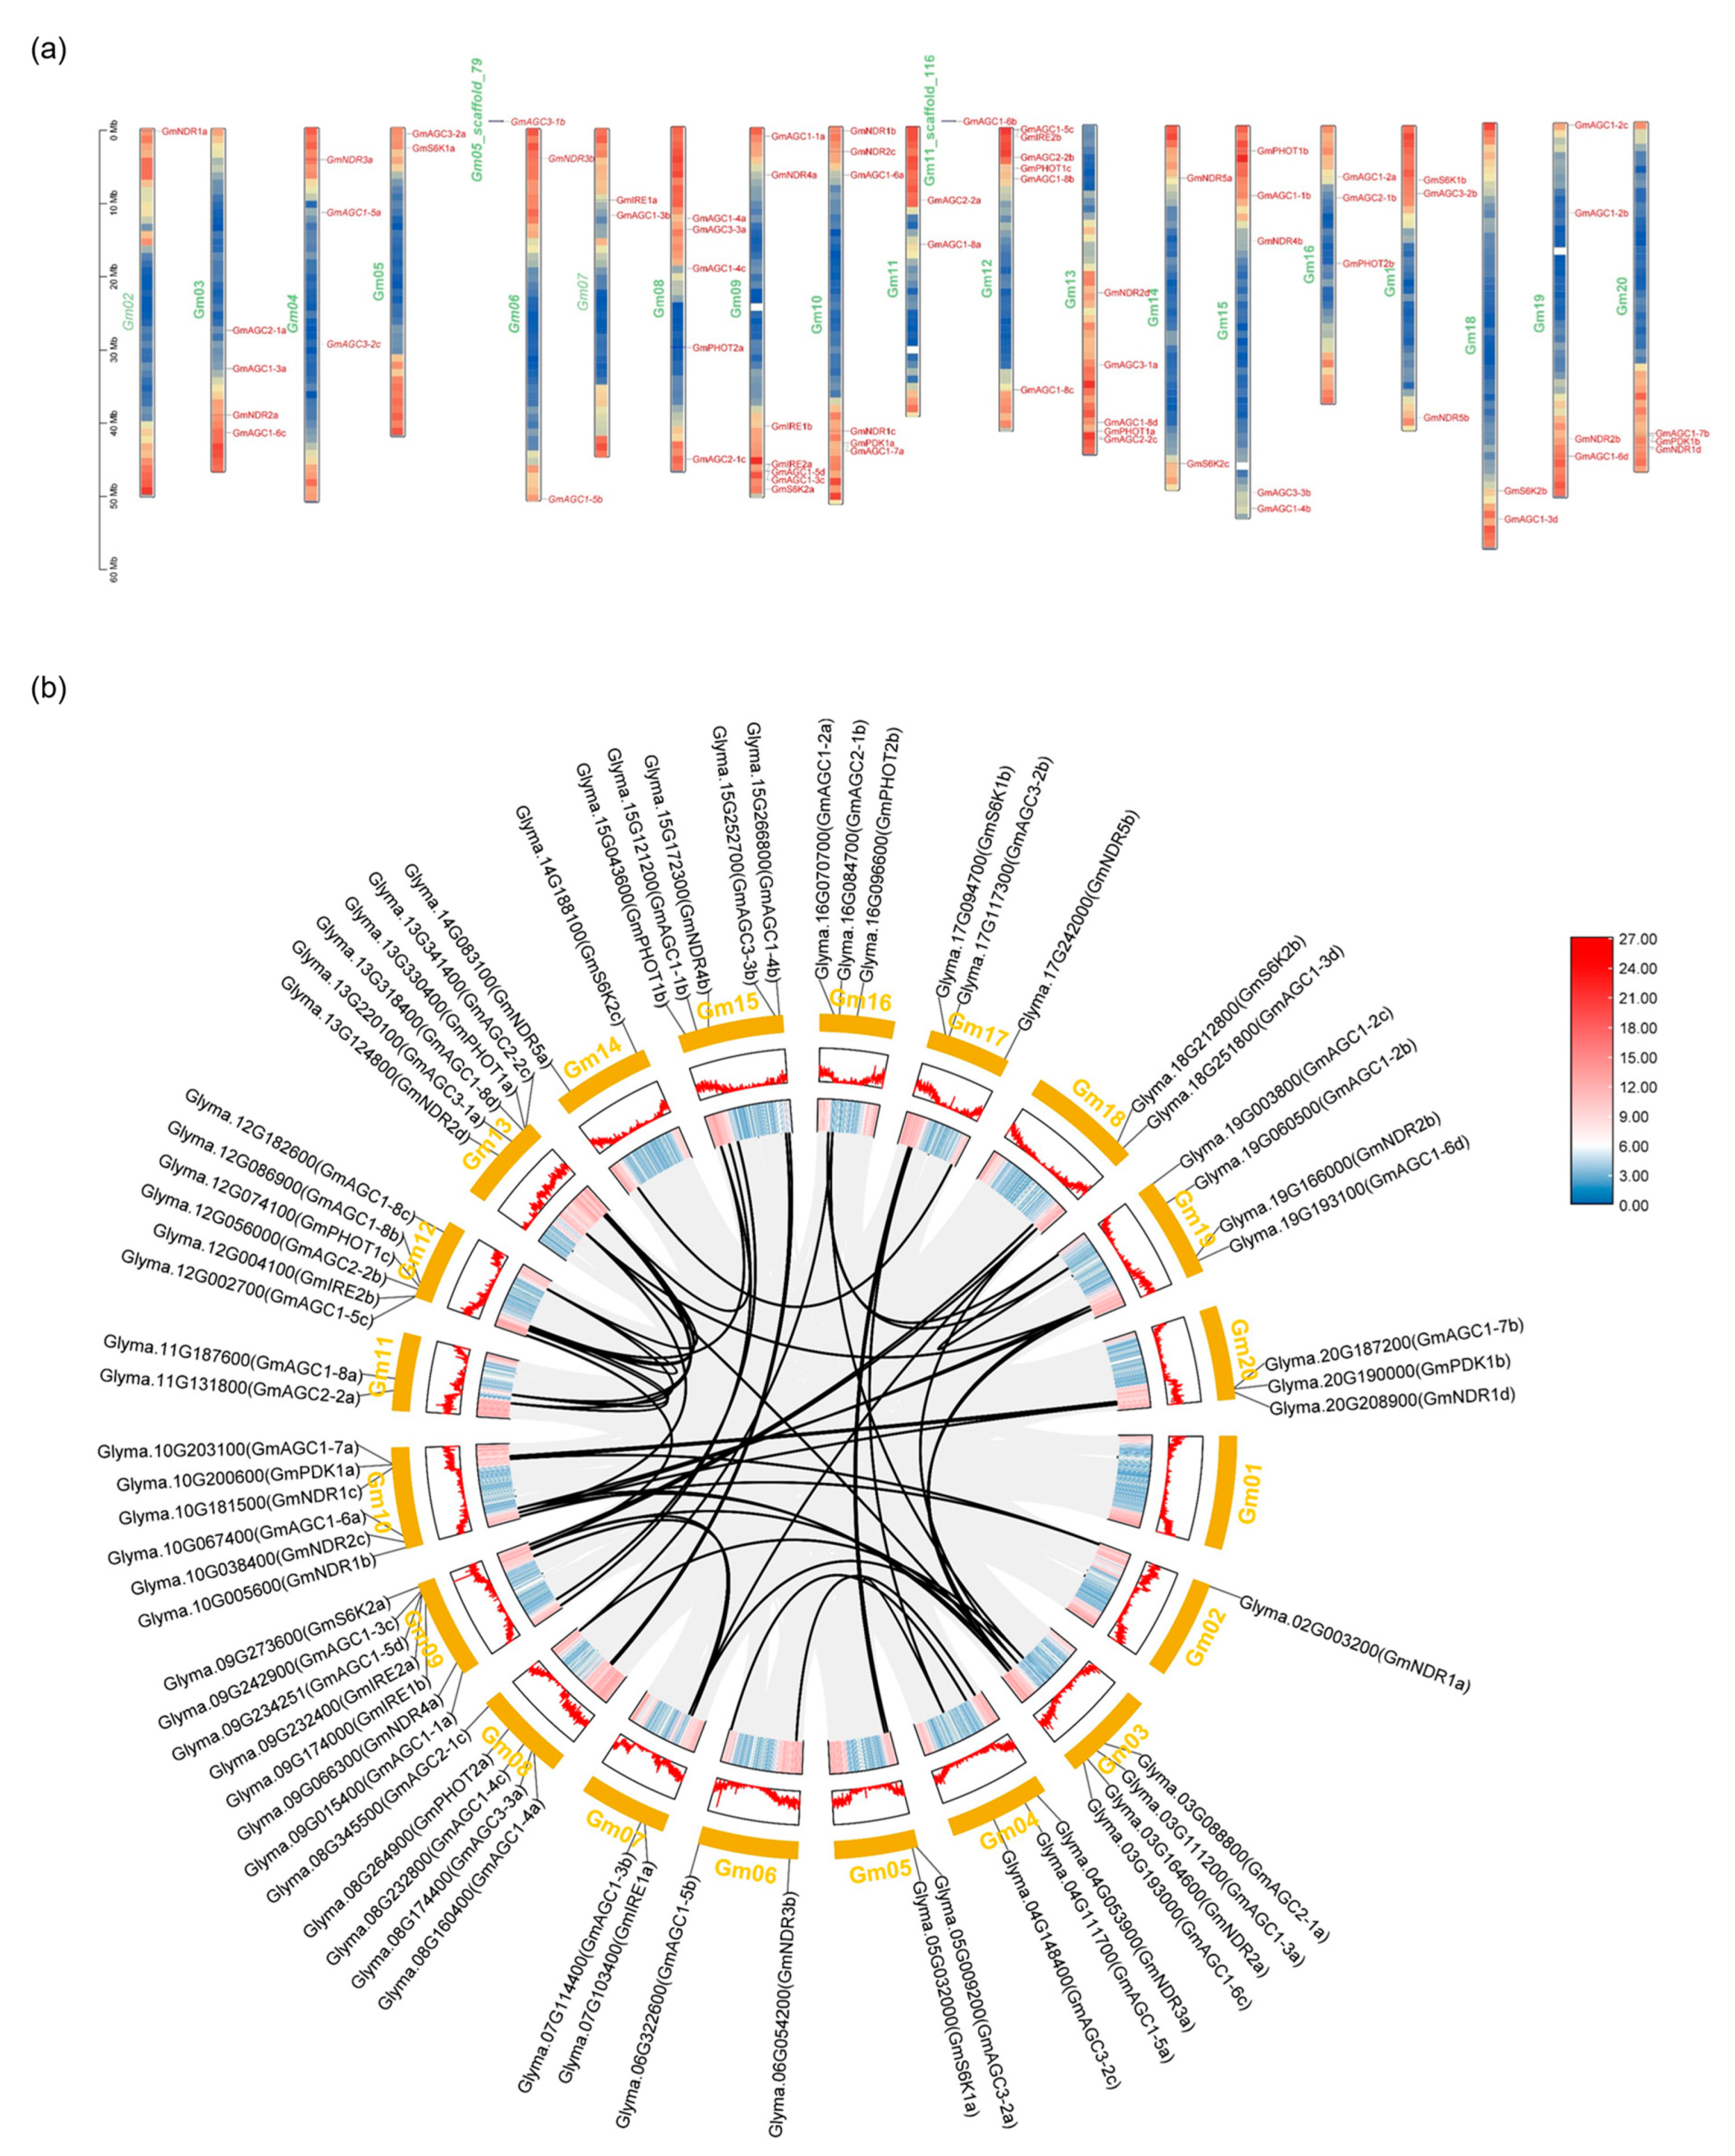
2.4. GmAGC Localization on Chromosomes, Collinearity Analysis, Gene Duplication, and Ka/Ks Ratio

The chromosomal distribution and gene duplication analysis of GmAGC genes were performed using GFF genome annotations. A total of 67 GmAGC genes were mapped to G. max chromosomes, while two genes were located on chromosome scaffolds. Except for GmAGC1-6a (Glyma.U032208) and GmAGCAGC3-1b (Glyma.U032208), the GmAGC genes were distributed across chromosomes 2 to 20 (Figure 2a). Chromosome 10 contained the highest density of GmAGC genes, with seven members, whereas chromosomes 2, 6, 14, and 18 each contained two or fewer genes (Figure 2a).
Gene duplication, a major driver of gene family expansion, was analyzed through intraspecific collinearity, including whole-genome duplication (WGD), segmental duplication, and tandem duplication. G. max has undergone two major WGD events, approximately 58 and 13 million years ago. A total of 54 collinear gene pairs were identified, excluding GmAGC1-4c, GmAGC1-6b, GmAGC3-1a, GmAGC3-1b, GmPHOT2a, GmPHOT2b, and GmS6K2c (Figure 2b). All of the remaining genes displayed linear relationships, with some genes showing collinearity with one to three other genes. All collinear gene pairs were identified as segmental/WGD duplications, indicating that these duplication events significantly contributed to the expansion of the GmAGC gene family in soybeans (Table 2, Figure 2b).
The Ka/Ks ratio was used to evaluate the selection pressure on the duplicated GmAGC genes. Ka/Ks ratios of <1, =1, and >1 indicate purifying selection, neutral evolution, and positive selection, respectively. In this study, the Ka/Ks ratios for all collinear gene pairs were less than 1, suggesting strong purifying selection during the evolutionary history of these genes (Table 2). The highest Ka/Ks ratio of 0.45 was observed for the GmNDR1c/GmNDR1d gene pair, with duplication events estimated to have occurred approximately 176.75 million years ago (Table 2, Figure 2b). The duplication events primarily occurred during the Glycine WGD (Ks < 0.3), and 24 events among 44 genes in the AGCVIII subfamily are predicted to have originated during the Legume WGD (1.5 < Ks < 0.3). Additionally, three duplication events in the AGCVIII subfamily were traced back to the gamma whole-genome triplication (WGT) (Ks > 1.5) (Table 2 and Figures S1 and S2). These findings suggest that the expansion of the GmAGC gene family resulted from three rounds of genome duplication (Figures S1 and S2).

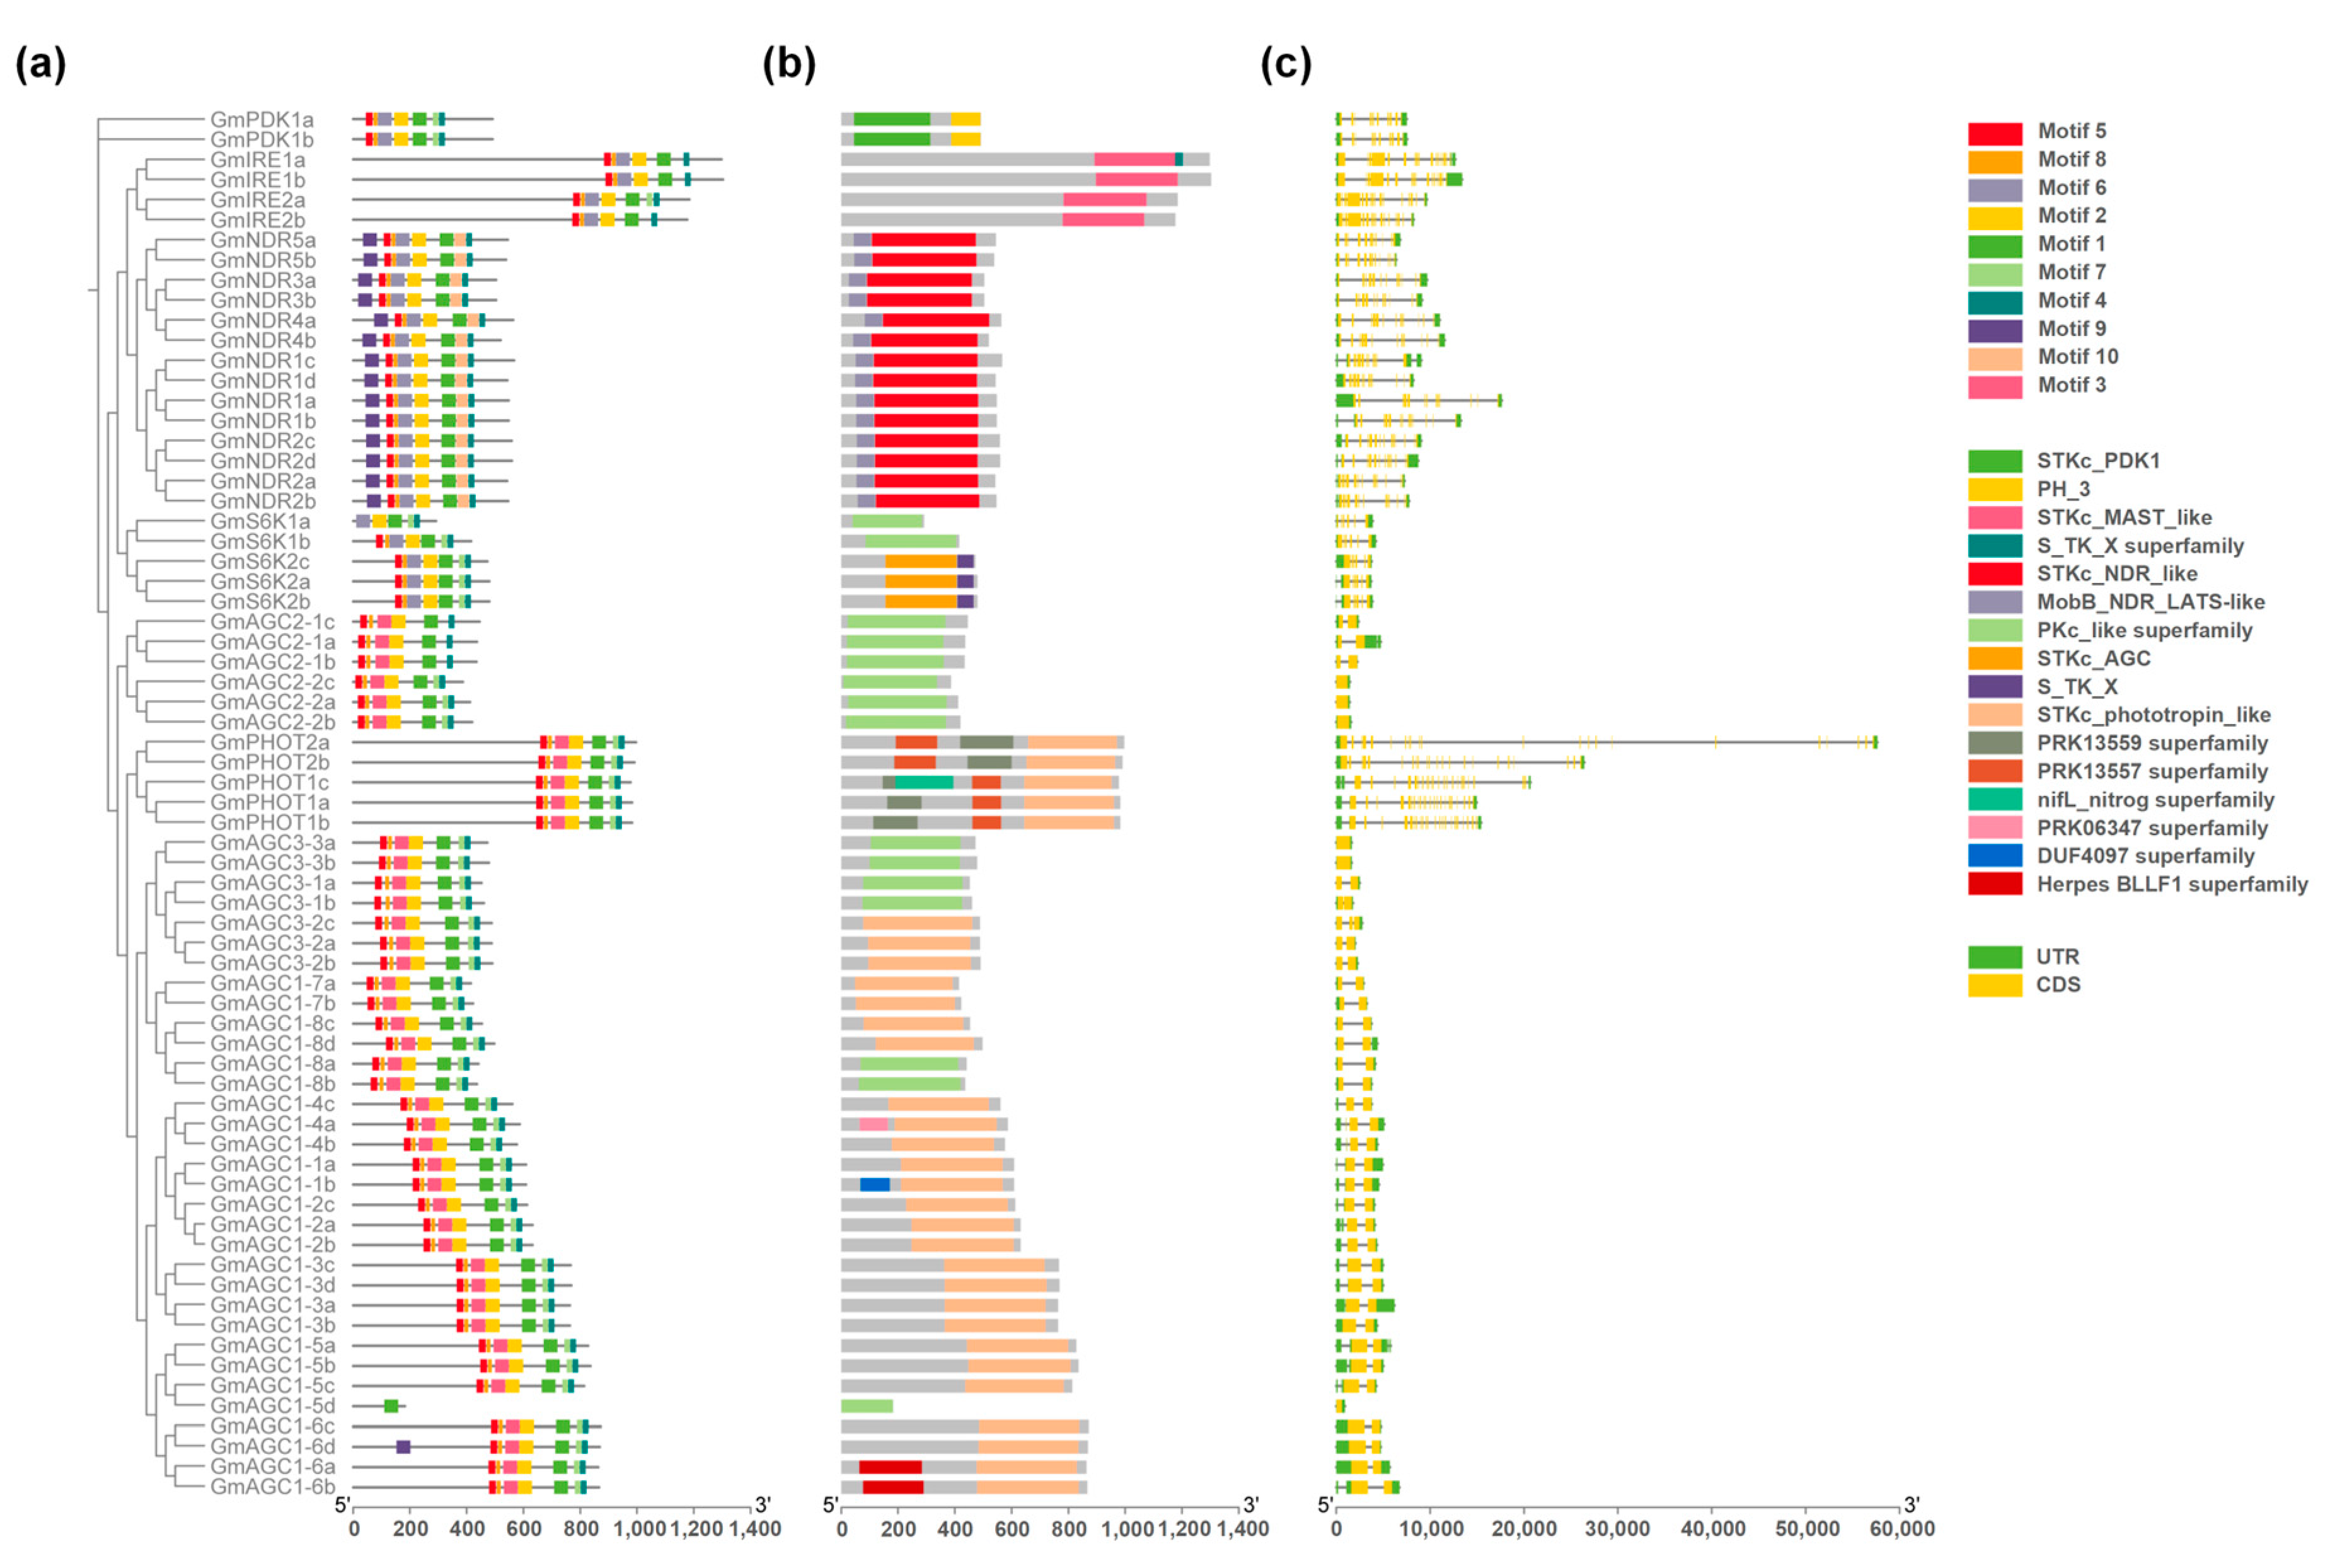
2.5. Motif Finding and Gene Structure Analysis of GmAGC Genes

To better understand the composition and function of GmAGC genes, we analyzed their conserved motifs and exon–intron structures. A total of ten conserved motifs were identified, with their type, order, and number being consistent within subfamilies but differing markedly between subfamilies (Figure 3a and Table S2). In the AGCVIII subfamily, 88.64% (39 out of 44) of genes shared seven motifs (motif 1, motif 2, motif 3, motif 4, motif 5, motif 7, and motif 8) arranged in the same order. This pattern was distinct from the other four subfamilies, which lacked motif 3 (Figure 3a). Motif 6 was present in all genes across every subfamily except AGCVIII, further highlighting the differences in motif composition. Additionally, AGCVII was characterized by the presence of the unique motifs 9 and 10, which were absent in other subfamilies, indicating divergence in motif patterns. Notably, the GmAGC1-5d gene, which contains only motif 1, likely lost its other structural domains during diversification after gene duplication (Figure 3a). These findings suggest that, while motif composition is highly conserved within subfamilies, significant divergence exists among the five subfamilies.
The exon–intron structural analysis, performed by comparing the predicted coding sequences with their corresponding genomic sequences, provided insights into the structural evolution of GmAGC genes. The number of introns varied widely, ranging from 0 to 21, but genes within the same subfamily typically displayed similar exon–intron structures and consistent exon counts (Figure 3b,c and Table S3). Most genes in the AGCVI, AGCVII, and AGC (other) subfamilies contained 11 to 13 exons. In contrast, genes in the AGC1, AGC2, and AGC3 subgroups of the AGCVIII subfamily typically had only 1 to 2 exons, whereas AGC4 subfamily genes had the most and longest introns, with up to 21 (Table S3). These structural differences align with the classification of the GmAGC gene family and underscore the evolutionary divergence among its subfamilies.

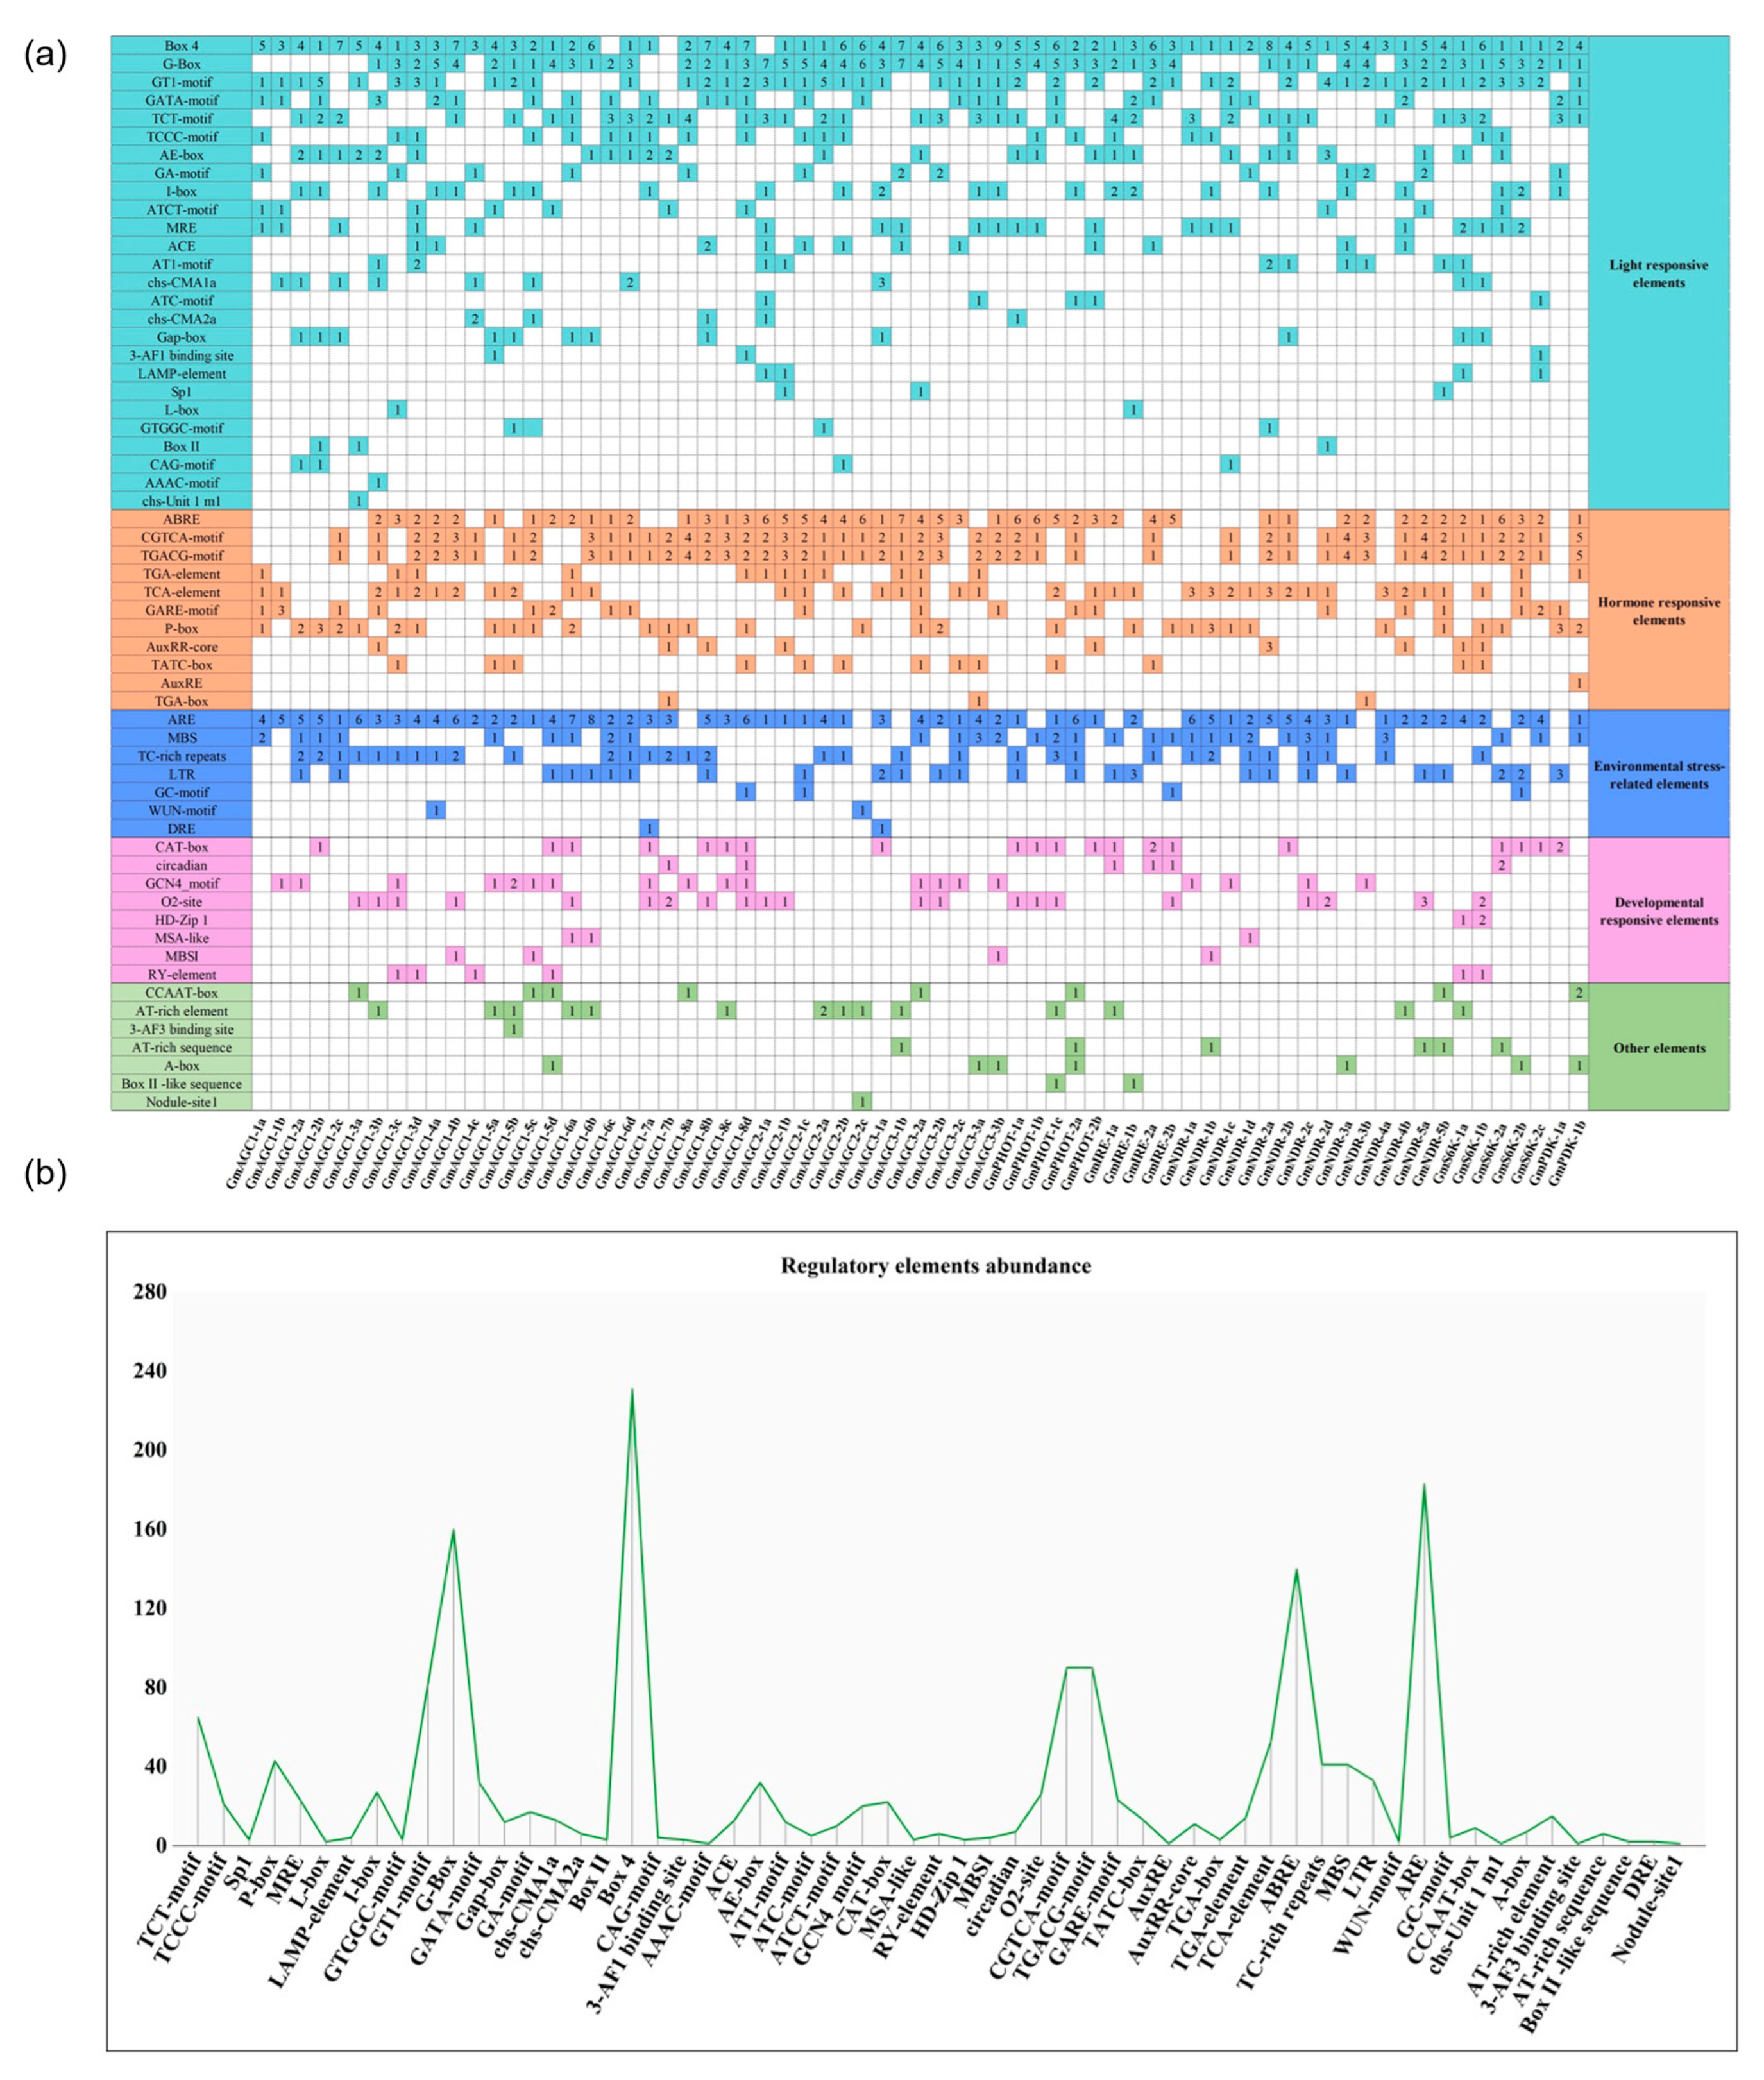
2.6. Analysis of Cis-Elements in the Promoters of GmAGC Genes

To explore the transcriptional regulation mechanisms of GmAGC genes, we analyzed their promoter regions, focusing on the 2000 bp upstream of the translation start sites (Figure S3). A total of 1704 cis-regulatory elements were identified, many of which are associated with growth, development, phytohormone signaling, light responses, and stress responses (Table S4). The most abundant element was Box4, a conserved DNA module involved in light responsiveness (Figure 4). Other frequently observed elements included the G-box (light responsiveness), ARE (anaerobic induction), ABRE (abscisic acid response), GT1-motif (salt stress response), and CGTCA-motif and TGACG-motif (MeJA response) (Figure 4). Less frequent elements included the nodule site, DRE, Box II-like sequence, chs-Unit 1 m1, 3-AF3 binding site, Box II, AAAC-motif, and TGA-box (Table S4). These results highlight the significant role of cis-elements in regulating GmAGC gene expression and offer insights into their regulatory mechanisms in G. max.
Salt-stress-responsive elements, including ABRE, GT1-motif, DRE/CRT, MBS (MYB binding sites), LTR (low-temperature response element), G box (bZIP transcription factor binding site), and GC-motif, were found to be widely distributed across the promoters of GmAGC genes (Figure 4). The presence of these elements suggests that the GmAGC gene family plays a significant role in soybeans’ response to salt stress, providing a foundation for understanding their function in stress adaptation and regulation.

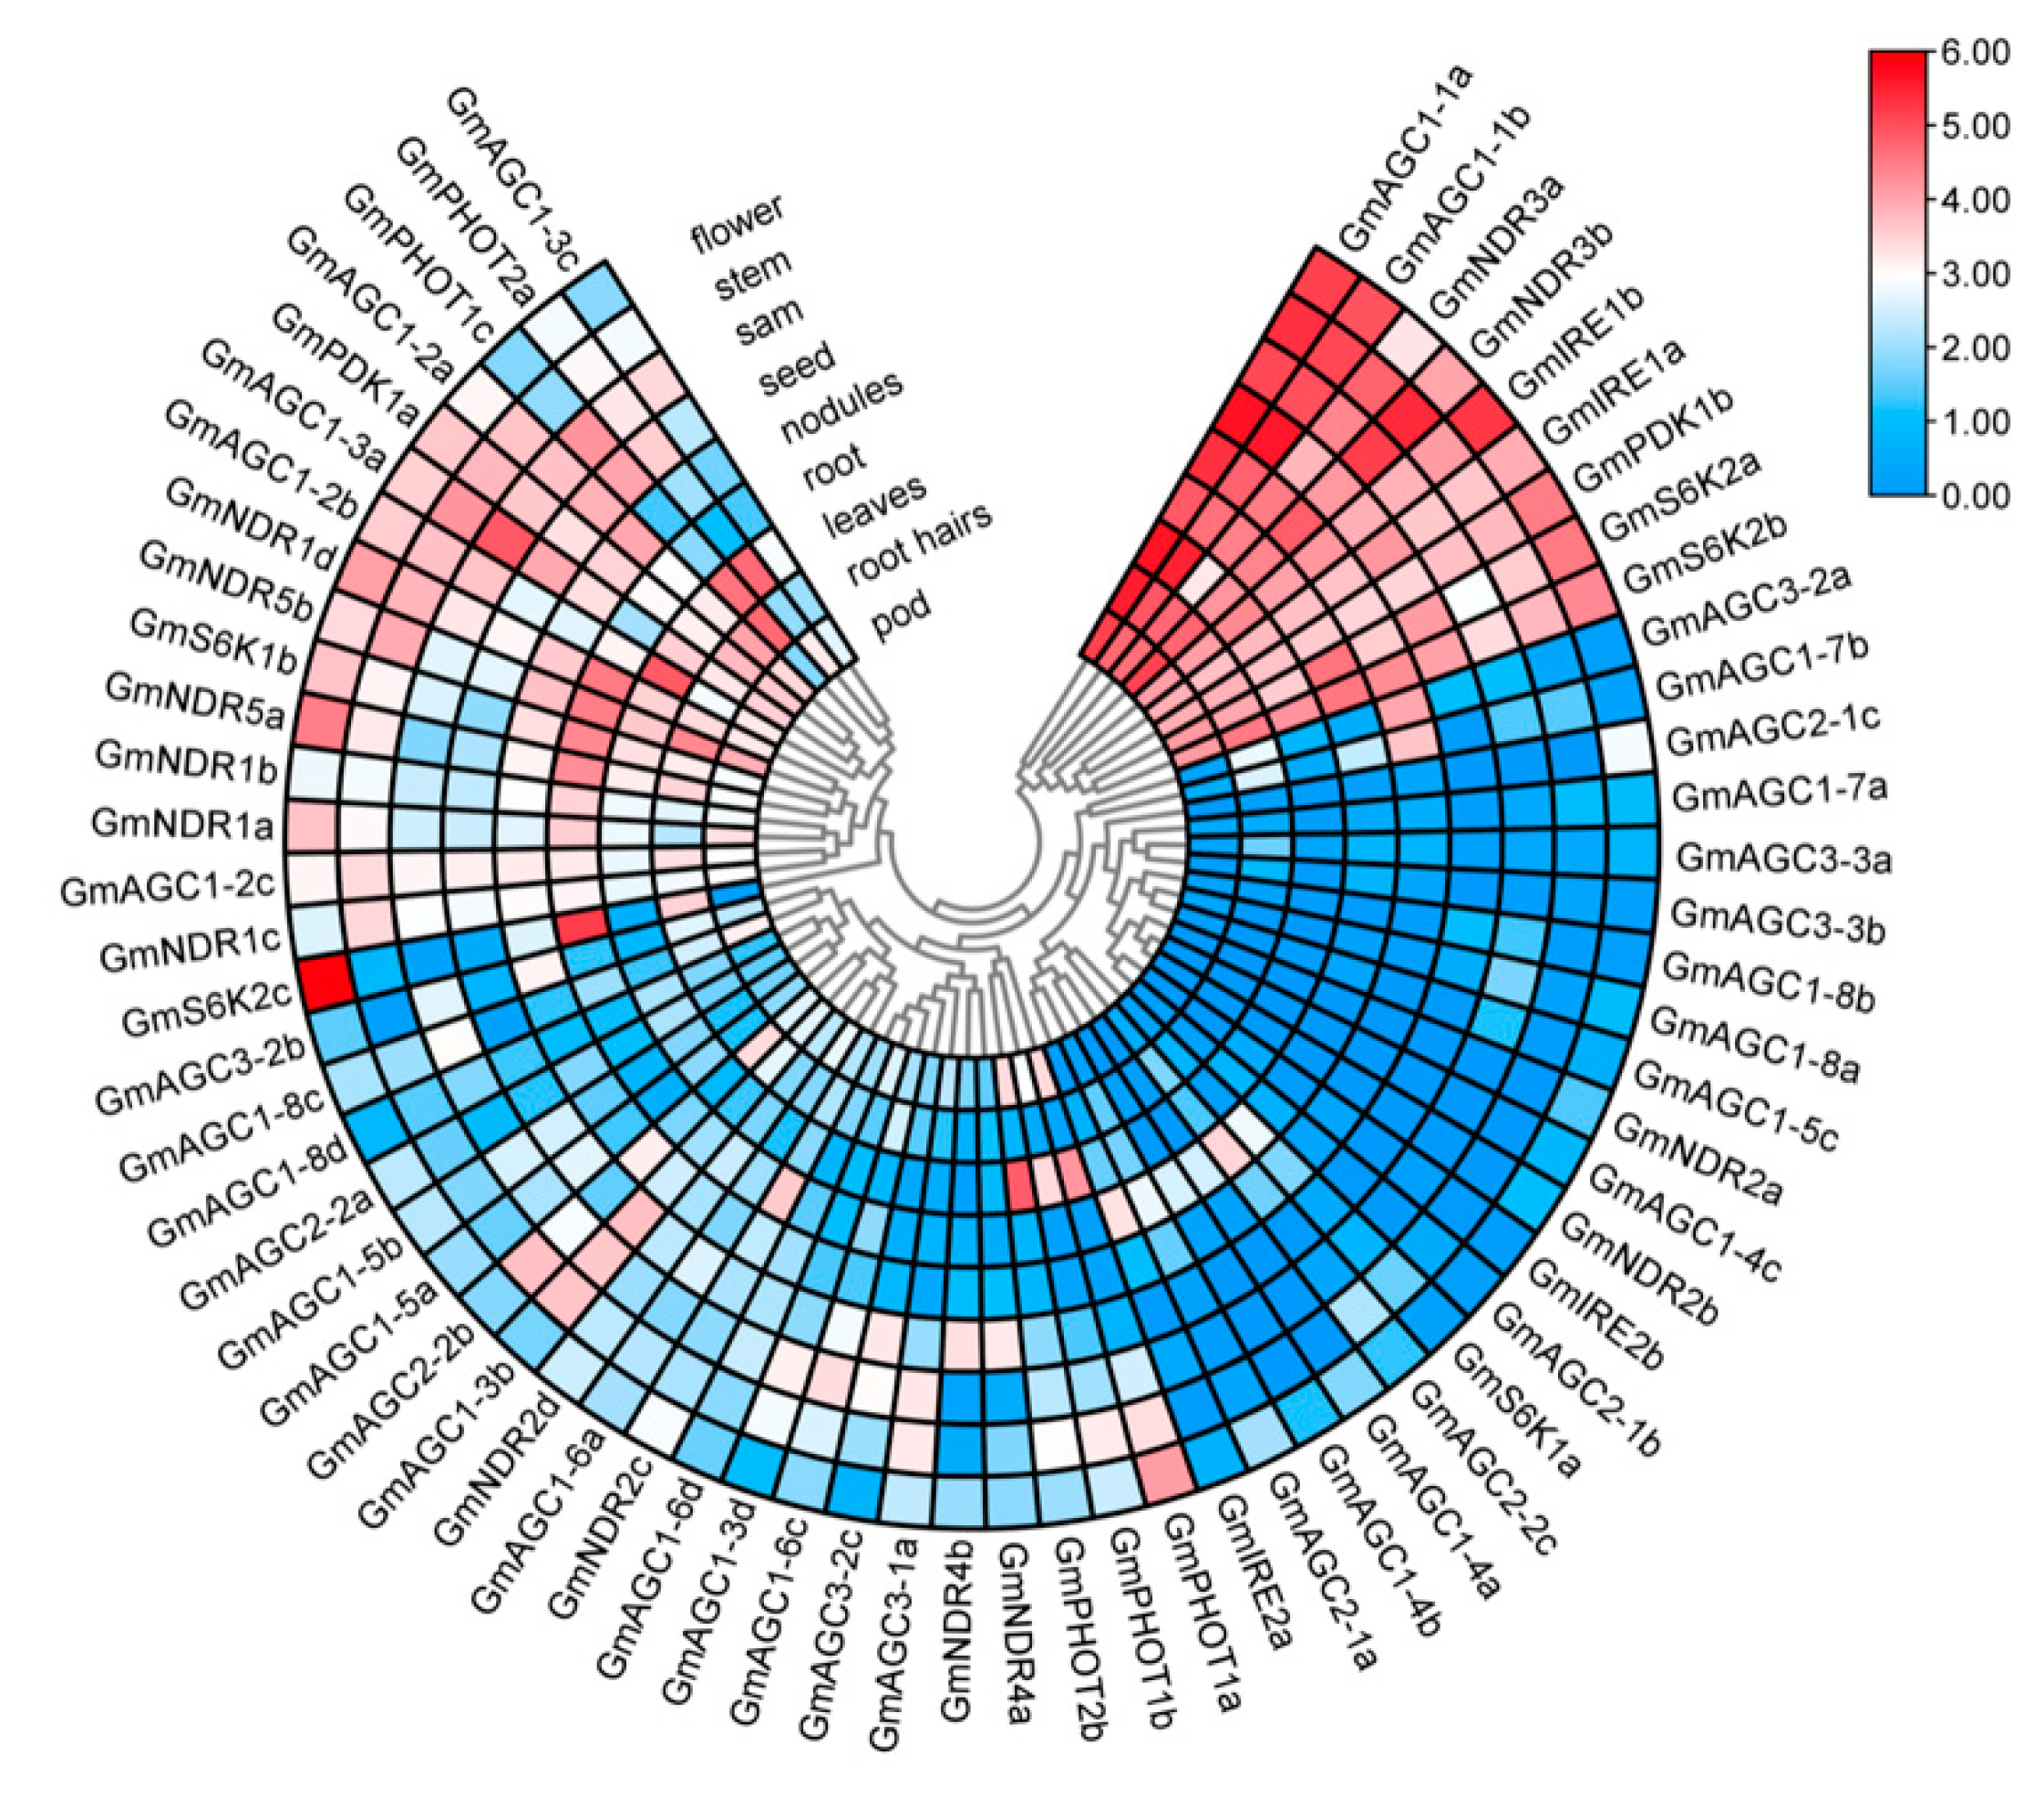
2.7. Expression Patterns of GmAGC Genes in Different Tissues

To investigate the potential functions of GmAGC genes, we analyzed their expression profiles across various soybean tissues, including leaves, seeds, shoot apical meristems (SAMs), pods, stems, flowers, roots, root hairs, and nodules. RNA-seq data from Phytozome provided a comprehensive gene expression atlas across these tissues, enabling a detailed characterization and comparison of GmAGC transcript levels (Table S5). However, three genes (GmAGC1-5d, GmAGC1-6b, and GmAGC3-1b) lacked RNA-seq data, likely because they have not been annotated in the reference genome.
The RNA-seq analysis identified nine GmAGC genes (GmAGC1-1a, GmAGC1-1b, GmNDR3a, GmNDR3b, GmIRE1a, GmIRE1b, GmPDK1b, GmS6K2a, and GmS6K2b) with high transcript abundance across all tissues examined (Figure 5). In contrast, several genes (GmAGC2-1b, GmIRE2b, GmNDR2a, GmAGC1-5c, GmAGC1-8a, and GmAGC1-8b) displayed low transcript levels. Most GmAGC genes exhibited preferential expression, with distinct peaks in one or two specific tissues (Figure 5). Interestingly, three genes (GmNDR2a, GmNDR2b, and GmAGC1-4c) were exclusively expressed in flowers, suggesting their specialized roles in floral development.
In soybeans, a significant proportion (87.88%) of the analyzed GmAGC genes were constitutively expressed across all nine tissue types, indicating that GmAGC genes are involved in multiple developmental processes. GmAGC genes were predominantly expressed in tissues associated with active cell division and development, such as roots, flowers, and SAM tissue. Among all of the analyzed tissues, approximately 19.7% (n = 66) of GmAGC genes exhibited the highest transcript levels in roots, 18.2% in flowers, 15.2% in SAM, 10.6% in stems, 10.6% in leaves, 10.6% in seeds, 7.6% in root hairs, 4.5% in nodules, and 3.0% in pods (Figure 5). Additionally, all five GmPHOT genes showed high transcript abundance in leaves, with GmPHOT1c also expressed in root hairs, which is consistent with its role as a blue light receptor.

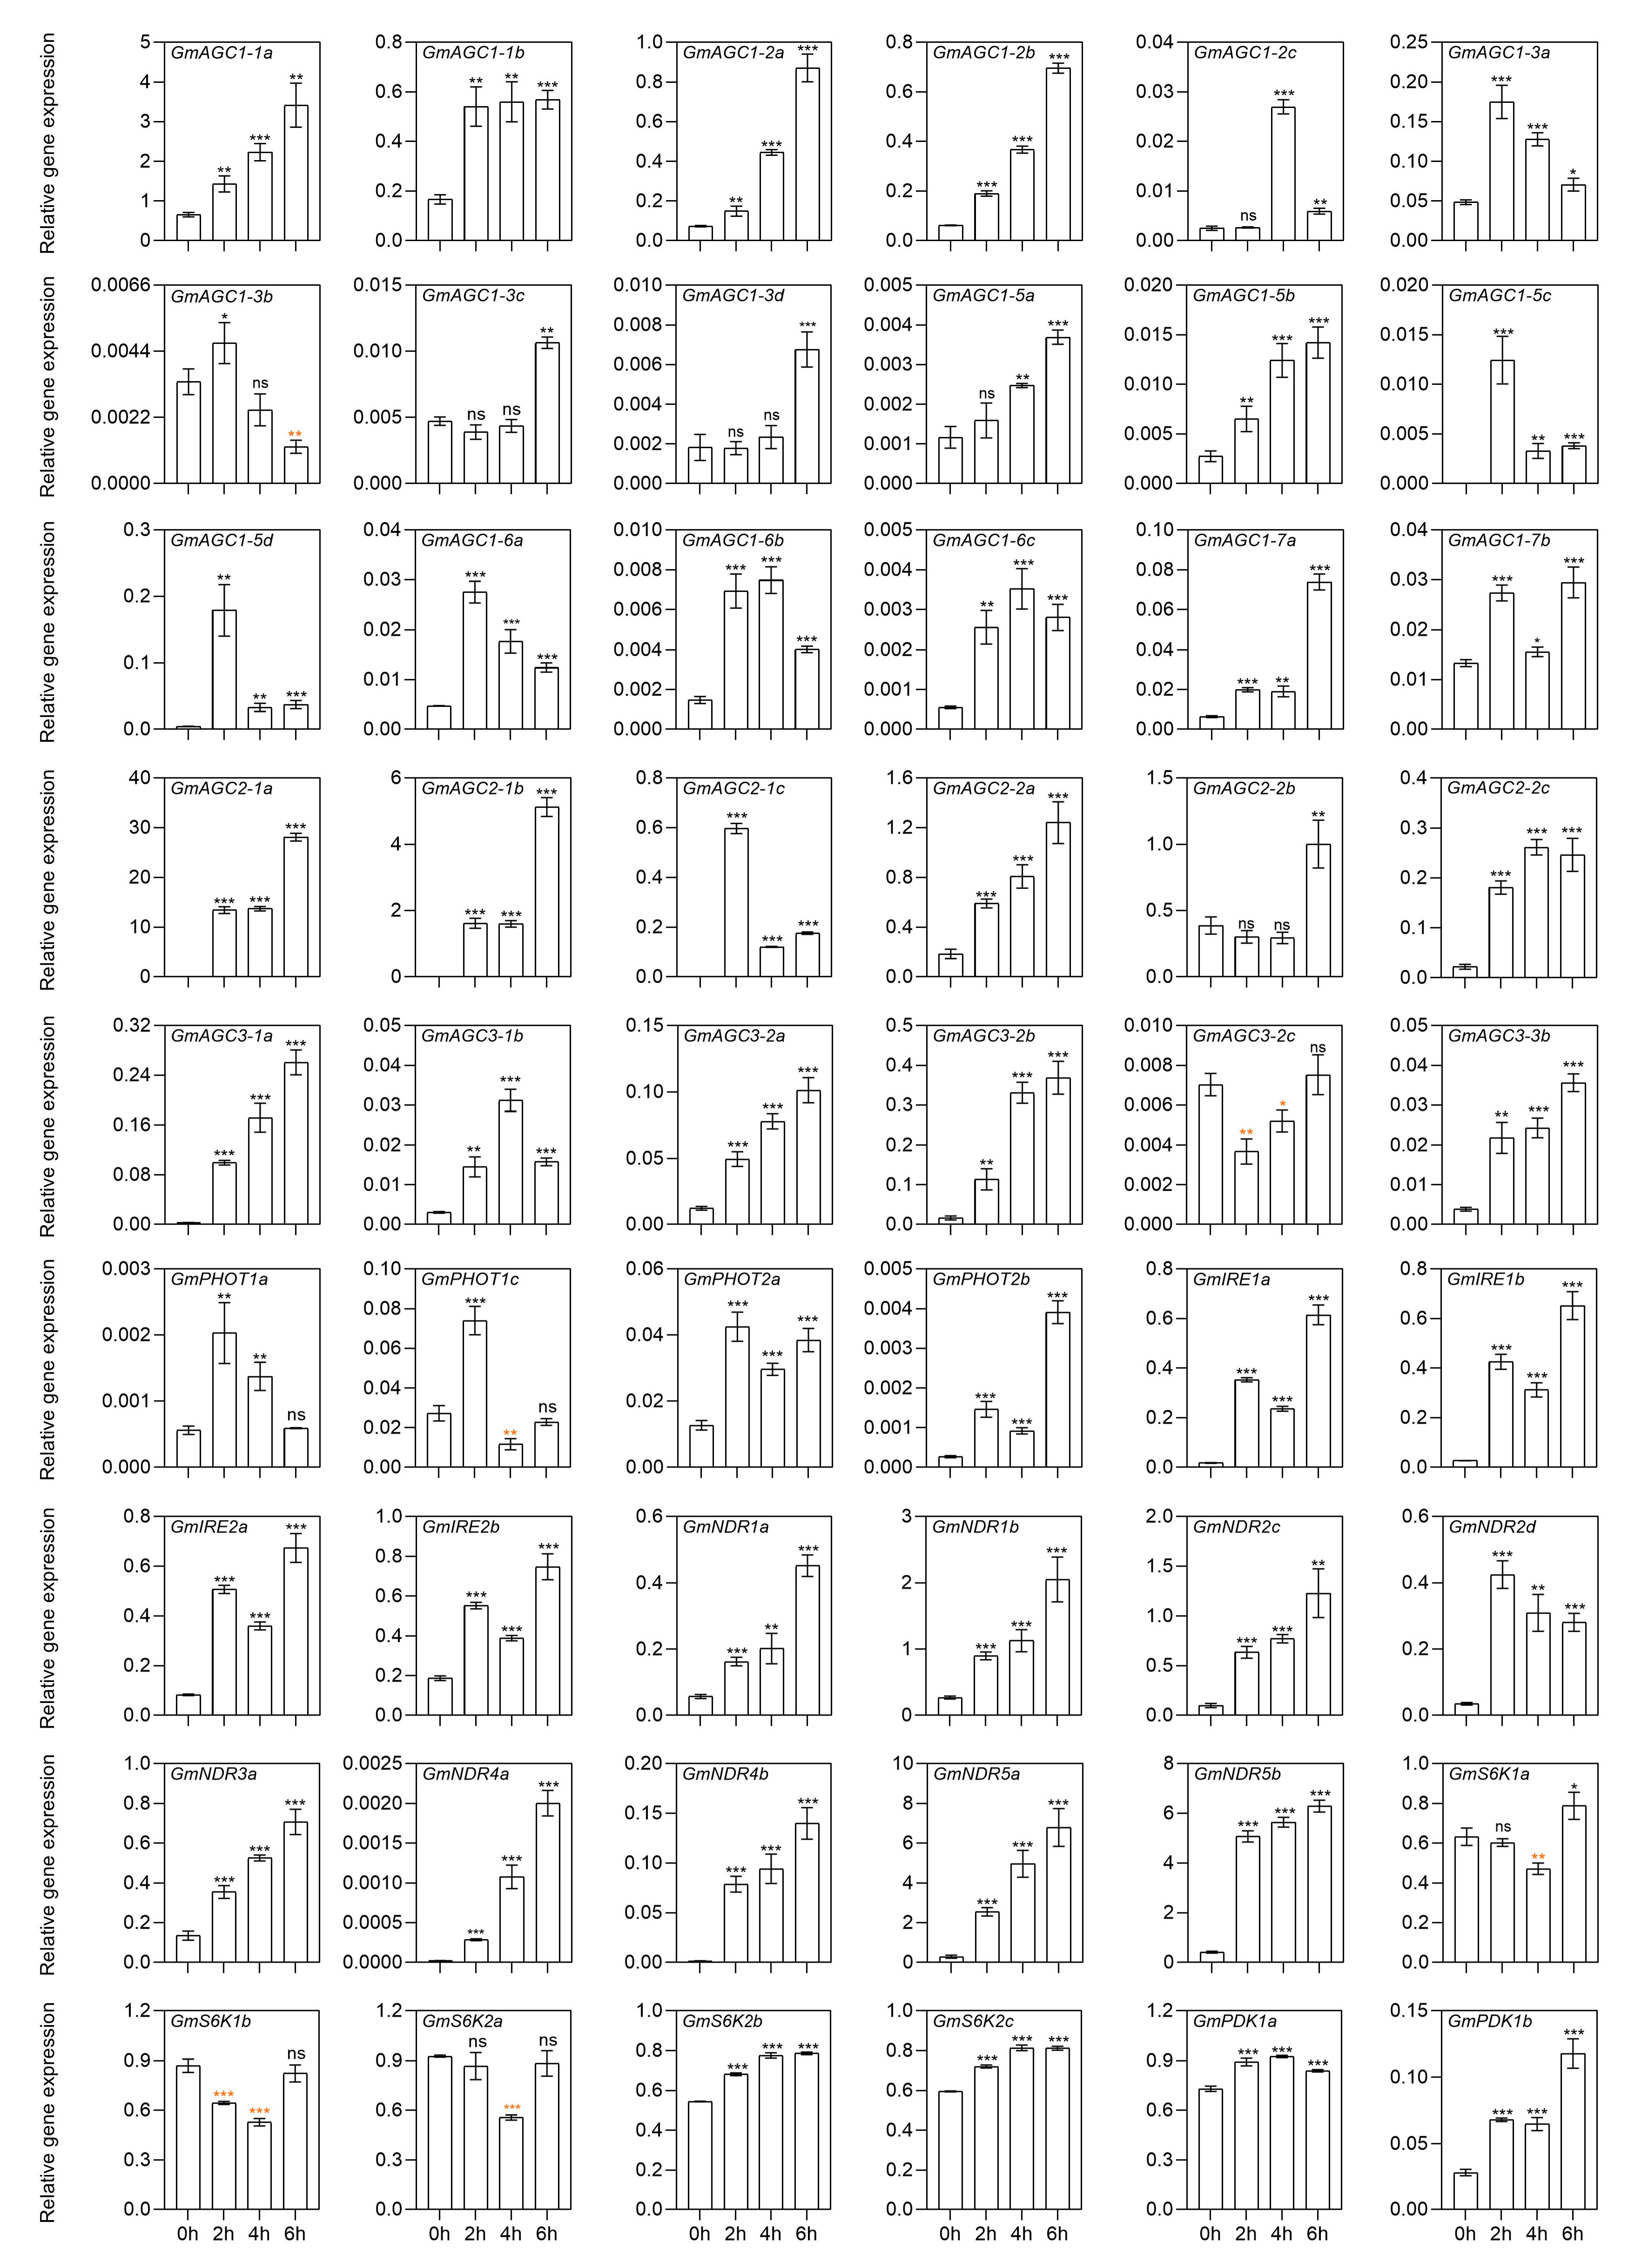
2.8. Gene Expression of GmAGC Members Under Salt Stress

The presence of stress-responsive elements in the promoters of GmAGC genes supports previous findings that AGC kinases play a vital role in responding to abiotic stresses. To identify genes involved in the salt stress response, 54 GmAGC genes were selected for qRT-PCR analysis. These genes were selected from all five subfamilies of the GmAGC kinase family. Expression levels were examined in leaves at 0 h, 2 h, 6 h, and 12 h, and in roots at 0 h, 2 h, 4 h, and 6 h following the salt treatment, as roots respond faster than leaves to salt stress due to being directly immersed in the sodium chloride solution.
Of the 54 genes analyzed, all were influenced by salt stress in either roots or leaves, indicating that most GmAGC genes are involved in the salt stress response (Figure 6 and Figure S4). The majority of these genes were upregulated in response to salt stress, though a few were downregulated. Specifically, GmAGC3-2c, GmS6K1a, GmS6K1b, and GmS6K2a were downregulated in roots, while GmAGC1-2a, GmAGC1-3c, GmAGC1-7a, GmAGC1-7b, GmAGC2-2b, GmPHOT1c, GmPHOT2a, GmPHOT2b, GmIRE2b, and GmPDK1b were downregulated in leaves (Figure 6 and Figure S4). In roots, several genes exhibited more than a 10-fold increase in expression after salt treatment, including GmAGC1-2a, GmAGC1-2b, GmAGC1-2c, GmAGC1-5c, GmAGC1-5d, GmAGC1-7a, GmAGC2-1a, GmAGC2-1b, GmAGC2-1c, GmAGC2-2c, GmAGC3-1a, GmAGC3-1b, GmAGC3-2b, GmAGC3-3b, GmPHOT2b, GmNDR4a, GmNDR4b, GmNDR5a, GmNDR5b, GmIRE1a, and GmIRE1b (Figure 6). Similarly, in leaves, genes such as GmAGC1-1b, GmAGC1-2c, GmAGC1-3a, GmAGC1-5a, GmAGC1-5c, GmAGC1-5d, GmAGC1-6b, GmAGC2-1c, GmAGC3-1b, GmAGC3-3b, GmNDR4a, GmNDR4b, GmS6K2a, and GmS6K2c exhibited more than a 10-fold increase in expression following salt treatment (Figure S4). These results suggest that upregulation is the predominant response of GmAGC genes under salt stress.
The genes showing increased expression in salt-treated roots can be categorized into three distinct groups. The first group includes genes that rapidly respond to salt stress, showing a notable rise in expression by 2 h, followed by a sustained or further increase in expression at 4 and 6 h. Genes such as GmAGC1-1a, GmAGC2-1a, GmAGC3-1a, GmNDR1a, GmS6K2a, and GmPDK1b all into this category. The second group includes genes with a slower response, showing no significant change in expression at 2 or 4 h and a marked upregulation only at 6 h, such as GmAGC1-3a, GmAGC1-3b, and GmAGC2-2b. The third group includes genes that peak at 2 or 4 h, followed by a decrease in expression, such as GmAGC1-2c, GmAGC1-5c, GmAGC2-1c, and GmPHOT1a. Similar patterns were also observed in salt-treated leaves, though some genes exhibited different expression trends between roots and leaves. While the majority of GmAGC genes displayed consistent expression patterns between roots and leaves, some exhibited differential or even opposite trends. For instance, GmAGC1-2a, GmAGC1-7a, GmAGC1-7b, GmAGC2-2b, GmPHOT1c, GmPHOT2a, GmPHOT2b, and GmPDK1b were upregulated in roots but downregulated in leaves. These findings suggest that specific GmAGC genes play distinct roles in the soybean response to salt stress. Their expression patterns reflect both spatial and temporal regulation, with each gene contributing to the plant’s overall ability to adapt to environmental challenges.

3. Discussion

AGC protein kinases are a subgroup of serine/threonine kinases found across eukaryotes; they play essential roles in receptor-mediated growth factor signal transduction. These kinases are critical for regulating plant growth, cell death, immunity, and responses to abiotic stresses. However, AGC protein kinases have not yet been identified in G. max (soybean), and the functions of GmAGC genes in soybeans remain largely unexplored. In this study, we identified 69 GmAGC genes in soybeans and conducted a comprehensive analysis of their characterization, collinearity, sequence structure, cis-elements, and expression patterns. Several classification systems for the AGC kinase family in plants have been proposed. In 2003, the A. thaliana AGC kinase family was divided into six subfamilies based on evolutionary relationships and functional differences: PDK1, AGCVI, AGCVII, AGCVIIIa (including AGC1 and AGC3), AGCVIIIb (including AGC2 and AGC4), and the AGC (other) subfamily [6]. In 2007, the AGCVIII members of A. thaliana were further classified into four subgroups based on their protein domains: AGC1, AGC2, AGC3, and AGC4, and the AGC kinase family was reorganized into five subfamilies: PDK1, AGCVI, AGCVII, AGCVIII, and AGC (other) [34]. This nomenclature system is widely adopted in plant research [10,40]. An alternative classification system, based on the one used for human and animal AGC kinases, divides a plant’s AGC kinase family into seven subfamilies: PDK, S6K (AGCVI), NDR (AGCVII), IRE (AGC (other)), AGC1, AGC2, and AGC2 related [5]. In this study, we classified the GmAGC kinase genes in soybeans into five subfamilies, PDK1, AGCVI, AGCVII, AGCVIII, and AGC (other), based on the second classical classification system and the phylogenetic relationship with AtAGC genes.
In contrast to the A. thaliana AGC family, a significantly larger number of GmAGC genes were identified in soybeans. This expanded gene pool likely reflects the complex evolutionary history of G. max, which has undergone one whole-genome triplication (Gamma WGT) and two whole-genome duplication events (legume WGD and Glycine WGD) (Figure S2) [41]. This genetic expansion is believed to have enhanced the ability of flowering plants, including soybeans, to adapt to new environments [42]. In our study, 54 gene pairs from the GmAGC family were found to have undergone duplication events. The earliest duplication event was observed in the GmNDR2c/GmNDR1d gene pair, which occurred during the Gamma WGT around 176.75 million years ago. Additionally, the GmAGC2-1a/GmAGC2-1b and GmAGC2-1c/GmAGC2-1b gene pairs also resulted from Gamma WGT, suggesting that these are among the more ancient AGC kinase genes in soybeans. Previous research has shown that PHOT2 represents the most ancient AGCVIII kinase gene and is present in all plant species, while PHOT1, a duplication of the ancestral PHOT2, appeared later and is limited to seed plants [12]. In soybeans, no duplication was found for GmPHOT2s genes. Instead, the GmPHOT1s gene underwent duplication during both the legume WGD and Glycine WGD events (Figure S2). Gene replication events, including tandem duplications, fragment duplications, and transpositions, have contributed to the expansion of gene families in soybeans. The GmAGC kinase developed primarily through segmental or WGD duplication (Table 2) [43]. This pattern of gene expansion through duplication aligns with similar findings in other plant species, such as rice, where the AGC gene family also expanded through segmental and WGD events [16]. These findings reinforce the idea that such mechanisms are key drivers of the AGC gene family’s expansion in the G. max genome, likely contributing to the emergence of new functional genes within the GmAGC family. The Ka/Ks ratios for the soybean AGC kinase homologs were all less than 1, indicating that these genes have undergone purifying selection. Purifying selection eliminates harmful mutations, preserving the functional integrity of these genes over time [44]. This selective pressure suggests that AGC kinases play crucial roles in soybean physiology, and significant alterations to these genes could be detrimental to the plant. Similar patterns of purifying selection have been observed in other plant species, further confirming the conserved nature of the AGC kinase gene family across diverse plant lineages [16,18].
The gene structure of GmAGC genes in soybeans exhibits notable variability in terms of exon–intron organization. For instance, genes in the GmAGC1, GmAGC2, and GmAGC3 subfamilies typically contain 1 to 2 exons, whereas genes in the GmAGC4 subfamily (GmPHOTs) tend to have more introns, often with greater lengths (Figure 3c). The number and length of introns are closely associated with gene function, regulation, and evolutionary adaptation. Introns play a crucial role in post-transcriptional regulation, and genes with longer or more introns are more likely to undergo alternative splicing [45]. This process influences mRNA maturation timing and increases protein diversity, thereby enhancing functional complexity [46]. Such regulation allows for dynamic gene expression, especially in response to stress or environmental stimuli. Similar relationships between the intron structure and gene function have been observed in other plant species, including rice, where intron-rich genes show higher expression levels [47]. In soybean, genes with higher expression, including those in the PDK, AGCVI, AGCVII, and AGC (other) subfamilies, tend to have a higher number of introns compared to AGCVIII, which has fewer introns (Figure 3c and Table S3). Regarding protein characteristics, the GmIRE and GmAGC4 subfamilies are associated with larger proteins of higher molecular weight, suggesting more complex structural configurations linked to their biological functions. In contrast, the GmAGC and GmS6K2 subfamilies contain proteins with variable molecular weights, indicating functional diversity within these groups. This variability in protein size and structure likely reflects the diverse physiological roles of these kinases. Larger proteins may participate in more complex interactions or regulatory pathways, while smaller proteins might be involved in more direct signaling functions [48]. This functional diversification reinforces the idea that gene duplication and subsequent divergence have contributed to the specialization of gene functions within the AGC kinase family.
Gene expression patterns provide critical insights into gene function and are closely associated with the divergence of gene promoters. Cis-acting regulatory elements within these promoters play vital roles in regulating gene expression during development and in response to environmental stresses [49]. Among the most prevalent cis-elements in the promoters of GmAGC genes is the GT1-motif, which is involved not only in light stress but also in abiotic stress responses, particularly salinity stress [50,51]. Other salt-stress-related elements, such as ABRE, DRE/CRT, MBS, LTR, T/G box, and GC-motif, were also frequently found in these promoters [52,53,54]. The widespread presence of these stress-responsive elements emphasizes the crucial role of GmAGC genes in the plant’s response to abiotic stress, especially salinity. Additionally, the high occurrence of light-responsive and hormone-responsive elements in the GmAGC promoters, such as the G-box (light response), ABRE (abscisic acid response), and CGTCA-motif and TGACG-motif (MeJA response), suggests that these genes are tightly regulated by environmental and phytohormone signals, enabling the plant to adapt to fluctuating conditions (Figure 4 and Table S4). The involvement of GmAGC genes in light and hormone signaling pathways warrants further investigation to fully understand their regulatory mechanisms. Under salt stress, we observed that a notable proportion of GmAGC genes (50 out of 54) in roots were up-regulated in response to sodium chloride stress, indicating their involvement in the plant’s adaptive mechanisms to salt stress (Figure 6). While these findings provide valuable insights into the potential roles of AGC kinases in soybeans, limitations remain in terms of fully understanding their mechanistic functions in salt-induced stress tolerance. Further functional studies, including gene knockouts or overexpression experiments, are needed to confirm the roles of individual GmAGC genes in salinity stress tolerance pathways. Interestingly, while most GmAGC genes exhibited consistent expression patterns in salt-treated roots and leaves, some genes showed differential or even opposite expression between these tissues. This differential expression likely reflects tissue-specific adaptations to salt stress, with certain genes playing more prominent roles in one tissue over another. Such complexity in gene expression highlights the intricate regulatory networks that govern plant responses to environmental challenges [55].

4. Materials and Methods

4.1. Sequence Retrieval of AGC Protein Kinase Family Members in G. max

The A. thaliana Information Resource (TAIR) database (https://www.arabidopsis.org/, accessed on 7 November 2024) and the Phytozome database (https://phytozome-next.jgi.doe.gov, accessed on 7 November 2024) were used to classify the members of the AGC gene family. To determine the number and sequence of AGC kinase genes in A. thaliana, we retrieved the complete set of AGC kinase gene sequences from the TAIR database. These sequences were then used as queries for sequence comparison to identify homologous genes in soybeans (Williams 82) on the Phytozome website. The identified AGC kinase genes in soybeans were further validated by analyzing the presence of conserved structural domains typical of AGC kinases using the HMMER tool v3.3 (http://www.ebi.ac.uk/Tools/hmmer, accessed on 7 November 2024), ensuring the accuracy of gene family identification.

4.2. Phylogenetic Tree Construction, Gene Structure, and Conserved Motif Analysis of the GmAGC Gene Family

Phylogenetic analysis was performed to examine the evolutionary relationships within the AGC gene family of A. thaliana and soybean. A phylogenetic tree was constructed using protein sequences from the soybean AGC gene family and their corresponding homologs in A. thaliana. Arabidopsis was selected as the reference species due to its well-characterized genome and established AGC gene classification, which facilitated the classification of soybean AGC genes based on the tree. For sequence alignment, the ClustalW method was employed, and the phylogenetic tree was constructed using the neighbor-joining method in MEGA 11 with 1000 bootstrap replicates. The phylogenetic analysis results were visualized using iTOL v7 (https://itol.embl.de). Protein characteristics, including the amino acid number, molecular weight, and isoelectric point, were predicted using the Protein Parameter Calculator in TBtools-II (v2.153) [56]. The subcellular localization of the AGC proteins was analyzed using the Softberry online tool (http://www.softberry.com, accessed on 16 November 2024). A motif analysis of the protein sequences was performed using the MEME suite (https://meme-suite.org/meme/tools/meme, accessed on 16 November 2024), and the gene structure was visualized using TBtools-II.

4.3. Collinearity Analysis of AGC Genes

A collinearity analysis was conducted to examine AGC gene duplication events in the soybean genome using the MCScanX toolkit v1.0 with default parameters. This analysis identified and visualized duplicated AGC gene pairs, which were subsequently mapped across the soybean genome using TBtools-II. To further investigate the evolutionary dynamics of these duplicated genes, the Simple Ka/Ks tool in TBtools-II was used to calculate nonsynonymous (Ka) and synonymous (Ks) substitution rates, along with their Ka/Ks ratios. The divergence time (T) for each duplicated gene pair was estimated using the formula T = Ks/(2 × 9.1 × 10−9) × 10−6 million years ago (Mya), providing insights into the timing of gene duplication events within the soybean genome [57]. The Ks value range was assessed based on the criteria outlined by Severin et al. [41]. A Ks value greater than 1.5 corresponds to the divergence time within the whole-genome triplication (WGT) event (~130 to 240 Mya), also known as the Gamma event. A Ks value lower than 0.3 indicates divergence during the Glycine whole-genome duplication (WGD) event (~13 Mya), while Ks values between 0.3 and 1.5 correspond to the Legume WGD event (~58 Mya).

4.4. Cis-Acting Elements Analysis of GmAGC Genes

Promoter sequences 2 kb upstream of the transcription start sites of GmAGC genes in G. max were selected for analysis to identify cis-acting regulatory elements. These sequences were analyzed to identify the cis-acting elements involved in gene regulation. Cis-elements were predicted using the PlantCARE online tool (http://bioinformatics.psb.ugent.be/webtools/plantcare/html/, accessed on 22 November 2024), which offers a comprehensive database of plant regulatory elements. The cis-acting elements of GmAGC genes were then visualized using TBtools-II.

4.5. Gene Expression Analysis of GmAGC Genes

Gene expression data for GmAGC genes across various tissues and developmental stages were obtained from the Phytozome database and visualized using TBtools-II. Salt stress treatments were carried out as follows: soybean seeds (Williams 82) were germinated on germination paper for three days and then transplanted into a 1/2 modified Hoagland nutrient solution (Coolaber, NS10115, Beijing, China) for 10 days under a 16 h light/8 h dark photoperiod at 25 °C. Subsequently, the plants were subjected to sodium chloride treatments at 0 mM and 150 mM. qRT-PCR was conducted to evaluate the expression levels of GmAGC genes in soybean leaves at 0, 2, 6, and 12 h after salt treatment and in roots at 0, 2, 4, and 6 h. The Ultrapure RNA Kit (CWBIO, Taizhou, China) was employed for RNA extraction. The PrimeScript™ RT reagent Kit with gDNA Eraser (Takara, Japan) was used for reverse transcription to synthesize cDNA. TB Green® Premix Ex Taq™ II (Takara, Kyoto, Japan) was used for the quantitative real-time PCR reactions on the Roche PCR instrument. Relative expression levels were calculated using the 2−ΔΔCT method, with GmActin as the internal control. For expression result analysis, the t-test was used for the significance analysis, and the level of significance was indicated with asterisks (* p < 0.05, ** p < 0.01, and *** p < 0.001). Primer sequences for qRT-PCR are provided in Supplementary Table S6.

5. Conclusions

In this study, we identified 69 AGC kinase genes in G. max (soybean), classified into five subfamilies, and examined their roles in salinity stress responses. Our findings demonstrate significant expansion of the GmAGC gene family through gene duplications, particularly within the AGCVI, AGCVII, and AGCVIII subfamilies. The gene expression analysis revealed that most GmAGC genes are upregulated in roots and leaves under salt stress, underscoring their essential role in stress adaptation. The presence of stress-responsive cis-elements in gene promoters further confirms their involvement in salinity tolerance. These findings enhance our understanding of the molecular mechanisms underlying salt stress tolerance in G. max and provide valuable insights for improving crop strategies against abiotic stress.

Supplementary Materials

The following supporting information can be downloaded at: https://www.mdpi.com/article/10.3390/ijms26062588/s1.

Author Contributions

Conceptualization, Y.T. and X.L.; methodology, W.L. (Wenmin Liu) and Y.T.; validation, W.L. (Wenmin Liu) and Y.C.; formal analysis, W.L. (Wenmin Liu) and W.L. (Wenmin Lin); investigation, W.L. (Wenmin Liu) and S.Y. (Shuichan Yang); writing—original draft preparation, Y.T.; writing—review and editing, X.L. and B.L.; visualization, W.L. (Wenmin Liu), S.Y. (Shuichan Yang) and S.Y. (Sujun Ye); supervision, B.L. All authors have read and agreed to the published version of the manuscript.

Funding

This research was funded by the National Natural Science Foundation of China (Grants number: 32172035, 32472075).

Institutional Review Board Statement

Not applicable.

Informed Consent Statement

Not applicable.

Data Availability Statement

All data generated or analyzed in this study are included in the main text and its Supplementary Materials.

Conflicts of Interest

The authors declare no conflicts of interest.

References

  1. Jin, S.; Wei, M.; Wei, Y.; Jiang, Z. Insights into Plant Sensory Mechanisms under Abiotic Stresses. Plants 2024, 13, 1907. [Google Scholar] [CrossRef] [PubMed]
  2. Chen, X.; Ding, Y.; Yang, Y.; Song, C.; Wang, B.; Yang, S.; Guo, Y.; Gong, Z. Protein Kinases in Plant Responses to Drought, Salt, and Cold Stress. J. Integr. Plant Biol. 2021, 63, 53–78. [Google Scholar] [CrossRef]
  3. Rademacher, E.H.; Offringa, R. Evolutionary Adaptations of Plant AGC Kinases: From Light Signaling to Cell Polarity Regulation. Front. Plant Sci. 2012, 3, 250. [Google Scholar] [CrossRef]
  4. Liu, J.; Li, W.; Wu, G.; Ali, K. An Update on Evolutionary, Structural, and Functional Studies of Receptor-like Kinases in Plants. Front. Plant Sci. 2024, 15, 1305599. [Google Scholar] [CrossRef]
  5. Rehman, A.; Alwutayd, K.M.; Alshehri, D.; Alsudays, I.M.; Azeem, F.; Rahman, S.; Abid, M.; Shah, A.A. Regulatory Role of AGC Genes in Heat Stress Adaptation in Maize (Zea mays). Funct. Plant Biol. 2024, 51, FP23282. [Google Scholar] [CrossRef]
  6. Bögre, L. Growth Signalling Pathways in Arabidopsis and the AGC Protein Kinases. Trends Plant Sci. 2003, 8, 424–431. [Google Scholar] [CrossRef]
  7. Ek-Ramos, M.J.; Avila, J.; Cheng, C.; Martin, G.B.; Devarenne, T.P. The T-Loop Extension of the Tomato Protein Kinase AvrPto-Dependent Pto-Interacting Protein 3 (Adi3) Directs Nuclear Localization for Suppression of Plant Cell Death. J. Biol. Chem. 2010, 285, 17584–17594. [Google Scholar] [CrossRef]
  8. Haga, K.; Hayashi, K.; Sakai, T. PINOID AGC Kinases Are Necessary for Phytochrome-Mediated Enhancement of Hypocotyl Phototropism in Arabidopsis. Plant Physiol. 2014, 166, 1535–1545. [Google Scholar] [CrossRef] [PubMed]
  9. Haga, K.; Sakai, T. Photosensory Adaptation Mechanisms in Hypocotyl Phototropism: How Plants Recognize the Direction of a Light Source. J. Exp. Bot. 2023, 74, 1758–1769. [Google Scholar] [CrossRef]
  10. Kamiyama, Y.; Katagiri, S.; Li, Y.; Yamashita, K.; Takase, H.; Umezawa, T. Hyperosmolarity-Induced Suppression of Group B1 Raf-like Protein Kinases Modulates Drought-Growth Trade-off in Arabidopsis. Proc. Natl. Acad. Sci. USA 2024, 121, e2419204121. [Google Scholar] [CrossRef]
  11. Wang, P.; Hsu, C.-C.; Du, Y.; Zhu, P.; Zhao, C.; Fu, X.; Zhang, C.; Paez, J.S.; Macho, A.P.; Tao, W.A.; et al. Mapping Proteome-Wide Targets of Protein Kinases in Plant Stress Responses. Proc. Natl. Acad. Sci. USA 2020, 117, 3270–3280. [Google Scholar] [CrossRef]
  12. Yang, Y.; Guo, Y. Unraveling Salt Stress Signaling in Plants. J. Integr. Plant Biol. 2018, 60, 796–804. [Google Scholar] [CrossRef]
  13. Garcia, A.V.; Al-Yousif, M.; Hirt, H. Role of AGC Kinases in Plant Growth and Stress Responses. Cell. Mol. Life Sci. 2012, 69, 3259–3267. [Google Scholar] [CrossRef]
  14. Winter, D.; Vinegar, B.; Nahal, H.; Ammar, R.; Wilson, G.V.; Provart, N.J. An “Electronic Fluorescent Pictograph” Browser for Exploring and Analyzing Large-Scale Biological Data Sets. PLoS ONE 2007, 2, e718. [Google Scholar] [CrossRef]
  15. Moreno, A.A.; Mukhtar, M.S.; Blanco, F.; Boatwright, J.L.; Moreno, I.; Jordan, M.R.; Chen, Y.; Brandizzi, F.; Dong, X.; Orellana, A.; et al. IRE1/bZIP60-Mediated Unfolded Protein Response Plays Distinct Roles in Plant Immunity and Abiotic Stress Responses. PLoS ONE 2012, 7, e31944. [Google Scholar] [CrossRef] [PubMed]
  16. Jiang, Y.; Liu, X.; Zhou, M.; Yang, J.; Ke, S.; Li, Y. Genome-Wide Identification of the AGC Protein Kinase Gene Family Related to Photosynthesis in Rice (Oryza sativa). Int. J. Mol. Sci. 2022, 23, 12557. [Google Scholar] [CrossRef] [PubMed]
  17. Zhu, X.; Yang, K.; Wei, X.; Zhang, Q.; Rong, W.; Du, L.; Ye, X.; Qi, L.; Zhang, Z. The Wheat AGC Kinase TaAGC1 Is a Positive Contributor to Host Resistance to the Necrotrophic Pathogen Rhizoctonia cerealis. J. Exp. Bot. 2015, 66, 6591–6603. [Google Scholar] [CrossRef]
  18. Ahmad, F.; Abdullah, M.; Khan, Z.; Stępień, P.; Rehman, S.U.; Akram, U.; Rahman, M.H.U.; Ali, Z.; Ahmad, D.; Gulzar, R.M.A.; et al. Genome-Wide Analysis and Prediction of Chloroplast and Mitochondrial RNA Editing Sites of AGC Gene Family in Cotton (Gossypium hirsutum L.) for Abiotic Stress Tolerance. BMC Plant Biol. 2024, 24, 888. [Google Scholar] [CrossRef]
  19. Matsui, H.; Miyao, A.; Takahashi, A.; Hirochika, H. Pdk1 Kinase Regulates Basal Disease Resistance Through the OsOxi1–OsPti1a Phosphorylation Cascade in Rice. Plant Cell Physiol. 2010, 51, 2082–2091. [Google Scholar] [CrossRef]
  20. Wu, X.; Pan, L.; Guo, X.; Li, T.; Li, J.; Duan, Q.; Huang, J. Genome-Wide Identification and Expression Analysis of BrAGC Genes in Brassica Rapa Reveal Their Potential Roles in Sexual Reproduction and Abiotic Stress Tolerance. Front. Genet. 2022, 13, 1044853. [Google Scholar] [CrossRef]
  21. Li, X.; Yu, Q.; Hua, X.; He, J.; Liu, J.; Peng, L.; Wang, J.; Li, X.; Yang, Y. Phosphorylation of ADF7-Mediated by AGC1.7 Regulates Pollen Germination in Arabidopsis thaliana. Plant Cell Environ. 2025, 48, 1149–1161. [Google Scholar] [CrossRef] [PubMed]
  22. Martínez-Arenas, L.; Bayascas, J.R. Capturing Conformational Transitions of Full-Length PDK1 That Dictate Kinase Substrate Selectivity. Sci. Signal. 2023, 16, eadh5114. [Google Scholar] [CrossRef] [PubMed]
  23. Scholz, S.; Pleßmann, J.; Enugutti, B.; Hüttl, R.; Wassmer, K.; Schneitz, K. The AGC Protein Kinase UNICORN Controls Planar Growth by Attenuating PDK1 in Arabidopsis thaliana. PLOS Genet. 2019, 15, e1007927. [Google Scholar] [CrossRef]
  24. Tan, S.; Zhang, X.; Kong, W.; Yang, X.-L.; Molnár, G.; Vondráková, Z.; Filepová, R.; Petrášek, J.; Friml, J.; Xue, H.-W. The Lipid Code-Dependent Phosphoswitch PDK1–D6PK Activates PIN-Mediated Auxin Efflux in Arabidopsis. Nat. Plants 2020, 6, 556–569. [Google Scholar] [CrossRef]
  25. Xiao, Y.; Offringa, R. PDK1 Regulates Auxin Transport and Arabidopsis Vascular Development through AGC1 Kinase PAX. Nat. Plants 2020, 6, 544–555. [Google Scholar] [CrossRef]
  26. Ren, Q.W.; Liu, T.Y.; Lan, H.J.; Li, Z.C.; Huang, M.J.; Zhao, Y.T.; Chen, Y.; Liao, L.N.; Ma, X.H.; Liu, J.Z. Partially Knocking out NtPDK1a/1b/1c/1d Simultaneously in Nicotiana tabacum Using CRISPR/CAS9 Technology Results in Auxin-Related Developmental Defects. Plant Sci. 2024, 343, 112057. [Google Scholar] [CrossRef]
  27. Obomighie, I.; Lapenas, K.; Murphy, B.E.; Bowles, A.M.C.; Bechtold, U.; Prischi, F. The Role of Ribosomal Protein S6 Kinases in Plant Homeostasis. Front. Mol. Biosci. 2021, 8, 636560. [Google Scholar] [CrossRef]
  28. Yoon, H.S.; Fujino, K.; Liu, S.; Takano, T.; Tsugama, D. NDR/LATS-family Protein Kinase Genes Are Indispensable for Embryogenesis in Arabidopsis. FEBS Open Bio 2021, 11, 2600–2606. [Google Scholar] [CrossRef]
  29. Zhou, P.; Liang, Y.; Mei, J.; Liao, H.; Wang, P.; Hu, K.; Chen, L.; Zhang, X.; Ye, D. The Arabidopsis AGC Kinases NDR2/4/5 Interact with MOB1A/1B and Play Important Roles in Pollen Development and Germination. Plant J. 2021, 105, 1035–1052. [Google Scholar] [CrossRef]
  30. Yue, X.; Guo, Z.; Shi, T.; Song, L.; Cheng, Y. Arabidopsis AGC Protein Kinases IREH1 and IRE3 Control Root Skewing. J. Genet. Genom. 2019, 46, 259–267. [Google Scholar] [CrossRef]
  31. Pislariu, C.I.; Dickstein, R. The AGC Kinase MtIRE: A Link to Phospholipid Signaling During Nodulation? Plant Signal. Behav. 2007, 2, 314–316. [Google Scholar] [CrossRef] [PubMed]
  32. Zhao, H.; Sun, P.; Tong, C.; Li, X.; Yang, T.; Jiang, Y.; Zhao, B.; Dong, J.; Jiang, B.; Shen, J.; et al. CsIREH1 Phosphorylation Regulates DELLA Protein Affecting Plant Height in Cucumber (Cucumis sativus). New Phytol. 2024, 245, 1528–1546. [Google Scholar] [CrossRef] [PubMed]
  33. Zhang, Y.; McCormick, S. AGCVIII Kinases: At the Crossroads of Cellular Signaling. Trends Plant Sci. 2009, 14, 689–695. [Google Scholar] [CrossRef]
  34. Galván-Ampudia, C.S.; Offringa, R. Plant Evolution: AGC Kinases Tell the Auxin Tale. Trends Plant Sci. 2007, 12, 541–547. [Google Scholar] [CrossRef]
  35. Zhang, Y. AGC Protein Kinase AGC1-4 Mediates Seed Size in Arabidopsis. Plant Cell Rep. 2020, 39, 825–837. [Google Scholar] [CrossRef]
  36. Han, J. AGC Kinases OXI1 and AGC2-2 Regulate Camalexin Secretion and Disease Resistance by Phosphorylating Transporter PDR6. Plant Physiol. 2024, 195, 1835–1850. [Google Scholar] [CrossRef]
  37. Zeng, W.; Wang, X.; Li, M. PINOID-centered Genetic Interactions Mediate Auxin Action in Cotyledon Formation. Plant Direct 2024, 8, e587. [Google Scholar] [CrossRef]
  38. Wan, Y.L.; Eisinger, W.; Ehrhardt, D.; Kubitscheck, U.; Baluska, F.; Briggs, W. The Subcellular Localization and Blue-Light-Induced Movement of Phototropin 1-GFP in Etiolated Seedlings of Arabidopsis thaliana. Mol. Plant 2008, 1, 103–117. [Google Scholar] [CrossRef]
  39. Amanullah; Khan, J.A.; Yasir, M. Improving soybean yield and oil productivity: An integrated nutrient management approach for sustainable soybean production. BMC Plant Biol. 2025, 25, 293. [Google Scholar] [CrossRef]
  40. Graf, A.; Bassukas, A.E.L.; Xiao, Y.; Barbosa, I.C.R.; Mergner, J.; Grill, P.; Michalke, B.; Kuster, B.; Schwechheimer, C. D6PK plasma membrane polarity requires a repeated CXX(X)P motif and PDK1-dependent phosphorylation. Nat. Plants 2024, 10, 300–314. [Google Scholar] [CrossRef]
  41. Severin, A.J.; Cannon, S.B.; Graham, M.M.; Grant, D.; Shoemaker, R.C. Changes in Twelve Homoeologous Genomic Regions in Soybean Following Three Rounds of Polyploidy. Plant Cell 2011, 23, 3129–3136. [Google Scholar] [CrossRef] [PubMed]
  42. Zhang, L.; Wu, S.; Chang, X.; Wang, X.; Zhao, Y.; Xia, Y.; Trigiano, R.N.; Jiao, Y.; Chen, F. The Ancient Wave of Polyploidization Events in Flowering Plants and Their Facilitated Adaptation to Environmental Stress. Plant Cell Environ. 2020, 43, 2847–2856. [Google Scholar] [CrossRef]
  43. Zhu, Y.; Wu, N.; Song, W.; Yin, G.; Qin, Y.; Yan, Y.; Hu, Y. Soybean (Glycine max) Expansin Gene Superfamily Origins: Segmental and Tandem Duplication Events Followed by Divergent Selection among Subfamilies. BMC Plant Biol. 2014, 14, 93. [Google Scholar] [CrossRef]
  44. Omer, S.; Harlow, T.J.; Gogarten, J.P. Does Sequence Conservation Provide Evidence for Biological Function? Trends Microbiol. 2017, 25, 11–18. [Google Scholar] [CrossRef]
  45. Szakonyi, D.; Duque, P. Alternative Splicing as a Regulator of Early Plant Development. Front. Plant Sci. 2018, 9, 1174. [Google Scholar] [CrossRef]
  46. Tu, Z.; Shen, Y.; Wen, S.; Zong, Y.; Li, H. Alternative Splicing Enhances the Transcriptome Complexity of Liriodendron chinense. Front. Plant Sci. 2020, 11, 578100. [Google Scholar] [CrossRef] [PubMed]
  47. Deshmukh, R.K.; Sonah, H.; Singh, N.K. Intron Gain, a Dominant Evolutionary Process Supporting High Levels of Gene Expression in Rice. J. Plant Biochem. Biotechnol. 2016, 25, 142–146. [Google Scholar] [CrossRef]
  48. Pandey, S. Heterotrimeric G-Protein Signaling in Plants: Conserved and Novel Mechanisms. Annu. Rev. Plant Biol. 2019, 70, 213–238. [Google Scholar] [CrossRef] [PubMed]
  49. Yamaguchi-Shinozaki, K.; Shinozaki, K. Organization of Cis-Acting Regulatory Elements in Osmotic- and Cold-Stress-Responsive Promoters. Trends Plant Sci. 2005, 10, 88–94. [Google Scholar] [CrossRef]
  50. Park, H.C.; Kim, M.L.; Kang, Y.H.; Jeon, J.M.; Yoo, J.H.; Kim, M.C.; Park, C.Y.; Jeong, J.C.; Moon, B.C.; Lee, J.H.; et al. Pathogen- and NaCl-Induced Expression of the SCaM-4 Promoter Is Mediated in Part by a GT-1 Box That Interacts with a GT-1-Like Transcription Factor. Plant Physiol. 2004, 135, 2150–2161. [Google Scholar] [CrossRef]
  51. Xu, H.; Shi, X.; He, L.; Guo, Y.; Zang, D.; Li, H.; Zhang, W.; Wang, Y. Arabidopsis thaliana Trihelix Transcription Factor AST1 Mediates Salt and Osmotic Stress Tolerance by Binding to a Novel AGAG-Box and Some GT Motifs. Plant Cell Physiol. 2018, 59, 946–965. [Google Scholar] [CrossRef]
  52. Urao, T.; Yamaguchi-Shinozaki, K.; Urao, S.; Shinozaki, K. An Arabidopsis Myb Homolog Is Induced by Dehydration Stress and Its Gene Product Binds to the Conserved MYB Recognition Sequence. Plant Cell 1993, 5, 1529–1539. [Google Scholar] [CrossRef] [PubMed]
  53. Narusaka, Y.; Nakashima, K.; Shinwari, Z.K.; Sakuma, Y.; Furihata, T.; Abe, H.; Narusaka, M.; Shinozaki, K.; Yamaguchi-Shinozaki, K. Interaction between Two Cis-acting Elements, ABRE and DRE, in ABA-dependent Expression of Arabidopsis rd29A Gene in Response to Dehydration and High-salinity Stresses. Plant J. 2003, 34, 137–148. [Google Scholar] [CrossRef] [PubMed]
  54. Wang, L.; Wang, C.; Qin, L.; Liu, W.; Wang, Y. ThERF1 Regulates Its Target Genes via Binding to a Novel Cis-acting Element in Response to Salt Stress. J. Integr. Plant Biol. 2015, 57, 838–847. [Google Scholar] [CrossRef]
  55. Zhu, C.; Schraut, D.; Hartung, W.; Schäffner, A.R. Differential Responses of Maize MIP Genes to Salt Stress and ABA. J. Exp. Bot. 2005, 56, 2971–2981. [Google Scholar] [CrossRef] [PubMed]
  56. Chen, C.; Wu, Y.; Li, J.; Wang, X.; Zeng, Z.; Xu, J.; Liu, Y.; Feng, J.; Chen, H.; He, Y.; et al. TBtools-II: A “One for All, All for One” Bioinformatics Platform for Biological Big-Data Mining. Mol. Plant 2023, 16, 1733–1742. [Google Scholar] [CrossRef]
  57. Du, J.; Tian, Z.; Sui, Y.; Zhao, M.; Song, Q.; Cannon, S.B.; Cregan, P.; Ma, J. Pericentromeric Effects Shape the Patterns of Divergence, Retention, and Expression of Duplicated Genes in the Paleopolyploid Soybean. Plant Cell 2012, 24, 21–32. [Google Scholar] [CrossRef]
Figure 1. Phylogenetic tree of AGCs from Glycine max and Arabidopsis thaliana. Each colored range in the tree represents different subfamilies of AGC kinase. The four AGCVIII groups are represented by bootstrap lines of varying colors: an orange-yellow line for the AGC4 group, a purple line for the AGC1 group, a green line for the AGC2 group, and a blue line for the AGC3 group.
Ijms 26 02588 g001
Figure 2. Chromosomal distribution and collinearity analysis of 69 GmAGC genes in Glycine max. (a) Chromosomal location of GmAGCs gene family members in G. max. The red to blue gradient represents varying gene density, with red indicating regions of high gene density and blue indicating of low gene density. (b) Collinearity relationship of GmAGCs gene family members in G. max.
Ijms 26 02588 g002
Figure 3. Gene structure and motif analysis of GmAGC genes in Glycine max. (a) Evolutionary relationship and distribution of conserved motifs of GmAGCs gene family members in G. max. (b) Distribution of essential domains of GmAGCs gene family members in G. max. (c) Gene structure of GmAGCs gene family members in G. max.
Ijms 26 02588 g003
Figure 4. Predicted cis-elements of the GmAGC gene family: (a) cis-element analysis in the promoter region of GmAGC genes. The number of cis-elements in each gene is indicated by the number. (b) Frequency of cis-elements in the promoter regions of GmAGCs.
Ijms 26 02588 g004
Figure 5. Gene expression pattern analysis of GmAGC in Glycine max.
Ijms 26 02588 g005
Figure 6. qRT-PCR expression patterns of GmAGC genes in roots under salt stress. The salt treatment time were 0, 2, 4, and 6 h. The black asterisks indicate significantly higher expression while red ones show significantly lower expression. * p < 0.05, ** p < 0.01, *** p < 0.001, ns means no significant difference, according to the Student’s t test.
Ijms 26 02588 g006
Table 1. Basic information of GmAGC family genes and their proteins in Glycine max.
Sr.no.GeneLocus IDChrSize (aa)MW(Da)pISubcellular
Location
AGC Kinase
Classification
1GmAGC1-1aGlyma.09G015400960866,157.128.82CytoplasmAGC1AGCⅧ
2GmAGC1-1bGlyma.15G1212001560866,112.158.51Cytoplasm
3GmAGC1-2aGlyma.16G0707001663169,937.327.17Plasma membrane
4GmAGC1-2bGlyma.19G0605001963169,931.227.98Plasma membrane
5GmAGC1-2cGlyma.19G0038001961268,735.188.02Plasma membrane
6GmAGC1-3aGlyma.03G111200376383,526.826.20Extracellular
7GmAGC1-3bGlyma.07G114400776383,407.836.26Extracellular
8GmAGC1-3cGlyma.09G242900976683,736.086.99Extracellular
9GmAGC1-3dGlyma.18G2518001876883,844.127.22Extracellular
10GmAGC1-4aGlyma.08G160400858664,793.028.89Cytoplasm
11GmAGC1-4bGlyma.15G2668001557663,503.478.14Cytoplasm
12GmAGC1-4cGlyma.08G232800856062,559.099.23Cytoplasm
13GmAGC1-5aGlyma.04G111700482790,218.086.78Extracellular
14GmAGC1-5bGlyma.06G322600683590,986.976.72Extracellular
15GmAGC1-5cGlyma.12G0027001281390,613.409.00Extracellular
16GmAGC1-5dGlyma.09G234251918219,986.925.76Plasma membrane
17GmAGC1-6aGlyma.10G0674001086393,847.548.67Extracellular
18GmAGC1-6bGlyma.U031420un86693,986.438.65Extracellular
19GmAGC1-6cGlyma.03G193000387195,373.388.83Extracellular
20GmAGC1-6dGlyma.19G1931001986895,279.478.84Extracellular
21GmAGC1-7aGlyma.10G2031001041445,918.416.40Plasma membrane
22GmAGC1-7bGlyma.20G1872002042246,799.556.02Plasma membrane
23GmAGC1-8aGlyma.11G1876001144148,991.946.44Plasma membrane
24GmAGC1-8bGlyma.12G0869001243648,490.607.68Nuclear
25GmAGC1-8cGlyma.12G1826001245350,636.746.66Cytoplasm
26GmAGC1-8dGlyma.13G3184001349755,485.346.32Plasma membrane
27GmAGC3-1aGlyma.13G2201001345250,551.268.29Plasma membraneAGC3
28GmAGC3-1bGlyma.U032208un46051,632.718.79Plasma membrane
29GmAGC3-2aGlyma.05G009200548855,368.009.28Plasma membrane
30GmAGC3-2bGlyma.17G1173001749055,622.279.39Plasma membrane
31GmAGC3-2cGlyma.04G148400448854,931.869.09Plasma membrane
32GmAGC3-3aGlyma.08G174400847253,236.819.35Plasma membrane
33GmAGC3-3bGlyma.15G2527001547854,469.239.44Plasma membrane
34GmPHOT1aGlyma.13G33040013982110,192.347.29Plasma membraneAGC4
35GmPHOT1bGlyma.15G04360015982110,324.678.23Plasma membrane
36GmPHOT1cGlyma.12G07410012977109,600.737.06Plasma membrane
37GmPHOT2aGlyma.08G2649008996111,560.136.36Plasma membrane
38GmPHOT2bGlyma.16G09660016990110,960.667.59Plasma membrane
39GmAGC2-1aGlyma.03G088800343649,579.156.62Plasma membraneAGC2
40GmAGC2-1bGlyma.16G0847001643449,826.727.69Extracellular
41GmAGC2-1cGlyma.08G345500844550,615.277.21Extracellular
42GmAGC2-2aGlyma.11G1318001141146,524.239.53Plasma membrane
43GmAGC2-2bGlyma.12G0560001241947,344.319.71Plasma membrane
44GmAGC2-2cGlyma.13G3414001338643,528.039.65Plasma membrane
45GmIRE1aGlyma.07G10340071297142,803.635.81NuclearAGC other
46GmIRE1bGlyma.09G17400091302143,144.255.64Nuclear
47GmIRE2aGlyma.09G23240091184132,490.495.41Nuclear
48GmIRE2bGlyma.12G004100121176131,889.995.49Nuclear
49GmNDR1aGlyma.02G003200254763,207.307.20NuclearAGCⅦ
50GmNDR1bGlyma.10G0056001054763,353.588.15Nuclear
51GmNDR1cGlyma.10G1815001056666,294.517.85Nuclear
52GmNDR1dGlyma.20G2089002054362,958.908.45Nuclear
53GmNDR2aGlyma.03G164600354262,867.105.84Cytoplasm
54GmNDR2bGlyma.19G1660001954663,507.895.88Nuclear
55GmNDR2cGlyma.10G0384001055864,301.026.37Cytoplasm
56GmNDR2dGlyma.13G1248001355964,545.186.21Cytoplasm
57GmNDR3aGlyma.04G053900450358,226.485.80Cytoplasm
58GmNDR3bGlyma.06G054200650358,254.455.80Cytoplasm
59GmNDR4aGlyma.09G066300956364,847.966.50Extracellular
60GmNDR4bGlyma.15G1723001551959,615.936.14Cytoplasm
61GmNDR5aGlyma.14G0831001454462,311.446.69Extracellular
62GmNDR5bGlyma.17G2420001753861,522.025.77Extracellular
63GmS6K1aGlyma.05G032000529132,603.317.69Plasma membraneAGCⅥ
64GmS6K1bGlyma.17G0947001741546,873.577.28Nuclear
65GmS6K2aGlyma.09G27360091005112,107.847.34Plasma membrane
66GmS6K2bGlyma.18G2128001847954,328.166.21Plasma membrane
67GmS6K2cGlyma.14G1881001447253,323.717.24Nuclear
68GmPDK1aGlyma.10G2006001049154,802.366.73CytoplasmPDK1
69GmPDK1bGlyma.20G1900002049154,731.246.73Cytoplasm
un, unknown.
Table 2. The Ka/Ks values in duplicated gene pairs in Glycine max.
Gene PairsKaKsKa/KsDate (Mya)Type of SelectionType of Duplication
GmAGC1-1a/GmAGC1-1b0.02 0.15 0.13 12.45 PurifyingSegmental/WGD
GmAGC1-2a/GmAGC1-2b0.09 0.65 0.13 53.34 PurifyingSegmental/WGD
GmAGC1-2a/GmAGC1-2c0.02 0.17 0.09 14.34 PurifyingSegmental/WGD
GmAGC1-2c/GmAGC1-2b0.08 0.67 0.12 54.95 PurifyingSegmental/WGD
GmAGC1-3a/GmAGC1-3b0.02 0.13 0.13 11.02 PurifyingSegmental/WGD
GmAGC1-3a/GmAGC1-3c0.08 0.62 0.13 50.53 PurifyingSegmental/WGD
GmAGC1-3a/GmAGC1-3d0.08 0.56 0.15 45.67 PurifyingSegmental/WGD
GmAGC1-3b/GmAGC1-3c0.08 0.62 0.14 50.44 PurifyingSegmental/WGD
GmAGC1-3b/GmAGC1-3d0.09 0.56 0.16 46.02 PurifyingSegmental/WGD
GmAGC1-3c/GmAGC1-3d0.02 0.14 0.12 11.78 PurifyingSegmental/WGD
GmAGC1-4a/GmAGC1-4b0.02 0.16 0.15 13.17 PurifyingSegmental/WGD
GmAGC1-5a/GmAGC1-5b0.02 0.09 0.25 7.74 PurifyingSegmental/WGD
GmAGC1-5d/GmAGC1-5c0.05 0.12 0.41 10.04 PurifyingSegmental/WGD
GmAGC1-6a/GmAGC1-6d0.13 0.45 0.29 36.89 PurifyingSegmental/WGD
GmAGC1-6c/GmAGC1-6a0.13 0.43 0.31 35.39 PurifyingSegmental/WGD
GmAGC1-6c/GmAGC1-6d0.02 0.10 0.25 7.83 PurifyingSegmental/WGD
GmAGC1-7a/GmAGC1-7b0.04 0.22 0.17 17.69 PurifyingSegmental/WGD
GmAGC1-8a/GmAGC1-8b0.04 0.23 0.18 19.15 PurifyingSegmental/WGD
GmAGC1-8a/GmAGC1-8c0.17 0.79 0.22 64.52 PurifyingSegmental/WGD
GmAGC1-8a/GmAGC1-8d0.17 0.85 0.20 69.56 PurifyingSegmental/WGD
GmAGC1-8b/GmAGC1-8c0.18 0.79 0.23 64.59 PurifyingSegmental/WGD
GmAGC1-8b/GmAGC1-8d0.16 0.88 0.19 72.14 PurifyingSegmental/WGD
GmAGC1-8c/GmAGC1-8d0.02 0.17 0.11 14.16 PurifyingSegmental/WGD
GmAGC2-1a/GmAGC2-1b0.28 1.53 0.18 125.04 PurifyingSegmental/WGD
GmAGC2-1a/GmAGC2-1c0.09 0.35 0.26 28.69 PurifyingSegmental/WGD
GmAGC2-1c/GmAGC2-1b0.30 1.54 0.20 126.41 PurifyingSegmental/WGD
GmAGC2-2a/GmAGC2-2b0.05 0.20 0.24 16.69 PurifyingSegmental/WGD
GmAGC2-2a/GmAGC2-2c0.21 0.84 0.25 68.60 PurifyingSegmental/WGD
GmAGC2-2b/GmAGC2-2c0.20 0.93 0.22 76.50 PurifyingSegmental/WGD
GmAGC3-2a/GmAGC3-2b0.03 0.18 0.17 14.35 PurifyingSegmental/WGD
GmAGC3-2c/GmAGC3-2a0.17 1.00 0.17 82.04 PurifyingSegmental/WGD
GmAGC3-2c/GmAGC3-2b0.15 0.90 0.17 73.81 PurifyingSegmental/WGD
GmAGC3-3a/GmAGC3-3b0.06 0.27 0.23 21.76 PurifyingSegmental/WGD
GmIRE1a/GmIRE1b0.01 0.09 0.16 7.49 PurifyingSegmental/WGD
GmIRE2a/GmIRE2b0.03 0.10 0.27 8.06 PurifyingSegmental/WGD
GmNDR1a/GmNDR1b0.01 0.08 0.15 6.91 PurifyingSegmental/WGD
GmNDR1a/GmNDR1c0.09 0.45 0.19 36.99 PurifyingSegmental/WGD
GmNDR1c/GmNDR1d0.06 0.14 0.45 11.09 PurifyingSegmental/WGD
GmNDR2a/GmNDR2b0.08 0.64 0.12 52.49 PurifyingSegmental/WGD
GmNDR2a/GmNDR2c0.08 0.63 0.13 51.47 PurifyingSegmental/WGD
GmNDR2a/GmNDR2d0.04 0.18 0.22 14.96 PurifyingSegmental/WGD
GmNDR2c/GmNDR1d0.11 2.16 0.05 176.75 PurifyingSegmental/WGD
GmNDR2c/GmNDR2b0.08 0.69 0.11 56.93 PurifyingSegmental/WGD
GmNDR2c/GmNDR2d0.02 0.09 0.19 6.97 PurifyingSegmental/WGD
GmNDR2d/GmNDR2b0.08 0.64 0.13 52.77 PurifyingSegmental/WGD
GmNDR3a/GmNDR3b0.01 0.10 0.05 8.25 PurifyingSegmental/WGD
GmNDR4a/GmNDR4b0.02 0.10 0.18 8.02 PurifyingSegmental/WGD
GmNDR5a/GmNDR5b0.03 0.15 0.22 12.65 PurifyingSegmental/WGD
GmPDK1a/GmPDK1b0.01 0.07 0.15 5.37 PurifyingSegmental/WGD
GmPHOT1a/GmPHOT1b0.02 0.15 0.16 12.22 PurifyingSegmental/WGD
GmPHOT1c/GmPHOT1a0.12 0.66 0.19 54.33 PurifyingSegmental/WGD
GmPHOT1c/GmPHOT1b0.12 0.68 0.18 55.45 PurifyingSegmental/WGD
GmS6K1a/GmS6K1b0.07 0.17 0.44 13.55 PurifyingSegmental/WGD
GmS6K2a/GmS6K2b0.02 0.14 0.17 11.25 PurifyingSegmental/WGD
Ka, the ratio of noon-synonymous substitution; Ks, the ratio of synonymous substitution; Mya, million years ago.
Disclaimer/Publisher’s Note: The statements, opinions and data contained in all publications are solely those of the individual author(s) and contributor(s) and not of MDPI and/or the editor(s). MDPI and/or the editor(s) disclaim responsibility for any injury to people or property resulting from any ideas, methods, instructions or products referred to in the content.

