Article

Comparison of Deep Learning and Traditional Machine Learning Models for Predicting Mild Cognitive Impairment Using Plasma Proteomic Biomarkers

1
Department of Biobehavioral Health & Nursing Science, College of Nursing, University of South Carolina, Columbia, SC 29208, USA
2
Department of Epidemiology and Biostatistics, Arnold School of Public Health, University of South Carolina, Columbia, SC 29208, USA
3
Lane Department of Computer Science & Electrical Engineering, West Virginia University, Morgantown, WV 26506, USA
4
West Virginia Clinical and Translational Science Institute, Morgantown, WV 26506, USA
5
School of Nursing, Health Sciences Center, West Virginia University, Morgantown, WV 26506, USA
6
Department of STEM, School of Arts and Sciences, Regis College, Weston, MA 02493, USA
7
Department of Health and Biomedical Sciences, College of Health Professions, University of Texas Rio Grande Valley, Brownsville, TX 78520, USA
*
Authors to whom correspondence should be addressed.
Int. J. Mol. Sci. 2025, 26(6), 2428; https://doi.org/10.3390/ijms26062428
Submission received: 16 January 2025 / Revised: 1 March 2025 / Accepted: 4 March 2025 / Published: 8 March 2025
(This article belongs to the Special Issue New Advances in Proteomics in Disease)

Abstract

Mild cognitive impairment (MCI) is a clinical condition characterized by a decline in cognitive ability and progression of cognitive impairment. It is often considered a transitional stage between normal aging and Alzheimer’s disease (AD). This study aimed to compare deep learning (DL) and traditional machine learning (ML) methods in predicting MCI using plasma proteomic biomarkers. A total of 239 adults were selected from the Alzheimer’s Disease Neuroimaging Initiative (ADNI) cohort along with a pool of 146 plasma proteomic biomarkers. We evaluated seven traditional ML models (support vector machines (SVMs), logistic regression (LR), naïve Bayes (NB), random forest (RF), k-nearest neighbor (KNN), gradient boosting machine (GBM), and extreme gradient boosting (XGBoost)) and six variations of a deep neural network (DNN) model—the DL model in the H2O package. Least Absolute Shrinkage and Selection Operator (LASSO) selected 35 proteomic biomarkers from the pool. Based on grid search, the DNN model with an activation function of “Rectifier With Dropout” with 2 layers and 32 of 35 selected proteomic biomarkers revealed the best model with the highest accuracy of 0.995 and an F1 Score of 0.996, while among seven traditional ML methods, XGBoost was the best with an accuracy of 0.986 and an F1 Score of 0.985. Several biomarkers were correlated with the APOE-ε4 genotype, polygenic hazard score (PHS), and three clinical cerebrospinal fluid biomarkers (Aβ42, tTau, and pTau). Bioinformatics analysis using Gene Ontology (GO) and Kyoto Encyclopedia of Genes and Genomes (KEGG) revealed several molecular functions and pathways associated with the selected biomarkers, including cytokine-cytokine receptor interaction, cholesterol metabolism, and regulation of lipid localization. The results showed that the DL model may represent a promising tool in the prediction of MCI. These plasma proteomic biomarkers may help with early diagnosis, prognostic risk stratification, and early treatment interventions for individuals at risk for MCI.

1. Introduction

Alzheimer’s disease (AD) is the most common cause of major neurocognitive disorder (dementia), which is characterized by progressive loss of memory and cognitive functions [1]. In 2024, AD and related forms of dementia affected 6.9 million Americans aged 65 and older, a number that is expected to increase to 13.8 million by 2060 [2]. AD is an age-related neurodegenerative disorder that is categorized by the progressive accumulation in the brain parenchyma of β-amyloid Aβ plaques (Aβ peptides) and neurofibrillary tangles (tau protein) [3,4,5]. The etiology of AD may start several years or decades before the onset of clinical symptoms; therefore, early diagnosis is a key element in managing AD progression [5,6,7,8].
AD is recognized as a disease that occurs along a symptomatic and chronological spectrum with phases of preclinical AD, amnestic mild cognitive impairment (MCI), and fully developed AD [9]. MCI is often considered a transitional stage between normal aging and AD. A previous study has shown that approximately 50% of patients with MCI develop AD within 5 years of diagnosis [10]. Regarding potential sources of MCI, recent studies have reported the association between several kinds of biomarkers and MCI, including apolipoprotein E (APOE) genotypes, Aβ plaques (Aβ42), pathologic tau (comprising total tau (tTau) and phosphorylated tau (pTau)), and neurodegenerative injury [5]. Changes in CSF reflect biochemical changes in the brain, and three commonly used key biomarkers in diagnosing AD are Aβ42, tTau, and pTau. One study found decreased CSF-Aβ over 25 years before the onset of AD [3]. Another study used CSF protein levels to show that AD pathophysiological processes may start before aggregated amyloid can be detected [11]. Thus, current mainstream detection tools mainly rely on analyzing CSF. However, brain-imaging tools using CSF are often extremely costly, and the diagnostic procedures involving CSF collection are invasive, adding to the discomfort and potential risks for patients. These factors contribute to the challenges surrounding the widespread adoption and accessibility of CSF-based diagnostic tools. For example, blood-based biomarkers could potentially aid early diagnosis as well as recruitment for clinical trials [5,12,13,14]. As shown in another example, proteomic analysis is capable of identifying both biological processes and altered signaling pathways during the pre-symptomatic phase of AD, even 20–30 years before the appearance of the first clinical symptoms of AD or other dementia-associated traits [14,15,16,17,18,19,20,21,22]. Therefore, blood proteomics may pave the way for the development of accurate, cost-effective, and minimally invasive AD diagnostics and screening tools for individuals at high risk. There is a critical need to identify noninvasive tools for early detection and disease progression.
In analyzing the association between the biomarkers and MCI and AD, machine learning (ML) methods show promise to translate univariate biomarker findings into clinically useful multivariate decision support systems. Several ML technologies have been used to enhance the diagnosis and prognosis of AD, such as logistic regression (LR), naive Bayes (NB), random forest (RF), decision trees (DT), k-nearest neighbor (KNN), gradient boosting machine (GBM), extreme gradient boosting (XGBoost), and support vector machines (SVM) [14,22,23,24,25,26,27,28,29,30]. In recent years, deep learning (DL) techniques have become increasingly popular in AD research, such as early diagnosis. For example, deep neural networks (DNNs), stacked autoencoder (SAE) neural networks, and convolutional neural networks (CNNs) [27,31,32,33] have been reported to be more accurate for AD diagnosis than conventional ML models [25,27,34,35,36,37]. However, DL-based studies in this field are still in their early stages, and further studies should incorporate different information sources [28].
Recently, while previous studies have shown that proteomic analyses with ML or DL models can reveal altered biological processes and heterogeneity in the presence of AD and other types of dementia [21,23,25,27,28,29,30,33,38,39,40,41,42], no study has focused on comparing ML and DL models when classifying the appearance of MCI using plasma proteomic biomarkers. Furthermore, proteomic biomarkers are abundant, and parts of these biomarkers are correlated with one another, which may be due to shared pathways or regulatory mechanisms. Developing ML/DL tools requires a critical consideration of the specific features used in the analysis. It is essentially the process of identifying the informative and relevant features from a larger collection of features, leading to an improved characterization of the underlying patterns and relations [43,44]. Feature selection algorithms are important in ML as they not only reduce the dimensionality of the feature space but also can reveal the most relevant features without losing too much information [45,46,47].
This study aimed to (1) compare seven traditional ML models (SVMs, LR, NB, RF, KNN, GBM, and XGBoost) and six variations of a DNN model—the DL model in the H2O package [48]; (2) predict MCI using plasma proteomic biomarkers; and (3) assess the functional relevance of the selected plasma proteomic biomarkers. Using the Alzheimer’s Disease Neuroimaging Initiative (ADNI) database (adni.loni.usc.edu), the findings revealed that application of a DL model may represent a promising tool in the prediction of MCI. These plasma proteomic biomarkers may help with early diagnosis, prognostic risk stratification, and early treatment interventions for individuals at risk for MCI.

2. Results

2.1. Descriptive Statistics

Table 1 displays characteristics of the 239 selected adults in this study. The results from either the t-test or Chi-square test revealed that age and education were not associated with MCI (p > 0.05); however, a significant association was observed for gender and APOE-ε4 allele with MCI (p = 0.0334 and p < 0.0001, respectively) (Table 1). The MCI group had a lower mean value in the Aβ42 but higher PHS, tTau, and pTau scores (all p values < 0.0001).

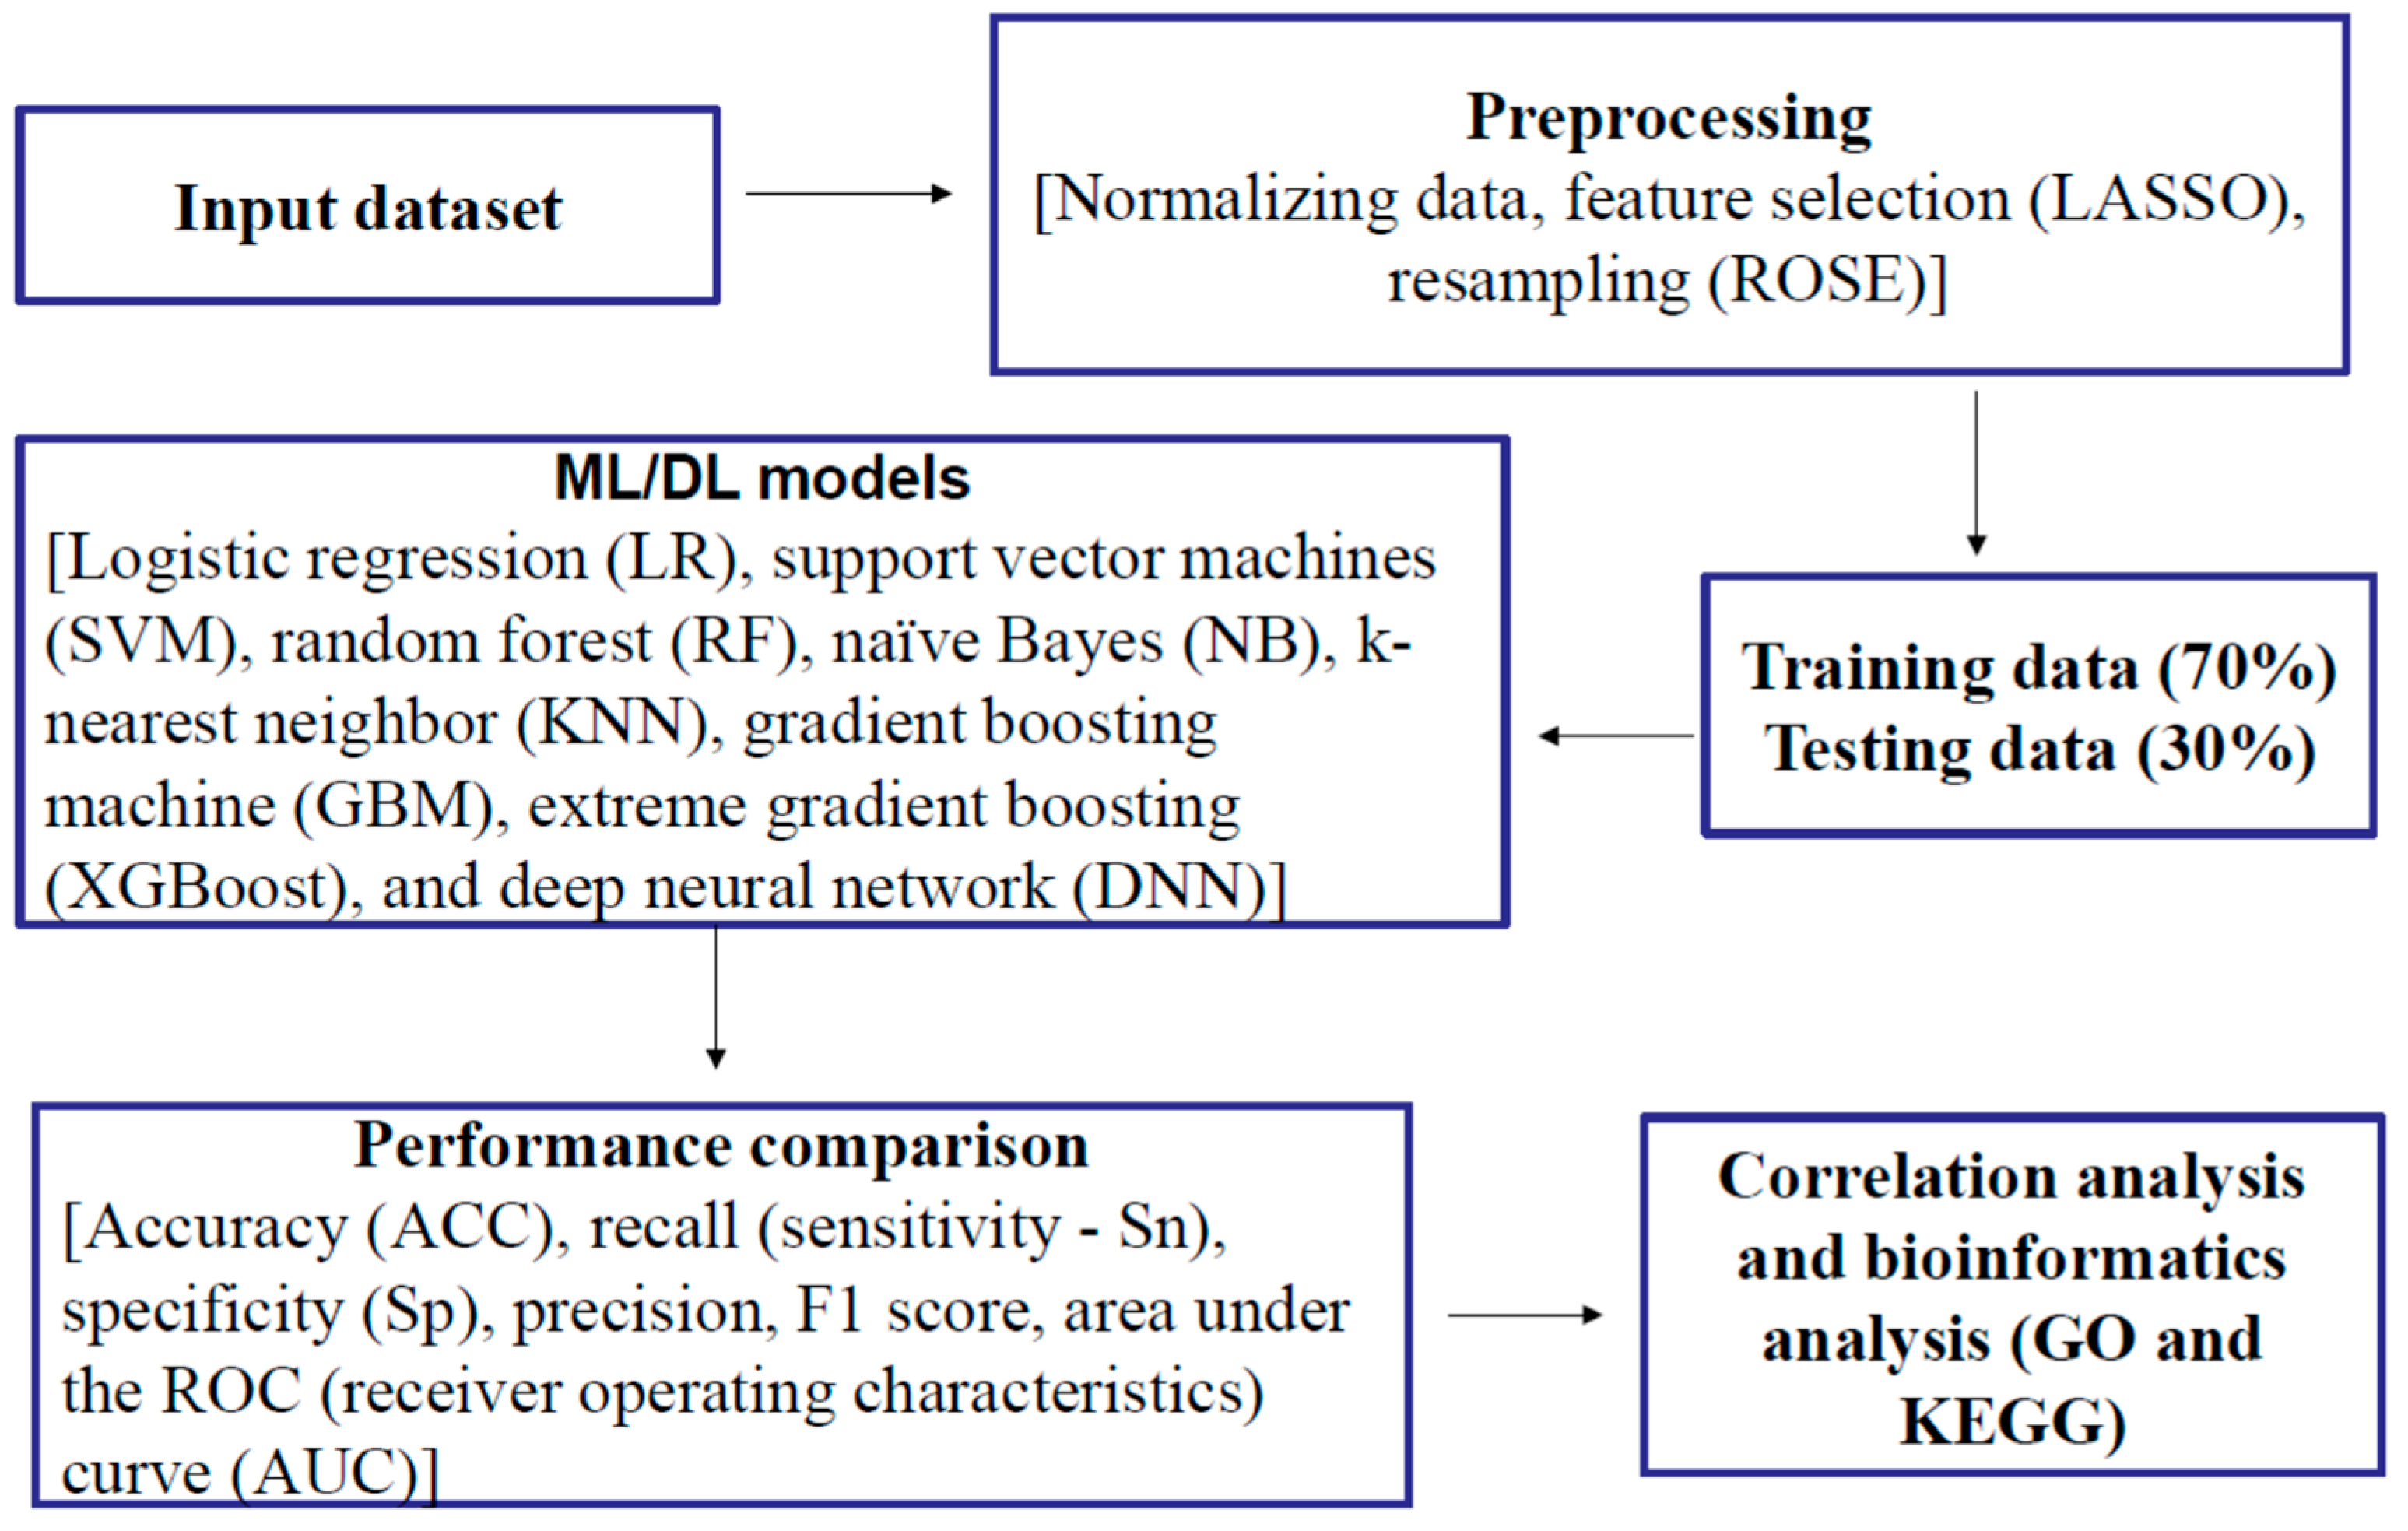
2.2. Feature Selection and Resampling

Table 2 lists the feature selection package, algorithm, and extracted plasma proteomic biomarkers based on the Least Absolute Shrinkage and Selection Operator (LASSO) [49]. The LASSO effectively identified 35 plasma proteomic biomarkers based on optimal parameter ln(λ) = −3.92 (Figure 1). In addition, among 35 biomarkers selected by LASSO, 23 biomarkers were significantly associated with MCI using an independent t-test (Table S1). As there was an imbalance number between the two levels of MCI status, the “both” resampling method in random over-sampling examples (ROSE) [50], a bootstrap-based technique that aids the task of binary classification in the presence of rare classes, was used to generate the approximately balanced data, including 118 CN and 122 MCI individuals.

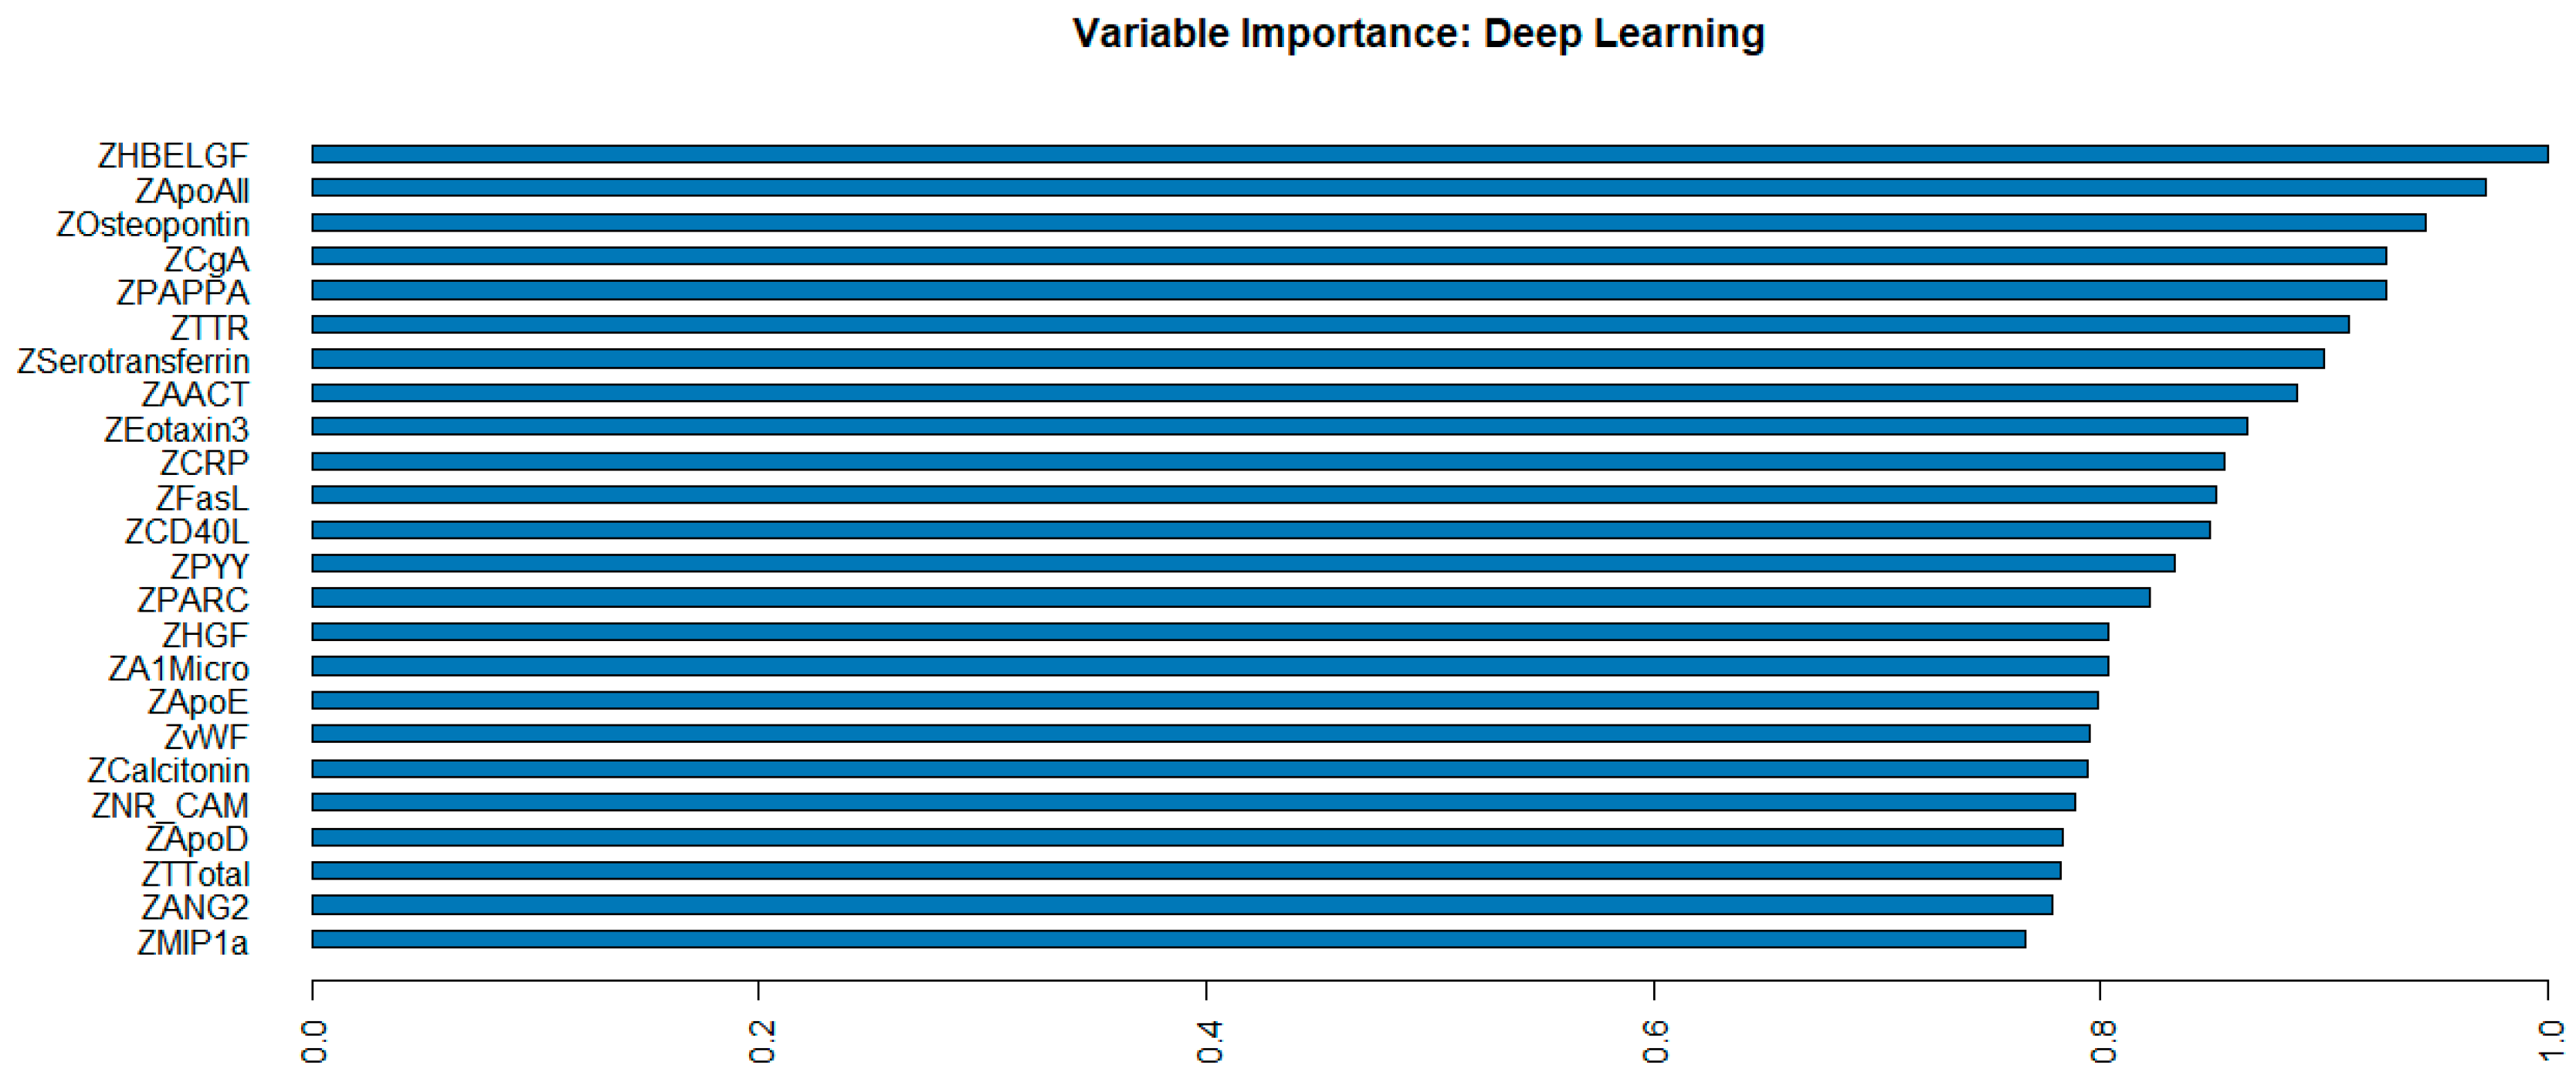
2.3. Machine Learning (ML) and Deep Learning (DL) Performance

The 35 plasma proteomic biomarkers identified by LASSO were used to develop ML and DL models. We evaluated the performance of seven traditional ML methods [LR, NB, RF, GBM, KNN, XGBoost, and SVM algorithm (with three variations, namely, linear kernel, RBF kernel, and polynomial kernel)] and one DL method (namely, DNN) in the H2O-3 version 3.46.0.6 [48] with six variations, based on six different activation functions (Table 3). We selected this DL method as it has similar computational requirements with the traditional ML models compared. The criteria used to evaluate the performance of ML/DL models include accuracy, sensitivity, specificity, precision, F1-score, and AUC. Based on the accuracy and F1-score, the best model was the DL model with an activation function of “Rectifier With Dropout” with 2 layers and 32 proteomic biomarkers. This model achieved the highest accuracy of 0.995 and an F1 Score of 0.996. Figure 2 illustrates the variable importance of the DL model with “Rectifier With Dropout”. Based on accuracy, the second and the third best models were the DL model with an activation function of “Tanh With Dropout” with 3 layers and 32 and 33 proteomic biomarkers, respectively. Figure 3 illustrates the AUC curves in the validation data for models that used H2O for DL models using an activation function of “Rectifier With Dropout”, 2 layers and 32 inputs; an activation function of “Tanh With Dropout”, 3 layers, and 32 and 33 inputs, respectively; and an activation function of “Tanh” with 2 layers and 32 inputs.
Among the seven traditional ML models, the XGBoost revealed the best model with an accuracy of 0.986 and F1 Score of 0.985, and the second-best models were SVM and GBM with the same accuracy of 0.972 and the same F1 Score of 0.970 (Table 3).

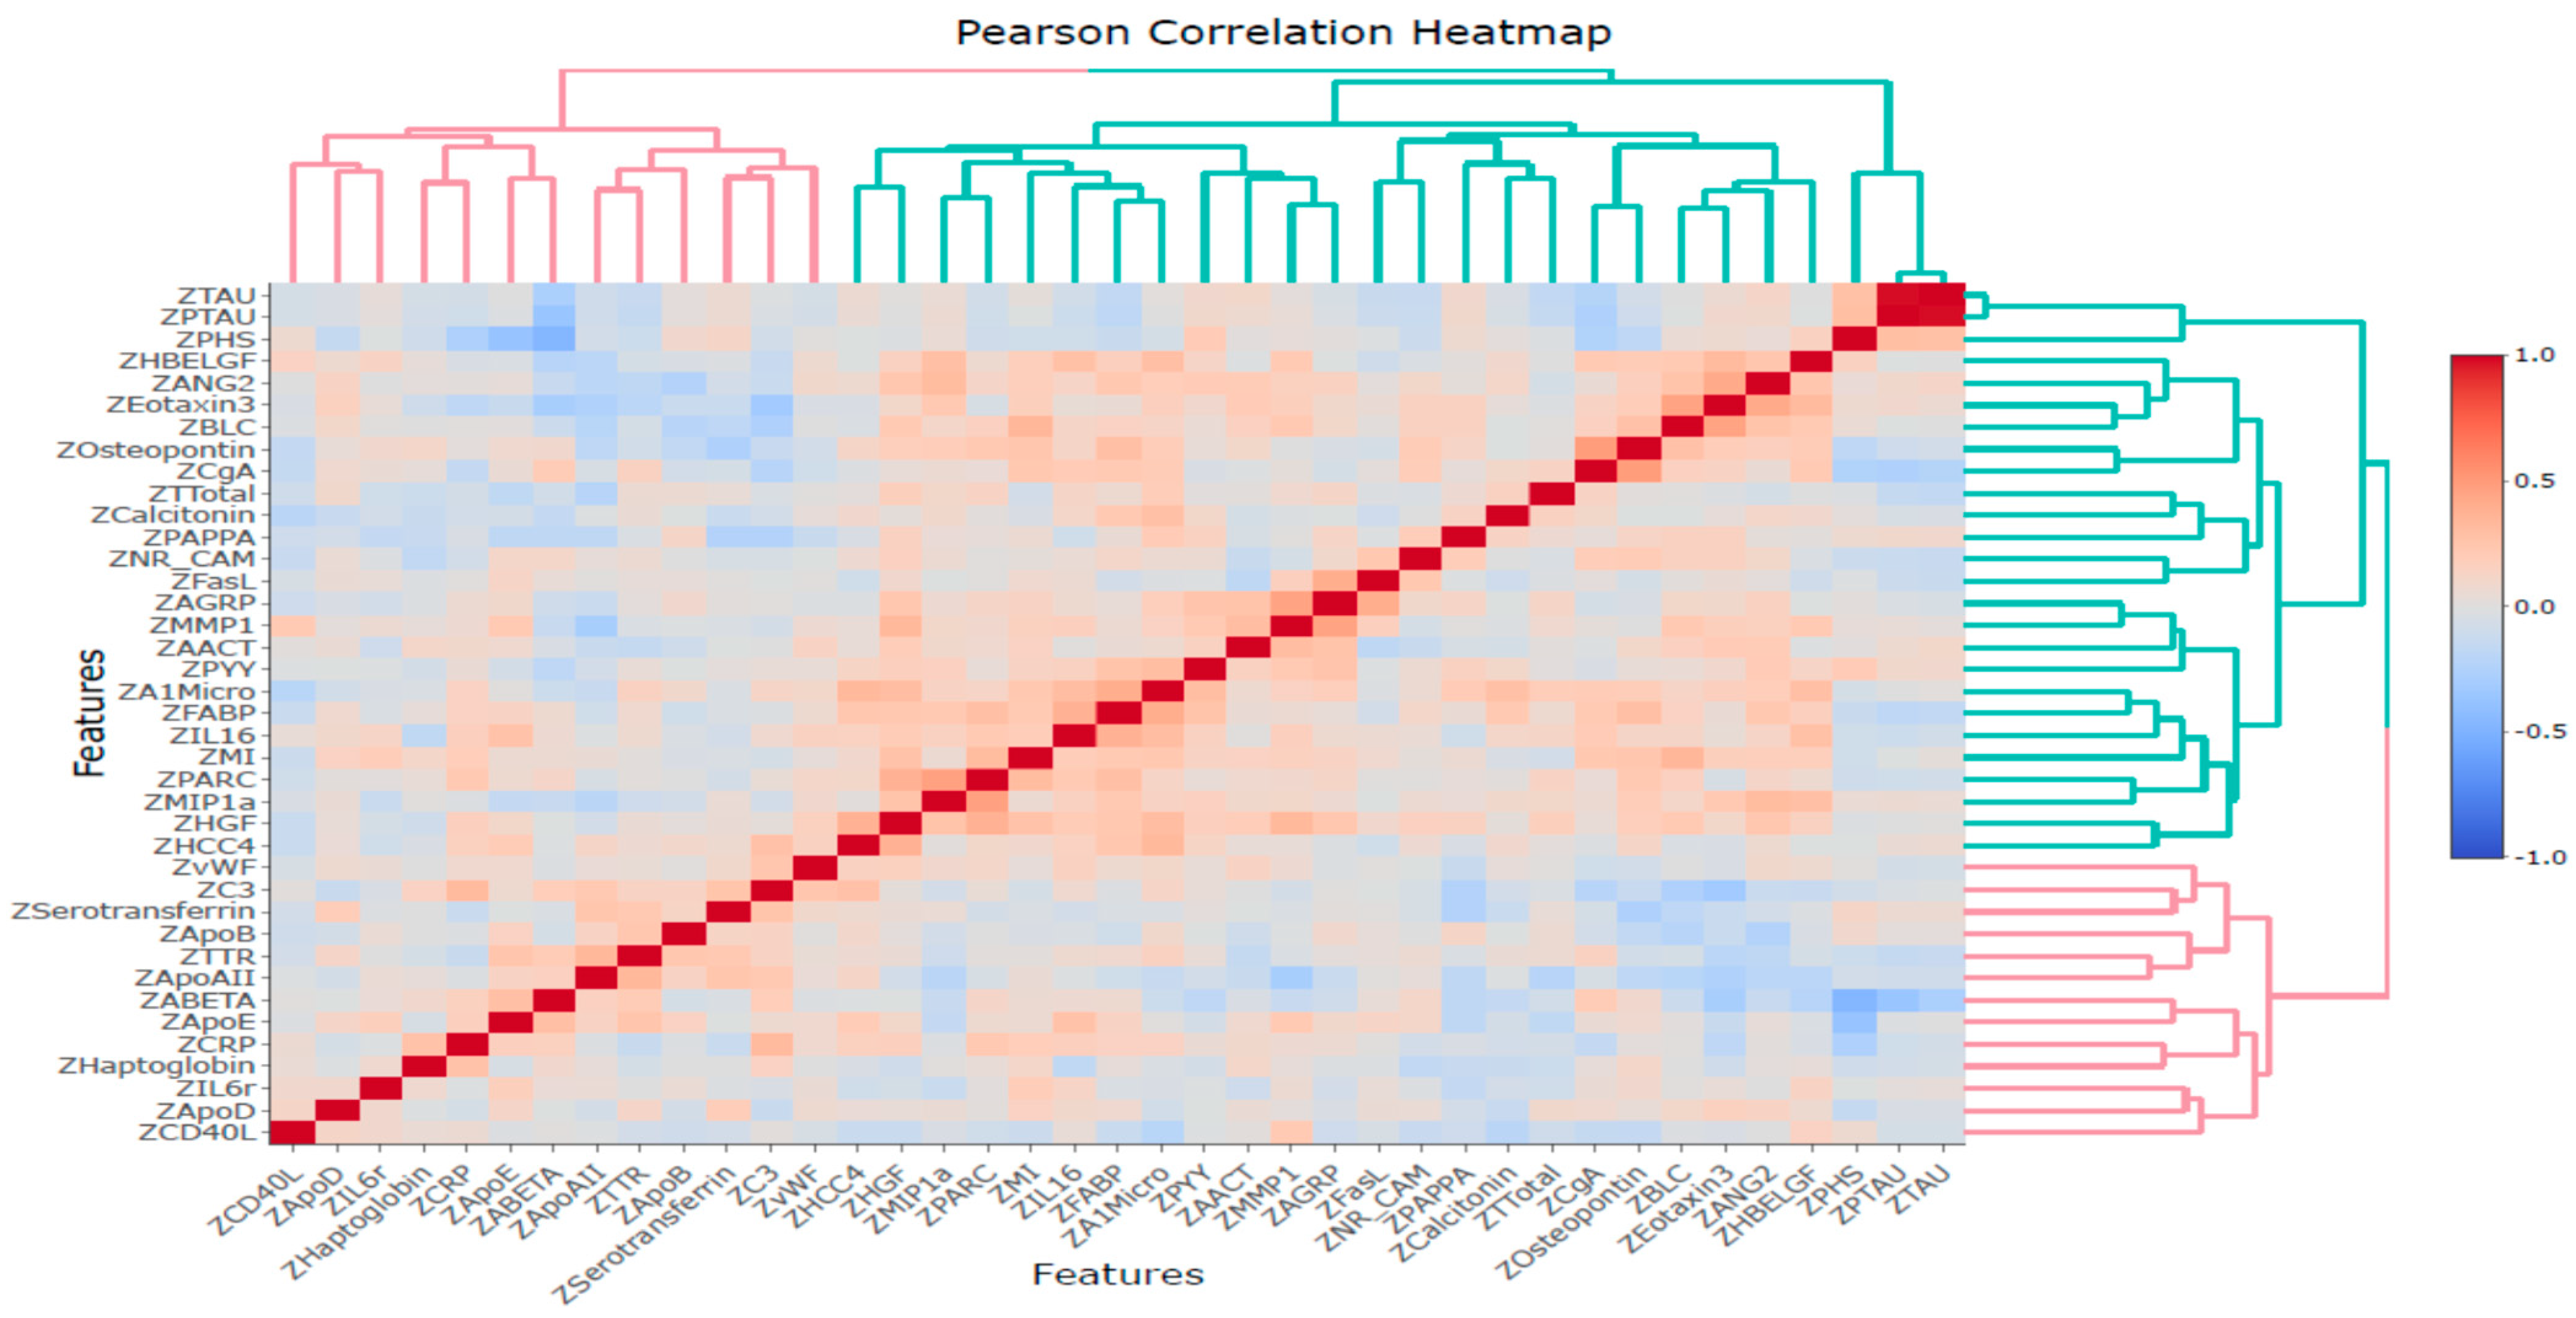
2.4. Correlation Analysis

Pearson and Spearman correlation analyses were conducted among these 39 variables, including 35 proteomic biomarkers, PHS, and three CSF biomarkers (Aβ42, tTau, and pTau). The results revealed significant correlations between several proteins and PHS, tTau, pTau, or Aβ42 (Tables S2 and S3). Furthermore, based on Pearson’s correlation analysis, the proteins that significantly correlated with PHS were ApoD, ApoE, CgA, CRP, HBELGF, Osteopontin, and PYY proteins. The proteins significantly correlated with Aβ42 were ANG2, ApoAII, ApoE, C3, Calcitonin, CgA, CRP, Eotaxin3, HBELGF, MIP1a, MMP1, PAPPA, PYY, and TTR. The proteins significantly correlated with both pTau and tTau were CgA, FABP, Testosterone-Total, and TTR proteins. The Pearson correlation heatmap is illustrated in Figure 4.

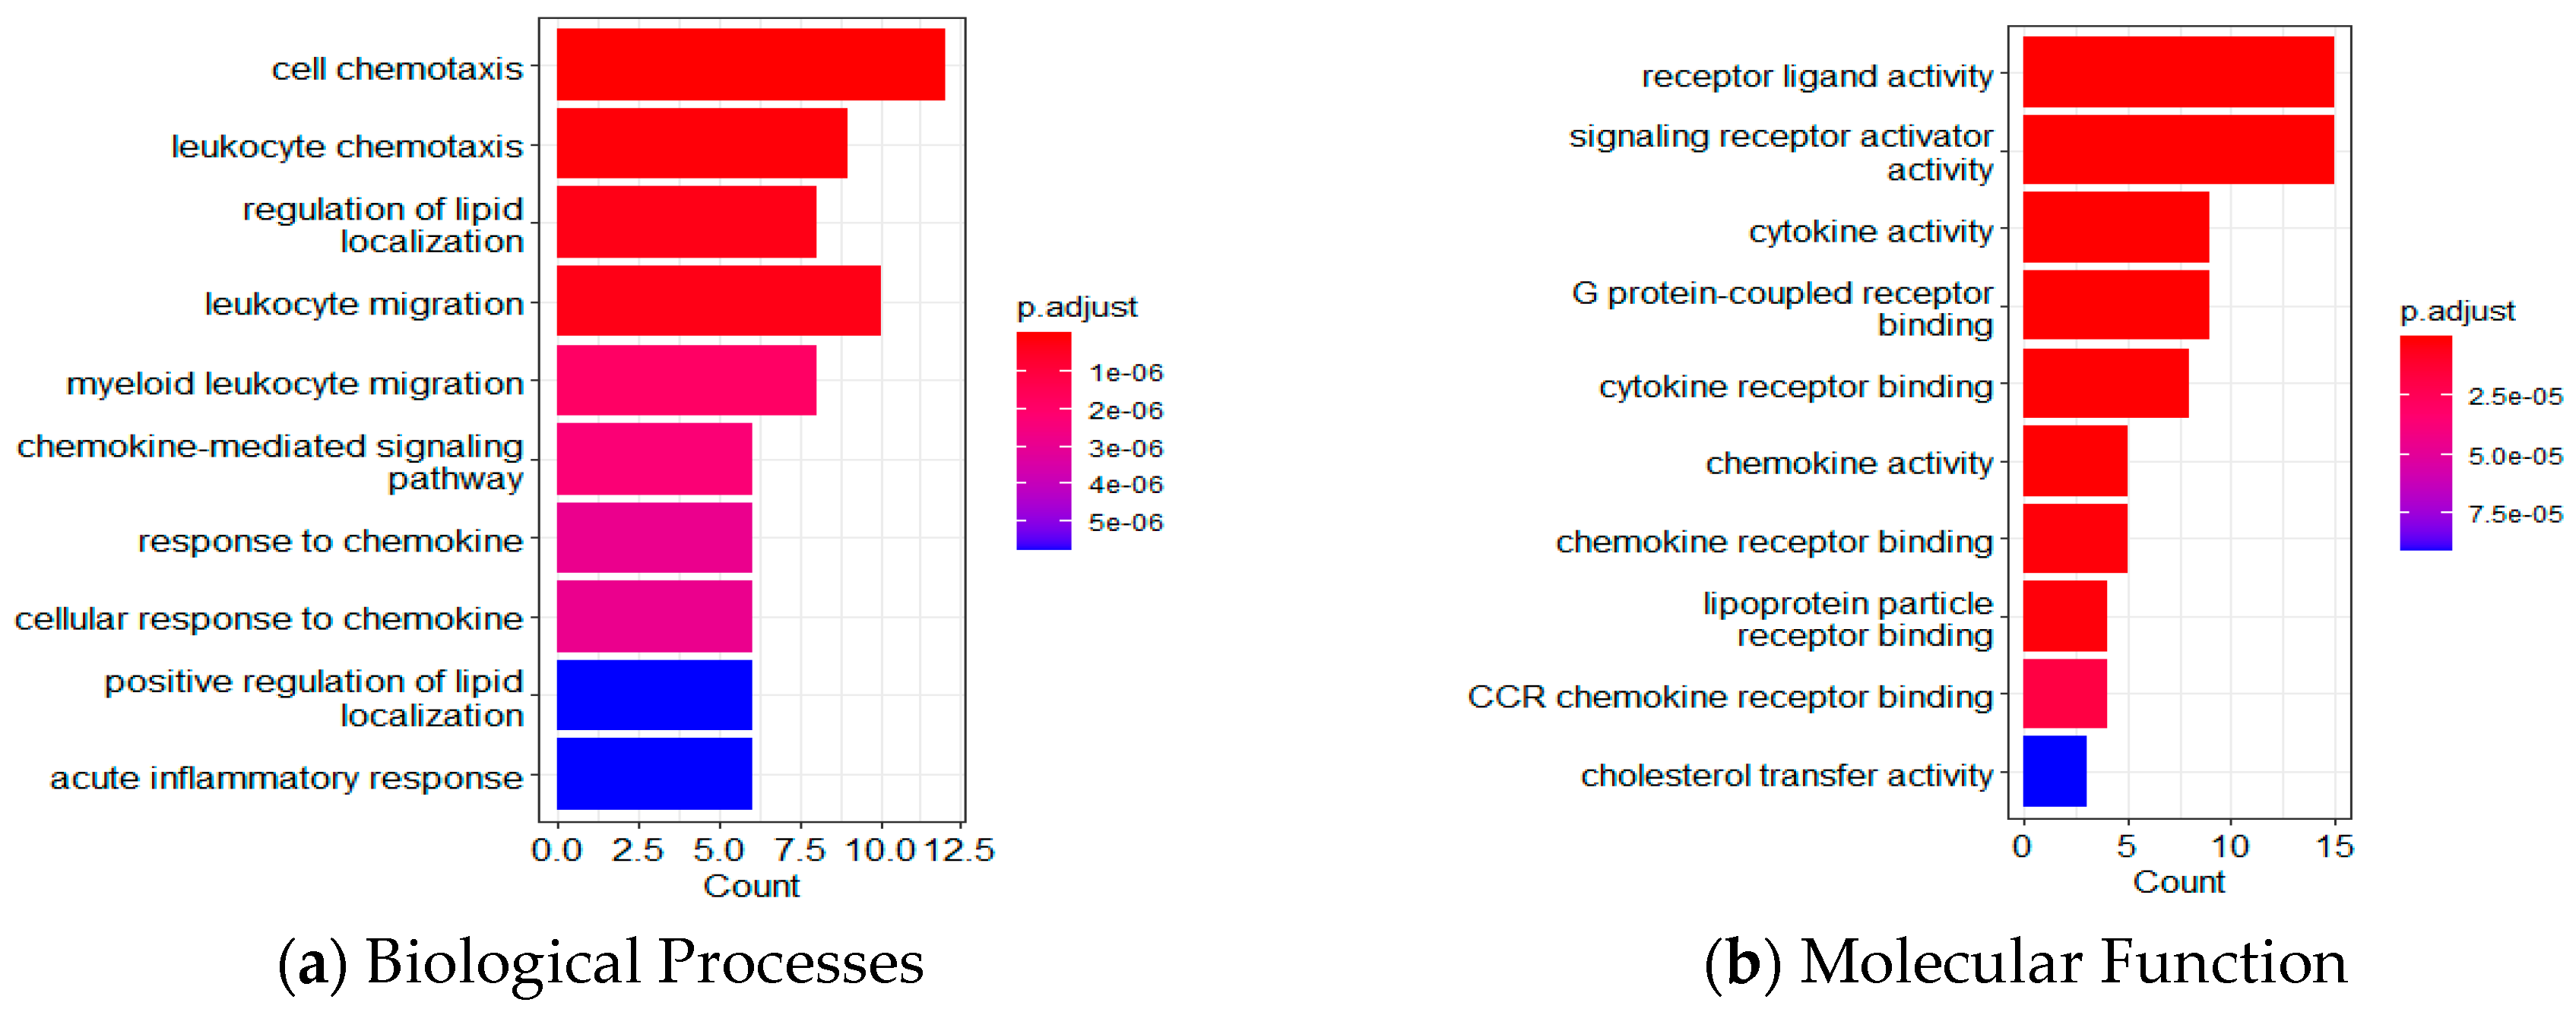
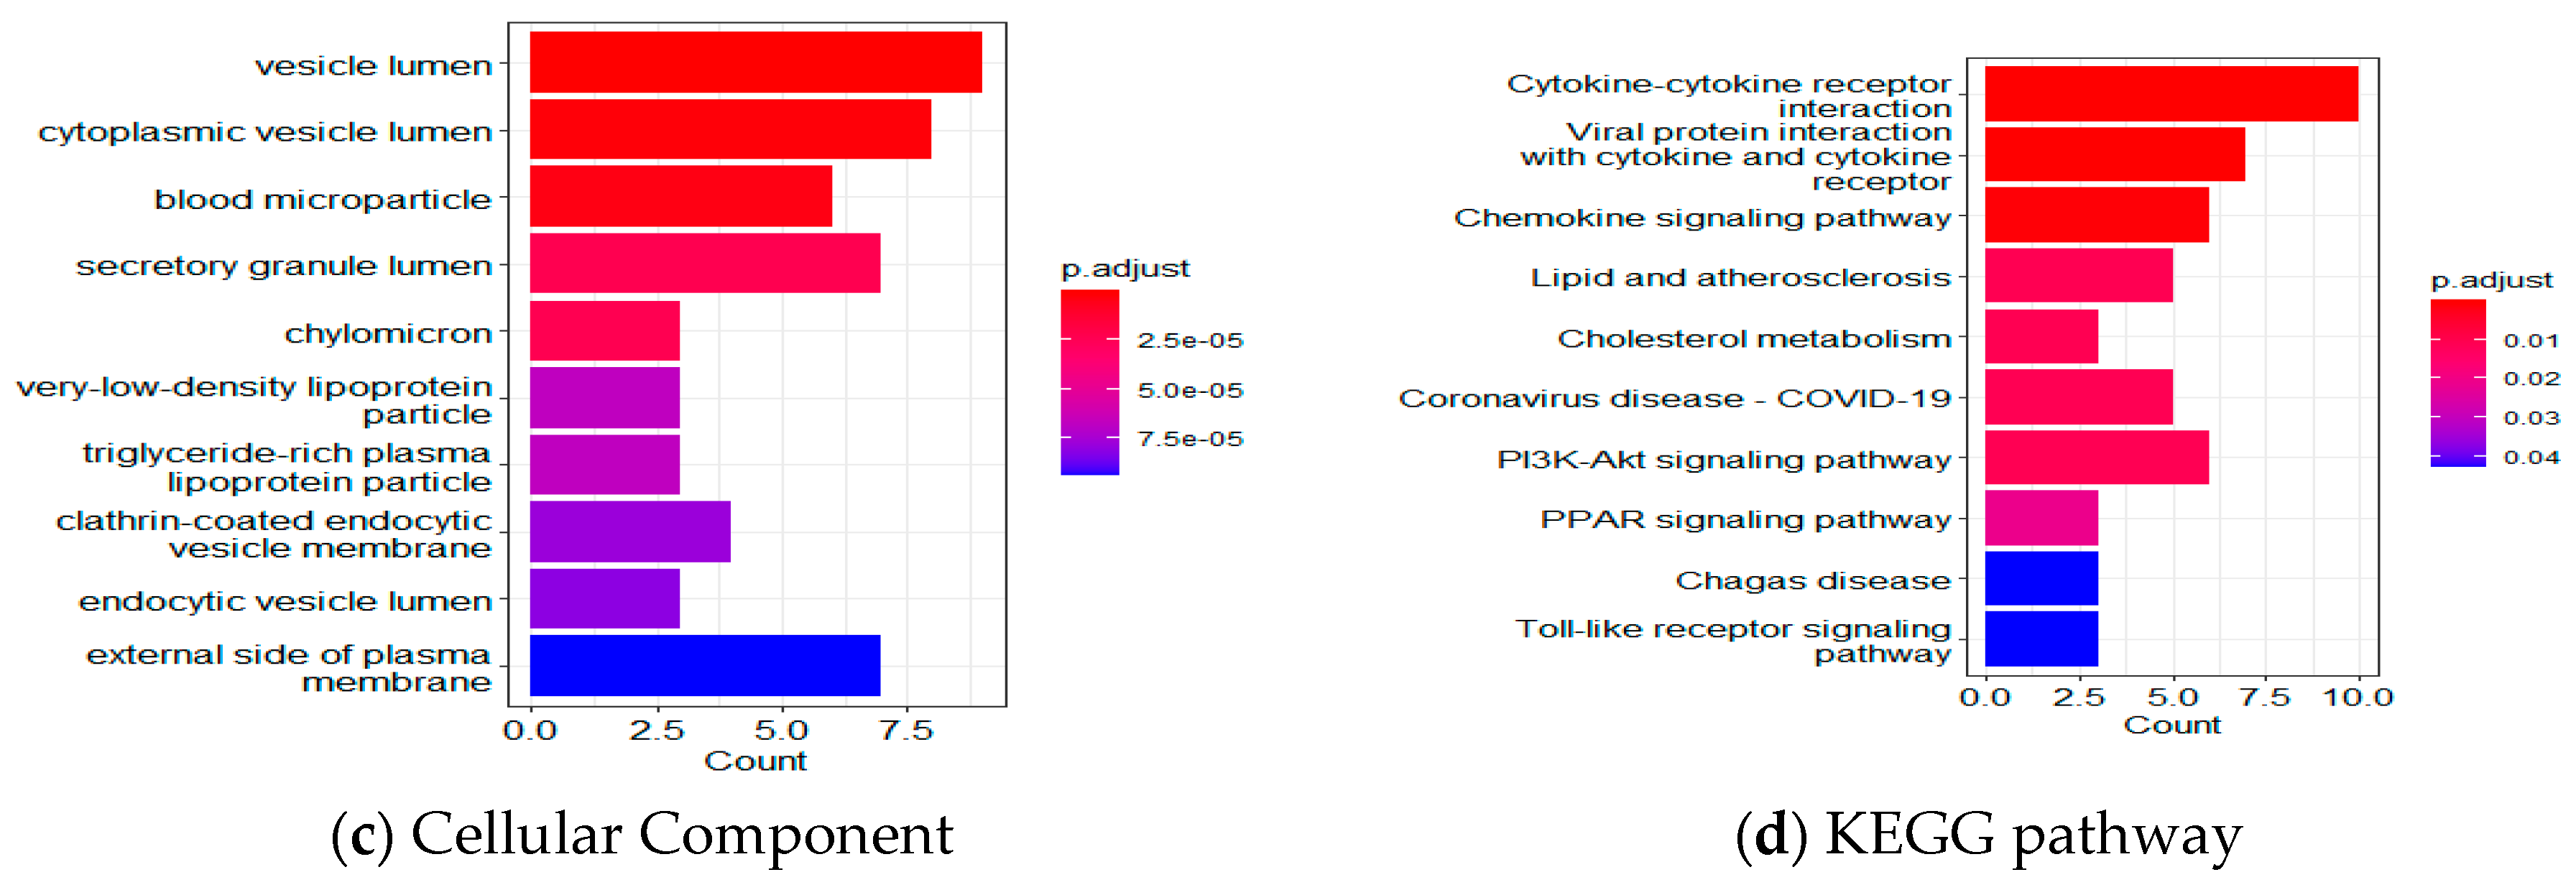
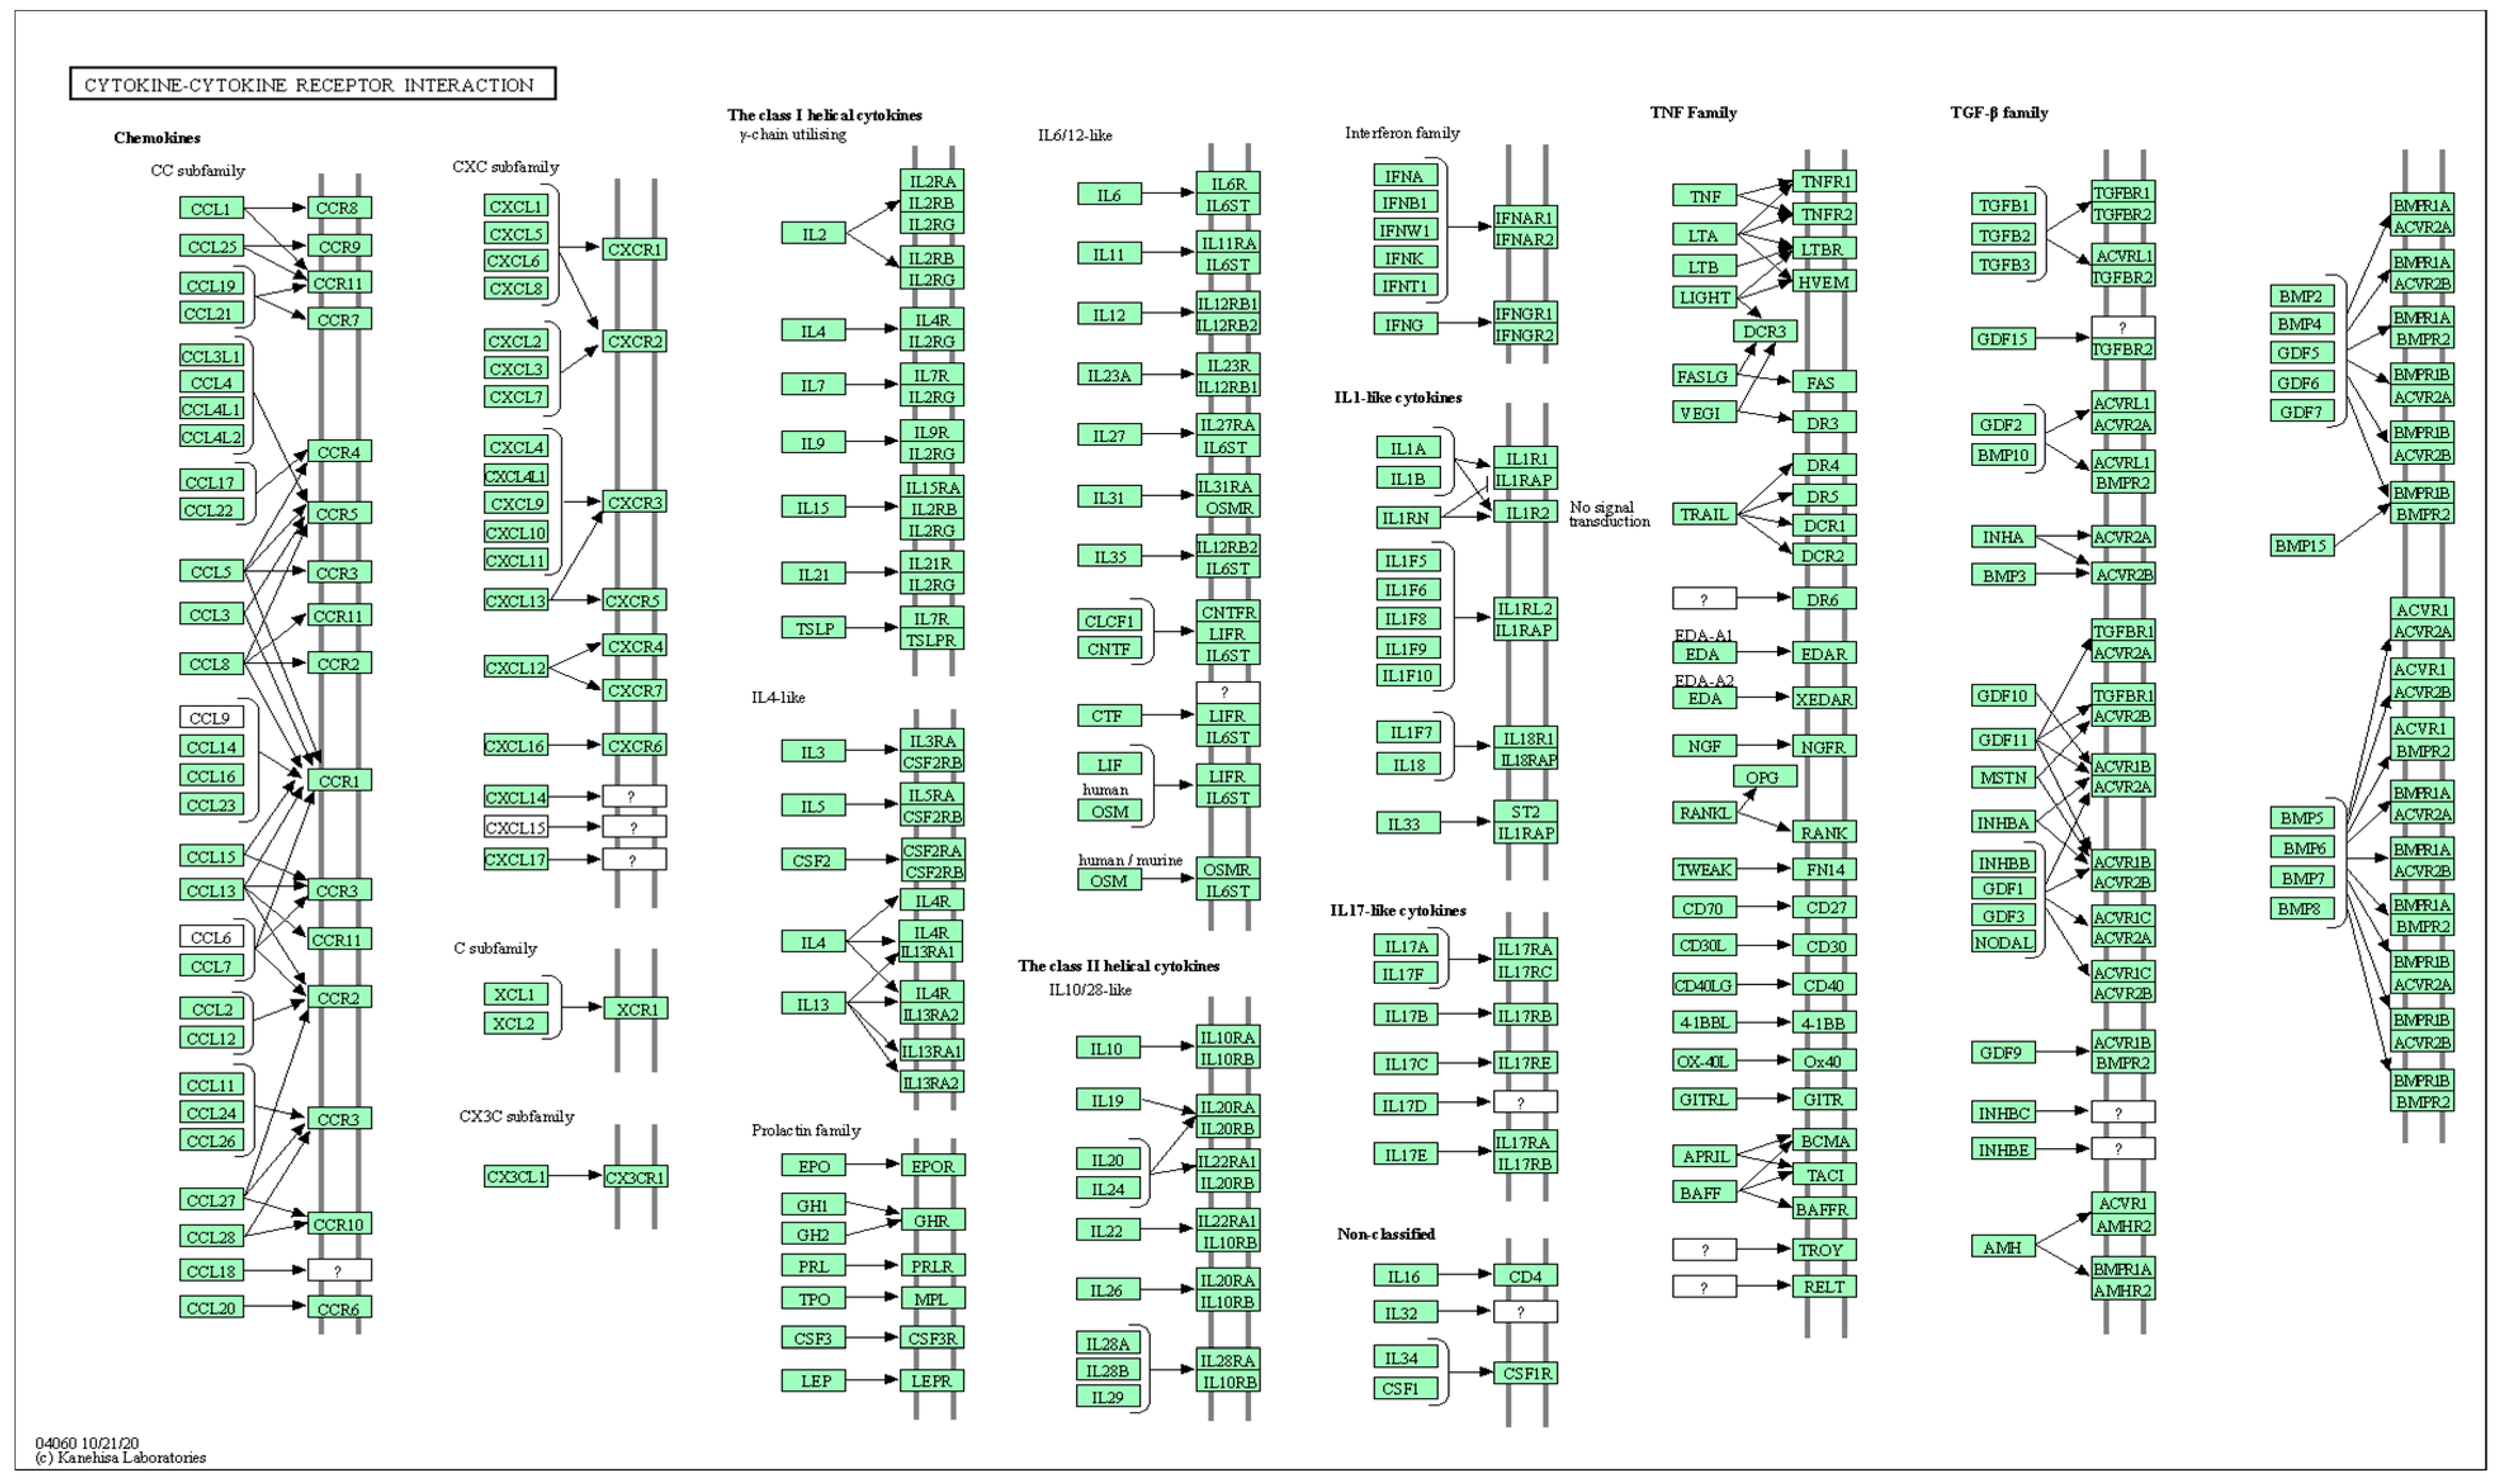
2.5. Bioinformatics Analysis Using GO and KEGG Pathway Analyses

Based on functional enrichment analyses of the 35 LASSO-selected proteomic markers using Gene Ontology (GO) and the Kyoto Encyclopedia of Genes and Genomes (KEGG), Figure 5 shows the top 10 proteins for biological processes (BP), molecular function (MF), cellular component (CC), and KEGG pathway. Table S4 lists the p-values, q-values, and number of involved genes for each pathway. In the BP category, target proteins were mainly involved in cell and leukocyte chemotaxis, regulation of lipid localization, and leukocyte migration. In the MF category, target proteins were primarily involved in receptor ligand activity, signaling receptor activator activity, cytokine/chemokine activity, G protein-coupled receptor binding, and cytokine/chemokine receptor binding. In the CC category, target proteins were mainly distributed in the vesicle lumen, cytoplasmic vesicle lumen, secretory granule lumen, the external side of the plasma membrane, and lipoprotein particles.
KEGG pathway analysis revealed that several pathways were significantly enhanced, including cytokine-cytokine receptor interaction (KEGG pathway ID: hsa04060, q-value = 9.04 × 10⁻⁷, 10 genes, Figure 6 and Table S4), chemokine signaling pathway (q-value = 1.25 × 10⁻³, 6 genes), viral protein interaction with cytokine and cytokine receptor (q-value = 9.04 × 10⁻⁷, 7 genes), as well as lipid and atherosclerosis (q-value = 1.50 × 10⁻², 5 genes), along with genes in cholesterol metabolism, PPAR, Toll-like receptor, and HIF-1 signaling pathways.

3. Discussion

The present study evaluated seven traditional ML models and six variations of a DL model in the prediction of MCI using plasma proteomic biomarkers. The LASSO algorithm identified 35 proteomic biomarkers, and the DL model with an activation function of “Rectifier With Dropout” with 2 layers and 32 inputs revealed the best model with the highest accuracy and F1 Score. Furthermore, the analysis of GO and KEGG pathways demonstrated that these identified proteins were involved in various crucial biological processes and pathways. These include cell chemotaxis, regulation of lipid localization, receptor ligand activity, signaling receptor activator activity, cytokine-cytokine receptor interaction, and viral protein interaction with cytokine and cytokine receptor.
The involvement of these proteins in these pathways suggests their potential contributions to the underlying mechanisms of MCI and provides valuable insights into the molecular processes implicated in the disease, as noted in a study that reported cerebrospinal fluid inflammatory analytes in relation to cognitive decline were best described by natural killer cell chemotaxis [51]. The studies using an animal model also demonstrated that cell chemotaxis was associated with female diabetic mice with cognitive impairment [52] and cognitive function in aged mice related to cytokine-cytokine receptor interaction [53]. These findings may have implications for understanding the pathogenesis of the MCI stage of AD and identifying potential therapeutic targets for intervention.
Feature selection is a critical step in ML not only to reduce the dimensionality of the feature space but also to reveal the most relevant features without losing too much information [45,46,47]. In prediction of AD, one study [38] used LASSO and selected 50 predictor proteins from a plasma sample to predict amyloid burden for preclinical AD. They obtained an AUC of 0.891, a sensitivity of 0.78, and a specificity of 0.77. Another study used LASSO to select a panel of non-redundant (non-correlated) protein biomarkers from brain tissues that could accurately diagnose AD [54]. One further study on CSF proteomics used the LASSO method to identify a panel of proteins that can differentiate AD-MCI from neurological controls while keeping the lowest possible dimensionality by eliminating the highly correlated proteins [41]. In a particular study [12], correlation-based feature selection and LASSO methods were used to develop biomarker panels from urine metabolomics samples. The panels were combined with an SVM model, resulting in 94% sensitivity, 78% specificity, and 78% AUC to distinguish healthy controls from AD. In another study [14], the LASSO algorithm was followed by two classification algorithms, namely SVM and RF, to identify eight top-ranked metabolic features that can differentiate stable MCI subjects, who are proceeding to AD, and AD patients, with an overall average accuracy of 73.5%. In the present study, the LASSO approach selected 35 proteomic biomarkers, most of which were significantly associated with MCI based on an independent t-test (Table S1).
Traditional ML technologies have been used to help in the diagnosis and prognosis of AD, such as LR, NB, RF, DT, GBM, and SVM [14,22,23,25,26,27,28,29,30]. In the past several years, DL techniques have become increasingly popular in AD research. One benefit of the DL approach over typical ML methods is that the reliability of DL techniques grows with the phases of learning. Some studies have shown that DL techniques were more accurate than traditional ML algorithms such as RF and SVM [25,27,34,35,36,37,55]. Furthermore, the H2O package in R supports the most widely used ML models and advanced models, such as multilayer feedforward ANNs [48]. Several studies have used the H2O automatic ML tools, including approaches such as LR, RF, GBM, DT, XGBoosting machine, and neural networks [56,57,58,59,60,61,62,63,64,65]. Several studies have used the H2O DL function for model building [56,59,64,66,67,68]. Recently, we developed H2O DL models using metabolomic biomarkers to predict AD [69]. Until now, no single study has used H2O DL to classify MCI using proteomic biomarkers. In this present study, we used grid search and evaluated seven traditional ML models and six variations of a DNN model. Findings suggest that the best model was the DL model with an activation function of “Rectifier With Dropout”. Our analysis showed that this variation of the DL model was also the overall best model (over all traditional ML methods and DL variations tested), reporting the highest accuracy and F1 Score in predicting MCI.
Protein biomarkers have the potential to inform disease progression (preclinical AD progressing to symptomatic AD), mechanisms, and endophenotypes. These biomarkers may not only individually show disease progression but also identify crucial biological pathways impacted by AD progression. Previous studies have provided evidence that CSF proteomic analyses have the ability to uncover changes in biological processes and pathways even at preclinical or MCI stages [15,16,17,18,20,21,22]. By examining the proteomic profiles of CSF, researchers have identified specific molecular alterations that are associated with the early stages of neurodegenerative diseases, including AD. These findings suggest that CSF proteomics hold great potential as diagnostic and prognostic tools for detecting and monitoring disease progression at its earliest stages, enabling interventions and treatments to be implemented in a more effective and timely manner. For example, one study found that 91% (325/335) of pathways in the KEGG database have been topics of scientific articles examining an association with AD, and 63% of pathway terms have a clear association with AD [70]. Another study reported that in subjective cognitive decline and the preclinical stage of AD, both glucose and amino acid metabolism pathways were dysregulated according to blood sample [71] and CSF metabolomics [72].
In the present study, the 35 plasma proteins selected through LASSO have revealed that several signaling pathways are altered in MCI, mostly in lipid metabolism, inflammation, and immune response (Figure 5 and Figure 6). For example, cytokine-cytokine receptor interaction and Toll-like receptor signaling pathways in the present study (Figure 5) have been shown in the top 10 KEGG pathways in AD and novel biomarkers reflecting neuroinflammation [41,73]. Furthermore, longitudinal studies incorporating serum analyses and brain neuropathology, along with the utilization of RF models, have provided valuable insights into the pathogenesis of AD [74,75,76] and highlighted the potential contributions of fatty acid, bile acid, cholesterol metabolism, and sphingolipid identified in the present study (Figure 5) to the development and progression of AD. Immune response and chemokine signaling pathway genes such as S100A12, CXCR4, and CXCL10 have been identified as potential markers for AD diagnosis and risk evaluation [77].
In addition, the Spearman and Pearson correlation analyses in the present study confirmed that the proteins in the above metabolic pathways in MCI are related to CSF biomarkers for AD (Tables S3 and S4). Therefore, our study supports the notion that multiple physiological pathways are involved in the onset and pathogenesis of MCI and AD. Among these pathways, a glycolysis enzyme (pyruvate kinase) and an immunological factor (MIF, macrophage inhibitory protein) are selected by several ML classifiers to be the most important feature next to the Tau proteins as CSF signatures for AD [21].

Strengths, Limitations, and Future Directions

There are several strengths of this study. First, we performed feature selection using LASSO in the selection of plasma proteomic biomarkers. The LASSO approach selected 35 proteomic biomarkers, most of which were significantly associated with MCI based on an independent t-test (Table S1). Second, we used grid search to evaluate the accuracy of different models and compared seven traditional ML methods and 6 DL methods to predict MCI. Third, we performed correlation analyses to examine the complex relationships between these proteomic biomarkers, APOE genotypes, PHS, and clinical CSF biomarkers (Aβ42, tTau, and pTau). Fourth, we conducted pathway analyses using GO and KEGG to evaluate the functions of these proteins.
Additional strength for the present study is that plasma proteomic biomarkers were used in classifying the appearance of MCI. Most previous studies have focused on CSF proteomic analyses in AD [21,22,38,39,40,41,42]. For example, one method of CSF collection, brain imaging using CSF, is considered both high cost and high risk, and it remains unclear if these neuroimaging profiling biomarkers are specific to AD [12,13]. Another existing method of CSF collection is lumbar puncture (LP), an invasive procedure that carries the risk of adverse effects (i.e., infection) and requires a skilled clinician. Thus, a blood-based measure that accurately reflects the pathology of AD, ideally at the preclinical phase, has significant advantages in therapeutic trials and clinical decisions in prescribing Aβ-targeting drugs [38]. It has been shown that blood biomarkers could potentially aid early diagnosis and recruitment for trials [5,14,78,79]. One recent study suggests that urine-targeted proteomic biomarker has potential utility as a diagnostic screening tool in AD [80]. Several previous studies utilized plasma biomarkers [14,38,54,81], while other studies [74,75,82] focused on serum biomarkers in association with AD/dementia. Interestingly, both plasma and serum biomarkers yielded similar trends in their findings. A recent study [83] suggests that combining feature-selected serum and plasma biomarkers could be crucial for understanding the pathophysiology of dementia and developing preventive treatments. This highlights the urgent need for innovative analysis strategies, like ML, to effectively integrate serum and plasma biomarkers in MCI and AD research.
However, some limitations need to be acknowledged. First, the sample size is relatively small, especially the CN group (n = 57). The present study merged several components from ADNI-1, which originally had fewer CN individuals (400 individuals with MCI and 200 individuals with CN). After merging AOPE genotype, PHS, three clinical CSF biomarkers (Aβ42, tTau, and pTau), and plasma proteomic biomarkers, the sample size decreased because some measures were unavailable for certain individuals in ADNI-1. Although the ADNI data are longitudinal, the number of individuals of CN in the merged data are smaller in the follow-up; therefore, the present study relied on baseline data. Furthermore, the imbalanced data (57 CN and 182 MCI individuals) may affect the stability and generalization ability of the model, although the ROSE method was utilized to resample the data [50]. Moreover, education is a key component of cognitive reserve, and several studies have found that it has a relationship with MCI [10,84,85]. However, the present study did not show an association of education with MCI (Table 1). On the one hand, this could be due to phenotypic and genetic heterogeneity among the patients with cognitive impairment in different studies; on the other hand, the small sample size in the CN group may influence the results. In addition, the gender in the MCI group is not balanced. Although two-thirds of persons with Alzheimer’s are women [2], currently, it is unknown how gender plays a role in different pathways. In the future, independent large longitudinal data are required to assess the generalization ability of the model, consider using regularization techniques to reduce overfitting, and replicate the results.
Another limitation is that the present study only used proteomic biomarkers. Identification of biomarkers from proteomics is still in its very early stage due to many challenges in proteomics. For example, (1) the human genome encodes approximately 26,000–31,000 proteins, but current studies have limited coverage of the proteome; (2) unlike genomics, there is no standardized proteomic method analogous to polymerase chain reaction (PCR); and (3) proteomic methods remain relatively expensive [86,87,88,89,90]. Due to the complex mechanisms of the development of MCI and AD, future research should examine multiple “omics” data types and integrate multi-omics data by analyzing large-scale molecular data like genomics, transcriptomics, proteomics, and metabolomics data to understand the underlying biological mechanisms of MCI and AD at a comprehensive molecular level. The integration of data from multiple platforms will help to identify specific cellular pathways and new biomarkers altered with the progression of the disease, understand mechanisms, potential biomarkers, and therapeutic targets, and ultimately improve the diagnosis and treatment of AD [91,92,93,94,95]. Furthermore, integrating omics data needs advanced statistical methods such as correlation analyses, data mining, cluster analysis, mediation analysis, and more effective ML and DL tools.
In addition, it should be noted that the present study specifically aimed to evaluate traditional ML tools and a DNN model—a DL model included in the H2O package. Recently, DL models have been increasingly applied in the field of medical imaging. Several state-of-the-art (SOTA) models such as CNN, residual network (ResNet), Transformer, Mamba, diffusion models or combined models have been proposed [96,97,98,99,100,101,102]. For example, the CNNs and Vision Transformers (ViTs) are predominant paradigms; however, each has advantages and inherent limitations, whereas the emerging Mamba could combine the advantages of linear scalability and global sensitivity [98]. Another study proposed a novel network framework, MUNet, which could combine the advantages of UNet and Mamba [97]. A recent study proposed TabSeq, which applied tabular deep learning models to the ADNI data [103]. The present study focused on evaluation of DNN with traditional ML models because the DNN model is easy to use for one-dimensional proteomic data. The SOTA DL methods are computationally heavy and are beyond the scope of this paper. In the future, it will be interesting to evaluate DNN with other SOTA methods such as CNN-based methods, ResNet, Mamba, and Transformer-based models with a comprehensive comparison with modern DL models.

4. Materials and Methods

4.1. Dataset

This study used the Alzheimer’s Disease Neuroimaging Initiative (ADNI) database (adni.loni.usc.edu). The ADNI has the primary goal to test whether serial magnetic resonance imaging (MRI), positron emission tomography (PET), other biological markers, clinical, and neuropsychological assessments can be combined to measure the progression of mild MCI and early AD. In 2004, the ADNI began as a multicenter initiative to provide services to the United States and Canada. The ADNI is a longitudinal and multicenter study designed to develop clinical, imaging, genetic, and biochemical biomarkers for the early detection and tracking of AD. For this study, we merged several components of data from ADNI. There was an Institutional Review Board exemption for the current study due to secondary data analysis.

4.2. Measures

Demographic variables included age, gender, and educational levels. Gender has two levels (male or female). Age and education were continuous variables (years). APOE-ε4 carriers were coded as individuals with at least one ε4 allele (ε4/ε4 designated as APOE-ε4-2, ε4/ε3, or ε4/ε2 as APOE-ε4-1+), while non-carriers were defined as individuals with no ε4 allele (APOE-ε4-0) (Table 1). Biological markers included polygenic hazard score (PHS) [104], which is based on AD-associated single nucleotide polymorphisms (SNPs) from previous genome-wide association studies (GWAS) data such as the International Genomics of Alzheimer’s Project and the Alzheimer’s Disease Genetics Consortium. PHS measures an individual’s risk of developing AD based on age and genetic markers. A total of 146 plasma proteomic biomarkers were from an ADNI subset of the dataset “Biomarkers Consortium Plasma Proteomics Project RBM multiplex data”. This study used the ADNIMERGE data, which consist of AD diagnosis, demographic variables, APOE-ε4 genotype, and clinical CSF biomarkers (Aβ42, tTau, and pTau). After merging demographic variables, AD diagnosis, APOE-ε4 allele-containing genotypes, PHS, clinical CSF biomarkers, and proteomic biomarkers, the total sample size was 335, including 96 with AD, 57 with cognitive normal (CN), and 182 with MCI. In the present study, we only analyzed data from MCI and CN individuals. Figure 7 shows the research framework, including data duration, the ML/DL process, correlation analysis, and bioinformatics analysis.

4.3. Feature Selection of Plasma Proteomic Biomarkers and Resampling

Before applying the feature selection methods of 146 plasma proteomic biomarkers, the protein levels were transformed to the Z score, as distributions of protein levels may be skewed. The Z-score was computed for each protein using the mean and standard deviation (SD). The Least Absolute Shrinkage and Selection Operator (LASSO) in the R package “glmnet” version 4.1-8 was used to perform feature selection using logistic regression [49]. LASSO is an embedded feature selection method used for ML and regression analysis. The LASSO method regularizes model parameter λ by shrinking the regression coefficients, reducing some of them to zero. Therefore, LASSO effectively performs feature selection, identifying and retaining only the most relevant features [49]. This makes LASSO useful for simplifying models, improving interpretability, and potentially preventing overfitting.
Considering the imbalanced data (57 with CN and 182 with MCI), the Random Over Sampling Example (ROSE) method was utilized, where the method = “both” was selected; both the minority class is oversampled with replacement, and the majority class is undersampled without replacement [50]. ROSE is a technique used to address class imbalance by generating synthetic data points. ROSE creates new samples by adding small perturbations to existing data points within the minority class [50]. This method uses smoothed bootstrap resampling to produce new instances. Another method—Synthetic Minority Over-sampling Technique (SMOTE)—works by selecting cases from the minority class and creating new samples along the line segments that connect these instances with their nearest neighbors [105]. Both ROSE and SMOTE were tried, and it was found that both improved model performance but did not rank as highly as oversampling or undersampling in the study [106]. The overall performance of ML was improved using either method, with ROSE performing better than SMOTE [107].

4.4. Traditional Machine Learning Methods

After feature selection, seven traditional ML algorithms were used, including LR, SVM, RF, NB, KNN, GBM, and XGBoost, to develop ML models to predict MCI. The Caret package version 7.0-1 in R [108] was used, incorporating RF version 4.7.1.1, NB version 1.0.0, GBM version 2.2.2, and XGBoost version 1.7.8.1. packages with tuning parameters. The data were split into 70% for training and 30% for validation. A grid search was employed on the training set to attain optimal values for the hyper-parameters. For each combination of hyper-parameters’ values, a 10-fold stratified cross-validation (CV) procedure was carried out to validate a model internally. The setting of parameters in each algorithm was briefly described as follows:
LR is the most widely used ML algorithm for binary outcomes in this study, MCI vs. CN. We implemented the method via “glmnet” in the Caret package. In the grid search, we set alpha = 0:1 and lambda = seq(0.001, 1, length = 20).
SVM is a method of computing hyperplanes that optimally separate data belonging to two classes. In this study, we used the nonlinear classification using the radial basis function (RBF) kernel [109]. In the grid search, we set sigma = c(0.01, 0.05, 0.1, 0.2, 0.5, 1) and C = c(0.01, 0.05, 0.1, 0.2, 0.5, 0.75, 1, 1.25, 1.5, 1.75, 2)).
The RF uses multiple decision trees and randomly selects a subset of variables and constructs many decision trees [110,111]. In the grid search, we set mtry = c(1:35) and ntree = 300, where the mtry parameter refers to the number of variables used in each random tree, while ntree refers to the number of trees that the forest contains.
The NB algorithm is a probabilistic ML model based on Bayes’ theorem with an assumption of independence between predictors, despite the fact that features in that class may be interdependent [112]. In the grid search, we set laplace = c(0, 0.5, 1, 2, 3, 4, 5) and adjust = c(0.75, 1, 1.25, 1.5, 2, 3, 4, 5).
KNN is a simple ML algorithm that calculates the average of the numerical target of the K nearest neighbors. KNN is based on a clustering algorithm with supervised learning [113]. KNN is more suitable for low-dimensional data with a small number of input variables. In the grid search, we set k = 1:35.
The GBM is a boosting algorithm and an ensemble model where many weak classification tree models are converted into one single strong model to produce prediction [49]. In the grid search, we set interaction.depth = c(1, 2, 3, 4, 5, 6), n.trees = (1:30)*50, shrinkage = c(0.005, 0.025, 0.05, 0.075, 0.1, 0.25, 0.5), and n.minobsinnode = c(5, 10, 15, 20).
XGBoost is a boosting tree-based ML framework and uses the CART (Classification and Regression Tree) and trains the trees serially and interactionally rather than in parallel and independently [114]. In the grid search, we set the nrounds = c(100, 200, 300), max_depth = c(6, 10, 20), colsample_bytree = c(0.5, 0.75, 1.0), eta = c(0.1, 0.3, 0.5), gamma = c(0, 1, 2), min_child_weight = c(1, 3, 5), and subsample = c(0.5, 0.75, 1.0).

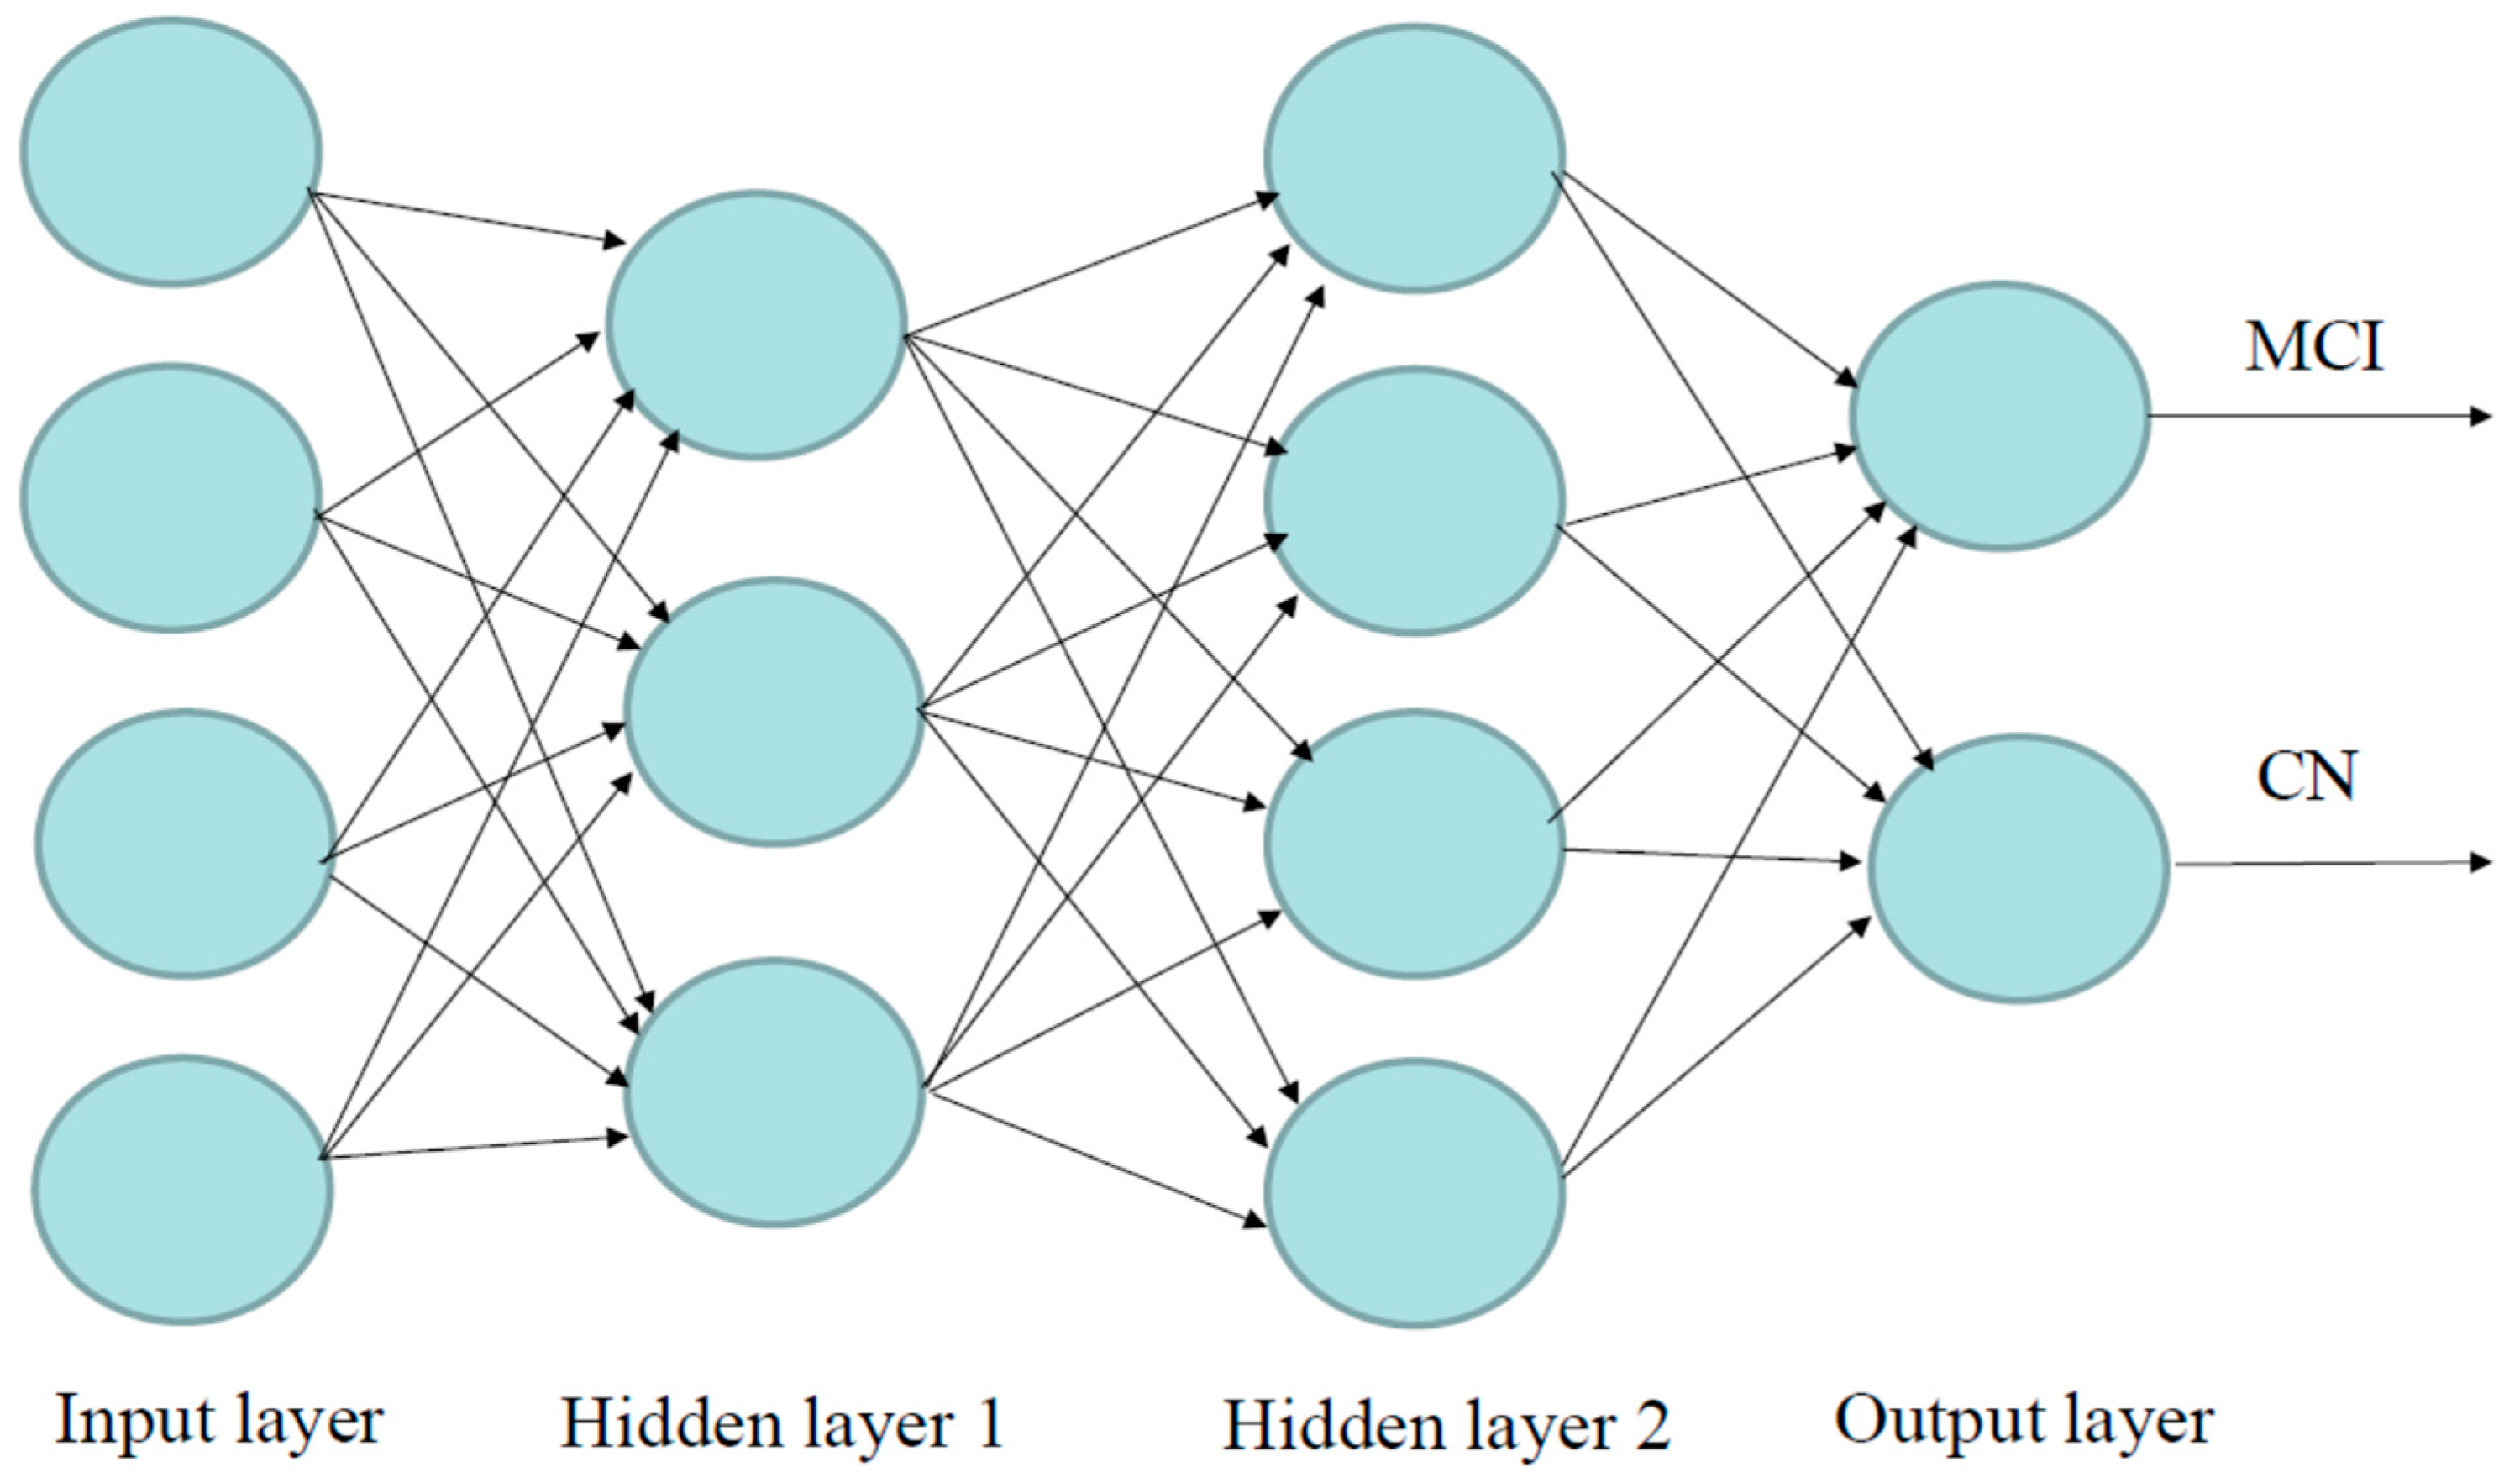
4.5. Deep Learning Methods

The DL in the “H2O” package is used to develop the DL models, which are on a multi-layer feedforward artificial neural network (ANN), also known as a deep neural network (DNN) or multi-layer perceptron (MLP). Figure 8 illustrates an ANN with two hidden layers, four input variables/neurons, and output. The data were split into 70% for training and 30% for validation. We used grid search and compared six different activation functions for the DNN: “Rectifier”, “RectifierWithDropout”, “Maxout”, “MaxoutWithDropout”, “Tanh”, and “TanhWithDropout”, with settings of the hidden layer as 1 to 3, n-fold cross-validation with n = 10, epochs = 100, input_dropout_ratio = 0.2, and l1 = 1 × 10⁻⁶. Search criteria included strategy = “RandomDiscrete”, max_models = 100, max_runtime_secs = 900, stopping_tolerance = 0.001, and stopping_rounds = 15. The models that return higher accuracy were chosen. Then, we focused on several DL models with higher accuracy and compared models with 1–3 hidden layers and different numbers of neurons.

4.6. Performance of Machine Learning and Deep Learning Models

The confusion matrix is illustrated in Table 4. To evaluate different models, the following performance measures were used: accuracy (ACC), recall (also called sensitivity—Sn), specificity (Sp), precision (positive predictive value—PPV), F1-score, and AUC (area under the receiver operating characteristic (ROC) curve). These measures are defined as follows:
A c c u r a c y = T P + T N T P + T N + F P + F N
R e c a l l = T P T P + F N
S p e c i f i c i t y = T N T N + F P
P r e c i s i o n = T P T P + F P
F 1   S c o r e = 2   x   P r e c i s i o n   x   R e c a l l P r e c i s i o n + R e c a l l
Accuracy (ACC) is the ratio of correctly classified observations to the total number of observations. Recall (sensitivity—Sn) is the ratio of correctly predicted positive observations to all observations in the actual class—MCI. Specificity (Sp)—the ratio of correctly predicted negative observations to all observations in the actual class—CN. Precision (positive predictive value—PPV) is the ratio of correctly predicted positive observations to the total predicted positive observations. F1-Score is a harmonic mean that combines both recall and precision. The AUC is the measure of the ability of a classifier to distinguish between classes and is used as a summary of the receiver operating characteristic (ROC) curve.

4.7. Statistical Analysis

Descriptive statistics such as counts and proportions were used for categorical variables. Continuous variables were presented in the form of mean ± standard deviation (SD). A Chi-square test was used to detect the associations of categorical variables with MCI vs. CN. An independent t-test was used to examine the differences in continuous variables between MCI and CN. Pearson and Spearman correlation analyses were conducted to examine the relationships between the plasma proteomic biomarkers, PHS, and three CSF biomarkers (Aβ42, tTau, and pTau). Statistical analyses were performed using SAS 9.4 (SAS Institute, Cary, NC, USA).

4.8. Bioinformatic Analysis

The R package “ClusterProfiler” version 4.1.5.1 was used to perform Gene Ontology (GO) enrichment (http://www.geneontology.org, accessed on 30 July 2024) [115] and Kyoto Encyclopedia of Genes and Genomes (KEGG) pathway (http://www.genome.jp/kegg/pathway.html, accessed on 30 July 2024) [116] analyses of proteins to evaluate whether the targeted proteins were involved in important biological processes. Results were visualized by the R package “ggplot2” version 3.5.1 [117] in R 4.4.3 (R Core Team, Vienna, Austria).

4.9. Power Analysis

An independent samples t-test was used to compare the means of continuous variables between the two groups (MCI vs. CN). Using G.Power [118,119], assuming α = 0.05, Cohen’s d = 0.50 (moderate effect), and a sample size for MCI and CN being 182 and 57, respectively, the power can reach 92.96%.

5. Conclusions

In the present study, we evaluated seven traditional ML tools with six variations of the DNN model in the classification of MCI. We found the DL model with an activation function of “Rectifier With Dropout” with 2 layers and 32 proteomic biomarkers revealed the best model with the highest accuracy and F1 Score. The 35 proteins selected by LASSO are involved in important biological processes and pathways. Some of the proteins are correlated with the genetic biomarker APOE-ε4, PHS, and clinical CSF biomarkers (Aβ42, tTau, and pTau). These biomarkers and pathway analyses may help with early diagnosis, prognostic risk stratification, and early treatment interventions for individuals at risk for MCI and AD. The DL algorithm showed a higher performance compared to traditional ML models, and the DL model developed in this study might play a critical role in preventing the risk of MCI.

Supplementary Materials

The following supporting information can be downloaded at: https://www.mdpi.com/article/10.3390/ijms26062428/s1.

Author Contributions

Conceptualization, K.W. and C.X.; methodology, K.W., D.A.A. and W.F.; data analysis and interpretation, K.W., D.A.A. and W.F.; validation, S.M.W. and U.P.; investigation, K.W., C.X. and D.X.; writing—original draft preparation, K.W. and C.X.; writing—review and editing, D.A.A., W.F., S.M.W., D.X. and U.P.; supervision, K.W. and C.X. The Alzheimer’s Disease Neuroimaging Initiative Data used in the preparation of this article were obtained from the Alzheimer’s Disease Neuroimaging Initiative (ADNI) database (adni.loni.usc.edu, accessed on 12 December 2023). All authors have read and agreed to the published version of the manuscript.

Funding

This research received no external funding.

Institutional Review Board Statement

There was an Institutional Review Board exemption for the current study due to secondary data analysis. Data used in the preparation of this article were obtained from the Alzheimer’s Disease Neuroimaging Initiative (ADNI) database (adni.loni.usc.edu).

Informed Consent Statement

Informed consent was obtained from all subjects involved in the original study. Data used in the preparation of this article were obtained from the Alzheimer’s Disease Neuroimaging Initiative (ADNI) database (adni.loni.usc.edu).

Data Availability Statement

Data used in the preparation of this article were obtained from the Alzheimer’s Disease Neuroimaging Initiative (ADNI) database (adni.loni.usc.edu).

Acknowledgments

The present study is a secondary data analysis. The original study and ADNI were funded by the Alzheimer’s Disease Neuroimaging Initiative (ADNI) (National Institutes of Health Grant U01 AG024904) and DOD ADNI (Department of Defense award number W81XWH-12-2-0012). ADNI is funded by the National Institute on Aging, the National Institute of Biomedical Imaging and Bioengineering, and through generous contributions from the following: AbbVie, Alzheimer’s Association; Alzheimer’s Drug Discovery Foundation; Araclon Biotech; BioClinica, Inc.; Biogen; Bristol-Myers Squibb Company; CereSpir, Inc.; Cogstate; Eisai Inc.; Elan Pharmaceuticals, Inc.; Eli Lilly and Company; EuroImmun; F. Hoffmann-La Roche Ltd. and its affiliated company Genentech, Inc.; Fujirebio; GE Healthcare; IXICO Ltd.; Janssen Alzheimer Immunotherapy Research & Development, LLC.; Johnson & Johnson Pharmaceutical Research & Development, LLC.; Lumosity; Lundbeck; Merck & Co., Inc.; Meso Scale Diagnostics, LLC.; NeuroRx Research; Neurotrack Technologies; Novartis Pharmaceuticals Corporation; Pfizer Inc.; Piramal Imaging; Servier; Takeda Pharmaceutical Company; and Transition Therapeutics. The Canadian Institutes of Health Research is providing funds to support ADNI clinical sites in Canada. Private sector contributions are facilitated by the Foundation for the National Institutes of Health. The grantee organization is the Northern California Institute for Research and Education, and this study is coordinated by the Alzheimer’s Therapeutic Research Institute at the University of Southern California. ADNI data are disseminated by the Laboratory for Neuro Imaging at the University of Southern California.

Conflicts of Interest

The authors declare no conflicts of interest.

Abbreviations

The following abbreviations are used in this manuscript:
ADNI Alzheimer’s Disease Neuroimaging Initiative
AD Alzheimer’s Disease
MCI Mild Cognitive Impairment
CN Cognitive normal
DL Deep learning
ML Machine learning
ROSE Random Over Sampling Example
CSF Clinical cerebrospinal fluid
GO Gene Ontology
KEGG Kyoto Encyclopedia of Genes and Genomes
LR Logistic regression
DT Decision trees
GBM Gradient boosting machines
GLM General linear model
SVM Support vector machine
RF Random forest
LASSO Least Absolute Shrinkage and Selection Operator
RBF Radial basis function
NB Naïve Bayes
ANN Artificial neural network
MLP Multi-layer perceptron
DNN Deep Neural Network
SAE Stacked autoencoder
CNN Convolutional neural network
SOTA State-of-the-art (SOTA)
ResNet Residual network
APOE Apolipoprotein E
AUCArea under the ROC (receiver operating characteristics) curve
PHS Polygenic hazard score
SNP Single nucleotide polymorphism
GWAS Genome-wide association studies
SD Standard deviation
Amyloid-β
tTau pathologic tau
pTau Phosphorylated tau
MRI Magnetic resonance imaging
PET Positron emission tomography
ACC Accuracy
Sn Sensitivity
Sp Specificity
PPV Positive predictive value
TP Number of true positives
TN Number of true negatives
FP Number of false positives
FN Number of false negatives
BP Biological processes
MF Molecular function
CC Cellular component

References

  1. Alzheimer’s Association. 2022 Alzheimer’s Disease Facts and Figures. Alzheimer’s Dement. 2022, 18, 700–789. [Google Scholar] [CrossRef] [PubMed]
  2. Alzheimer’s Association. 2024 Alzheimer’s Disease Facts and Figures. Alzheimer’s Dement. 2024, 20, 3708–3821. [Google Scholar] [CrossRef] [PubMed]
  3. Bateman, R.J.; Xiong, C.; Benzinger, T.L.S.; Fagan, A.M.; Goate, A.; Fox, N.C.; Marcus, D.S.; Cairns, N.J.; Xie, X.; Blazey, T.M.; et al. Clinical and Biomarker Changes in Dominantly Inherited Alzheimer’s Disease. N. Engl. J. Med. 2012, 367, 795–804. [Google Scholar] [CrossRef] [PubMed]
  4. Jack, C.R.; Knopman, D.S.; Jagust, W.J.; Petersen, R.C.; Weiner, M.W.; Aisen, P.S.; Shaw, L.M.; Vemuri, P.; Wiste, H.J.; Weigand, S.D.; et al. Tracking Pathophysiological Processes in Alzheimer’s Disease: An Updated Hypothetical Model of Dynamic Biomarkers. Lancet Neurol. 2013, 12, 207–216. [Google Scholar] [CrossRef]
  5. Jack, C.R.; Bennett, D.A.; Blennow, K.; Carrillo, M.C.; Dunn, B.; Haeberlein, S.B.; Holtzman, D.M.; Jagust, W.; Jessen, F.; Karlawish, J.; et al. NIA-AA Research Framework: Toward a Biological Definition of Alzheimer’s Disease. Alzheimers Dement. 2018, 14, 535–562. [Google Scholar] [CrossRef]
  6. Amieva, H.; Le Goff, M.; Millet, X.; Orgogozo, J.M.; Pérès, K.; Barberger-Gateau, P.; Jacqmin-Gadda, H.; Dartigues, J.F. Prodromal Alzheimer’s Disease: Successive Emergence of the Clinical Symptoms. Ann. Neurol. 2008, 64, 492–498. [Google Scholar] [CrossRef]
  7. Wilson, R.S.; Leurgans, S.E.; Boyle, P.A.; Bennett, D.A. Cognitive Decline in Prodromal Alzheimer Disease and Mild Cognitive Impairment. Arch. Neurol. 2011, 68, 351–356. [Google Scholar] [CrossRef]
  8. Mueller, S.G.; Weiner, M.W.; Thal, L.J.; Petersen, R.C.; Jack, C.R.; Jagust, W.; Trojanowski, J.Q.; Toga, A.W.; Beckett, L. Ways toward an Early Diagnosis in Alzheimer’s Disease: The Alzheimer’s Disease Neuroimaging Initiative (ADNI). Alzheimers Dement. 2005, 1, 55–66. [Google Scholar] [CrossRef]
  9. Weiner, M.W.; Veitch, D.P.; Aisen, P.S.; Beckett, L.A.; Cairns, N.J.; Green, R.C.; Harvey, D.; Jack, C.R.; Jagust, W.; Morris, J.C.; et al. The Alzheimer’s Disease Neuroimaging Initiative 3: Continued Innovation for Clinical Trial Improvement. Alzheimer’s Dement. 2017, 13, 561–571. [Google Scholar] [CrossRef]
  10. Petersen, R.C.; Smith, G.E.; Waring, S.C.; Ivnik, R.J.; Tangalos, E.G.; Kokmen, E. Mild Cognitive Impairment: Clinical Characterization and Outcome. Arch. Neurol. 1999, 56, 303. [Google Scholar] [CrossRef]
  11. Tijms, B.M.; Gobom, J.; Teunissen, C.; Dobricic, V.; Tsolaki, M.; Verhey, F.; Popp, J.; Martinez-Lage, P.; Vandenberghe, R.; Lleó, A.; et al. CSF Proteomic Alzheimer’s Disease-Predictive Subtypes in Cognitively Intact Amyloid Negative Individuals. Proteomes 2021, 9, 36. [Google Scholar] [CrossRef] [PubMed]
  12. Yilmaz, A.; Ugur, Z.; Bisgin, H.; Akyol, S.; Bahado-Singh, R.; Wilson, G.; Imam, K.; Maddens, M.E.; Graham, S.F. Targeted Metabolic Profiling of Urine Highlights a Potential Biomarker Panel for the Diagnosis of Alzheimer’s Disease and Mild Cognitive Impairment: A Pilot Study. Metabolites 2020, 10, 357. [Google Scholar] [CrossRef] [PubMed]
  13. Lau, A.; Beheshti, I.; Modirrousta, M.; Kolesar, T.A.; Goertzen, A.L.; Ko, J.H. Alzheimer’s Disease-Related Metabolic Pattern in Diverse Forms of Neurodegenerative Diseases. Diagnostics 2021, 11, 2023. [Google Scholar] [CrossRef]
  14. Huang, Y.-L.; Lin, C.-H.; Tsai, T.-H.; Huang, C.-H.; Li, J.-L.; Chen, L.-K.; Li, C.-H.; Tsai, T.-F.; Wang, P.-N. Discovery of a Metabolic Signature Predisposing High Risk Patients with Mild Cognitive Impairment to Converting to Alzheimer’s Disease. Int. J. Mol. Sci. 2021, 22, 10903. [Google Scholar] [CrossRef] [PubMed]
  15. Craig-Schapiro, R.; Kuhn, M.; Xiong, C.; Pickering, E.H.; Liu, J.; Misko, T.P.; Perrin, R.J.; Bales, K.R.; Soares, H.; Fagan, A.M.; et al. Multiplexed Immunoassay Panel Identifies Novel CSF Biomarkers for Alzheimer’s Disease Diagnosis and Prognosis. PLoS ONE 2011, 6, e18850. [Google Scholar] [CrossRef]
  16. Villemagne, V.L.; Burnham, S.; Bourgeat, P.; Brown, B.; Ellis, K.A.; Salvado, O.; Szoeke, C.; Macaulay, S.L.; Martins, R.; Maruff, P.; et al. Amyloid β Deposition, Neurodegeneration, and Cognitive Decline in Sporadic Alzheimer’s Disease: A Prospective Cohort Study. Lancet Neurol. 2013, 12, 357–367. [Google Scholar] [CrossRef]
  17. Fagan, A.M.; Xiong, C.; Jasielec, M.S.; Bateman, R.J.; Goate, A.M.; Benzinger, T.L.S.; Ghetti, B.; Martins, R.N.; Masters, C.L.; Mayeux, R.; et al. Longitudinal Change in CSF Biomarkers in Autosomal-Dominant Alzheimer’s Disease. Sci. Transl. Med. 2014, 6, 226ra30. [Google Scholar] [CrossRef]
  18. Aebersold, R.; Mann, M. Mass-Spectrometric Exploration of Proteome Structure and Function. Nature 2016, 537, 347–355. [Google Scholar] [CrossRef]
  19. Long, J.; Pan, G.; Ifeachor, E.; Belshaw, R.; Li, X. Discovery of Novel Biomarkers for Alzheimer’s Disease from Blood. Dis. Markers 2016, 2016, 4250480. [Google Scholar] [CrossRef]
  20. Hosp, F.; Mann, M. A Primer on Concepts and Applications of Proteomics in Neuroscience. Neuron 2017, 96, 558–571. [Google Scholar] [CrossRef]
  21. Bader, J.M.; Geyer, P.E.; Müller, J.B.; Strauss, M.T.; Koch, M.; Leypoldt, F.; Koertvelyessy, P.; Bittner, D.; Schipke, C.G.; Incesoy, E.I.; et al. Proteome Profiling in Cerebrospinal Fluid Reveals Novel Biomarkers of Alzheimer’s Disease. Mol. Syst. Biol. 2020, 16, e9356. [Google Scholar] [CrossRef] [PubMed]
  22. Povala, G.; Bellaver, B.; De Bastiani, M.A.; Brum, W.S.; Ferreira, P.C.L.; Bieger, A.; Pascoal, T.A.; Benedet, A.L.; Souza, D.O.; Araujo, R.M.; et al. Soluble Amyloid-Beta Isoforms Predict Downstream Alzheimer’s Disease Pathology. Cell Biosci. 2021, 11, 204. [Google Scholar] [CrossRef]
  23. Al-Shoukry, S.; Rassem, T.H.; Makbol, N.M. Alzheimer’s Diseases Detection by Using Deep Learning Algorithms: A Mini-Review. IEEE Access 2020, 8, 77131–77141. [Google Scholar] [CrossRef]
  24. García-Gutiérrez, F.; Alegret, M.; Marquié, M.; Muñoz, N.; Ortega, G.; Cano, A.; De Rojas, I.; García-González, P.; Olivé, C.; Puerta, R.; et al. Unveiling the Sound of the Cognitive Status: Machine Learning-Based Speech Analysis in the Alzheimer’s Disease Spectrum. Alzheimers Res. Ther. 2024, 16, 26. [Google Scholar] [CrossRef]
  25. Li, Z.; Jiang, X.; Wang, Y.; Kim, Y. Applied Machine Learning in Alzheimer’s Disease Research: Omics, Imaging, and Clinical Data. Emerg. Top. Life Sci. 2021, 5, 765–777. [Google Scholar] [CrossRef] [PubMed]
  26. Lü, W.; Zhang, M.; Yu, W.; Kuang, W.; Chen, L.; Zhang, W.; Yu, J.; Lü, Y. Differentiating Alzheimer’s Disease from Mild Cognitive Impairment: A Quick Screening Tool Based on Machine Learning. BMJ Open 2023, 13, e073011. [Google Scholar] [CrossRef]
  27. Saleem, T.J.; Zahra, S.R.; Wu, F.; Alwakeel, A.; Alwakeel, M.; Jeribi, F.; Hijji, M. Deep Learning-Based Diagnosis of Alzheimer’s Disease. J. Pers. Med. 2022, 12, 815. [Google Scholar] [CrossRef]
  28. Shastry, K.A.; Vijayakumar, V.; Kumar, M.M.V.; Manjunatha, B.A.; Chandrashekhar, B.N. Deep Learning Techniques for the Effective Prediction of Alzheimer’s Disease: A Comprehensive Review. Healthcare 2022, 10, 1842. [Google Scholar] [CrossRef]
  29. Tan, M.S.; Cheah, P.-L.; Chin, A.-V.; Looi, L.-M.; Chang, S.-W. A Review on Omics-Based Biomarkers Discovery for Alzheimer’s Disease from the Bioinformatics Perspectives: Statistical Approach vs Machine Learning Approach. Comput. Biol. Med. 2021, 139, 104947. [Google Scholar] [CrossRef]
  30. Wang, Y.; Sun, Y.; Wang, Y.; Jia, S.; Qiao, Y.; Zhou, Z.; Shao, W.; Zhang, X.; Guo, J.; Zhang, B.; et al. Identification of Novel Diagnostic Panel for Mild Cognitive Impairment and Alzheimer’s Disease: Findings Based on Urine Proteomics and Machine Learning. Alz. Res. Ther. 2023, 15, 191. [Google Scholar] [CrossRef]
  31. AbdulAzeem, Y.; Bahgat, W.M.; Badawy, M. A CNN Based Framework for Classification of Alzheimer’s Disease. Neural Comput. Applic. 2021, 33, 10415–10428. [Google Scholar] [CrossRef]
  32. Liu, M.; Li, F.; Yan, H.; Wang, K.; Ma, Y.; Alzheimer’s Disease Neuroimaging Initiative; Shen, L.; Xu, M. A Multi-Model Deep Convolutional Neural Network for Automatic Hippocampus Segmentation and Classification in Alzheimer’s Disease. Neuroimage 2020, 208, 116459. [Google Scholar] [CrossRef] [PubMed]
  33. Panizza, E.; Cerione, R.A. An Interpretable Deep Learning Framework Identifies Proteomic Drivers of Alzheimer’s Disease. Front. Cell Dev. Biol. 2024, 12, 1379984. [Google Scholar] [CrossRef] [PubMed]
  34. Arya, A.D.; Verma, S.S.; Chakarabarti, P.; Chakrabarti, T.; Elngar, A.A.; Kamali, A.-M.; Nami, M. A Systematic Review on Machine Learning and Deep Learning Techniques in the Effective Diagnosis of Alzheimer’s Disease. Brain Inf. 2023, 10, 17. [Google Scholar] [CrossRef]
  35. Kaur, A.; Mittal, M.; Bhatti, J.S.; Thareja, S.; Singh, S. A Systematic Literature Review on the Significance of Deep Learning and Machine Learning in Predicting Alzheimer’s Disease. Artif. Intell. Med. 2024, 154, 102928. [Google Scholar] [CrossRef] [PubMed]
  36. Mahavar, A.; Patel, A.; Patel, A. A Comprehensive Review on Deep Learning Techniques in Alzheimer’s Disease Diagnosis. Curr. Top. Med. Chem. 2024, 24, 335–349. [Google Scholar] [CrossRef]
  37. Malik, I.; Iqbal, A.; Gu, Y.H.; Al-antari, M.A. Deep Learning for Alzheimer’s Disease Prediction: A Comprehensive Review. Diagnostics 2024, 14, 1281. [Google Scholar] [CrossRef]
  38. Ashton, N.J.; Nevado-Holgado, A.J.; Barber, I.S.; Lynham, S.; Gupta, V.; Chatterjee, P.; Goozee, K.; Hone, E.; Pedrini, S.; Blennow, K.; et al. A Plasma Protein Classifier for Predicting Amyloid Burden for Preclinical Alzheimer’s Disease. Sci. Adv. 2019, 5, eaau7220. [Google Scholar] [CrossRef]
  39. Das, D.; Ito, J.; Kadowaki, T.; Tsuda, K. An Interpretable Machine Learning Model for Diagnosis of Alzheimer’s Disease. PeerJ 2019, 7, e6543. [Google Scholar] [CrossRef]
  40. Fardo, D.W.; Katsumata, Y.; Kauwe, J.S.K.; Deming, Y.; Harari, O.; Cruchaga, C.; Nelson, P.T. CSF Protein Changes Associated with Hippocampal Sclerosis Risk Gene Variants Highlight Impact of GRN/PGRN. Exp. Gerontol. 2017, 90, 83–89. [Google Scholar] [CrossRef]
  41. Gaetani, L.; Bellomo, G.; Parnetti, L.; Blennow, K.; Zetterberg, H.; Di Filippo, M. Neuroinflammation and Alzheimer’s Disease: A Machine Learning Approach to CSF Proteomics. Cells 2021, 10, 1930. [Google Scholar] [CrossRef]
  42. Spellman, D.S.; Wildsmith, K.R.; Honigberg, L.A.; Tuefferd, M.; Baker, D.; Raghavan, N.; Nairn, A.C.; Croteau, P.; Schirm, M.; Allard, R.; et al. Development and Evaluation of a Multiplexed Mass Spectrometry Based Assay for Measuring Candidate Peptide Biomarkers in Alzheimer’s Disease Neuroimaging Initiative (ADNI) CSF. Proteom. Clin. Appl. 2015, 9, 715–731. [Google Scholar] [CrossRef]
  43. Chen, X.; Kopsaftopoulos, F.; Wu, Q.; Ren, H.; Chang, F.-K. Flight State Identification of a Self-Sensing Wing via an Improved Feature Selection Method and Machine Learning Approaches. Sensors 2018, 18, 1379. [Google Scholar] [CrossRef]
  44. Raihan-Al-Masud, M.; Mondal, M.R.H. Data-Driven Diagnosis of Spinal Abnormalities Using Feature Selection and Machine Learning Algorithms. PLoS ONE 2020, 15, e0228422. [Google Scholar] [CrossRef] [PubMed]
  45. Awan, S.E.; Bennamoun, M.; Sohel, F.; Sanfilippo, F.M.; Chow, B.J.; Dwivedi, G. Feature Selection and Transformation by Machine Learning Reduce Variable Numbers and Improve Prediction for Heart Failure Readmission or Death. PLoS ONE 2019, 14, e0218760. [Google Scholar] [CrossRef] [PubMed]
  46. Cai, J.; Luo, J.; Wang, S.; Yang, S. Feature Selection in Machine Learning: A New Perspective. Neurocomputing 2018, 300, 70–79. [Google Scholar] [CrossRef]
  47. Cömert, Z.; Şengür, A.; Budak, Ü.; Kocamaz, A.F. Prediction of Intrapartum Fetal Hypoxia Considering Feature Selection Algorithms and Machine Learning Models. Health Inf. Sci. Syst. 2019, 7, 17. [Google Scholar] [CrossRef]
  48. Candel, A.; LeDell, E.; Bartz, A. Deep Learning with H2O; H2O.Ai, Inc.: Mountain View, CA, USA, 2021. [Google Scholar]
  49. Friedman, J.; Hastie, T.; Tibshirani, R. Regularization Paths for Generalized Linear Models via Coordinate Descent. J. Stat. Softw. 2010, 33, 1–22. [Google Scholar] [CrossRef] [PubMed]
  50. Lunardon, N.; Menardi, G.; Torelli, N. ROSE: A Package for Binary Imbalanced Learning. R. J. 2014, 6, 79. [Google Scholar] [CrossRef]
  51. Pillai, J.A.; Bena, J.; Bebek, G.; Bekris, L.M.; Bonner-Jackson, A.; Kou, L.; Pai, A.; Sørensen, L.; Neilsen, M.; Rao, S.M.; et al. Inflammatory Pathway Analytes Predicting Rapid Cognitive Decline in MCI Stage of Alzheimer’s Disease. Ann. Clin. Transl. Neurol. 2020, 7, 1225–1239. [Google Scholar] [CrossRef]
  52. Milenkovic, D.; Nuthikattu, S.; Norman, J.E.; Villablanca, A.C. Global Genomic Profile of Hippocampal Endothelial Cells by Single Nuclei RNA Sequencing in Female Diabetic Mice Is Associated with Cognitive Dysfunction. Am. J. Physiol. Heart Circ. Physiol. 2024, 327, H908–H926. [Google Scholar] [CrossRef] [PubMed]
  53. Zhou, Y.; Ju, H.; Hu, Y.; Li, T.; Chen, Z.; Si, Y.; Sun, X.; Shi, Y.; Fang, H. Tregs Dysfunction Aggravates Postoperative Cognitive Impairment in Aged Mice. J. Neuroinflamm. 2023, 20, 75. [Google Scholar] [CrossRef]
  54. Muraoka, S.; DeLeo, A.M.; Sethi, M.K.; Yukawa-Takamatsu, K.; Yang, Z.; Ko, J.; Hogan, J.D.; Ruan, Z.; You, Y.; Wang, Y.; et al. Proteomic and Biological Profiling of Extracellular Vesicles from Alzheimer’s Disease Human Brain Tissues. Alzheimer’s Dement. 2020, 16, 896–907. [Google Scholar] [CrossRef]
  55. Wang, D.; Greenwood, P.; Klein, M.S. Deep Learning for Rapid Identification of Microbes Using Metabolomics Profiles. Metabolites 2021, 11, 863. [Google Scholar] [CrossRef] [PubMed]
  56. Alotaibi, N.S.; Sayed Ahmed, H.I.; Kamel, S.O.M.; ElKabbany, G.F. Secure Enhancement for MQTT Protocol Using Distributed Machine Learning Framework. Sensors 2024, 24, 1638. [Google Scholar] [CrossRef]
  57. Cui, Y.; Shi, X.; Wang, S.; Qin, Y.; Wang, B.; Che, X.; Lei, M. Machine Learning Approaches for Prediction of Early Death among Lung Cancer Patients with Bone Metastases Using Routine Clinical Characteristics: An Analysis of 19,887 Patients. Front. Public Health 2022, 10, 1019168. [Google Scholar] [CrossRef]
  58. Kong, D.; Tao, Y.; Xiao, H.; Xiong, H.; Wei, W.; Cai, M. Predicting Preterm Birth Using Auto-ML Frameworks: A Large Observational Study Using Electronic Inpatient Discharge Data. Front. Pediatr. 2024, 12, 1330420. [Google Scholar] [CrossRef] [PubMed]
  59. Liu, L.; Lin, J.; Liu, L.; Gao, J.; Xu, G.; Yin, M.; Liu, X.; Wu, A.; Zhu, J. Automated Machine Learning Models for Nonalcoholic Fatty Liver Disease Assessed by Controlled Attenuation Parameter from the NHANES 2017–2020. Digit. Health 2024, 10, 20552076241272535. [Google Scholar] [CrossRef]
  60. Ma, H.; Huang, S.; Li, F.; Pang, Z.; Luo, J.; Sun, D.; Liu, J.; Chen, Z.; Qu, J.; Qu, Q. Development and Validation of an Automatic Machine Learning Model to Predict Abnormal Increase of Transaminase in Valproic Acid-Treated Epilepsy. Arch. Toxicol. 2024, 98, 3049–3061. [Google Scholar] [CrossRef]
  61. Ma, J.; Jiang, S.; Liu, Z.; Ren, Z.; Lei, D.; Tan, C.; Guo, H. Machine Learning Models for Slope Stability Classification of Circular Mode Failure: An Updated Database and Automated Machine Learning (AutoML) Approach. Sensors 2022, 22, 9166. [Google Scholar] [CrossRef]
  62. Narkhede, S.M.; Luther, L.; Raugh, I.M.; Knippenberg, A.R.; Esfahlani, F.Z.; Sayama, H.; Cohen, A.S.; Kirkpatrick, B.; Strauss, G.P. Machine Learning Identifies Digital Phenotyping Measures Most Relevant to Negative Symptoms in Psychotic Disorders: Implications for Clinical Trials. Schizophr. Bull. 2022, 48, 425–436. [Google Scholar] [CrossRef] [PubMed]
  63. Szlęk, J.; Khalid, M.H.; Pacławski, A.; Czub, N.; Mendyk, A. Puzzle out Machine Learning Model-Explaining Disintegration Process in ODTs. Pharmaceutics 2022, 14, 859. [Google Scholar] [CrossRef]
  64. Wang, Y.; Hong, Y.; Wang, Y.; Zhou, X.; Gao, X.; Yu, C.; Lin, J.; Liu, L.; Gao, J.; Yin, M.; et al. Automated Multimodal Machine Learning for Esophageal Variceal Bleeding Prediction Based on Endoscopy and Structured Data. J. Digit. Imaging 2022, 36, 326–338. [Google Scholar] [CrossRef] [PubMed]
  65. Yu, C.; Li, Y.; Yin, M.; Gao, J.; Xi, L.; Lin, J.; Liu, L.; Zhang, H.; Wu, A.; Xu, C.; et al. Automated Machine Learning in Predicting 30-Day Mortality in Patients with Non-Cholestatic Cirrhosis. J. Pers. Med. 2022, 12, 1930. [Google Scholar] [CrossRef]
  66. Alakwaa, F.M.; Chaudhary, K.; Garmire, L.X. Deep Learning Accurately Predicts Estrogen Receptor Status in Breast Cancer Metabolomics Data. J. Proteome Res. 2018, 17, 337–347. [Google Scholar] [CrossRef]
  67. Wei, Z.; Han, D.; Zhang, C.; Wang, S.; Liu, J.; Chao, F.; Song, Z.; Chen, G. Deep Learning-Based Multi-Omics Integration Robustly Predicts Relapse in Prostate Cancer. Front. Oncol. 2022, 12, 893424. [Google Scholar] [CrossRef] [PubMed]
  68. Yin, M.; Xu, C.; Zhu, J.; Xue, Y.; Zhou, Y.; He, Y.; Lin, J.; Liu, L.; Gao, J.; Liu, X.; et al. Automated Machine Learning for the Identification of Asymptomatic COVID-19 Carriers Based on Chest CT Images. BMC Med. Imaging 2024, 24, 50. [Google Scholar] [CrossRef]
  69. Wang, K.; Theeke, L.A.; Liao, C.; Wang, N.; Lu, Y.; Xiao, D.; Xu, C. Deep Learning Analysis of UPLC-MS/MS-Based Metabolomics Data to Predict Alzheimer’s Disease. J. Neurol. Sci. 2023, 453, 120812. [Google Scholar] [CrossRef]
  70. Morgan, S.L.; Naderi, P.; Koler, K.; Pita-Juarez, Y.; Prokopenko, D.; Vlachos, I.S.; Tanzi, R.E.; Bertram, L.; Hide, W.A. Most Pathways Can Be Related to the Pathogenesis of Alzheimer’s Disease. Front. Aging Neurosci. 2022, 14, 846902. [Google Scholar] [CrossRef]
  71. Yang, Z.; Wang, J.; Chen, J.; Luo, M.; Xie, Q.; Rong, Y.; Wu, Y.; Cao, Z.; Liu, Y. High-Resolution NMR Metabolomics of Patients with Subjective Cognitive Decline plus: Perturbations in the Metabolism of Glucose and Branched-Chain Amino Acids. Neurobiol. Dis. 2022, 171, 105782. [Google Scholar] [CrossRef]
  72. Hao, L.; Wang, J.; Page, D.; Asthana, S.; Zetterberg, H.; Carlsson, C.; Okonkwo, O.C.; Li, L. Comparative Evaluation of MS-Based Metabolomics Software and Its Application to Preclinical Alzheimer’s Disease. Sci. Rep. 2018, 8, 9291. [Google Scholar] [CrossRef] [PubMed]
  73. Ling, J.; Yang, S.; Huang, Y.; Wei, D.; Cheng, W. Identifying Key Genes, Pathways and Screening Therapeutic Agents for Manganese-Induced Alzheimer Disease Using Bioinformatics Analysis. Medicine 2018, 97, e10775. [Google Scholar] [CrossRef] [PubMed]
  74. Varma, V.R.; Oommen, A.M.; Varma, S.; Casanova, R.; An, Y.; Andrews, R.M.; O’Brien, R.; Pletnikova, O.; Troncoso, J.C.; Toledo, J.; et al. Brain and Blood Metabolite Signatures of Pathology and Progression in Alzheimer Disease: A Targeted Metabolomics Study. PLoS Med. 2018, 15, e1002482. [Google Scholar] [CrossRef] [PubMed]
  75. Wang, J.; Wei, R.; Xie, G.; Arnold, M.; Kueider-Paisley, A.; Louie, G.; Mahmoudian Dehkordi, S.; Blach, C.; Baillie, R.; Han, X.; et al. Peripheral Serum Metabolomic Profiles Inform Central Cognitive Impairment. Sci. Rep. 2020, 10, 14059. [Google Scholar] [CrossRef]
  76. Calabrò, M.; Rinaldi, C.; Santoro, G.; Crisafulli, C. Department of Biomedical and Dental Sciences and Morphofunctional Imaging, University of Messina, Italy The Biological Pathways of Alzheimer Disease: A Review. AIMS Neurosci. 2021, 8, 86–132. [Google Scholar] [CrossRef]
  77. Lai, Y.; Lin, P.; Lin, F.; Chen, M.; Lin, C.; Lin, X.; Wu, L.; Zheng, M.; Chen, J. Identification of Immune Microenvironment Subtypes and Signature Genes for Alzheimer’s Disease Diagnosis and Risk Prediction Based on Explainable Machine Learning. Front. Immunol. 2022, 13, 1046410. [Google Scholar] [CrossRef] [PubMed]
  78. Cai, H.; Pang, Y.; Wang, Q.; Qin, W.; Wei, C.; Li, Y.; Li, T.; Li, F.; Wang, Q.; Li, Y.; et al. Proteomic Profiling of Circulating Plasma Exosomes Reveals Novel Biomarkers of Alzheimer’s Disease. Alzheimers Res. Ther. 2022, 14, 181. [Google Scholar] [CrossRef]
  79. Karaglani, M.; Gourlia, K.; Tsamardinos, I.; Chatzaki, E. Accurate Blood-Based Diagnostic Biosignatures for Alzheimer’s Disease via Automated Machine Learning. J. Clin. Med. 2020, 9, 3016. [Google Scholar] [CrossRef]
  80. Hällqvist, J.; Pinto, R.C.; Heywood, W.E.; Cordey, J.; Foulkes, A.J.M.; Slattery, C.F.; Leckey, C.A.; Murphy, E.C.; Zetterberg, H.; Schott, J.M.; et al. A Multiplexed Urinary Biomarker Panel Has Potential for Alzheimer’s Disease Diagnosis Using Targeted Proteomics and Machine Learning. Int. J. Mol. Sci. 2023, 24, 13758. [Google Scholar] [CrossRef]
  81. Agarwal, M.; Khan, S. Plasma Lipids as Biomarkers for Alzheimer’s Disease: A Systematic Review. Cureus 2020, 12, e12008. [Google Scholar] [CrossRef]
  82. Couttas, T.A.; Kain, N.; Tran, C.; Chatterton, Z.; Kwok, J.B.; Don, A.S. Age-Dependent Changes to Sphingolipid Balance in the Human Hippocampus Are Gender-Specific and May Sensitize to Neurodegeneration. J. Alzheimer’s Dis. 2018, 63, 503–514. [Google Scholar] [CrossRef]
  83. Zhang, F.; Petersen, M.; Johnson, L.; Hall, J.; O’Bryant, S.E. Combination of Serum and Plasma Biomarkers Could Improve Prediction Performance for Alzheimer’s Disease. Genes 2022, 13, 1738. [Google Scholar] [CrossRef]
  84. Klee, M.; Aho, V.T.E.; May, P.; Heintz-Buschart, A.; Landoulsi, Z.; Jónsdóttir, S.R.; Pauly, C.; Pavelka, L.; Delacour, L.; Kaysen, A.; et al. Education as Risk Factor of Mild Cognitive Impairment: The Link to the Gut Microbiome. J. Prev. Alzheimer’s Dis. 2024, 11, 759–768. [Google Scholar] [CrossRef] [PubMed]
  85. Arévalo-Caro, C.; López, D.; Sánchez Milán, J.A.; Lorca, C.; Mulet, M.; Arboleda, H.; Losada Amaya, S.; Serra, A.; Gallart-Palau, X. Periodontal Indices as Predictors of Cognitive Decline: Insights from the PerioMind Colombia Cohort. Biomedicines 2025, 13, 205. [Google Scholar] [CrossRef] [PubMed]
  86. Al-Amrani, S.; Al-Jabri, Z.; Al-Zaabi, A.; Alshekaili, J.; Al-Khabori, M. Proteomics: Concepts and Applications in Human Medicine. World J. Biol. Chem. 2021, 12, 57–69. [Google Scholar] [CrossRef] [PubMed]
  87. Birhanu, A.G. Mass Spectrometry-Based Proteomics as an Emerging Tool in Clinical Laboratories. Clin. Proteom. 2023, 20, 32. [Google Scholar] [CrossRef]
  88. Dupree, E.J.; Jayathirtha, M.; Yorkey, H.; Mihasan, M.; Petre, B.A.; Darie, C.C. A Critical Review of Bottom-Up Proteomics: The Good, the Bad, and the Future of This Field. Proteomes 2020, 8, 14. [Google Scholar] [CrossRef]
  89. Jain, A.P.; Sathe, G. Proteomics Landscape of Alzheimer’s Disease. Proteomes 2021, 9, 13. [Google Scholar] [CrossRef]
  90. Weiner, S.; Blennow, K.; Zetterberg, H.; Gobom, J. Next-Generation Proteomics Technologies in Alzheimer’s Disease: From Clinical Research to Routine Diagnostics. Expert. Rev. Proteom. 2023, 20, 143–150. [Google Scholar] [CrossRef]
  91. François, M.; Karpe, A.V.; Liu, J.-W.; Beale, D.J.; Hor, M.; Hecker, J.; Faunt, J.; Maddison, J.; Johns, S.; Doecke, J.D.; et al. Multi-Omics, an Integrated Approach to Identify Novel Blood Biomarkers of Alzheimer’s Disease. Metabolites 2022, 12, 949. [Google Scholar] [CrossRef]
  92. Vacher, M.; Canovas, R.; Laws, S.M.; Doecke, J.D. A Comprehensive Multi-Omics Analysis Reveals Unique Signatures to Predict Alzheimer’s Disease. Front. Bioinform. 2024, 4, 1390607. [Google Scholar] [CrossRef] [PubMed]
  93. Zhao, H.; Zhou, X.; Song, Y.; Zhao, W.; Sun, Z.; Zhu, J.; Yu, Y. Multi-Omics Analyses Identify Gut Microbiota-Fecal Metabolites-Brain-Cognition Pathways in the Alzheimer’s Disease Continuum. Alz. Res. Ther. 2025, 17, 36. [Google Scholar] [CrossRef] [PubMed]
  94. Kodam, P.; Sai Swaroop, R.; Pradhan, S.S.; Sivaramakrishnan, V.; Vadrevu, R. Integrated Multi-Omics Analysis of Alzheimer’s Disease Shows Molecular Signatures Associated with Disease Progression and Potential Therapeutic Targets. Sci. Rep. 2023, 13, 3695. [Google Scholar] [CrossRef] [PubMed]
  95. Aerqin, Q.; Wang, Z.-T.; Wu, K.-M.; He, X.-Y.; Dong, Q.; Yu, J.-T. Omics-Based Biomarkers Discovery for Alzheimer’s Disease. Cell. Mol. Life Sci. 2022, 79, 585. [Google Scholar] [CrossRef] [PubMed]
  96. Wodzinski, M.; Kwarciak, K.; Daniol, M.; Hemmerling, D. Improving Deep Learning-Based Automatic Cranial Defect Reconstruction by Heavy Data Augmentation: From Image Registration to Latent Diffusion Models. Comput. Biol. Med. 2024, 182, 109129. [Google Scholar] [CrossRef]
  97. Yang, L.; Dong, Q.; Lin, D.; Tian, C.; Lü, X. MUNet: A Novel Framework for Accurate Brain Tumor Segmentation Combining UNet and Mamba Networks. Front. Comput. Neurosci. 2025, 19, 1513059. [Google Scholar] [CrossRef]
  98. Huang, J.; Yang, L.; Wang, F.; Wu, Y.; Nan, Y.; Wu, W.; Wang, C.; Shi, K.; Aviles-Rivero, A.I.; Schönlieb, C.-B.; et al. Enhancing Global Sensitivity and Uncertainty Quantification in Medical Image Reconstruction with Monte Carlo Arbitrary-Masked Mamba. Med. Image Anal. 2025, 99, 103334. [Google Scholar] [CrossRef]
  99. Kang, H.; Park, C.; Yang, H. Evaluation of Denoising Performance of ResNet Deep Learning Model for Ultrasound Images Corresponding to Two Frequency Parameters. Bioengineering 2024, 11, 723. [Google Scholar] [CrossRef]
  100. Zhou, S.; Yao, S.; Shen, T.; Wang, Q. A Novel End-to-End Deep Learning Framework for Chip Packaging Defect Detection. Sensors 2024, 24, 5837. [Google Scholar] [CrossRef]
  101. Zhou, Z.; Liao, X.; Qiu, X.; Zhang, Y.; Dong, J.; Qu, X.; Lin, D. NMRformer: A Transformer-Based Deep Learning Framework for Peak Assignment in 1D 1H NMR Spectroscopy. Anal. Chem. 2025, 97, 904–911. [Google Scholar] [CrossRef]
  102. Wang, S.; Liu, J.; Li, S.; He, P.; Zhou, X.; Zhao, Z.; Zheng, L. ResNet-Transformer Deep Learning Model-aided Detection of Dens Evaginatus. Int. J. Paed. Dent. 2024, ipd.13282, ahead of print. [Google Scholar] [CrossRef]
  103. Habib, A.Z.S.B.; Wang, K.; Hartley, M.-A.; Doretto, G.; Adjeroh, D.A. TabSeq: A Framework for Deep Learning on Tabular Data via Sequential Ordering. arXiv 2024, arXiv:2410.13203. [Google Scholar]
  104. Desikan, R.S.; Fan, C.C.; Wang, Y.; Schork, A.J.; Cabral, H.J.; Cupples, L.A.; Thompson, W.K.; Besser, L.; Kukull, W.A.; Holland, D.; et al. Genetic Assessment of Age-Associated Alzheimer Disease Risk: Development and Validation of a Polygenic Hazard Score. PLoS Med. 2017, 14, e1002258. [Google Scholar] [CrossRef] [PubMed]
  105. Chawla, N.V.; Bowyer, K.W.; Hall, L.O.; Kegelmeyer, W.P. SMOTE: Synthetic Minority Over-Sampling Technique. J. Artif. Intell. Res. 2002, 16, 321–357. [Google Scholar] [CrossRef]
  106. Jainonthee, C.; Sanwisate, P.; Sivapirunthep, P.; Chaosap, C.; Mektrirat, R.; Chadsuthi, S.; Punyapornwithaya, V. Data-Driven Insights into Pre-Slaughter Mortality: Machine Learning for Predicting High Dead on Arrival in Meat-Type Ducks. Poult. Sci. 2025, 104, 104648. [Google Scholar] [CrossRef]
  107. Budhathoki, N.; Bhandari, R.; Bashyal, S.; Lee, C. Predicting Asthma Using Imbalanced Data Modeling Techniques: Evidence from 2019 Michigan BRFSS Data. PLoS ONE 2023, 18, e0295427. [Google Scholar] [CrossRef]
  108. Kuhn, M. Building Predictive Models in R Using the Caret Package. J. Stat. Soft. 2008, 28, 1–26. [Google Scholar] [CrossRef]
  109. Cortes, C.; Vapnik, V. Support-Vector Networks. Mach. Learn. 1995, 20, 273–297. [Google Scholar] [CrossRef]
  110. Chen, W.; Xie, X.; Wang, J.; Pradhan, B.; Hong, H.; Bui, D.T.; Duan, Z.; Ma, J. A Comparative Study of Logistic Model Tree, Random Forest, and Classification and Regression Tree Models for Spatial Prediction of Landslide Susceptibility. CATENA 2017, 151, 147–160. [Google Scholar] [CrossRef]
  111. Kesler, S.R.; Rao, A.; Blayney, D.W.; Oakley-Girvan, I.A.; Karuturi, M.; Palesh, O. Predicting Long-Term Cognitive Outcome Following Breast Cancer with Pre-Treatment Resting State fMRI and Random Forest Machine Learning. Front. Hum. Neurosci. 2017, 11, 555. [Google Scholar] [CrossRef]
  112. Hackenberger, B.K. Bayes or Not Bayes, Is This the Question? Croat. Med. J. 2019, 60, 50–52. [Google Scholar] [CrossRef]
  113. Zhang, Z. Introduction to Machine Learning: K-Nearest Neighbors. Ann. Transl. Med. 2016, 4, 218. [Google Scholar] [CrossRef] [PubMed]
  114. Chen, T.; Guestrin, C. XGBoost: A Scalable Tree Boosting System. In Proceedings of the 22nd ACM SIGKDD International Conference on Knowledge Discovery and Data Mining, San Francisco, CA, USA, 13–17 August 2016; pp. 785–794. [Google Scholar]
  115. Ashburner, M.; Ball, C.A.; Blake, J.A.; Botstein, D.; Butler, H.; Cherry, J.M.; Davis, A.P.; Dolinski, K.; Dwight, S.S.; Eppig, J.T.; et al. Gene Ontology: Tool for the Unification of Biology. Nat. Genet. 2000, 25, 25–29. [Google Scholar] [CrossRef] [PubMed]
  116. Kanehisa, M.; Goto, S.; Furumichi, M.; Tanabe, M.; Hirakawa, M. KEGG for Representation and Analysis of Molecular Networks Involving Diseases and Drugs. Nucleic Acids Res. 2010, 38, D355–D360. [Google Scholar] [CrossRef] [PubMed]
  117. Wickham, H. Ggplot2: Elegant Graphics for Data Analysis, Use R! 2nd ed.; Springer International Publishing: Cham, Switzerland, 2016; ISBN 978-3-319-24277-4. [Google Scholar]
  118. Faul, F.; Erdfelder, E.; Lang, A.-G.; Buchner, A. G*Power 3: A Flexible Statistical Power Analysis Program for the Social, Behavioral, and Biomedical Sciences. Behav. Res. Methods 2007, 39, 175–191. [Google Scholar] [CrossRef] [PubMed]
  119. Faul, F.; Erdfelder, E.; Buchner, A.; Lang, A.-G. Statistical Power Analyses Using G*Power 3.1: Tests for Correlation and Regression Analyses. Behav. Res. Methods 2009, 41, 1149–1160. [Google Scholar] [CrossRef]
Figure 1. The LASSO method selected 35 biomarkers on the optimal parameter ln(λ) = −3.92.
Ijms 26 02428 g001
Figure 2. Variable importance of deep learning model with “Rectifier With Dropout” using 2 hidden layers of 32 proteomic biomarkers.
Ijms 26 02428 g002
Figure 3. AUC curves in the validation data using a deep learning model with an H2O package. H2O. (a) Deep learning model using a Rectifier Activation Function with Dropout, 2 layers, and 32 inputs. (b) Deep learning model using a Tanh Activation Function with Dropout, 3 layers, and 32 inputs. (c) Deep learning model using a Tanh Activation Function with Dropout, 3 layers, and 33 inputs. (d) Deep learning model using a Tanh Activation Function with 2 layers and 32 inputs.
Ijms 26 02428 g003
Figure 4. Pearson correlation heatmap for 39 variables based on Z-scores.
Ijms 26 02428 g004
Figure 5. Functional enrichment analyses using GO and KEGG. Top 10 results for (a) biological processes; (b) molecular functions; (c) cellular components; and (d) the KEGG pathway.
Ijms 26 02428 g005aIjms 26 02428 g005b
Figure 6. Explore the selected KEGG pathway of hsa04060 using the browse KEGG function. This figure shows 10 genes: CXCL13, CD40LG, CCL26, FASLG, CCR4, IL16, IL6R, CXCL9, CCL3, and CCL18.
Ijms 26 02428 g006
Figure 7. Research framework.
Ijms 26 02428 g007
Figure 8. Visualization of the artificial neural network model with four inputs, two hidden layers, and output. Neurons are illustrated by circles. The neurons in the input layer receive values and propagate them to the neurons in the middle layer (“hidden layer”) of the network.
Ijms 26 02428 g008
Table 1. Descriptive statistics.
CNMCI
Variable(Mean ± SD or n)(Mean ± SD or n)t/χ2, p
Age75.2 ± 5.874.3 ± 7.60.98, 0.3269
Gender (n)
  Male291214.52, 0.0334
  Female2861
Education15.6 ± 2.715.8 ± 3.0−0.55, 0.5796
APOE-ε4 allele
  0528435.96, <0.0001
  1+598
PHS−0.49 ± 0.90.51 ± 1.12−6.79, <0.0001
Aβ421452.8 ± 263.4821.2 ± 421.113.49, <0.0001
tTAU225.7 ± 73.1313.0 ± 141.1−6.12, <0.0001
pTAU19.9 ± 6.530.9 ± 15.7−7.70, <0.0001
Abbreviations: CN: cognitive normal; MCI: mild cognitive impairment; PHS: polygenic hazard score; SD: standard deviation. The p-value is based on the Chi-square test or independent samples t-test.
Table 2. Feature selection using Least Absolute Shrinkage and Selection Operator (LASSO).
PackageFeature Selection AlgorithmExtracted Variables
glmnet in RLeast Absolute Shrinkage and Selection Operator (LASSO)35 variables: A1Micro, AACT, AGRP, ANG2, ApoAII, ApoB, ApoD, ApoE, BLC, C3, Calcitonin, CD40L, CgA, CRP, Eotaxin3, FABP, FasL, Haptoglobin, HBELGF, HCC4, HGF, IL16, IL6r, MI, MIP1a, MMP1, NR_CAM, Osteopontin, PAPPA, PARC, PYY, TTotal, Serotransferrin, TTR, vWF
Table 3. Machine learning and comparison of performance.
ModelVariationAccuracySensitivity (Recall)SpecificityPrecisionF1-ScoreAUC
SVMRBF Kernel0.9720.9411.0001.0000.9700.999
LR 0.9580.9410.9730.9700.9550.998
RF 0.9580.9121.0001.0000.9540.998
GBM 0.9720.9411.0001.0000.9700.999
XGBoost 0.9860.9711.0001.0000.9850.997
KNN 0.8450.7650.9190.8970.8260.962
NB 0.9440.8821.0001.0000.9370.982
DNNRectifier-c(35)0.9841.0000.9570.9750.9860.990
Rectifier-c(32,32,32)0.9890.9920.9890.9900.9910.992
Maxout-c(35)0.9600.9570.9730.9630.9560.973
Tanh-c(35)0.9900.9920.9730.9860.9880.995
Tanh-c(32,32)0.9901.0000.9790.9800.9900.995
Rectifier With Dropout-c(35)0.9771.0000.9530.9630.9790.989
Rectifier With Dropout-c(30,30)0.9890.9781.0001.0000.9880.992
Rectifier With Dropout-c(32,32)0.9951.0000.9830.9930.9960.997
Maxout With Dropout-c(35)0.9830.9920.9800.9780.9840.990
Tanh With Dropout-c(35)0.9891.0000.9730.9800.9900.997
Tanh With Dropout-c(34,34)0.9881.0000.9800.9780.9880.996
Tanh With Dropout-c(32,32,32)0.9941.0000.9900.9880.9930.999
Tanh With Dropout-c(33,33,33)0.9941.0000.9900.9880.9930.996
Abbreviations: SVM: support vector machine; RBF: radial basis function; LR: logistic regression; RF: random forest; GBM: gradient boosting machines; XGBoost: Extreme Gradient Augmentation; KNN: k-nearest neighbor; NB: naïve Bayes; DNN: deep neural network; AUC: area under the ROC (receiver operating characteristics) curve.
Table 4. Confusion matrix.
Confusion MatrixPredicted Class
MCICN
Actual classMCITPFN
CNFPTN
TP is the number of true positives—the model correctly predicted an MCI outcome (the actual outcome was MCI), TN is the number of true negatives—the model correctly predicted a CN outcome (the actual outcome was CN), FP is the number of false positives—the model incorrectly predicted an MCI outcome (the actual outcome was CN), and FN is the number of false negatives—the model incorrectly predicted a CN outcome (the actual outcome was MCI).
Disclaimer/Publisher’s Note: The statements, opinions and data contained in all publications are solely those of the individual author(s) and contributor(s) and not of MDPI and/or the editor(s). MDPI and/or the editor(s) disclaim responsibility for any injury to people or property resulting from any ideas, methods, instructions or products referred to in the content.

