Article

Comparative Chloroplast Genomics Reveals Intrageneric Divergence in Salix

School of Ecology and Nature Conservation, Beijing Forestry University, Beijing 100083, China
*
Authors to whom correspondence should be addressed.
Int. J. Mol. Sci. 2025, 26(5), 2248; https://doi.org/10.3390/ijms26052248
Submission received: 6 January 2025 / Revised: 22 February 2025 / Accepted: 27 February 2025 / Published: 3 March 2025
(This article belongs to the Section Molecular Plant Sciences)

Abstract

As the most diverse genus of Salicaceae, Salix is primarily distributed in the temperate zone of the Northern Hemisphere, encompassing 350–500 species worldwide. The genus’s evolutionary history is complex due to significant genetic differentiation. Chloroplast genes, being highly conserved, serve as effective tools for studying uniparental inheritance and evolution. In this study, we sequenced and assembled the chloroplast genomes of five representative Salix species. Phylogenetic relationships were constructed using chloroplast genome data, and structural differences among lineages were compared. These Salix chloroplast genomes exhibited a typical quadripartite structure, with lengths ranging from 154,444 to 155,725 bp. We successfully annotated 131 genes, including 88 protein-coding genes, 35 tRNA genes, and 8 rRNA genes. Clade I showed higher variability in the SSC region, identifying five highly variable regions: petA-psbJ, rps16-rps3, ndhD, ccsA-ndhD, and ndhG-ndhI. Two rapidly evolving genes, ndhI and ycf4, were also identified. The total length of insertions and deletions (InDels) in Clade I was 1046 bp. Clade II exhibited greater variability in the LSC region, with four highly variable regions being identified: trnK-trnQ, ndhC-trnV, trnV, and psdE-petL. Four rapidly evolving genes—infA, rpoC1, rps18, and ycf1—were identified. The total length of InDels in Clade II was 1282 bp. Therefore, this study elucidated the chloroplast genome evolution across different Salix lineages, thereby providing deeper insights into intrageneric phylogenetic relationships.

1. Introduction

Salix, the largest genus in the Salicaceae family, comprises approximately 350 to 500 species worldwide [1]. It is widely distributed across temperate and frigid zones of the Northern Hemisphere. Extensive hybridization and genetic introgression among species have resulted in high genetic diversity and a complex evolutionary history, making Salix an excellent model for studying plant genetic evolution [2,3,4].
Salix classification commonly relies on subgenera and sections. Based on the morphology of American willows, two subgenera—subg. Salix and subg. Vetrix—were initially accepted [5]. Argus conducted a cluster analysis of phenotypic traits and divided 127 New World willow species into four subgenera: subg. Salix, subg. Longifoliae, subg. Chamaetia, and subg. Vetrix. Subsequently, North American Salix was reclassified into five subgenera: Salix, Protitea, Longifoliae, Chamaetia, and Vetrix [6,7]. Advancements in bioinformatics have enabled the study of species evolution using genomic data, providing insights into true evolutionary relationships through molecular systematics [8]. Molecular phylogenetic studies have shown that Salix is monophyletic, forming two distinct lineages with inconsistent internal topology. Wu (2015) analyzed the nuclear ribosomal DNA external transcribed spacer (ETS), the internal transcribed spacer (ITS), and four plastid markers, classifying Salix into two clades: one comprising subgenera Salix, Longifoliae, and Protitea, and the other including subg. Chosenia, Pleuradenia, Chamaetia, and Vetrix. That study also supported the merging of Chamaetia and Vetrix [9]. Zhang (2018) used whole chloroplast genome sequences from 42 Salicaceae species to estimate divergence times, confirming the division of Salix into two main clades: the Chamaetia/Vetrix clade and the Salix clade [10]. Sergey Gulyaev (2022) employed whole-genome resequencing data and classified Salix into two major groups: the paraphyletic Salix grade and the Vetrix clade [11]. These inconsistencies in phylogenetic relationships highlight the complex evolutionary history and high genetic divergence of Salix.
Chloroplast genomes are widely used in genetic evolution studies due to their relatively conserved structure, abundant genetic information, moderate base substitution rate, and distinct differences in molecular evolution rates between coding and non-coding regions [12]. The LSC and SSC regions typically exhibit higher variation because they contain more protein-coding genes and non-coding intergenic sequences, particularly functional genes related to photosynthesis and energy conversion, which are more susceptible to selection pressure [13]. The matK, rbcL, psbA, ndhC, ndhK, and accD genes in the LSC region, along with ndhF, ycf1, and ndhI in the SSC region, have been identified as rapidly evolving chloroplast genes [14,15]. Comparative studies of chloroplast genomes in Salix have shown that sampling methods significantly influence results. For example, an analysis of the chloroplast genome characteristics and interspecific variation of three shrub willow species revealed high similarity in their chloroplast genomes [16]. Another study identified three sand-fixing shrub willow species and found greater variation in non-coding and intergenic regions than in coding regions [17]. Zhou (2021) compared chloroplast genomes from 21 Salix species and identified seven positively selected genes, with different gene types in trees and shrubs [18]. Most research on Salix chloroplast genomes has focused on one or a few species, often using comparative analyses of randomly collected samples. However, this approach does not fully capture variation patterns and evolutionary trends across the genus.
To address this, we developed a comprehensive framework by extensively sampling Salix species and constructing a chloroplast genome-based phylogenetic tree. This tree was then used to examine structural differences among clades, providing deeper insights into Salix evolution from the perspective of maternal inheritance.

2. Results

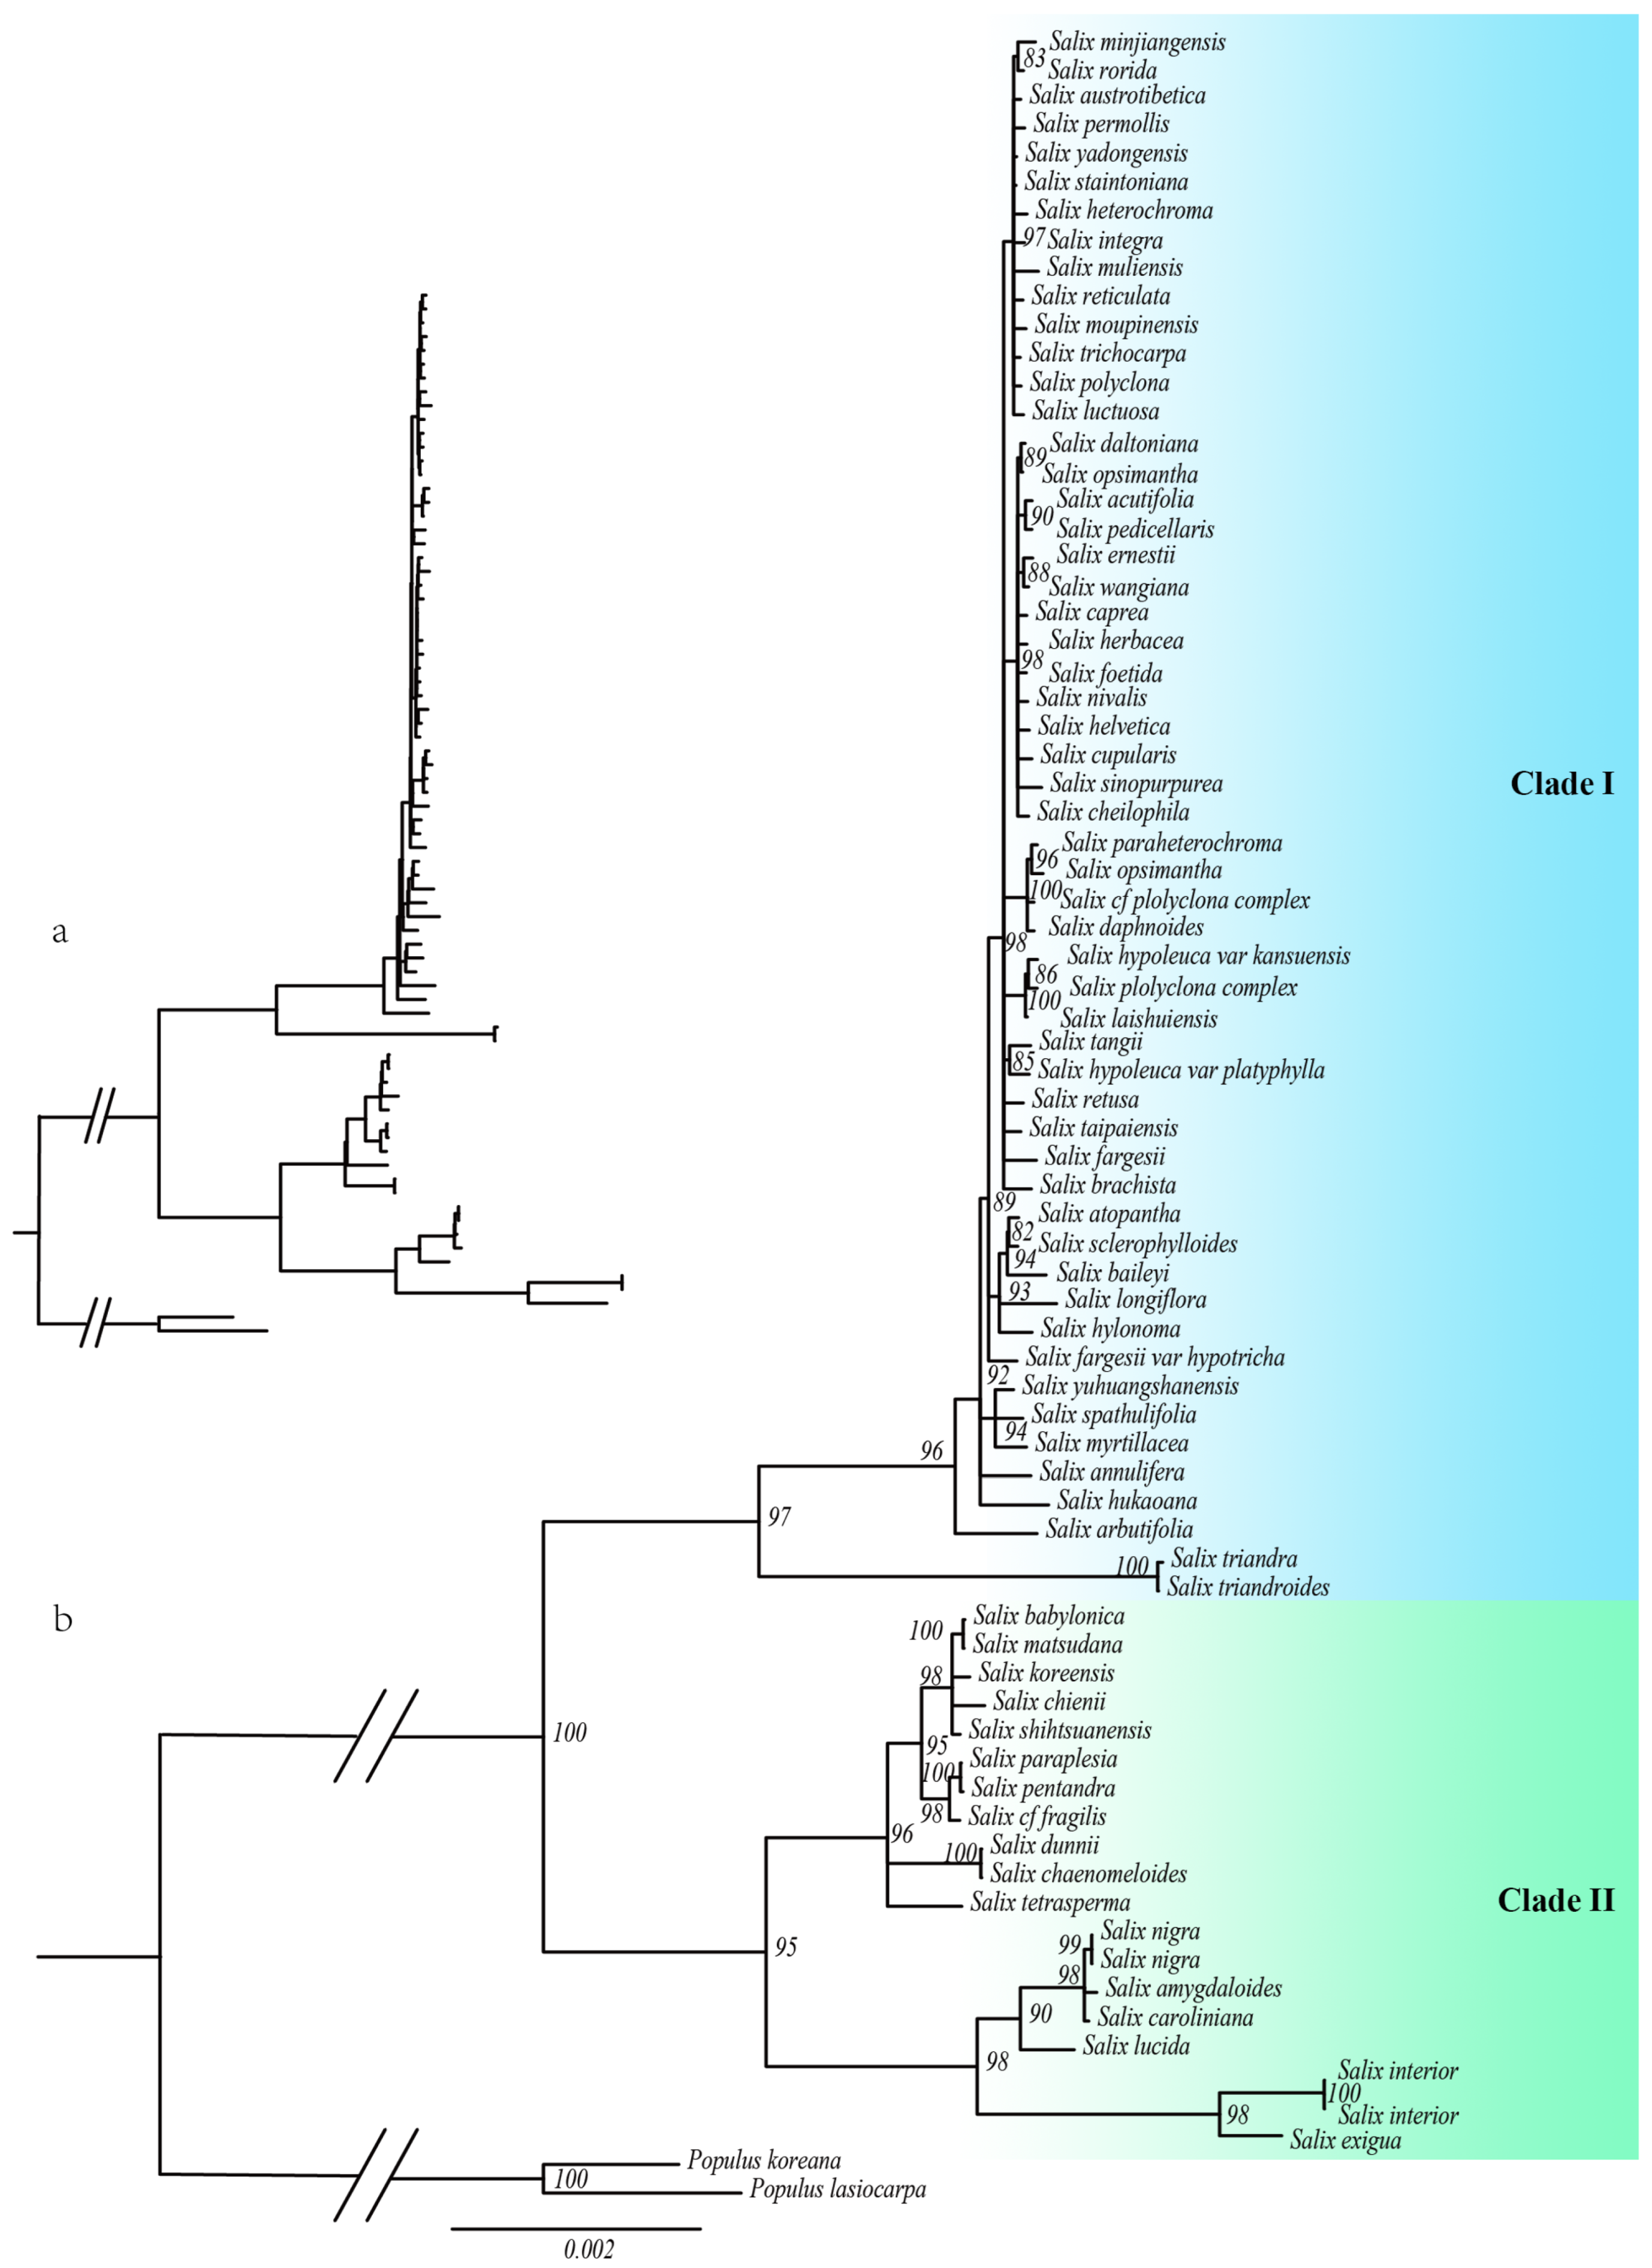
2.1. Phylogenetic Relationships in Salix

Both maximum likelihood (ML) and Bayesian inference (BI) confirmed that Salix is a strongly monophyletic group, although internal branch support was relatively low. This may be due to hybridization and recent radiation in Salix. The phylogenetic tree classified Salix into two main clades, Clade I and Clade II, consistent with previous studies (Figure 1 and Figure 2). Clade I includes species from subg. Chamaetia and subg. Vetrix, while Clade II includes species from subg. Salix, subg. Protitea, and subg. Longifoliae. In Clade I, the ML and BI trees showed notable inconsistencies, whereas the matrilineal genetic relationships in Clade II were well resolved.
The chloroplast phylogeny of Salix varied considerably across lineages, indicating divergent evolutionary trajectories of the chloroplast genome. To investigate these differences, we selected representative species from each lineage for comparative genomic analysis. In Clade I, Salix integra, Salix pedicellaris, Salix opsimantha, Salix laishuiensis, Salix tangii, Salix taipaiensis, Salix longiflora, Salix myrtillacea, Salix arbutifolia, and Salix triandra were analyzed. In Clade II, Salix babylonica, Salix dunnii, Salix tetrasperma, Salix nigra, Salix lucida, and Salix interior were analyzed.

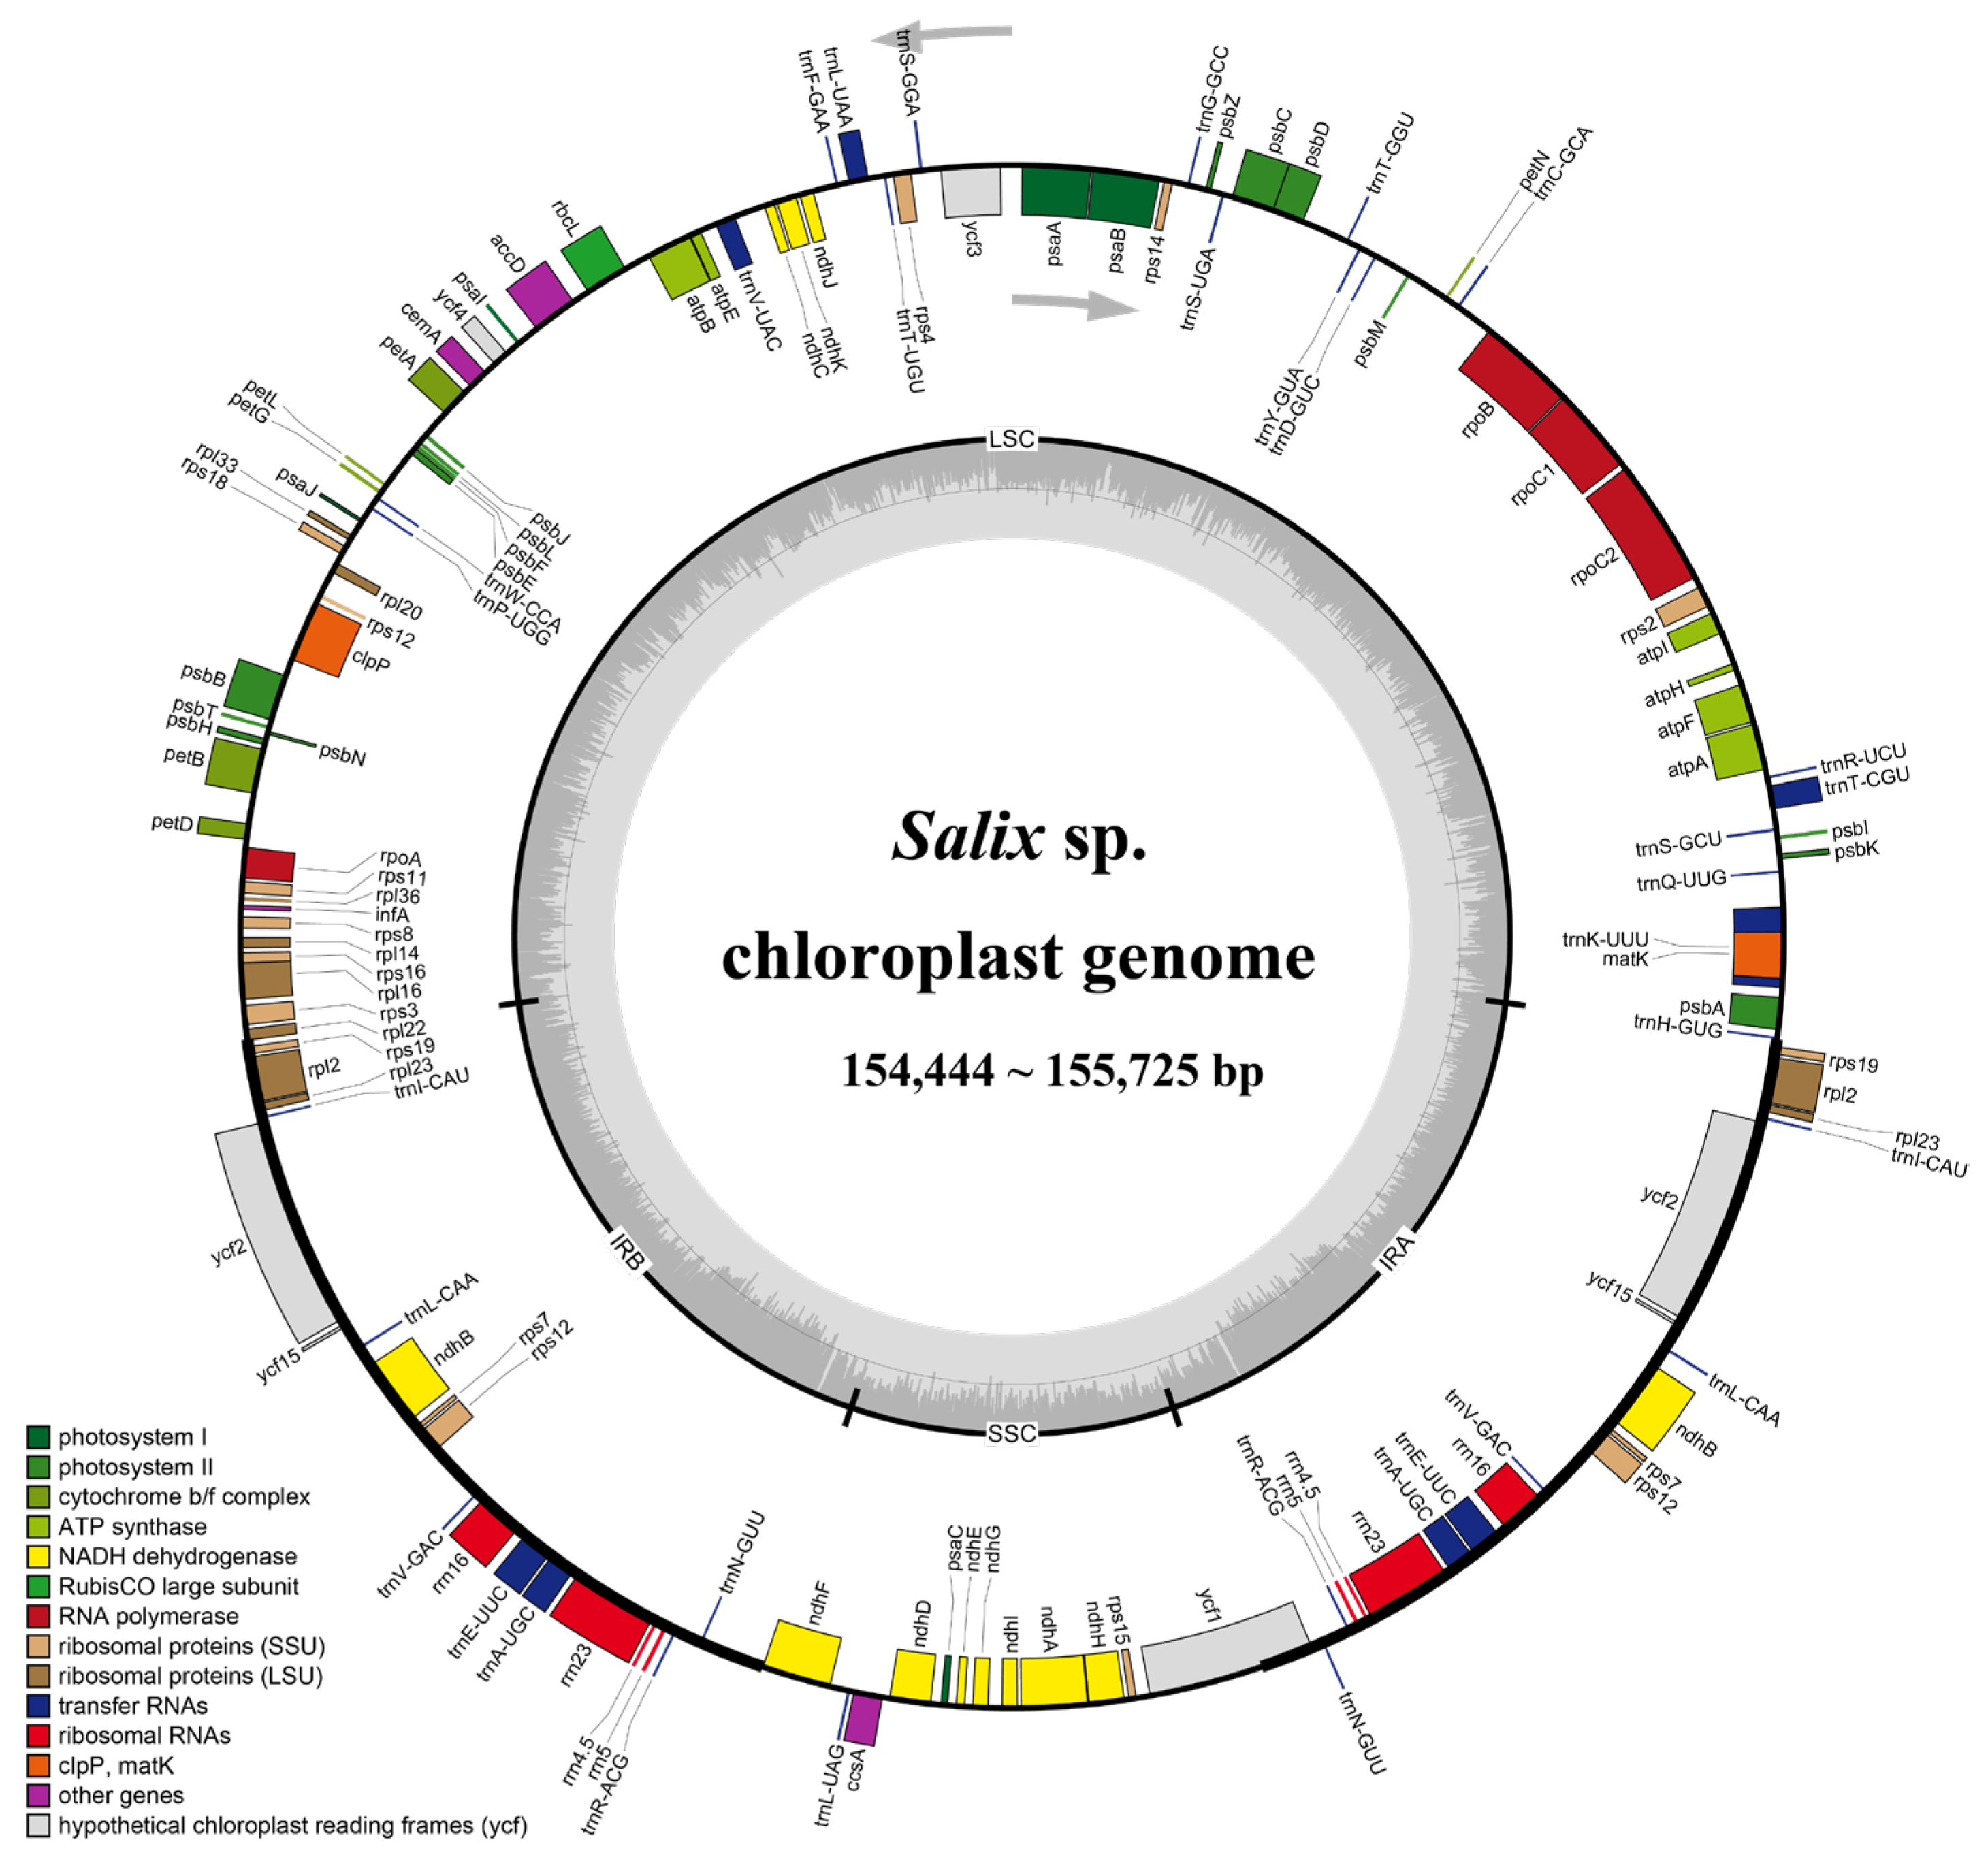
2.2. Chloroplast Genome Features

The chloroplast genomes of 16 Salix species exhibited a typical quadripartite structure, ranging from 154,444 to 155,725 bp in length (Figure 3). A total of 131 genes were annotated across the 16 Salix chloroplast genomes, including 88 protein-coding genes, 35 tRNA genes, and 8 rRNA genes. Detailed information is provided in Table S1. These genes were associated with photosynthesis, replication, and other functions. Notably, 18 genes—7 protein-coding genes (ndhB, rpl2, rpl23, rps12, rps19, rps7, and ycf2), 4 rRNA genes, and 7 tRNA genes—were duplicated in the inverted repeat regions.
When comparing chloroplast genome features between Clade I and Clade II, Clade I genomes ranged from 154,646 to 155,692 bp in size, whereas Clade II genomes exhibited greater variation, ranging from 154,444 to 155,725 bp. This increased variation in Clade II may have resulted from gene deletions, pseudogene formation, or non-coding region expansion across different species or individuals. The predicted GC content of a genome significantly influences genomic function and species ecology, serving as a key indicator of species affinity [19]. In 16 Salix species, chloroplast GC content ranged from 36.64% to 36.78% (Table 1). Although this variation is minimal, it may suggest that Salix species underwent a relatively short or slow evolutionary differentiation process.

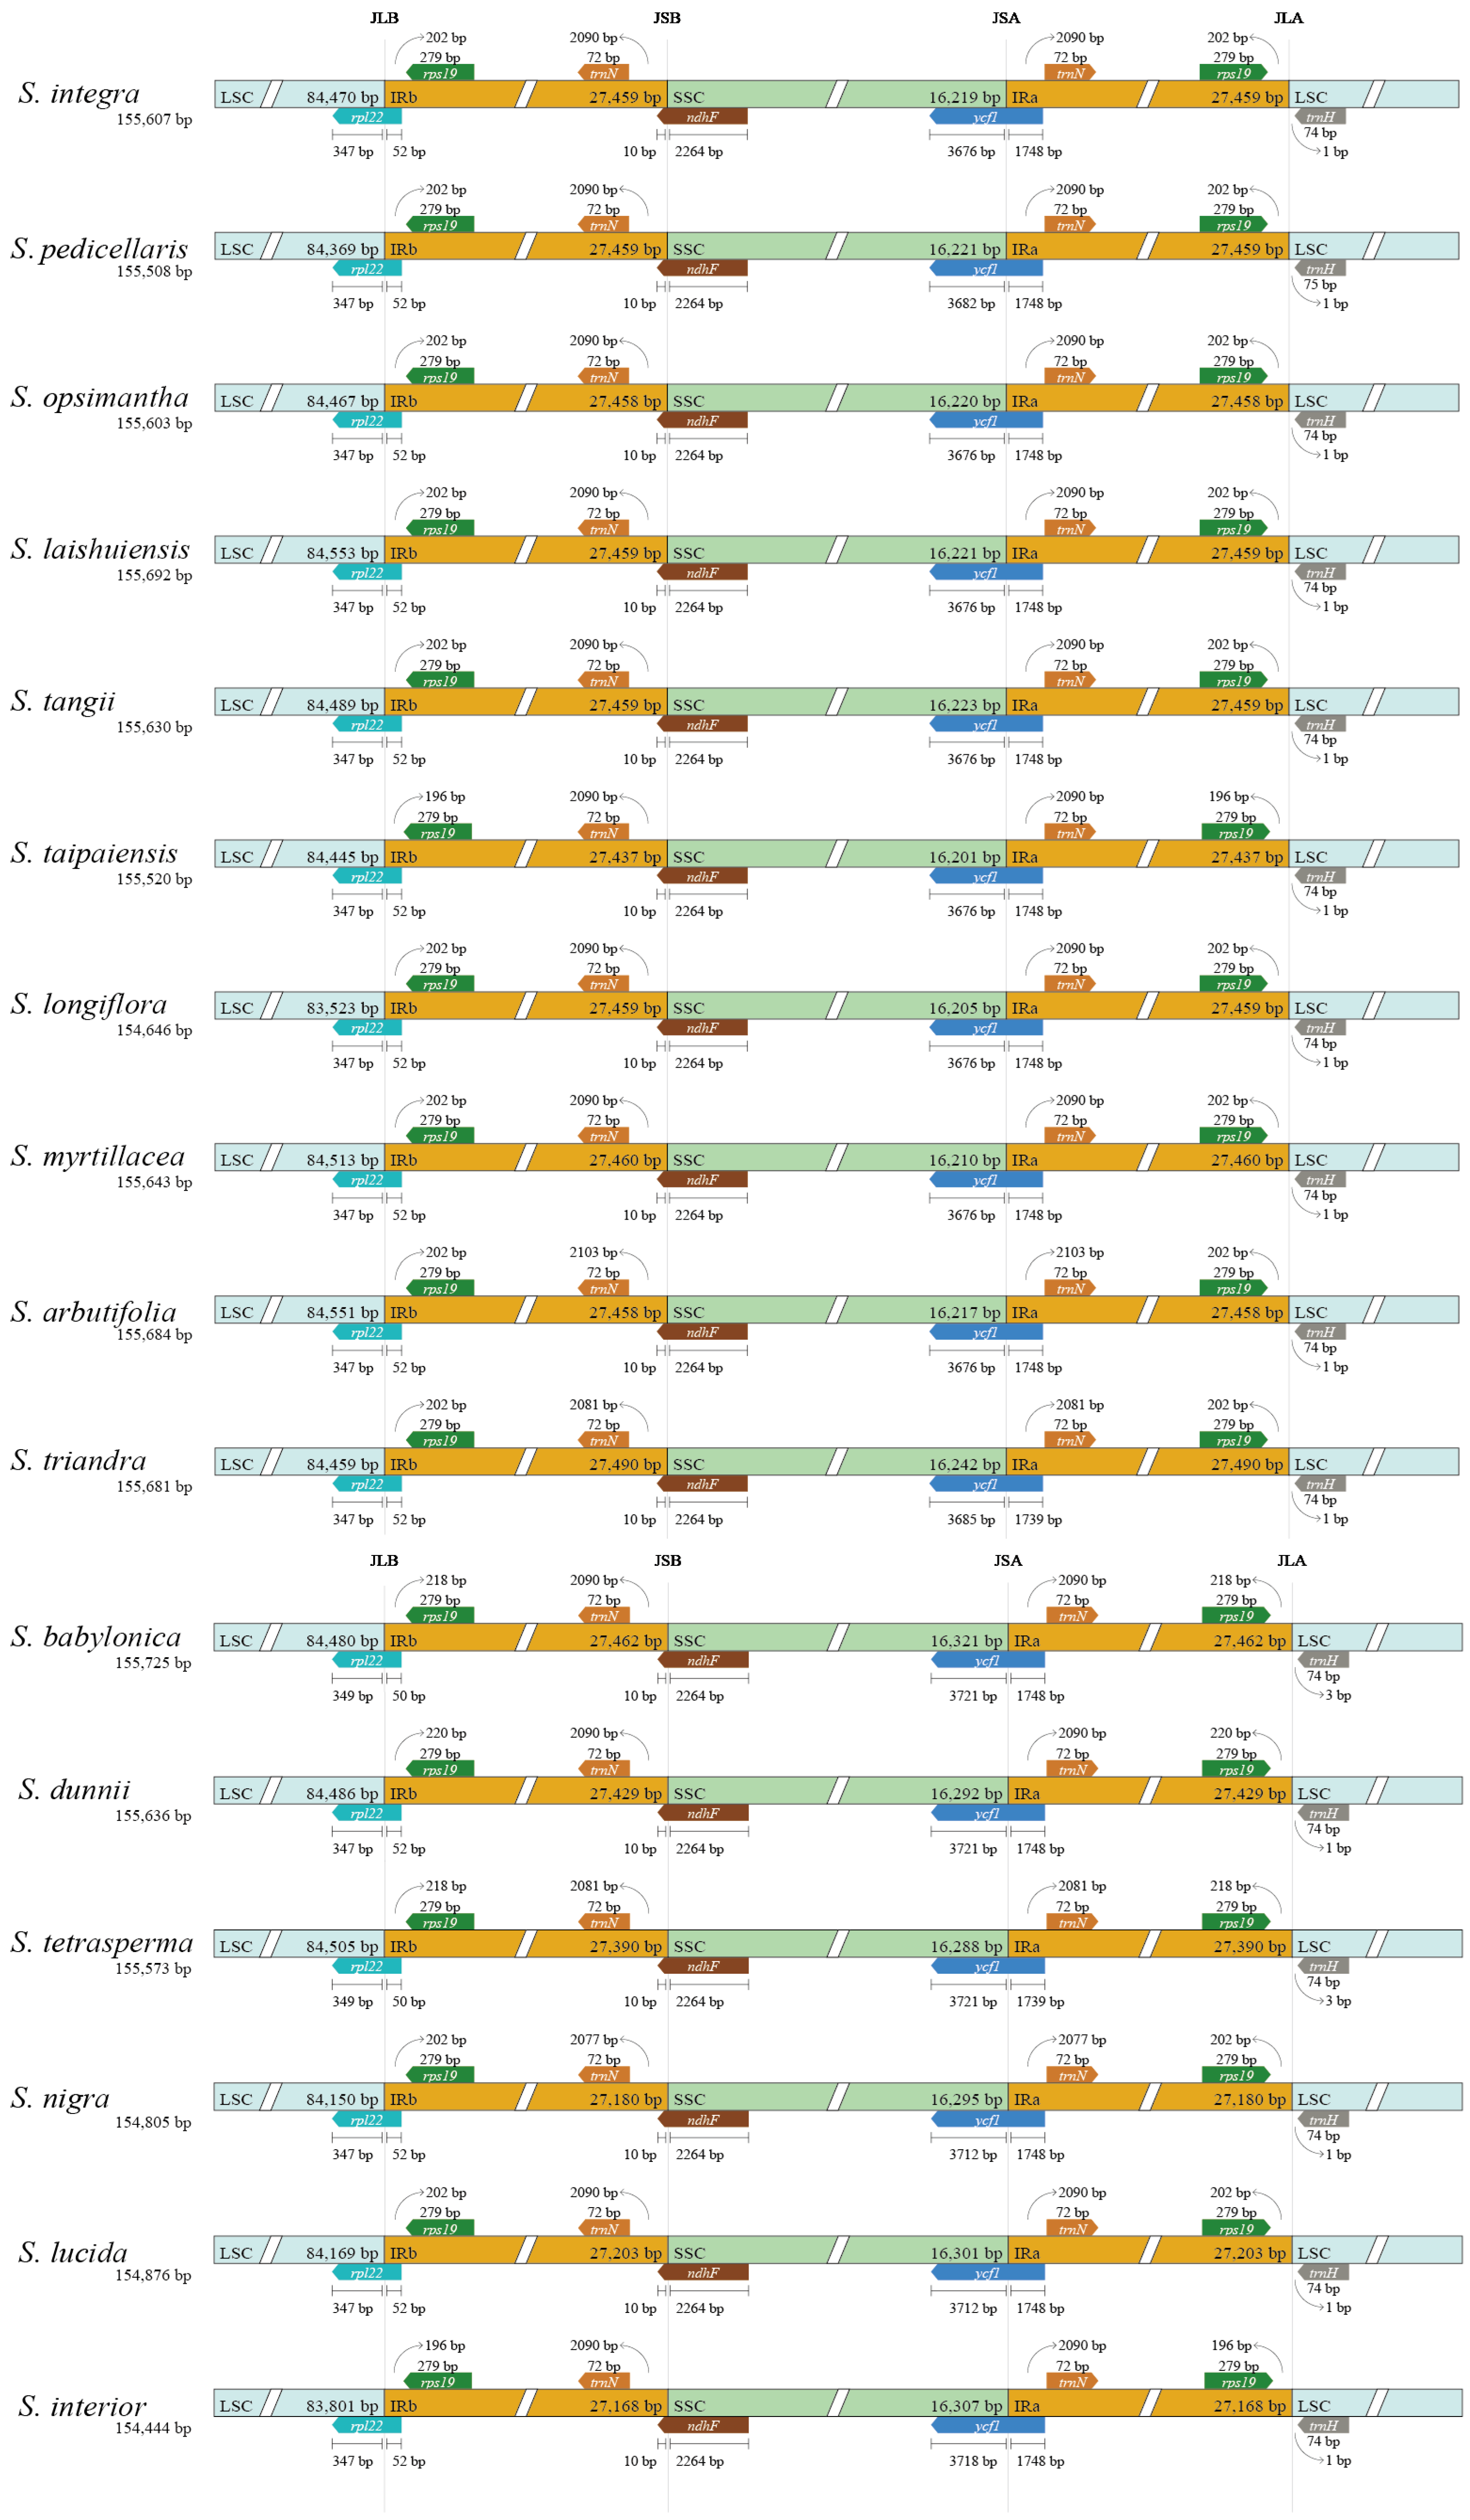
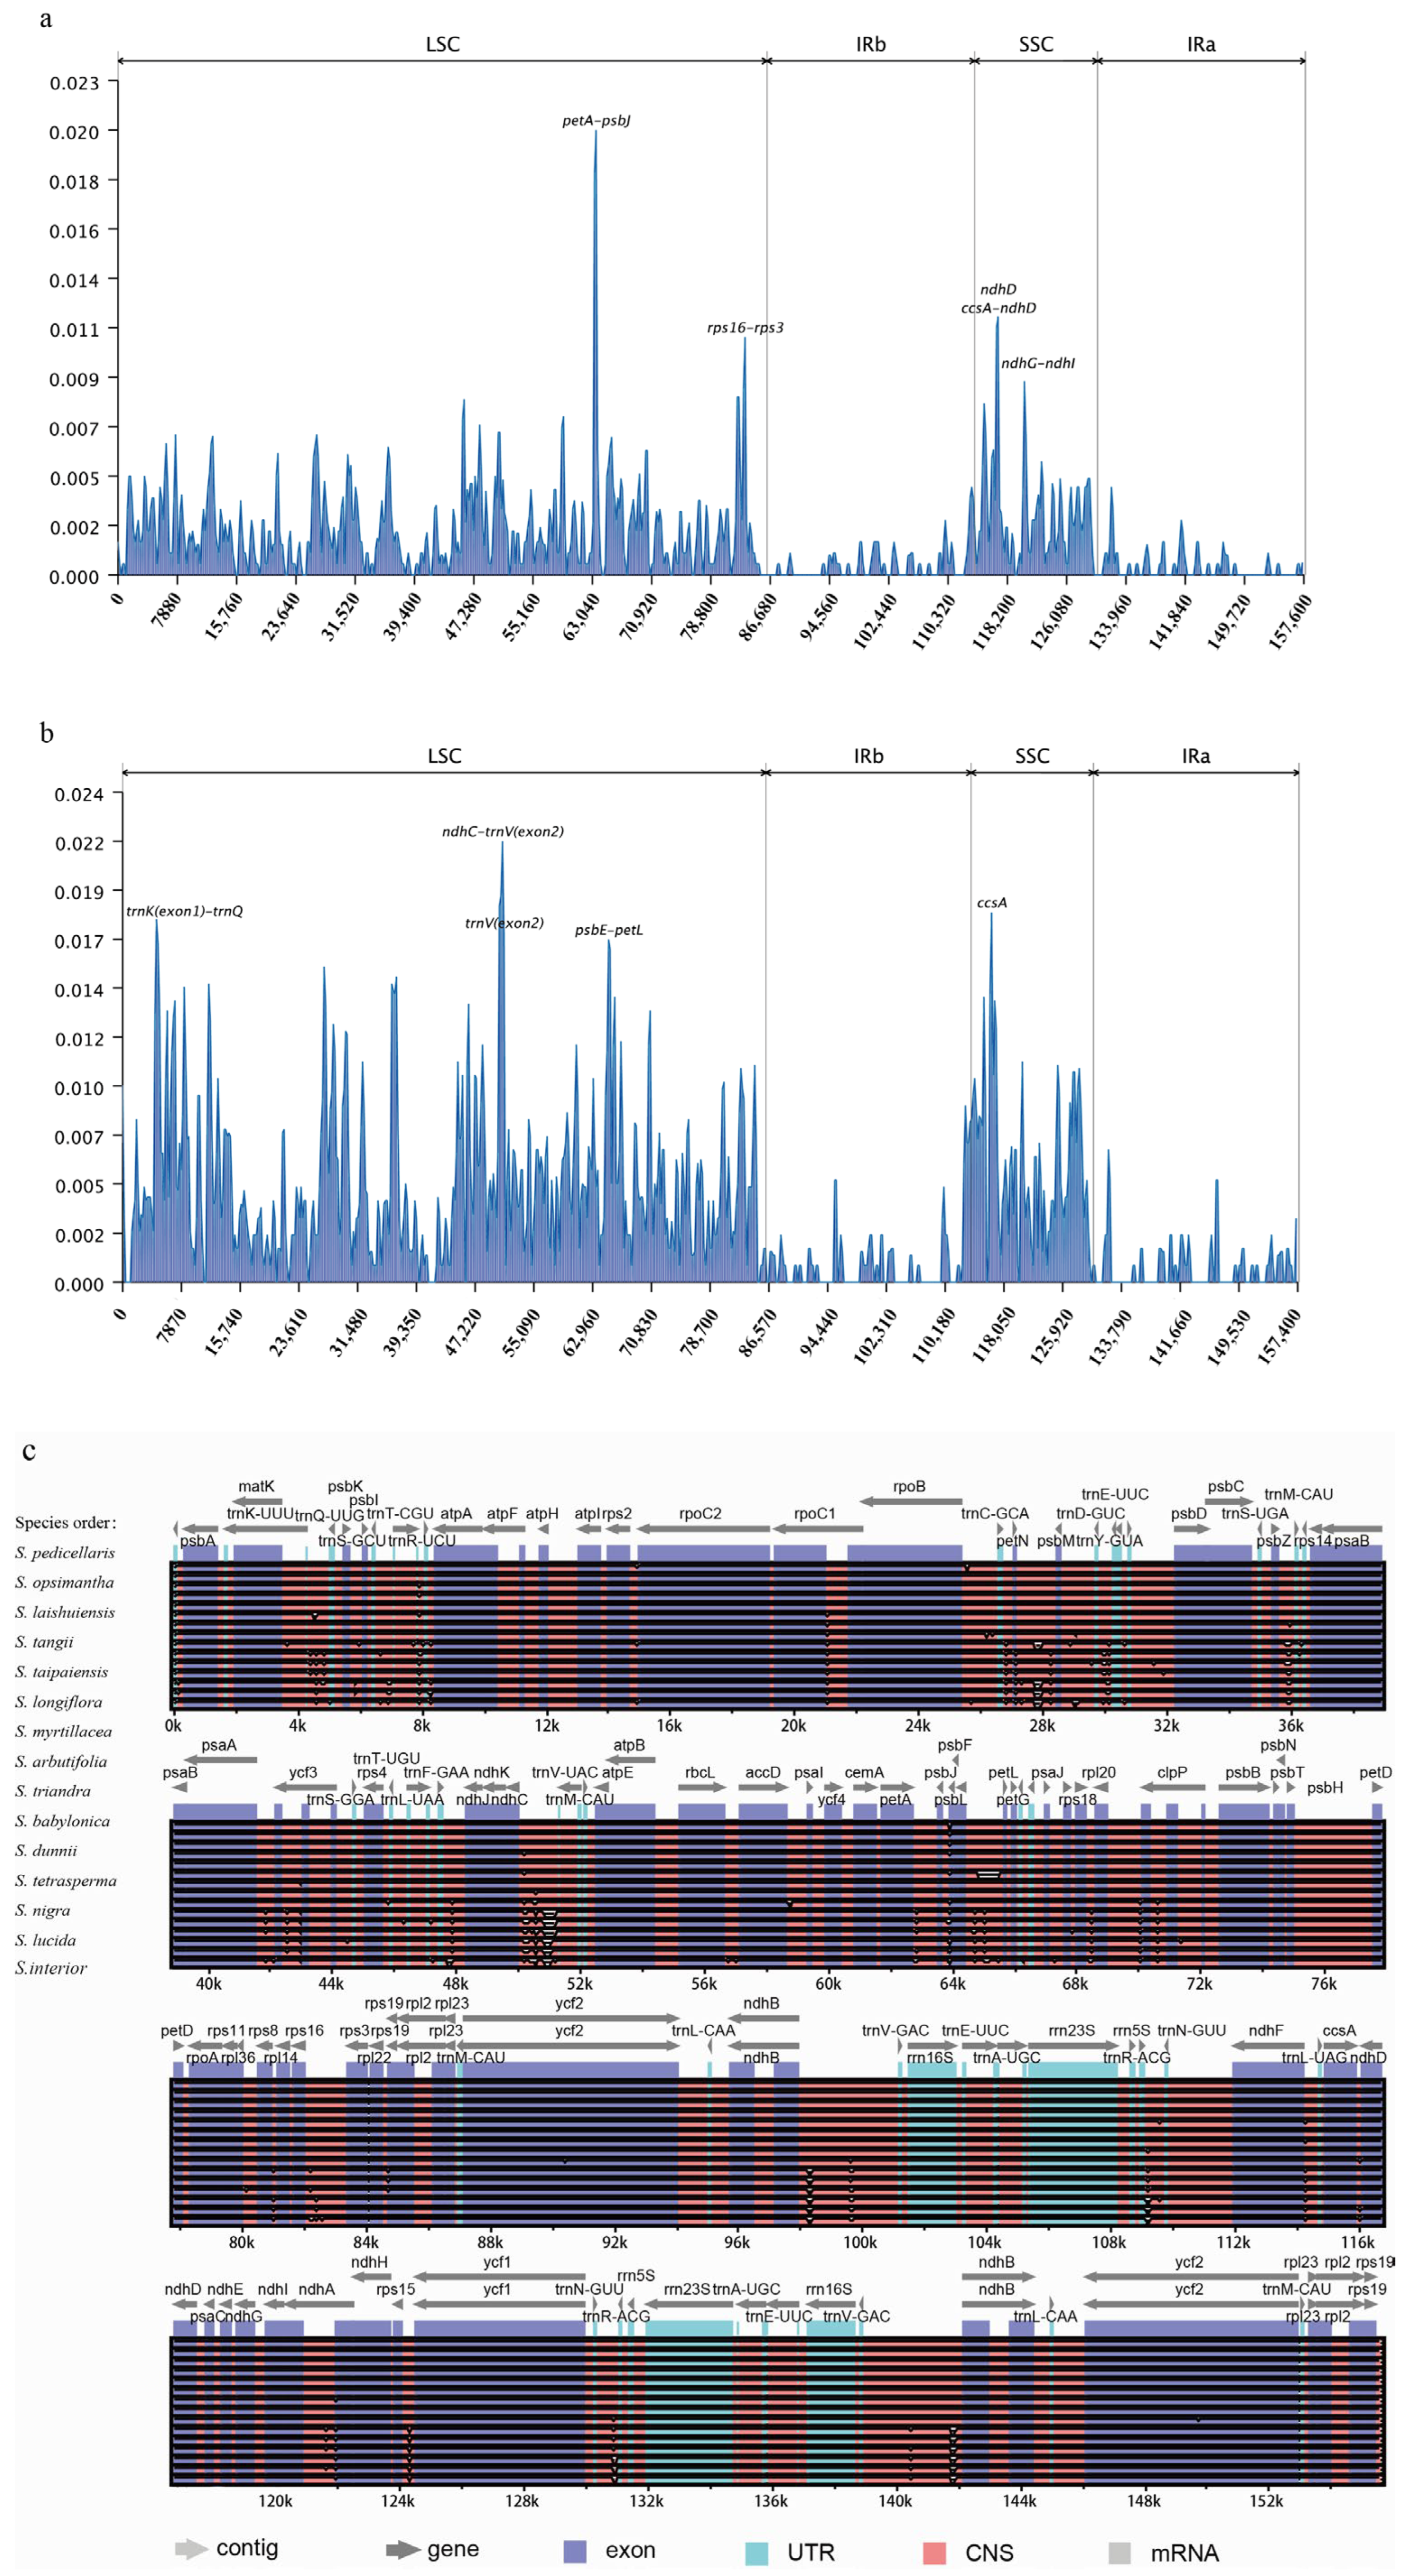
2.3. Comparative Analysis of Salix Chloroplast Genome

Boundary comparisons of the LSC, SSC, and IR regions using IRscope revealed high conservation of gene content at these boundaries, with minimal variation in gene length and positioning among the 16 species. For example, rpl22 and rps19 were consistently located at the LSC/IRb boundary, while trnN and ndhF were found at the IRb/SSC boundary across all genomes analyzed. The SSC/IRa boundary contained ycf1 and trnN, while the IRa/LSC boundary contained rps19 and trnH. Notably, rpl22 at the LSC/IRb boundary exhibited only a 2 bp variation, ycf1 at the SSC/IRa boundary varied by 45 bp, and rps19 at the IRa/LSC boundary differed by 22 bp (Figure 4).
Genomic variability among the 16 sequenced chloroplast genomes was assessed using mVISTA, with Salix integra as the reference. No major genome rearrangements or inversions were detected. Compared with the highly conserved coding regions, non-coding regions (intergenic spacers and introns) exhibited greater variation (Figure 5c). Sliding window analysis using DnaSP v6.0 identified highly variable regions in the SSC region of Clade I, including petA-psbJ, rps16-rps3, ndhD, ccsA-ndhD, and ndhG-ndhI (Figure 5a). In Clade II, greater variation was observed in the LSC region, particularly in trnK-trnQ, ndhC-trnV, trnV, and psbE-petL (Figure 5b).

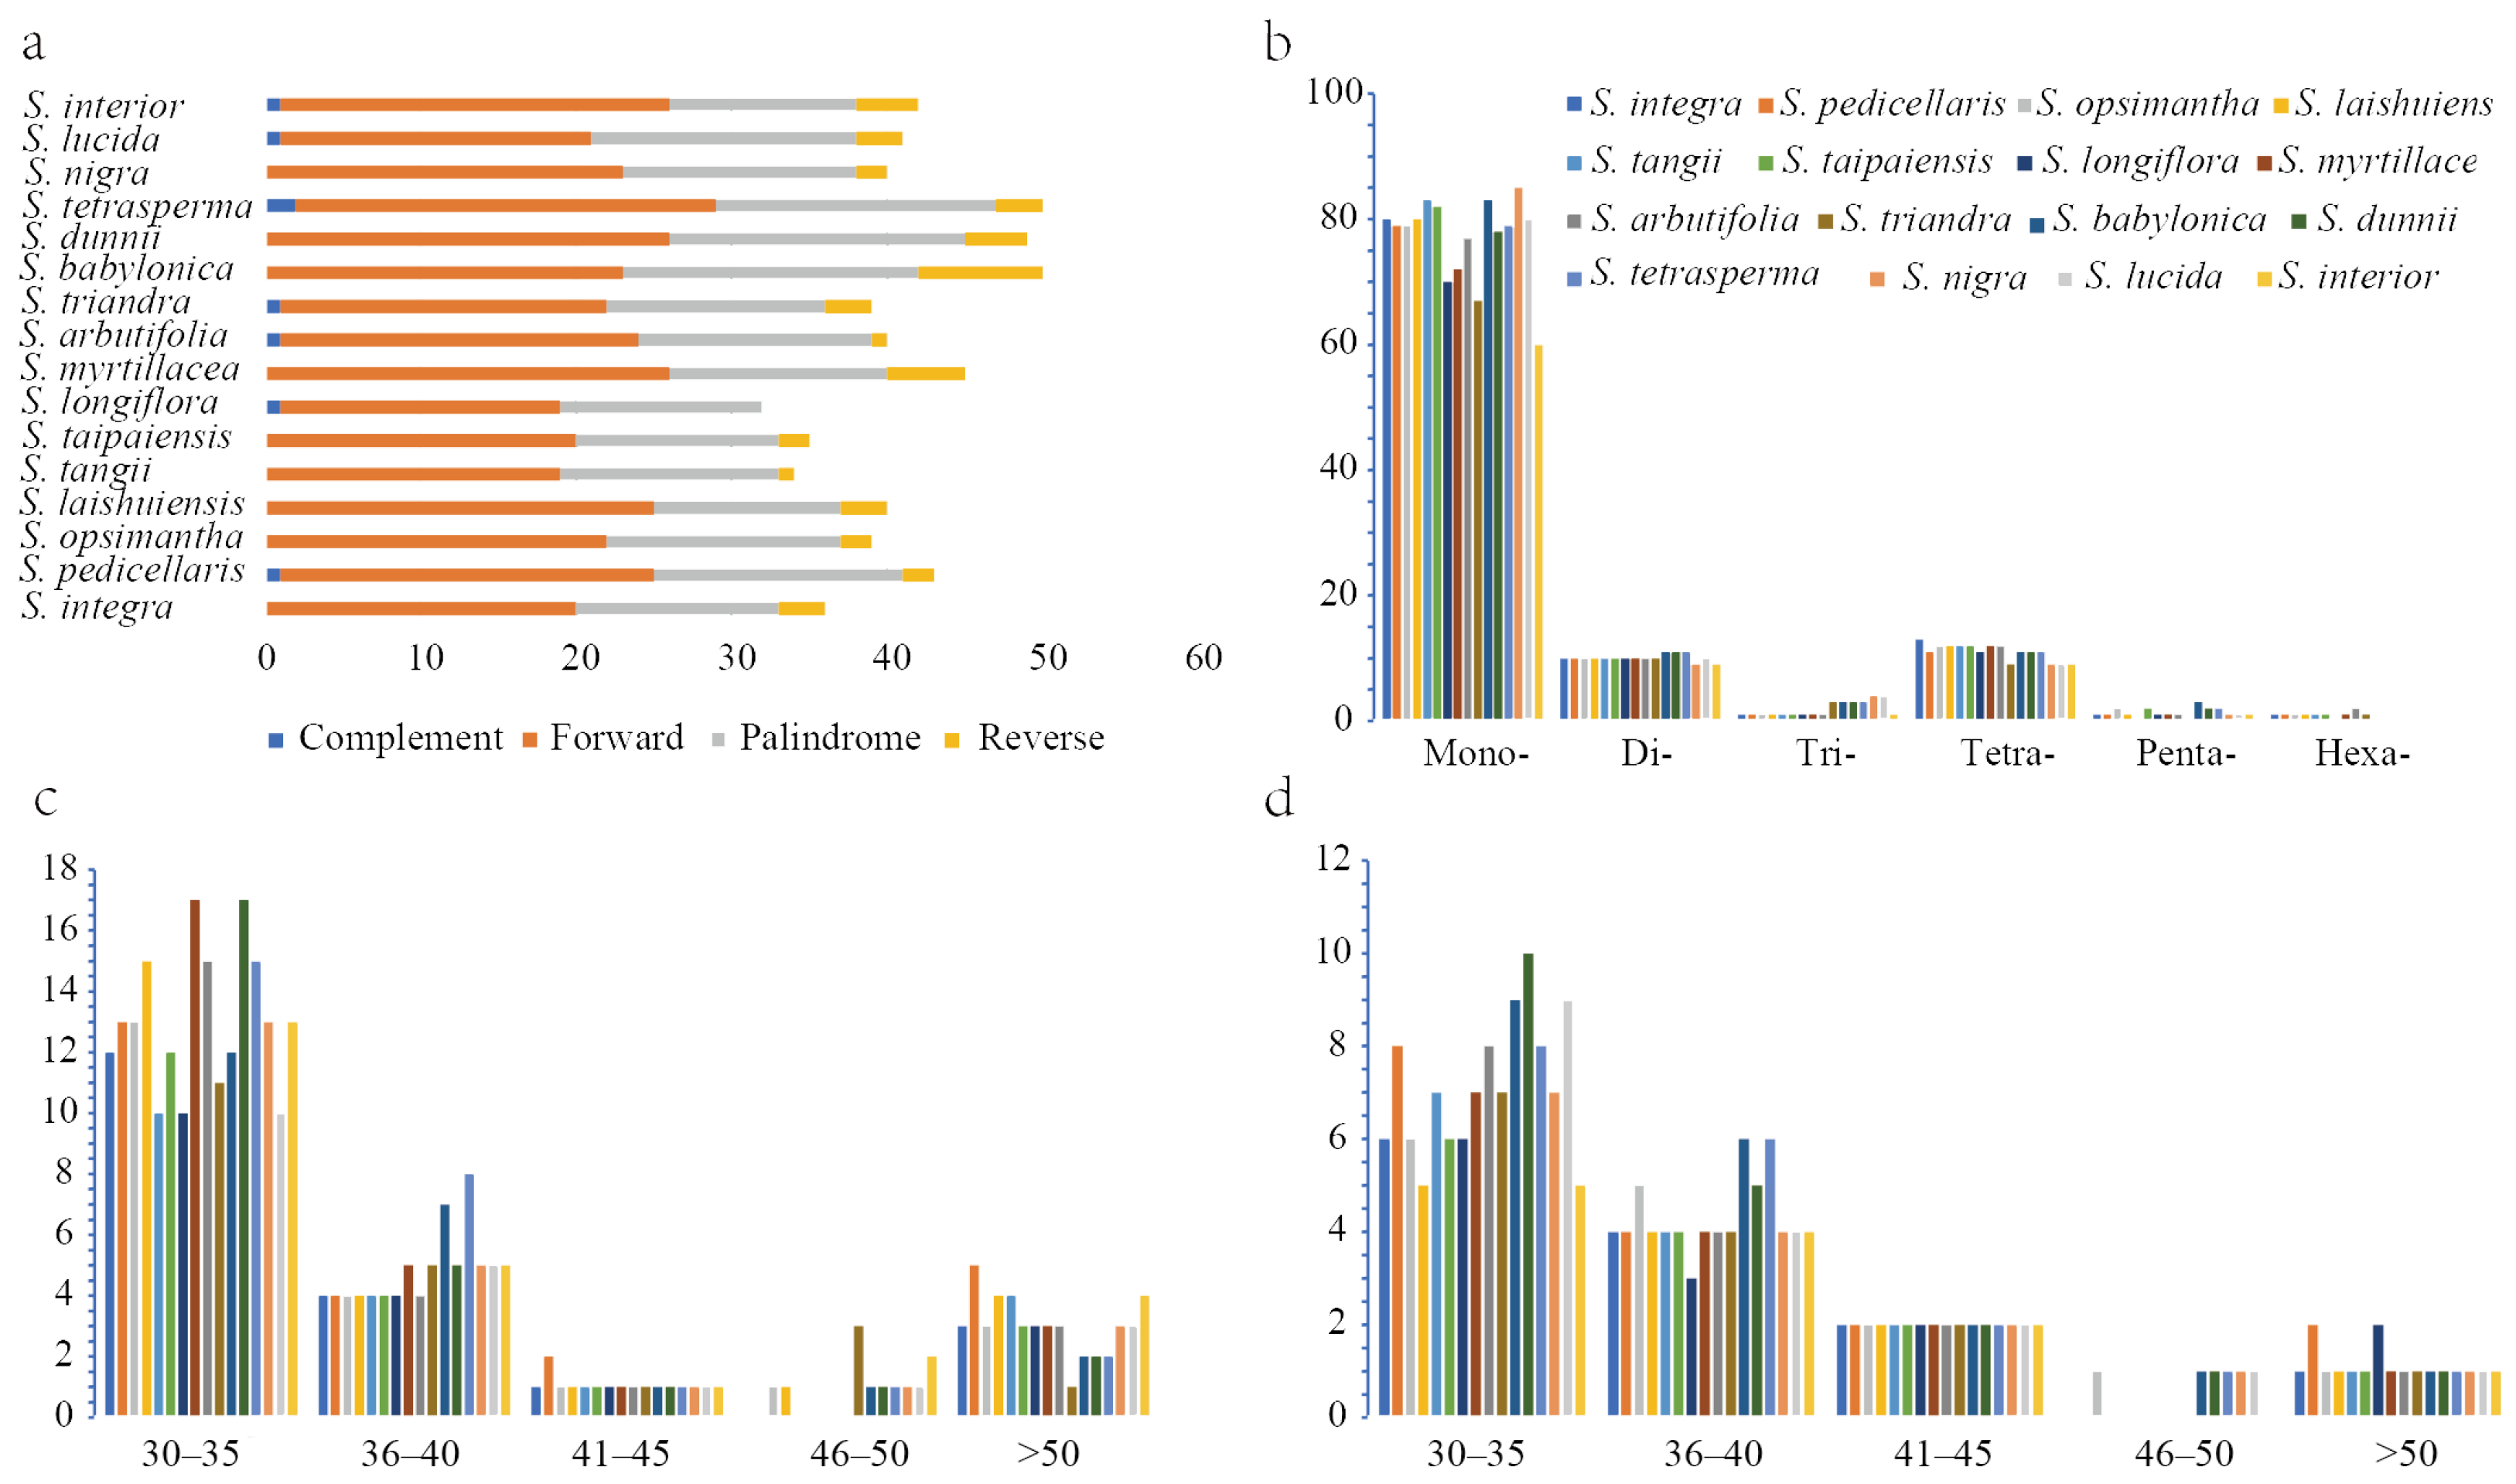
2.4. Result of Chloroplast Genome Repeat Sequences

In Clade I, each species contained 90–108 simple sequence repeats (SSRs), with mononucleotide repeats being the most abundant, comprising 74.23% (Salix myrtillacea) to 77.57% (Salix tangii) of the total (Figure 6b). Each species had 32–45 long repeat sequences, with forward repeats being the most common, followed by palindromic and reverse repeats (Figure 6a). In Clade II, species contained 80–111 SSRs, with mononucleotide repeats accounting for 74.29% (Salix dunnii) to 78.7% (Salix nigra) (Figure 6b). Long repeat sequences ranged from 41 to 50 per species, with forward repeats being the most common, followed by palindromic and reverse repeats (Figure 6a). Forward and palindromic repeats were predominantly 30–35 bp in length (Figure 6c,d). Detailed information is provided in Tables S3 and S4.

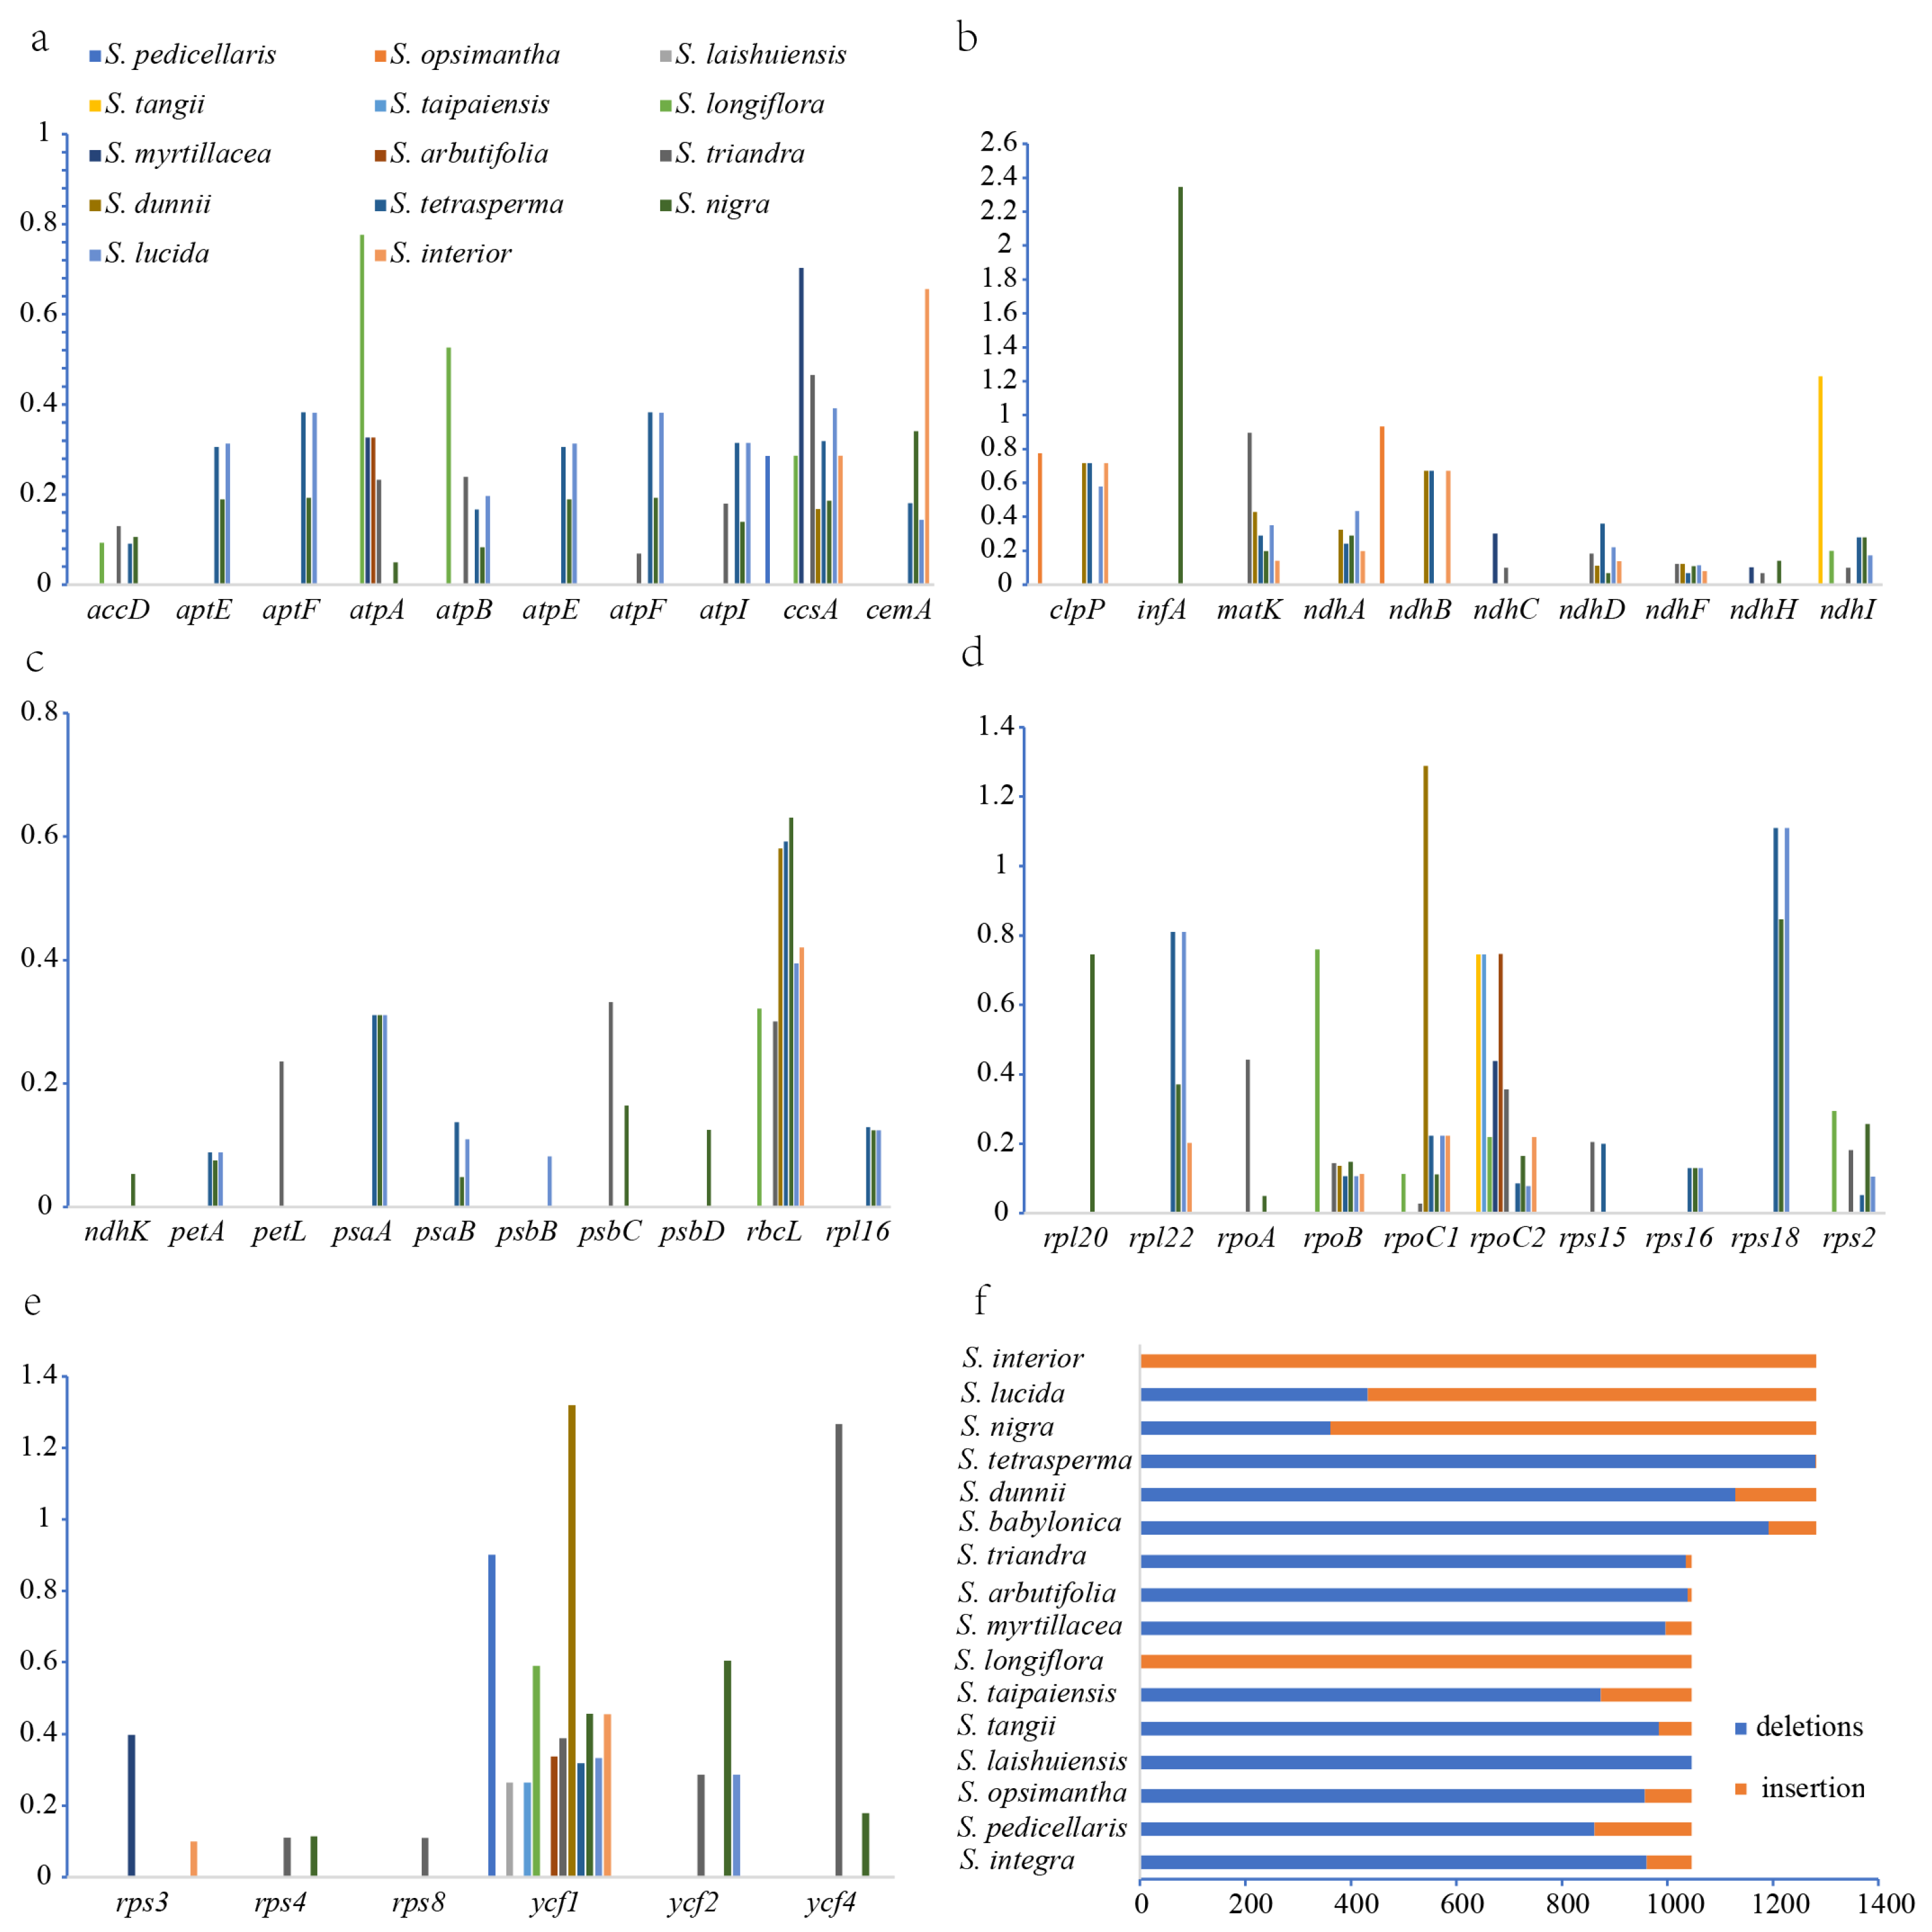
2.5. Result of InDel and Selection Pressure

Insertion and deletion (InDel) variations were identified in chloroplast genomes. In Clade I, deletion sites ranged from 0 to 1046 bp and insertion sites from 0 to 1046 bp, with a total InDel variation length of 1046 bp. In Clade II, deletion sites ranged from 1 to 1282 bp and insertion sites from 0 to 1281 bp, with a total InDel variation length of 1282 bp. Clade II exhibited more rapid species divergence (Figure 7f). Ka/Ks ratios were used to assess selection pressure on protein-coding genes in Salix. In Clade I, 29 genes were identified, with Ka/Ks ratios ranging from 0.027 to 1.26. The Ka/Ks ratios of ndhI and ycf4 exceeded 1, indicating positive selection. These genes are primarily associated with protease synthesis, photosynthesis, and self-replication. In Clade II, 45 genes were identified, with Ka/Ks ratios ranging from 0.048 to 2.34. Four genes (infA, rpoC1, rps18, and ycf1) had Ka/Ks ratios above 1 (Figure 7a–e), primarily related to self-replication. These findings suggest that protein-coding genes in the two clades are undergoing distinct evolutionary processes under different selective pressures.

3. Discussion

3.1. Phylogenetic Relationships Among the Salix

Phylogenetic analysis based on chloroplast genomes classified Salix into two main clades: Clade I and Clade II. Our findings align with previous molecular phylogenetic studies [8,20], supporting Gulyaev [10], but not Ogutcen [21]. Ogutcen classified Salix into subg. Chamaetia/Vetrix and subg. Salix s.l., while Chen proposed five subgenera: subg. Salix, subg. Urbaniana, subg. Triandrae, subg. Longifoliae, and subg. Vetrix [22]. Our study strongly supports the monophyly of subg. Chamaetia/Vetrix, subg. Longifoliae, and subg. Protitea.
Phylogenetic trees inferred using maximum likelihood and Bayesian methods also support two Salix lineages. However, Clade I exhibits topological inconsistencies between the two methods and low internal branch support. This weak support may stem from two main factors: (1) chloroplast genomes, being more conserved than nuclear genomes, have fewer sequence variations and a limited phylogenetic signal, reducing branch support; and (2) frequent hybridization within the genus has led to chloroplast capture.
Reticulate evolution driven by hybridization, introgression, and lineage sorting may explain the observed molecular phylogenetic incongruence [23]. Hybridization can create novel gene combinations, enhancing progeny adaptability to diverse environments and promoting genetic diversity [24,25]. During frequent hybridization, nuclear genes may follow distinct evolutionary trajectories, leading to highly variable regions. Given the complexity of Salix phylogeny, chloroplast data alone are insufficient to resolve its internal topological structure [26,27]. Our results reflect only the evolutionary relationships inferred from chloroplast genomes. Future studies should incorporate nuclear genetic data on parental inheritance and broader species sampling to achieve a more comprehensive understanding of Salix phylogeny.

3.2. Chloroplast Genome Differences Between Two Lineages of Salix

The structure and variation of Salix chloroplast genomes were compared, revealing significant differences between Clades I and II. In Clade II, North American species formed a subclade, while East Asian species formed another. Overall, chloroplast variation was greater in Clade II, likely due to (1) genetic differentiation driven by geographic isolation, leading to the accumulation of chloroplast genome variations; (2) historical biogeographic events, such as glacial isolation, which trapped species in refugia, followed by post-glacial dispersal, resulting in unique genomic features; and (3) chloroplast capture through hybridization between North American and East Asian species.
Nucleotide diversity analysis indicated that IR regions were more conserved than LSC and SSC regions, likely due to sequence homogenization via gene conversion and the role of IRs in genomic stability [28,29]. In Clade I, the SSC region exhibited the highest nucleotide diversity, whereas in Clade II, the LSC region showed the highest diversity. Whether these highly divergent regions or genes can serve as phylogenetic markers for Salix species or as molecular markers in population genetics warrants further investigation.
SSRs in chloroplast genomes serve as important molecular markers due to their abundance and high polymorphism, and have been widely used in studies on genetic diversity, species evolution, and conservation biology [30,31]. In both Clade I and Clade II, SSRs and long repeats showed no significant differences, with A/T mononucleotide repeats being dominant, a common feature in other plant lineages [32]. The identified long repeats, particularly forward and palindromic repeats, suggest a role in promoting structural variation and plastid stability. Insertions and deletions (InDels) represent key genomic variations that influence genome size and, consequently, species evolution [33]. To assess structural changes in Salix chloroplast genomes during evolution, we calculated the total InDel length for Clade I and Clade II. The InDel length was 1046 bp in Clade I and 1282 bp in Clade II. The significantly greater structural variation in Clade II chloroplast genomes suggests a higher evolutionary rate in Clade II species.
The Ka/Ks ratio is linked to gene adaptive evolution. In plant genomes, nonsynonymous substitutions alter amino acids, potentially modifying protein function and enabling species to adapt to new habitats, whereas synonymous substitutions do not affect protein composition [34]. The Ka/Ks ratio is used to infer gene selection types. Most plant genes have Ka/Ks values below 1, as nonsynonymous substitutions are generally disadvantageous, with only a few genes undergoing positive selection [35,36,37]. A Ka/Ks ratio > 1 indicates rapid positive selection in response to current environmental conditions, playing a crucial role in species adaptation. In Clade I, 29 genes were identified, with the Ka/Ks ratios of ndhI and ycf4 exceeding 1. In Clade II, 45 genes were identified, and 4 genes (infA, rpoC1, rps18, and ycf1) had Ka/Ks ratios above 1. The higher number of genes with evolutionary signals in Clade II may be due to its species occupying more ecological niches or facing more complex environments, necessitating greater adaptability. Therefore, their genomes may have experienced stronger environmental selection, a key driver of species diversification and expansion.

4. Materials and Methods

4.1. Plant Material, DNA Extraction, and Genome Sequencing

Following Argus’s five-subgenus classification [6,7], five Salix species were newly sequenced for this study, while 71 species were retrieved from the NCBI GenBank. The dataset included subg. Salix, subg. Protitea, subg. Longifoliae, subg. Chamaetia, and subg. Vetrix. Detailed species information is provided in Table S2. Genomic DNA was extracted from leaf samples using a modified CTAB method [38]. DNA quality and concentration were assessed with a Qubit 3.0 fluorometer (Thermo Scientific, Waltham, MA, USA) and a NanoDrop 2000c spectrophotometer (NanoDrop Technologies, Wilmington, DE, USA). Qualified DNA samples were fragmented, and sequencing libraries (insert size: 350 bp) were prepared. Sequencing on the Illumina NovaSeq X platform (Illumina, San Diego, CA, USA) generated 5 Gb of data per sample.

4.2. Chloroplast Genome Assembly and Annotation

Raw sequencing reads were quality-filtered using Trimmomatic v0.39. Clean, high-quality reads were used for de novo chloroplast genome assembly with GetOrganelle v1.7.5 [39]. Incomplete assemblies were manually refined in Geneious Prime v2020 [40]. Chloroplast genome annotation was performed with Plastid Genome Annotator Version 3 (PGA) [41] using Salix annulifera (GenBank: MZ365447) and Salix foetida (GenBank: MZ435429) as references. Manual corrections were made in Geneious Prime, and the final chloroplast genome map was generated using the OGDRAW online tool [42].

4.3. Phylogenetic Analysis

Phylogenetic relationships of Salix were reconstructed using complete chloroplast genome sequences. Populus koreana (GenBank: MW376789) and Populus lasiocarpa (GenBank: KX641589) served as outgroups. Detailed species data are provided in Table S2. Sequence alignment was performed using MAFFT with default parameters [43], followed by filtering of unreliable regions with trimAl v1.4.1 [44]. The optimal substitution model was determined using ModelFinder v1.5.4. Phylogenetic analyses were conducted using two methods: maximum likelihood (ML) and Bayesian inference (BI). The ML tree was constructed with RAxML v7.4.2 under the GTRGAMMA model with 1000 rapid bootstrap replicates. The BI tree was inferred using MrBayes 3.2.6, with four MCMC simulations running simultaneously, sampled every 1000 generations over two million generations. The first 25% of trees were discarded as burn-in, and the remaining trees were used to infer phylogenetic relationships. Tracer v1.7 was used to assess parameter convergence and effective sample size, and posterior probabilities were estimated using a 50% majority-rule consensus tree.

4.4. Chloroplast Genome Structural Comparison

Structural comparisons of 16 Salix chloroplast genomes were performed using the mVISTA program (https://genome.lbl.gov/vista/mvista/submit.shtml, accessed on 11 February 2025) with the Shuffle-LAGAN model. Boundaries of the LSC, IRb, SSC, and IRa regions were analyzed using IRscope (https://irscope.shinyapps.io/irapp/, accessed on 13 February 2025). Clade I sequences were aligned using MAFFT v7.313, and nucleotide diversity (Pi) was calculated using a sliding window analysis in DnaSP v6.0 with a window size of 600 bp and a step size of 200 bp. The same method was applied to Clade II. After aligning all sequences with MAFFT v7.313, insertion and deletion (InDel) site lengths were determined using R 4.4.0. Salix integra was used as the reference sequence for Clade I, while Salix babylonica was the reference for Clade II.

4.5. Analysis of Repeat Sequences and SSRs

Repeat sequences in chloroplast genomes were analyzed using the REPuter program, identifying four types of long repeats: forward, reverse, palindromic, and complementary. The parameters were set as follows: repeat similarity >90%, minimum repeat size of 30 bp, and a Hamming distance of 3. Simple sequence repeats (SSRs) were identified using MISA (http://pgrc.ipk-gatersleben.de/misa/, accessed on 13 February 2025), and six SSR types (mononucleotide, dinucleotide, trinucleotide, tetranucleotide, pentanucleotide, and hexanucleotide) were analyzed with repeat thresholds of 10, 5, 4, 3, 3, and 3, respectively.

4.6. Analysis of Gene Selection Pressure

In Clade I, coding sequences and protein sequences from Salix integra were extracted. Protein sequences from other species were compared with those of Salix integra using BLASTn (v2.10.1) to identify homologous proteins. Homologous protein sequences were aligned using MAFFT (v7.427), and a Perl script was used to map the aligned protein sequences to the corresponding coding sequences. The aligned coding sequences were then used to calculate Ka/Ks values using Ka/Ks_Calculator2 [45]. In Clade II, Salix babylonica was used as the reference, following the same methodology.

Supplementary Materials

The following supporting information can be downloaded at: https://www.mdpi.com/article/10.3390/ijms26052248/s1.

Author Contributions

Conceptualization and project administration, C.S. and Z.Z.; methodology, software, validation, formal analysis, investigation, resources, and data curation, F.Y., L.Z. and X.W.; writing—original draft preparation, writing—review and editing, visualization, and supervision, F.Y., C.S. and Z.Z.; funding acquisition, C.S. and Z.Z. All authors have read and agreed to the published version of the manuscript.

Funding

This research was funded by the Technology Basic Resources Investigation Program of China (grant no. 2022FY202201), the National Natural Science Foundation of China (grant no. 32001247), and the Second Comprehensive Scientific Expedition to the Qinghai-Tibet Plateau (grant no. 2019QZKK0502).

Institutional Review Board Statement

Not applicable.

Informed Consent Statement

Not applicable.

Data Availability Statement

The data presented in the study are deposited in the Genome Sequence Archive in National Genomics Data Center (https://ngdc.cncb.ac.cn/gsa/), accession number: PRJCA036831.

Acknowledgments

We thank Jana Vamosi of the University of Calgary. He provided us with specimens of Salix from North America.

Conflicts of Interest

The authors declare no conflicts of interest.

References

  1. Tawfeek, N.; Mahmoud, M.F.; Hamdan, D.I.; Sobeh, M.; Farrag, N.; Wink, M.; El-Shazly, A.M. Phytochemistry, Pharmacology and Medicinal Uses of Plants of the Genus Salix: An Updated Review. Front. Pharmacol. 2021, 12, 593856. [Google Scholar] [CrossRef] [PubMed]
  2. Keoleian, G.A.; Volk, T.A. Renewable Energy from Willow Biomass Crops: Life Cycle Energy, Environmental and Economic Performance. Crit. Rev. Plant Sci. 2005, 24, 385–406. [Google Scholar] [CrossRef]
  3. Myers-Smith, I.H.; Forbes, B.C.; Wilmking, M. Shrub Encroachment in Arctic and Alpine Tundra: Dynamics, Impacts and Research Priorities. Environ. Res. Lett. 2011, 6, 1–15. [Google Scholar] [CrossRef]
  4. Mohsin, M.; Salam, M.M.A.; Nawrot, N.; Kaipiainen, E.; Lane, D.J.; Wojciechowska, E.; Kinnunen, N.; Heimonen, M.; Tervahauta, A.; Peräniemi, S.; et al. Phytoextraction and Recovery of Rare Earth Elements Using Willow (Salix spp.). Sci. Total Environ. 2022, 809, 152209. [Google Scholar] [CrossRef]
  5. Dorn, R.D. A Synopsis of American Salix. Can. J. Bot. 1976, 54, 2769–2789. [Google Scholar] [CrossRef]
  6. Argus, G.W. Infrageneric Classification of Salix (Salicaceae) in the New World. Syst. Bot. Monogr. 1997, 52, 1–121. [Google Scholar] [CrossRef]
  7. Argus, G.W. Salix. In Flora of North America Editorial Committee; Flora of North America North of Mexico, Ed.; Oxford University: New York, NY, USA, 2010; Volume 7, pp. 23–51. [Google Scholar]
  8. Meucci, S.; Schulte, L.; Zimmermann, H.H.; Stoof-Leichsenring, K.R.; Epp, L.; Eidesen, P.B.; Herzschuh, U. Holocene Chloroplast Genetic Variation of Shrubs (Alnus Alnobetula, Betula Nana, Salix sp.) at the Siberian Tundra-Taiga Ecotone Inferred from Modern Chloroplast Genome Assembly and Sedimentary Ancient DNA Analyses. Ecol. Evol. 2021, 11, 2173–2193. [Google Scholar] [CrossRef]
  9. Wu, J.; Nyman, T.; Wang, D.C.; Argus, G.W.; Yang, Y.P.; Chen, J.H. Phylogeny of Salix Subgenus Salix s.l. (Salicaceae): Delimitation, Biogeography, and Reticulate Evolution. BMC Evol. Biol. 2015, 15, 31. [Google Scholar] [CrossRef]
  10. Zhang, L.; Xi, Z.; Wang, M.; Guo, X.; Ma, T. Plastome phylogeny and lineage diversification of Salicaceae with focus on poplars and willows. Ecol. Evol. 2018, 8, 7817–7823. [Google Scholar] [CrossRef]
  11. Gulyaev, S.; Cai, X.J.; Guo, F.Y.; Kikuchi, S.; Applequist, W.L.; Zhang, Z.X.; Hörandl, E.; He, L. The phylogeny of Salix revealed by whole genome re-sequencing suggests different sex-determination systems in major groups of the genus. Ann. Bot. 2022, 129, 485–498. [Google Scholar] [CrossRef]
  12. Zhou, X.; Sheng, S.; Xu, Q.; Lu, R.; Chen, C.; Peng, H.; Feng, C. Structure and features of the complete chloroplast genome of Salix triandroides (Salicaceae). Biotechnol. Biotechnol. Equip. 2022, 36, 148–158. [Google Scholar] [CrossRef]
  13. Jansen, R.K.; Wojciechowski, M.F.; Sanniyasi, E.; Lee, S.B.; Daniell, H. Complete plastid genome sequence of the chickpea (Cicer arietinum) and the phylogenetic distribution of rps12 and clpP intron losses among legumes (Leguminosae). Mol. Phylogenet. Evol. 2008, 48, 1204–1217. [Google Scholar] [CrossRef] [PubMed]
  14. Moore, M.J.; Dhingra, A.; Soltis, P.S.; Shaw, R.; Farmerie, W.G.; Folta, K.M.; Soltis, D.E. Rapid and accurate pyrosequencing of angiosperm plastid genomes. BMC Plant Biol. 2006, 6, 17. [Google Scholar] [CrossRef] [PubMed]
  15. Wicke, S.; Schneeweiss, G.M.; dePamphilis, C.W.; Müller, K.F.; Quandt, D. The Evolution of the Plastid Chromosome in Land Plants: Gene Content, Gene Order, Gene Function. Plant Mol. Biol. 2011, 76, 273–297. [Google Scholar] [CrossRef]
  16. Fajri, H.; Sunandar, A.R.I.; Qurbaniah, M. Phylogenetic Analysis of Wild Bananas (Musa spp.) in West Kalimantan, Indonesia, Based on Maturase K (Matk) Genes. Biodiversitas J. Biol. Divers. 2024, 25, 8. [Google Scholar] [CrossRef]
  17. Zhang, X.; Liu, K.; Wang, Y.; He, J.; Wu, Y.; Zhang, Z. Complete Chloroplast Genomes of Three Salix Species: Genome Structures and Phylogenetic Analysis. Forests 2021, 12, 12. [Google Scholar] [CrossRef]
  18. Lu, D.; Huang, H.; Zhang, L.; Hao, L.; Zhang, G. Complete chloroplast genomes of three sand-fixing Salix shrubs from Northwest China: Comparative and phylogenetic analysis and interspecific identification. Trees 2023, 37, 849–861. [Google Scholar] [CrossRef]
  19. Zhou, J.; Jiao, Z.; Guo, J.; Wang, B.S.; Zheng, J. Complete Chloroplast Genome Sequencing of Five Salix Species and Its Application in the Phylogeny and Taxonomy of the Genus. Mitochondrial DNA B Resour. 2021, 6, 2348–2352. [Google Scholar] [CrossRef]
  20. Azuma, T.; Kajita, T.; Yokoyama, J.; Ohashi, H. Phylogenetic Relationships of Salix (Salicaceae) Based on Rbcl Quence Data. Am. J. Bot. 2000, 87, 67–75. [Google Scholar] [CrossRef]
  21. Hardig, T.M.; Anttila, C.K.; Brunsfeld, S.J. A Phylogenetic Analysis of Salix (Salicaceae) Based on Matk and Ribosomal DNA Sequence Data. J. Bot. 2010, 2010, 197696. [Google Scholar]
  22. Ogutcen, E.; Ferreira, P.d.L.; Wagner, N.D.; Marinček, P.; Leong, J.V.; Aubona, G.; Cavender-Bares, J.; Michálek, J.; Schroeder, L.; Sedio, B.E.; et al. Phylogenetic Insights into the Salicaceae: The Evolution of Willows and Beyond. Mol. Phylogenetics Evol. 2024, 199, 108161. [Google Scholar] [CrossRef]
  23. Chen, K.-Y.; Wang, J.-D.; Xiang, R.-Q.; Yang, X.-D.; Yun, Q.-Z.; Huang, Y.; Sun, H.; Chen, J.-H. Backbone Phylogeny of Salix Based on Genome Skimming Data. Plant Divers. 2024. [Google Scholar] [CrossRef]
  24. Mallet, J. Hybridization as an Invasion of the Genome. Trends Ecol. Evol. 2005, 20, 229–237. [Google Scholar] [CrossRef]
  25. Seehausen, O. Hybridization and Adaptive Radiation. Trends Ecol. Evol. 2004, 19, 198–207. [Google Scholar] [CrossRef] [PubMed]
  26. Petit, R.J.; Vendramin, G.G. Plant Phylogeography Based on Organelle Genes: An Introduction. In Phylogeography of Southern European Refugia; Springer: Berlin/Heidelberg, Germany, 2007; pp. 23–97. [Google Scholar]
  27. Fontaine, M.C.; Pease, J.B.; Steele, A.; Waterhouse, R.M.; Neafsey, D.E.; Sharakhov, I.V.; Jiang, X.; Hall, A.B.; Catteruccia, F.; Kakani, E.; et al. Mosquito Genomics. Extensive Introgression in a Malaria Vector Species Complex Revealed by Phylogenomics. Science 2015, 347, 1258524. [Google Scholar] [CrossRef] [PubMed]
  28. Birky, C.W., Jr. The Inheritance of Genes in Mitochondria and Chloroplasts: Laws, Mechanisms, and Models. Annu. Rev. Genet. 2001, 35, 125–148. [Google Scholar] [CrossRef]
  29. Palmer, J.D.; Thompson, W.F. Rearrangements in the Chloroplast Genomes of Mung Bean and Pea. Proc. Natl. Acad. Sci. USA 1981, 78, 5533–5537. [Google Scholar] [CrossRef]
  30. Guisinger, M.M.; Kuehl, J.V.; Boore, J.L.; Jansen, R.K. Extreme Reconfiguration of Plastid Genomes in the Angiosperm Family Geraniaceae: Rearrangements, Repeats, and Codon Usage. Mol. Biol. Evol. 2011, 28, 583–600. [Google Scholar] [CrossRef]
  31. Song, Y.; Chen, Y.; Lv, J.; Xu, J.; Zhu, S.; Li, M.; Chen, N. Development of Chloroplast Genomic Resources for Oryza Species Discrimination. Front. Plant Sci. 2017, 8, 1854. [Google Scholar] [CrossRef]
  32. Lyu, D.; Sun, S.; Shan, X.; Wang, W. Inbreeding Evaluation Using Microsatellite Confirmed Inbreeding Depression in Growth in the Fenneropenaeus Chinensis Natural Population. Front. Genet. 2023, 14, 1077814. [Google Scholar] [CrossRef]
  33. Köhler, M.; Reginato, M.; Souza-Chies, T.T.; Majure, L.C. Insights into Chloroplast Genome Evolution across Opuntioideae (Cactaceae) Reveals Robust yet Sometimes Conflicting Phylogenetic Topologies. Front. Plant Sci. 2020, 11, 729. [Google Scholar] [CrossRef] [PubMed]
  34. Shaw, J.; Lickey, E.B.; Beck, J.T.; Farmer, S.B.; Liu, W.; Miller, J.; Siripun, K.C.; Winder, C.T.; Schilling, E.E.; Small, R.L. The Tortoise and the Hare Ii: Relative Utility of 21 Noncoding Chloroplast DNA Sequences for Phylogenetic Analysis. Am. J. Bot. 2005, 92, 142–166. [Google Scholar] [CrossRef] [PubMed]
  35. Wright, S.I.; Gaut, B.S. Molecular Population Genetics and the Search for Adaptive Evolution in Plants. Mol. Biol. Evol. 2005, 22, 506–519. [Google Scholar] [CrossRef] [PubMed]
  36. Wong, W.S.W.; Yang, Z.; Goldman, N.; Nielsen, R. Accuracy and Power of Statistical Methods for Detecting Adaptive Evolution in Protein Coding Sequences and for Identifying Positively Selected Sites. Genetics 2004, 168, 1041–1051. [Google Scholar] [CrossRef]
  37. Clark, R.M.; Schweikert, G.; Toomajian, C.; Ossowski, S.; Zeller, G.; Shinn, P.; Warthmann, N.; Hu, T.T.; Fu, G.; Hinds, D.A.; et al. Common Sequence Polymorphisms Shaping Genetic Diversity in Arabidopsis thaliana. Science 2007, 317, 338–342. [Google Scholar] [CrossRef]
  38. Li, J.; Wang, S.; Yu, J.; Wang, L.; Zhou, S. A Modified Ctab Protocol for Plant DNA Extraction. Acta Bot. 2013, 48, 72. [Google Scholar]
  39. Jin, J.-J.; Yu, W.-B.; Yang, J.-B.; Song, Y.; Depamphilis, C.W.; Yi, T.-S.; Li, D.-Z. Getorganelle: A Fast and Versatile Toolkit for Accurate De Novo Assembly of Organelle Genomes. Genome Biol. 2020, 21, 241. [Google Scholar] [CrossRef]
  40. Kearse, M.; Moir, R.; Wilson, A.; Stones-Havas, S.; Cheung, M.; Sturrock, S.; Buxton, S.; Cooper, A.; Markowitz, S.; Duran, C.; et al. Geneious Basic: An Integrated and Extendable Desktop Software Platform for the Organization and Analysis of Sequence Data. Bioinformatics 2012, 28, 1647–1649. [Google Scholar] [CrossRef]
  41. Qu, X.; Moore, M.J.; Li, D.-Z.; Yi, T. Pga: A Software Package for Rapid, Accurate, and Flexible Batch Annotation of Plastomes. Plant Methods 2019, 15, 50. [Google Scholar] [CrossRef]
  42. Greiner, S.; Lehwark, P.; Bock, R. Organellargenomedraw (Ogdraw) Version 1.3.1: Expanded Toolkit for the Graphical Visualization of Organellar Genomes. Nucleic Acids Res. 2019, 47, W59–W64. [Google Scholar] [CrossRef]
  43. Katoh, K.; Standley, D.M. Mafft Multiple Sequence Alignment Software Version 7: Improvements in Performance and Usability. Mol. Biol. Evol. 2013, 30, 772–780. [Google Scholar] [CrossRef] [PubMed]
  44. Capella-Gutiérrez, S.; Silla-Martínez, J.M.; Gabaldón, T. Trimal: A Tool for Automated Alignment Trimming in Large-Scale Phylogenetic Analyses. Bioinformatics 2009, 25, 1972–1973. [Google Scholar] [CrossRef] [PubMed]
  45. Zhang, Z.; Li, J.; Zhao, X.; Wang, J.; Wong, G.K.; Yu, J. Kaks_Calculator: Calculating Ka and Ks through Model Selection and Model Averaging. Genom. Proteom. Bioinform. 2006, 4, 259–263. [Google Scholar] [CrossRef] [PubMed]
Figure 1. The phylogenetic tree of the chloroplast genome was constructed using the maximum likelihood (ML) method. (a) Chloroplast phylogenetic structure map before the bootstrap support (BS) merger. (b) The phylogenetic tree. (Merge branches with less than 80 support).
Ijms 26 02248 g001
Figure 2. The phylogenetic tree of the chloroplast genome was constructed using Bayesian inference (BI).
Ijms 26 02248 g002
Figure 3. Chloroplast genome gene map of Salix sp. Genes located outside the ring are transcribed in a counterclockwise direction, while genes located inside the ring are transcribed in a clockwise direction. The dark gray area in the inner circle is the GC content of the cp genome, and the light gray area is the AT content. Different color blocks represent genes from different functional groups.
Ijms 26 02248 g003
Figure 4. Comparison of junctions between LSC (light blue), SSC (light green), and IR (orange) regions among ten Salix species. Distance in figure is not to scale.
Ijms 26 02248 g004
Figure 5. (a) Analysis of chloroplast genome nucleotide variability values (Pi) among Clade I. (b) Analysis of chloroplast genome nucleotide variability values (Pi) among Clade II. (c) Similarity map of chloroplast genome sequence of 16 Salix chloroplast genomes created using mVISTA. On the Y-axis, the percentage of sequence consistency is shown to be between 50% and 100%. The X-axis represents the coordinates of the chloroplast genome. Genomic regions are color-coded as protein-coding (exons), mRNAs or rRNAs, and intergenic regions. Genes are represented by gray arrows.
Ijms 26 02248 g005
Figure 6. Numbers and types of dispersed repeats of ten Salix species in the chloroplast genome. (a) Numbers and types of long repeats. (b) Numbers and types of SSRs. (c) Lengths and frequencies of forward long repeats. (d) Lengths and frequencies of palindromic long repeats.
Ijms 26 02248 g006
Figure 7. (ae) Ka/Ks ratios for 46 protein-coding genes from ten Salix species. (f) InDels analysis results for Salix.
Ijms 26 02248 g007
Table 1. Features of the chloroplast genomes of eight Caragana species.
SpeciesSpecies Length (bp)GC (%)Number of Genes
Coding GenestRNArRNATotal
Clade IS. integra155,60736.6988358131
S. pedicellaris155,50836.788358131
S. opsimantha155,60336.6888358131
S. laishuiensis155,69236.6888358131
S. tangii155,63036.6988358131
S. taipaiensis155,52036.788358131
S. longiflora154,64636.7888358131
S. myrtillacea155,64336.6888358131
S. arbutifolia155,68436.6888358131
S. triandra155,68136.6588358131
Clade IIS. babylonica155,72536.6488358131
S. dunnii155,63636.6588358131
S. tetrasperma155,57336.6688358131
S. nigra154,80536.7688358131
S. lucida154,87636.7688358131
S. interior154,44436.7888358131
Disclaimer/Publisher’s Note: The statements, opinions and data contained in all publications are solely those of the individual author(s) and contributor(s) and not of MDPI and/or the editor(s). MDPI and/or the editor(s) disclaim responsibility for any injury to people or property resulting from any ideas, methods, instructions or products referred to in the content.

