Article

Genome-Wide Identification and Expression Profiling of the Invertase Genes Involved in Sugar Metabolism and Accumulation in Actinidia arguta

1
Xi’an Botanical Garden of Shaanxi Province (Institute of Botany of Shaanxi Province), Xi’an 710061, China
2
Key Laboratory of Resource Biology and Biotechnology in Western China (Ministry of Education), College of Life Sciences, Northwest University, Xi’an 710069, China
*
Author to whom correspondence should be addressed.
Int. J. Mol. Sci. 2025, 26(5), 2150; https://doi.org/10.3390/ijms26052150
Submission received: 25 December 2024 / Revised: 16 February 2025 / Accepted: 20 February 2025 / Published: 27 February 2025
(This article belongs to the Special Issue Advances in Genetics, Epigenetics and Postharvest Biology of Fruits)

Abstract

:
Invertase (INV, EC3.2.1.26) is widely recognized as an indispensable enzyme for catalyzing sucrose degradation and plays a central role in plant growth as well as fruit quality improvement. However, no systematic study has been performed in kiwifruit. Here, we identified 102 AaINV genes in the Actinidia arguta “M1” genome. Their physical and chemical properties, subcellular localizations, phylogenetic relationships and expression profiles were characterized. Phylogenetic analysis showed that the INV members were clustered into three groups (vacuole invertases (VINVs) and cell wall invertases (CWINVs) in Group I, alkaline/neutral invertase (NINVs) in Group II and Group III), demonstrating evolutionary conservation in the INV family across Arabidopsis and Actinidia species. Gene replication analysis revealed that many AaINV genes were derived from gene duplication events. Molecular evolution analysis based on Ka/Ks ratios indicated that the INV members have experienced extensive purifying selection during evolution. To explore the potential gene functions, we integrated RNA-seq and metabolomics to analyze AaINV gene expression patterns and sugar accumulation in three A. arguta varieties (“Kukuwa”, “Qinhuang”, “Xianziguang”), respectively. The expression analysis of the 102 genes showed that the expression patterns varied among the three kiwifruit varieties at fruit maturity stage. The expression levels of AaINVs were also investigated via qRT-PCR in these varieties. Specifically, we constructed a complex regulatory network that regulates sugar metabolism in kiwifruit based on the correlation between 42 AaINV genes and 14 sugar metabolites. These findings provide insights into physiological functions of AaINVs in kiwifruit, especially roles in governing sugars accumulation in fruits.

1. Introduction

Sucrose (Suc) is the major transport form of the photosynthetic carbohydrate through the phloem to sink tissues (e.g., fruits, roots and shoot tips) and plays central physiological roles in plants [1,2]. The transported sucrose in different cells is hydrolyzed to hexose through sucrose synthase (SUS, EC2.4.1.13) or sucrose convertase (INV, EC3.2.1.26) to provide carbon and energy sources for numerous metabolic pathways [3]. INVs (also known as β-fructosidases) catalyze the cleavage of sucrose into fructose and glucose, which are present in both photosynthetic and non-photosynthetic tissues [4]. The function of INVs is available for multiple biological processes, such as carbohydrate partitioning, organ building, response to biotic and abiotic stresses, etc. [4,5]. According to the pH values, INVs can be referred as acid invertases (AINVs, pH 4.5–5.0) and neutral/alkaline invertases (NINVs, pH 6.5–8.0). Moreover, it can also be assigned into three categories based on their subcellular compartments. NINVs are usually located in chloroplasts, mitochondrion or cytoplasm, whereas AINVs appear in the cell wall or vacuole, corresponding to CWINVs and VINVs, respectively [6,7]. Despite being localized in different cellular compartments, CWINVs and VINVs share similar biochemical properties [8]. Both enzymes catalyze the hydrolysis of sucrose and other β-fructose-containing compounds, such as oligosaccharides, which is why they are also referred to as β-fructofuranosidases [9]. In contrast, NINVs lack an N-terminal signal peptide and do not function as β-fructofuranosidases; instead, they specifically catalyze sucrose hydrolysis [10].
Up to date, the INV members have been extensively documented in diverse plants, such as Arabidopsis [11,12], rice [13], tobacco [4,14] and tomato [15,16]. The functional characterization of INVs and their regulatory mechanisms has also been extensively studied and documented. It is widely believed that CWINVs are crucial for various physiological and developmental processes in plants, including sucrose partitioning [17], seed and pollen development [18] and environmental responses [19,20]. The evidence also indicates that VINVs are involved in the functioning of fruits and storage organs [21], as well as in plant responses to drought and hypoxia stress [22]. The proposed functions of NINVs have also been increasingly recognized, encompassing sugar signal transduction [23], shoot and root growth [24], fruit development [25,26,27,28] and responses to both biological and abiotic stresses [20,29]. For instance, rapid glucose and fructose accumulation in the leaves of MeNINV1-overexpressing Arabidopsis is attributed to higher A/N-INV activity [30]. In apple (Malus domestica), the expression of two INV genes, CWINV and NINV, is significantly downregulated, accompanied by an decrease in sugar content during fruit development [25]. In tobacco (Nicotiana tabacum), inhibition of the expression of NtNINV10 lowers the levels of glucose and fructose in leaves, while NtNINV10 is induced by drought and salinity stresses [4]. Moreover, some transcription factors (TFs), e.g., NAC71, WRKY3 and WRKY57, have important regulatory implications for sugar accumulation mainly by activating the expression of INV, SPS and SUS [26]. Consequently, the INV family members involved in sucrose metabolism and the associated TFs are essential for understanding the regulatory mechanisms of sugar accumulation in plants [27,28]. However, the INV gene family has not yet been thoroughly investigated at the whole-genome level in fruit crops.
Kiwifruit (Actinidia spp.) is an economically significant fruit crop with exceptional nutritional benefits and remarkable health-promoting properties [31]. In recent years, consumers are attracted to its unique fruits, fresh colors and high nutrition, especially those of A. arguta, which has a smooth, hairless skin, green or purple color and contains high levels of anthocyanin [32,33]. Although A. arguta is known as a wild species, it is also commercially cultivated worldwide and introduced to the market due to its special desirable traits [34,35]. In A. arguta, the nutrient composition, functional activity and flavor quality vary considerably among cultivars [36,37,38]. Previous studies have identified that sucrose is the predominant sugar in A. arguta, followed by glucose and fructose [39,40]. However, there is still limited understanding of the relationship between fruit sucrose accumulation and INV genes. Hence, it is essential to characterize the INV gene family in kiwifruit to investigate its potential role in sugar accumulation.
Recently, the kiwifruit genome (A. arguta “M1”) has been sequenced [41], which laid a solid foundation for genome-wide analysis of INV genes in kiwifruit. In this study, we focused on genome-wide identification, phylogenetic analysis, gene structure, collinearity analysis and cis-acting elements of 102 INV genes in A. arguta. The transcriptome data were employed to assess the relative expression of AaINV genes in three A. arguta varieties, namely “Kukuwa” (KKW, full-green flesh), “Qinhuang” (QH, yellow) and “Xianziguang” (XZG, purple). In addition, several metabolites accumulated in the fruit samples were screened as hub players in flesh sweetness during fruit quality formation. We further analyzed their correlation of AaINVs, TFs and sugars to construct the regulation network. This comprehensive analysis provides valuable insights into the functional roles of the INV genes in fruit crops.

2. Results

2.1. Genome-Wide Identification of INVs in A. arguta

In the present study, a total of 102 non-redundant AaINVs belonging to NINVs (72), CWINVs (23) and VINVs (7) were identified in the kiwifruit (A. arguta “M1”) genome, and these were labelled AaNINV1 to AaNINV72, AaCWINV1 to AaCWINV23 and AaVINV1 to AaVINV7, respectively (Table S2). Nearly 78% of AaINVs had a length of about 500 amino acids. Notably, AaNINV25 encoded the shortest protein (81 amino acids), whereas AaVINV7/AaCWINV23 had an exceptionally longer size of 1187/1076 amino acids. The theoretical isoelectric point (pI) values of the AaINV genes varied from 4.64 (AaCWINV12) to 9.76 (AaNINV2), and the molecular weight ranged between 8.95 kDa (AaNINV25) and 132.27 kDa (AaVINV7), with an average range of 61.93 kDa (Table S2). The subcellular localization of the most of AaNINVs (62/72 = 86.11%) was in the plasma membrane, followed by the cytoplasm (21/72 = 29.17%) and chloroplast (18/72 = 25%). By contrast, the majority of AaCWINVs and AaVINVs were localized in the vacuole, and the others were in the lysosomal and extracellular matrix (Figure S1).

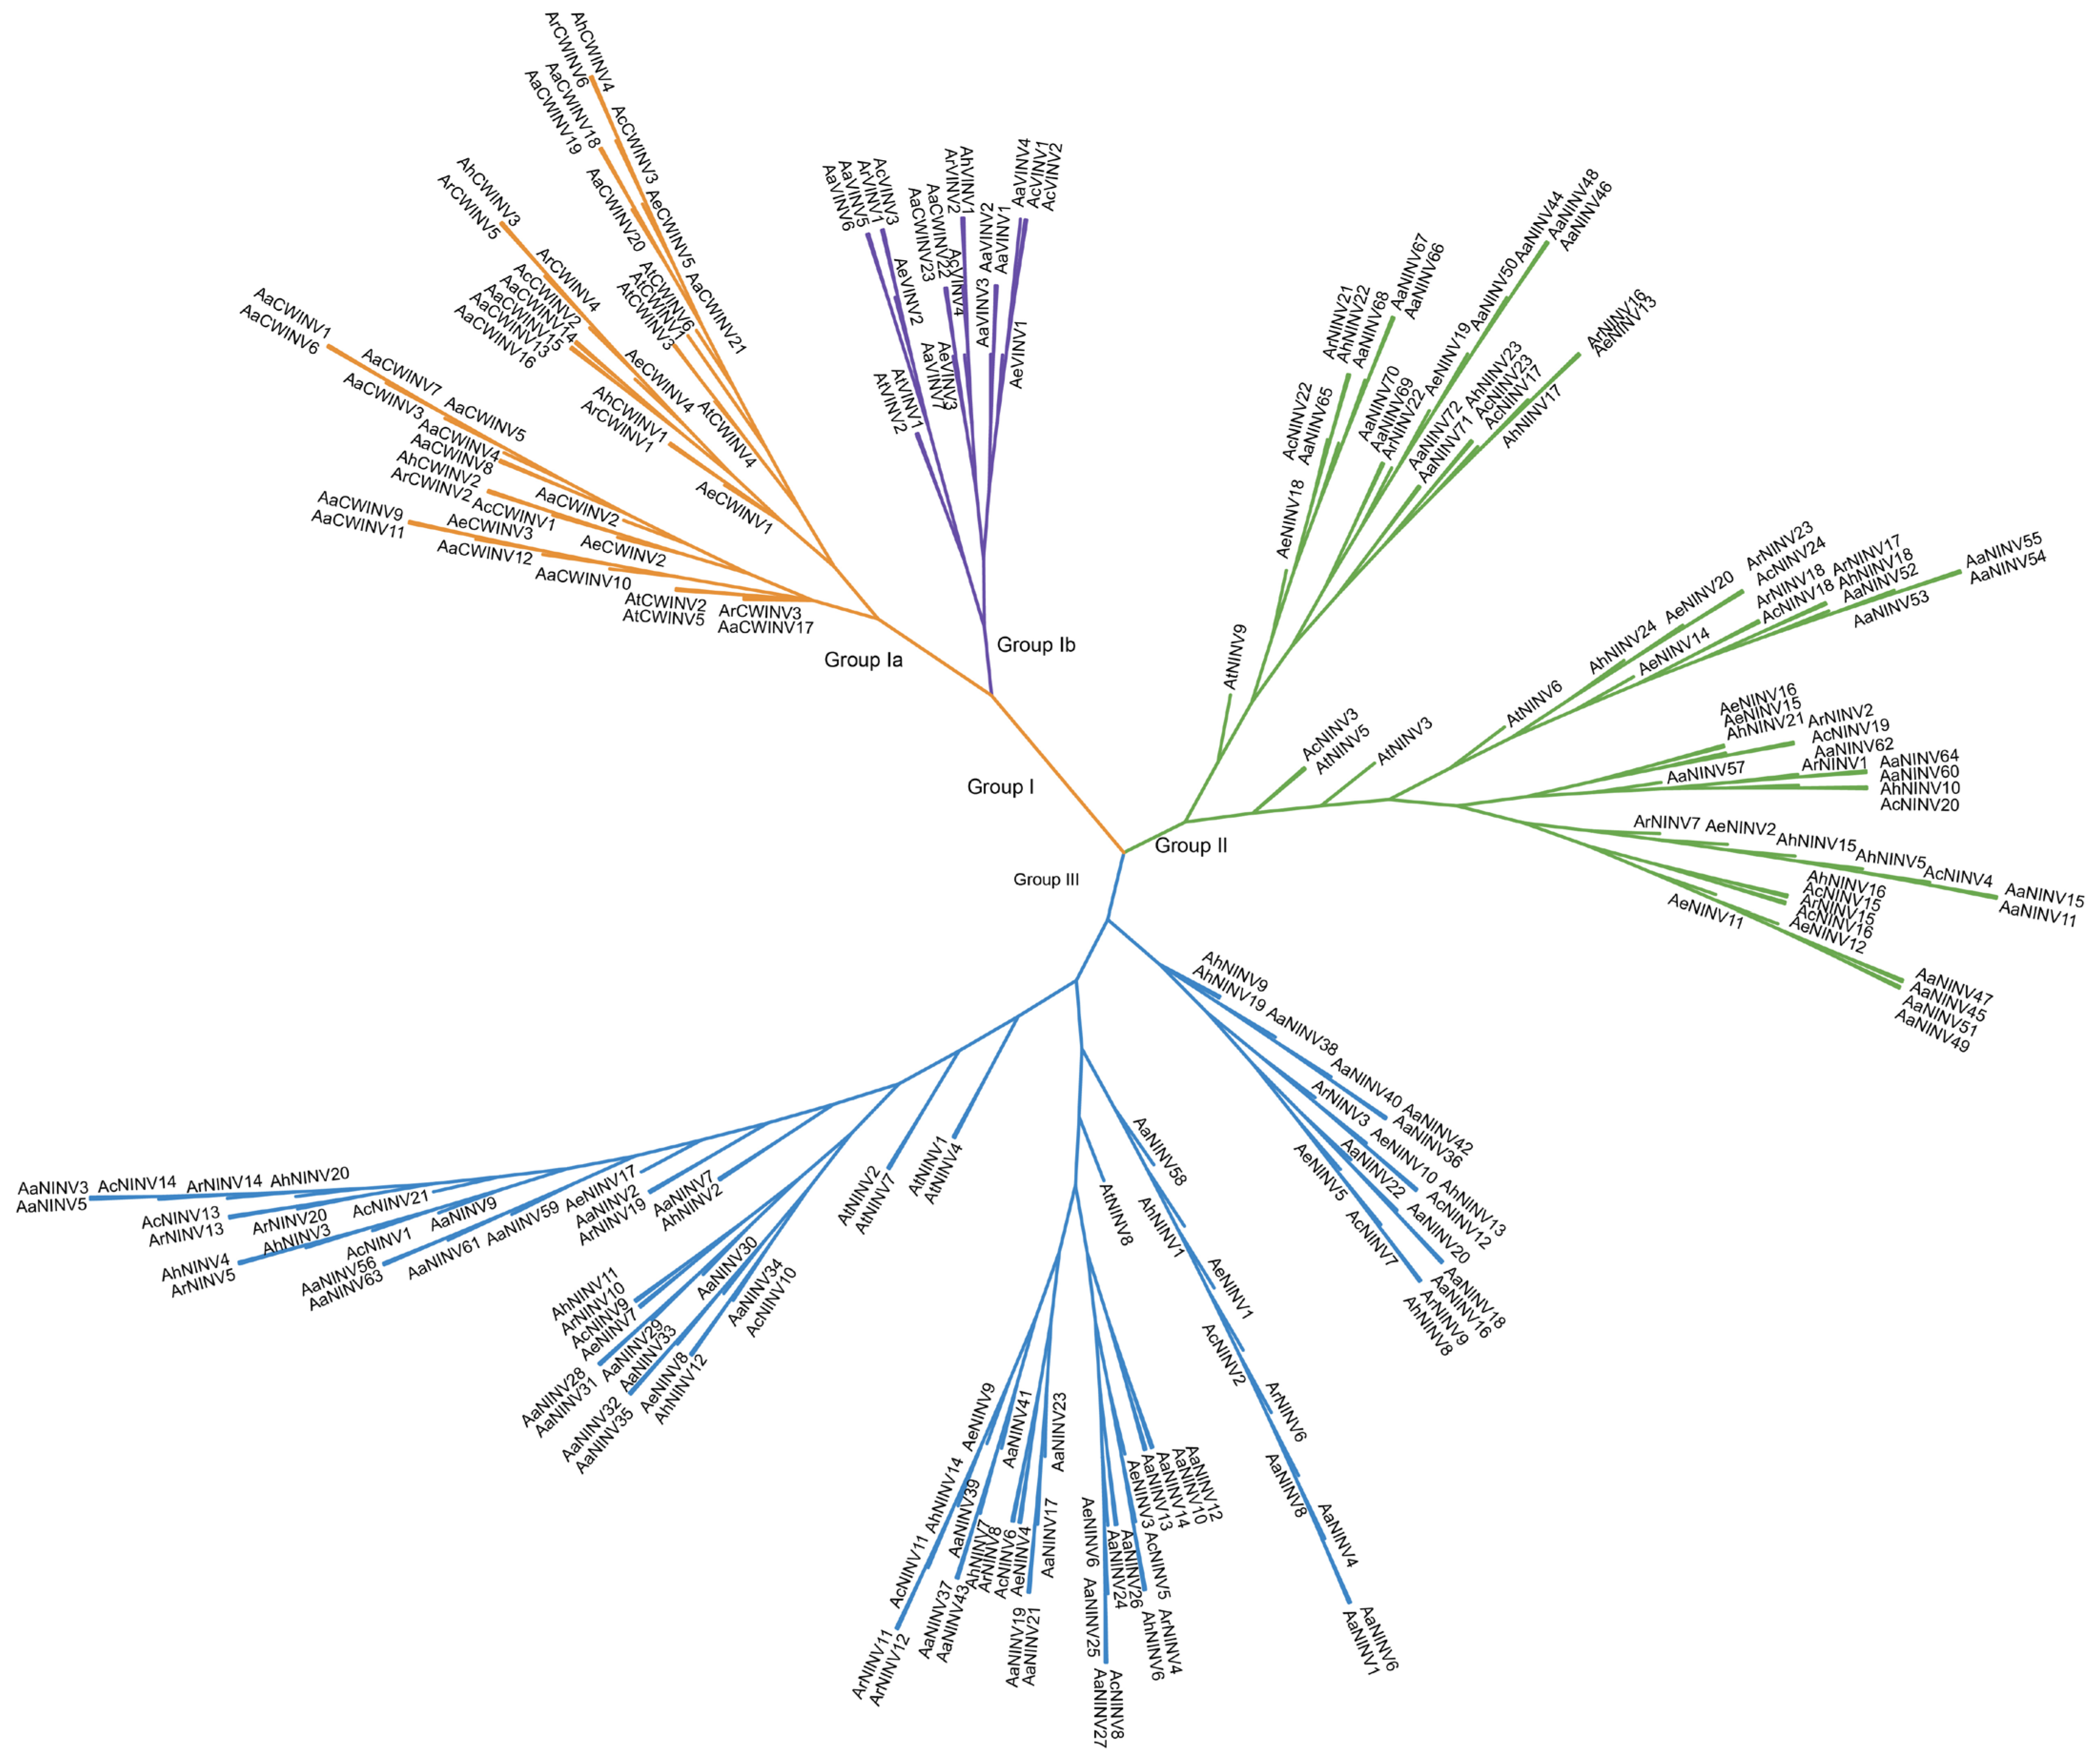
2.2. Phylogenetic Tree Construction

To further investigate the evolutionary relationships of INV proteins, an NJ phylogenetic analysis containing 17 protein sequences from Arabidopsis and 221 from A. arguta, A. chinensis, A. eriantha, A. hemsleyana and A. rufa was performed (Tables S2 and S3). The INV gene family from the six species was classified into three main phylogenetic clades (Group I, Group II and Group III), in which Group III and Group I were the largest and smallest subgroup with 101 and 66 INV proteins, respectively (Figure 1). NINVs could be subdivided into Group II and Group III. Group I further divided into two distinct subgroups, Group Ia and Group Ib, which correspond to the VINVs and CWINVs located in the vacuole and cell wall, respectively (Figure 1). The results above indicated that INV proteins of five Actinidia species and Arabidopsis were unevenly distributed in all subgroups. The phylogenetic analyses suggest that the INVs in each branch evolved independently.

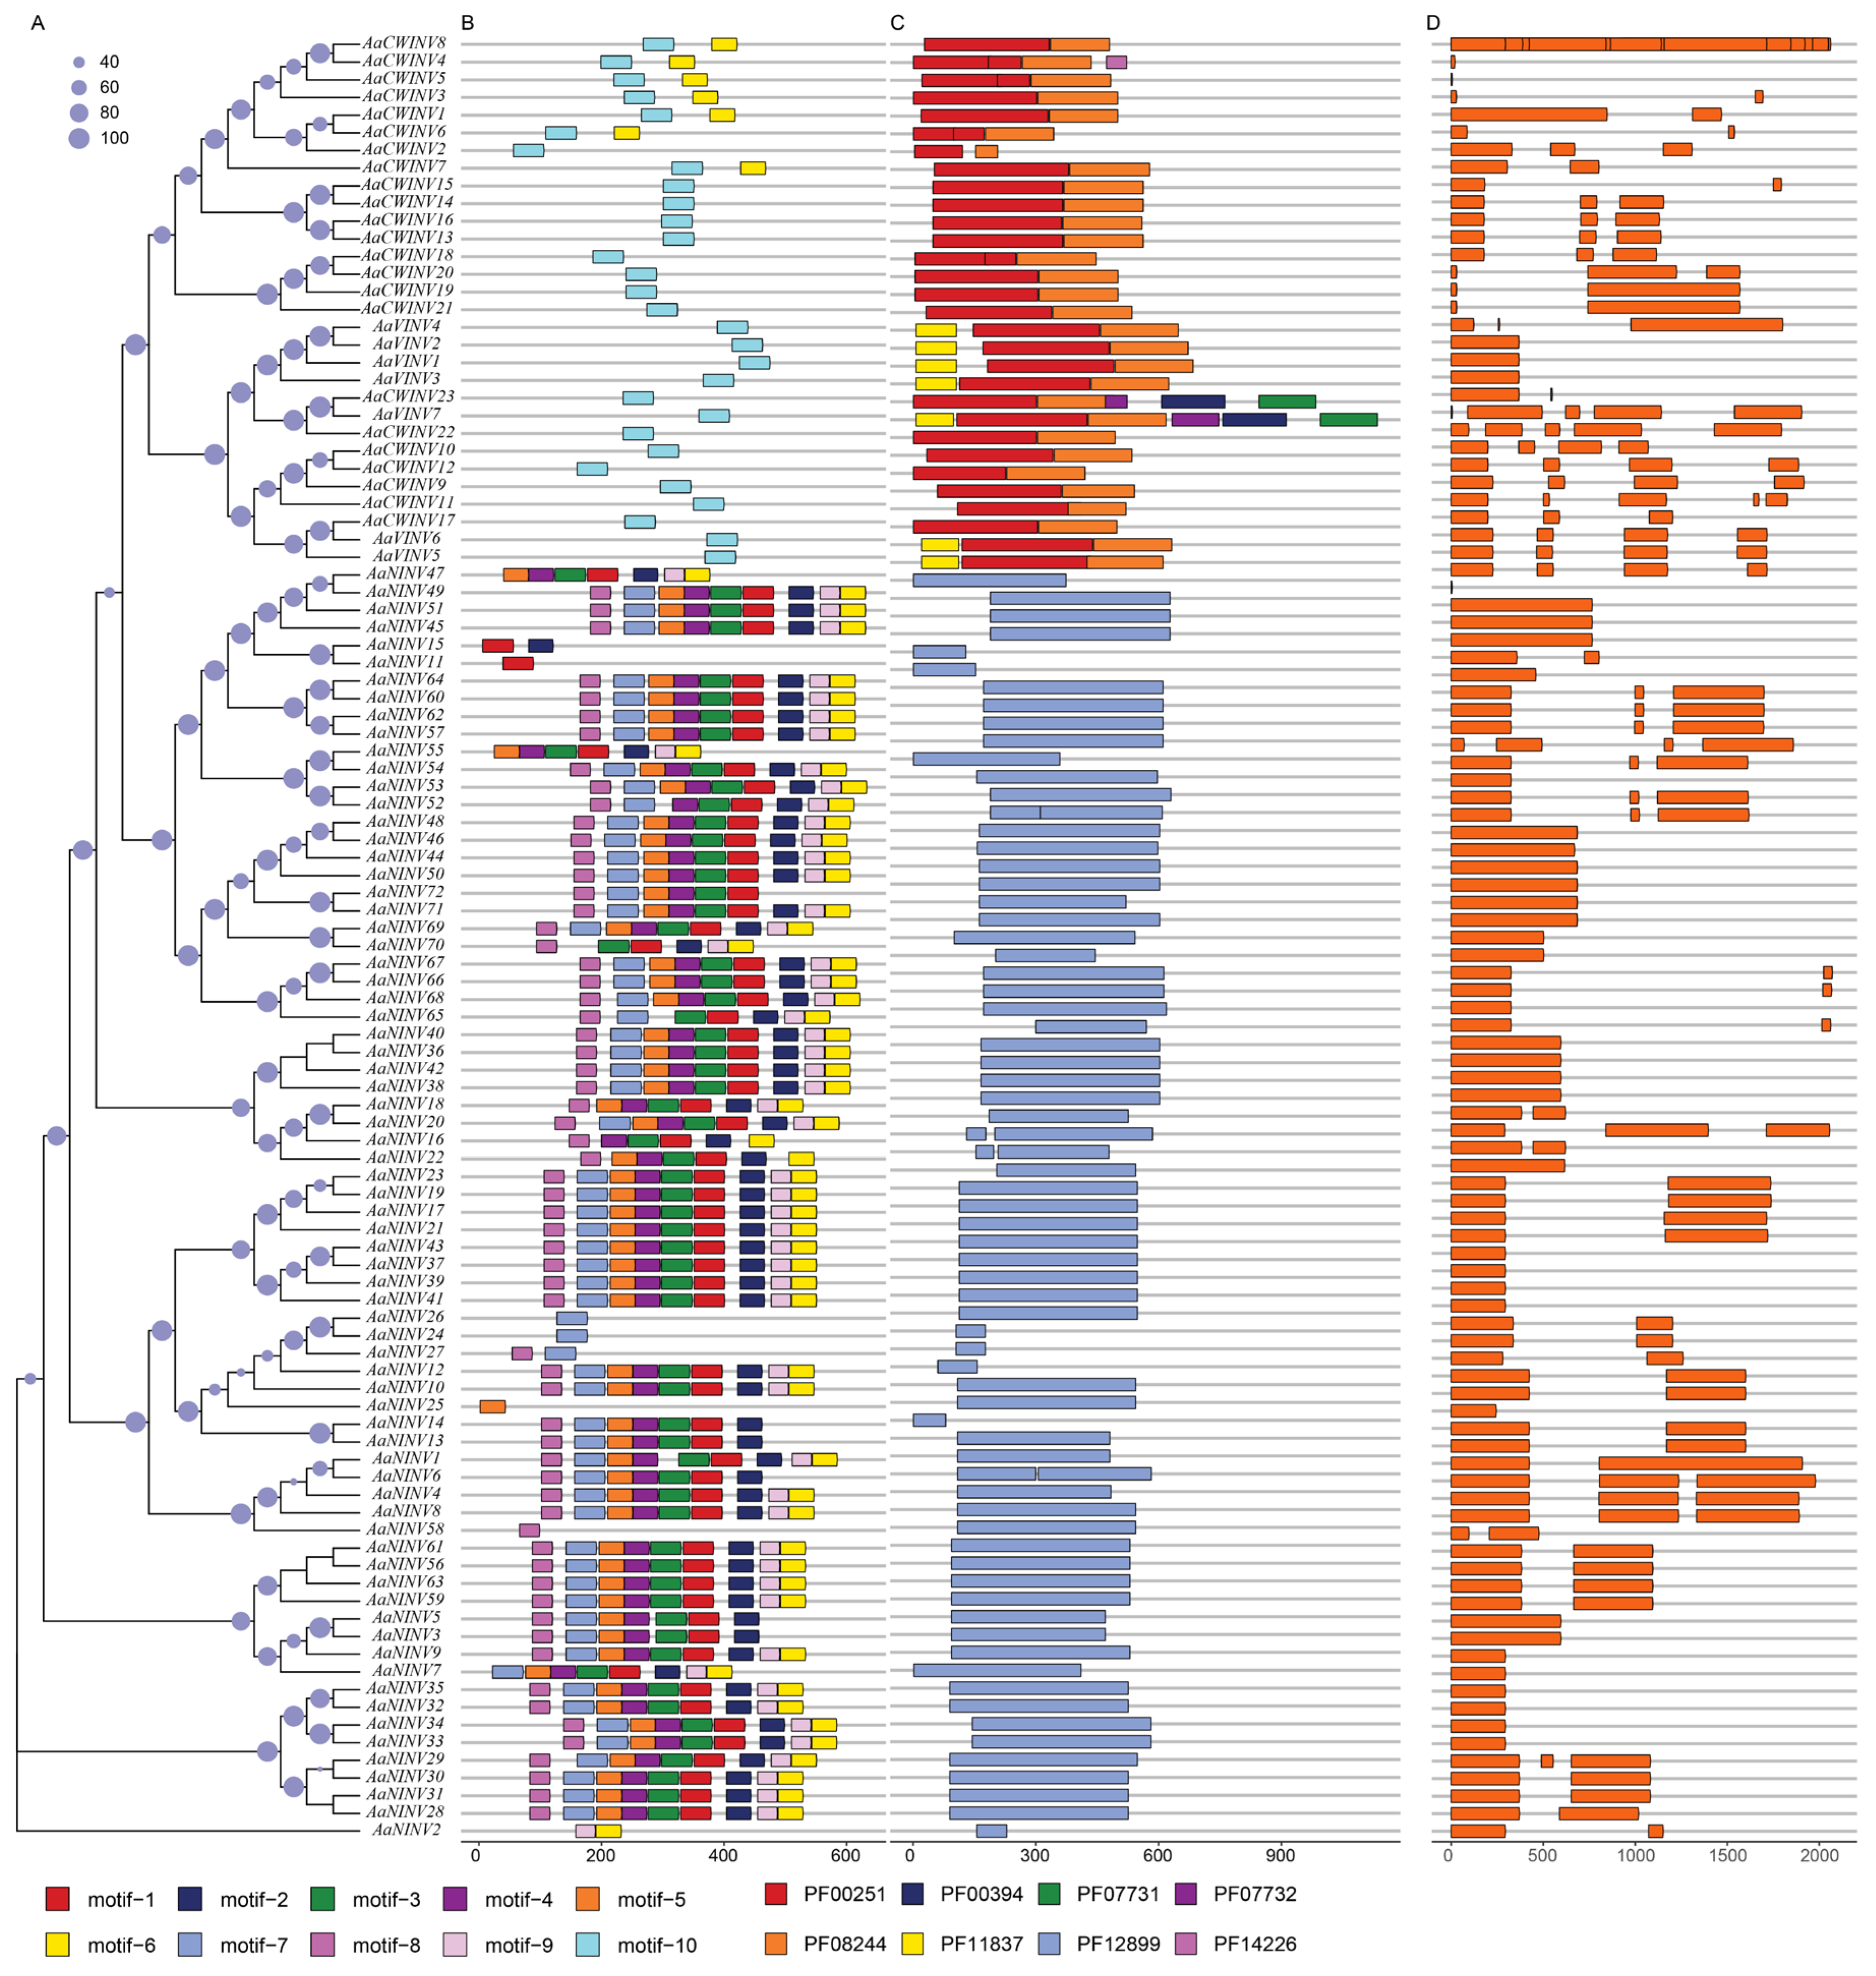
2.3. Gene Structure and Conserved Motif of AaINVs

To examine the characteristic regions of AaINV proteins, the conserved motifs for each AaINV were explored by MEME v5.5.3. There were a total of 10 motifs identified in the AaINVs, and more than 50% of AaNINV members had nine motifs, corresponding to a specific domain PF12899 (Figure 2). However, motif 10 were exclusively found in the subgroups AaCWINV and AaVINV and were located on two functional domains (PF00251 and PF08244), but could not be presented in AaNINV, indicating a functional divergence within the AaINV gene family. We further compared the DNA sequences and examined the intron/exon arrangement of each AaINV gene in kiwifruit. In total, the number of exons in the AaINVs ranged from one to thirteen, and genes from the same category displayed high similarity. Notably, the AaVINVs possessed the most exons, with an average of only 1.7, whereas AaCWINVs typically contained three or more exons on average (Figure 2).

2.4. Chromosomal Distribution and Gene Duplication Analyses of the AaINV Gene Family

According to the genome annotation of A. arguta, the 102 identified AaINV genes were unevenly distributed on 17 of the 29 chromosomes (Chrs). The largest number of AaINVs was mapped onto Chr14 with 12 AaNINV and 4 AaCWINV genes, followed by Chr4/21 with 9 AaNINV members each. Chr7/12/19/20 contained eight AaINVs members each, and only two genes, AaCWINV17 and AaVINV5, were located on Chr18 (Figure 3). Notably, we observed that some genes within the same subfamily displayed gene clusters, such as the AaNINV cluster on Chr4, Chr19 and Chr21, AaCWINV on Chr12 and AaVINV on Chr3 (Figure 3).
To further explore the expansion pattern of the AaINVs, we detected three types of duplication events throughout the AaINV genes. In total, 97 out of 102 AaINVs (95.10%) experienced whole-genome duplication (WGD) events in kiwifruit according to the MCScanx method (Table S4). Otherwise, only AaCWINV4 underwent tandem duplication (TD), and three AaCWINV genes (AaCWINV2, AaCWINV6 and AaCWINV8) exhibited proximal duplication (PD) (Figure 3; Table S4). The duplication analysis indicated that WGD events were the driving force for the expansion of INVs in kiwifruit.

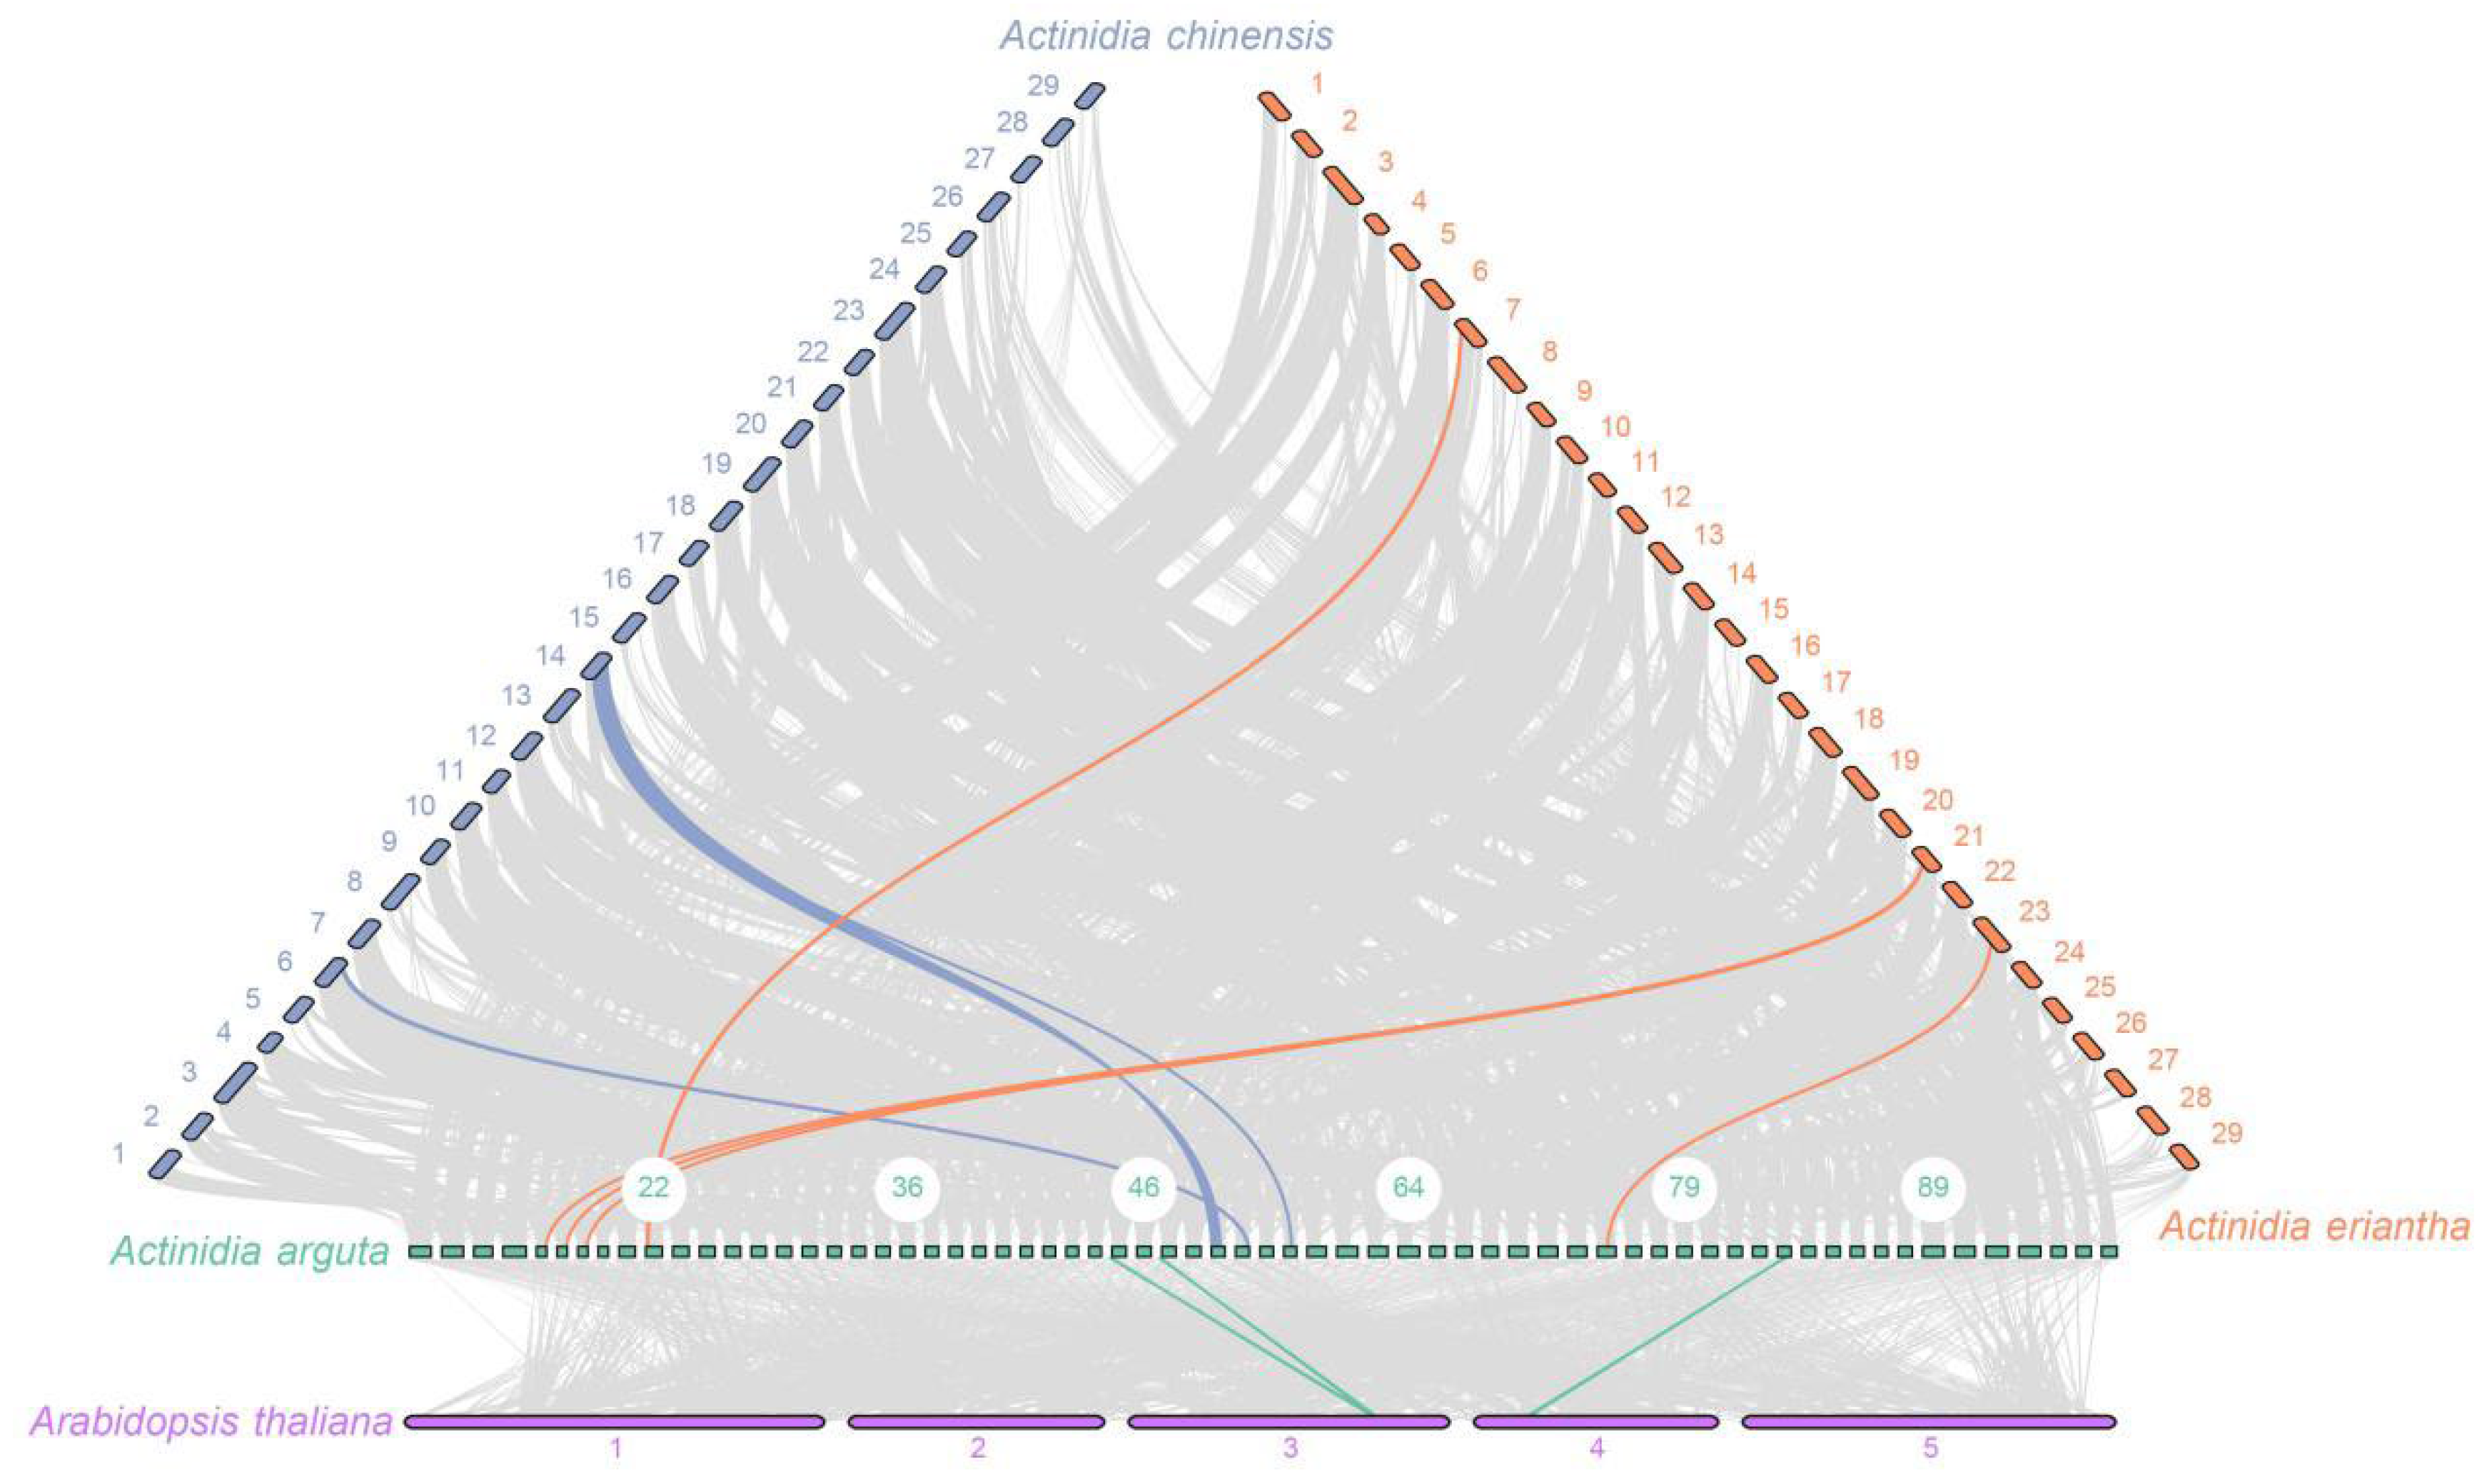
2.5. Collinearity Analysis and Selective Pressure

To investigate the potential evolutionary clues of INVs, a comparative syntenic map was constructed, comparing A. arguta with three other species (Arabidopsis, A. chinensis and A. eriantha). The collinearity predictions presented three INV orthologous gene pairs shared between Arabidopsis and A. arguta. Meanwhile, we observed that there were three and five pairs of collinear INV genes shared with A. chinensis and A. eriantha, respectively (Figure 4). We also noticed that the collinear genes clustered within the same evolutionary branch (Figure 2), suggesting that these genes may share similar functions.
Furthermore, Ka/Ks ratios were computed to understand evolutionary selection for the duplicated AaINV genes (Table S5). We found that the majority of Ka/Ks ratios for AaINV gene pairs were <1 (Table S5), indicating that these genes experienced extensive purifying selection during evolution. Interestingly, positive selection (Ka/Ks > 1) occurred in the AaCWINV gene pair (AaCWINV18/AaCWINV21), suggesting that the AaCWINV genes may have undergone positive selection and experienced a rapid evolutionary rate during kiwifruit domestication.

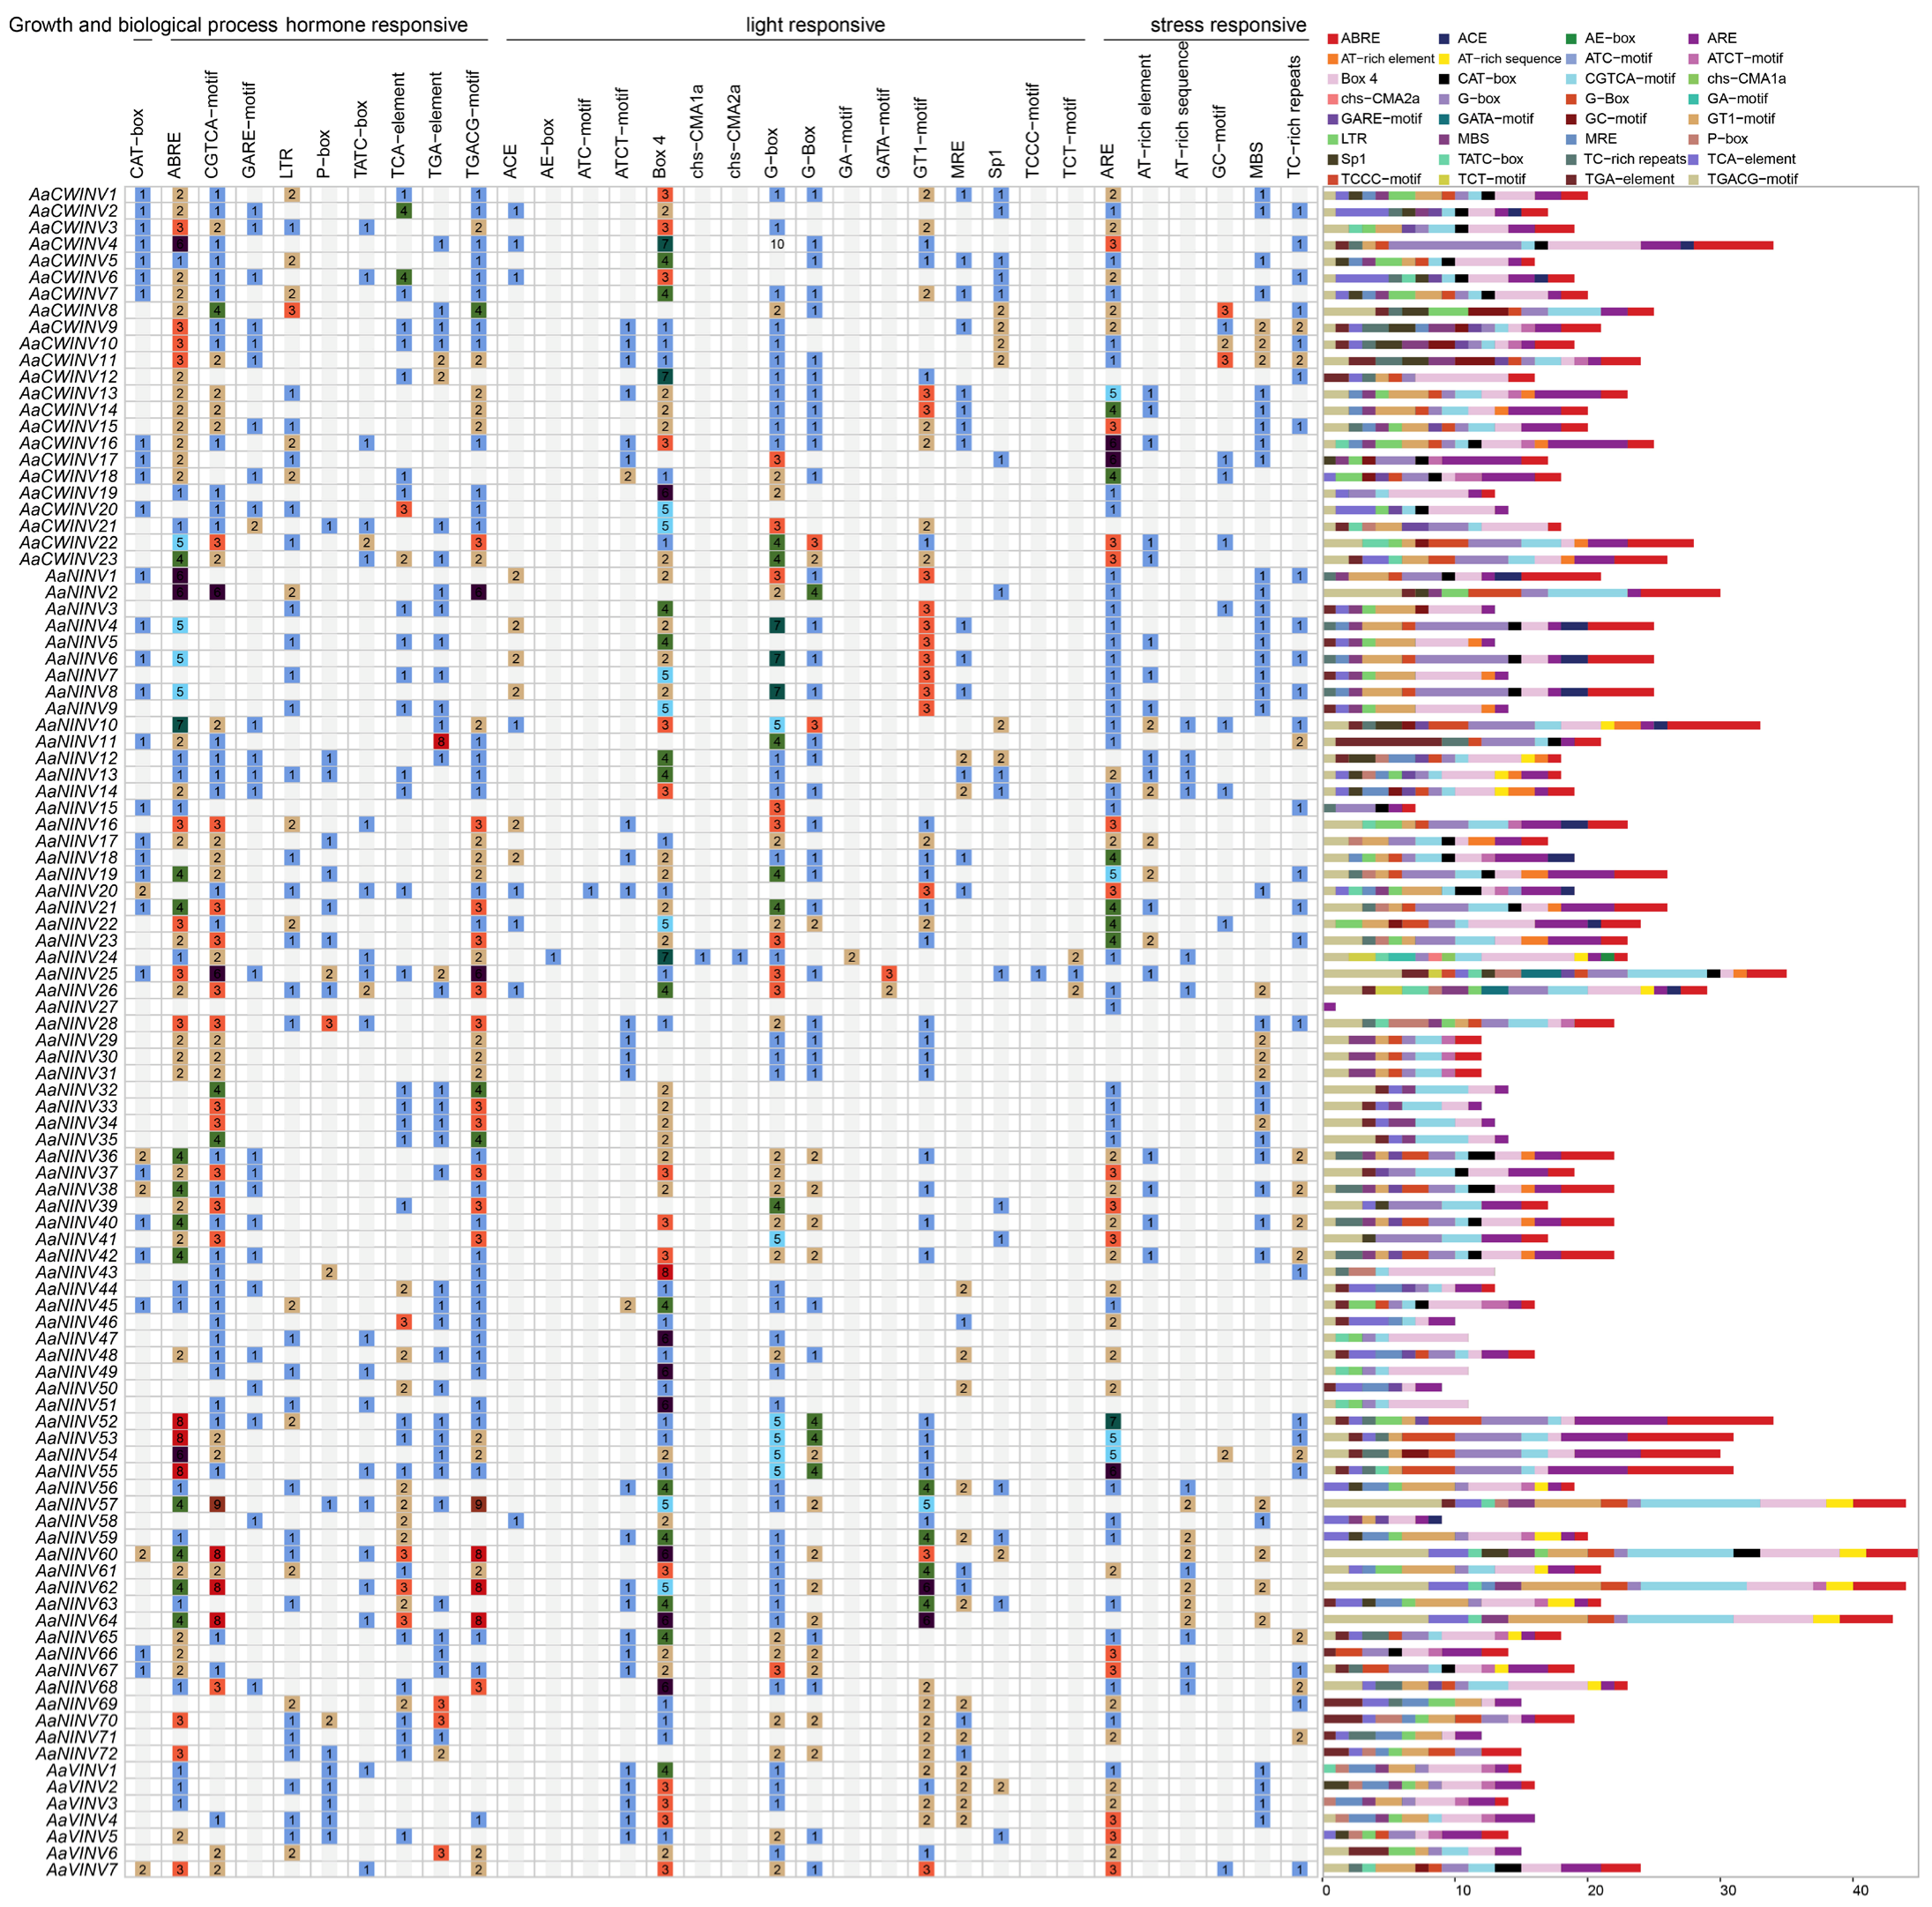
2.6. Cis-Acting Element Analysis of AaINV Gene Family

The identified cis-elements were assigned to the following four distinct groups: growth and biological process, hormone-responsive, light-responsive and stress-responsive, based on their putative functions. Among them, several common cis-elements that were widely observed in the promoter regions of most AaINVs, including four responsive to methyl jasmonate (MeJA, CGTCA-motif and TGACG-motif), abscisic acid (ABA, ABRE) and salicylic acid (SA, TCA-element), two responsive to light (Box 4 and G-box) and two responsive to abiotic stress (ARE and MBS) (Figure 5). Interestingly, all AaINV members possessed the cis-elements associated with photoresponsiveness, which suggests that AaINVs are broadly involved in the transport of synthesized photoglycosides and other secondary metabolites. Additionally, we found that varying numbers of regulatory elements were identified in the upstream promoter regions of the AaINVs. For instance, 13 to 34 regulatory elements occurred in the promoter region of the AaCWINVs, while 14 to 24 were identified in AaNINVs (Figure 5). The diversity of cis-acting elements in the promoter regions of AaINVs suggests that their functions may be regulated by a complex network involving stress responses, hormonal regulation and plant growth and development.

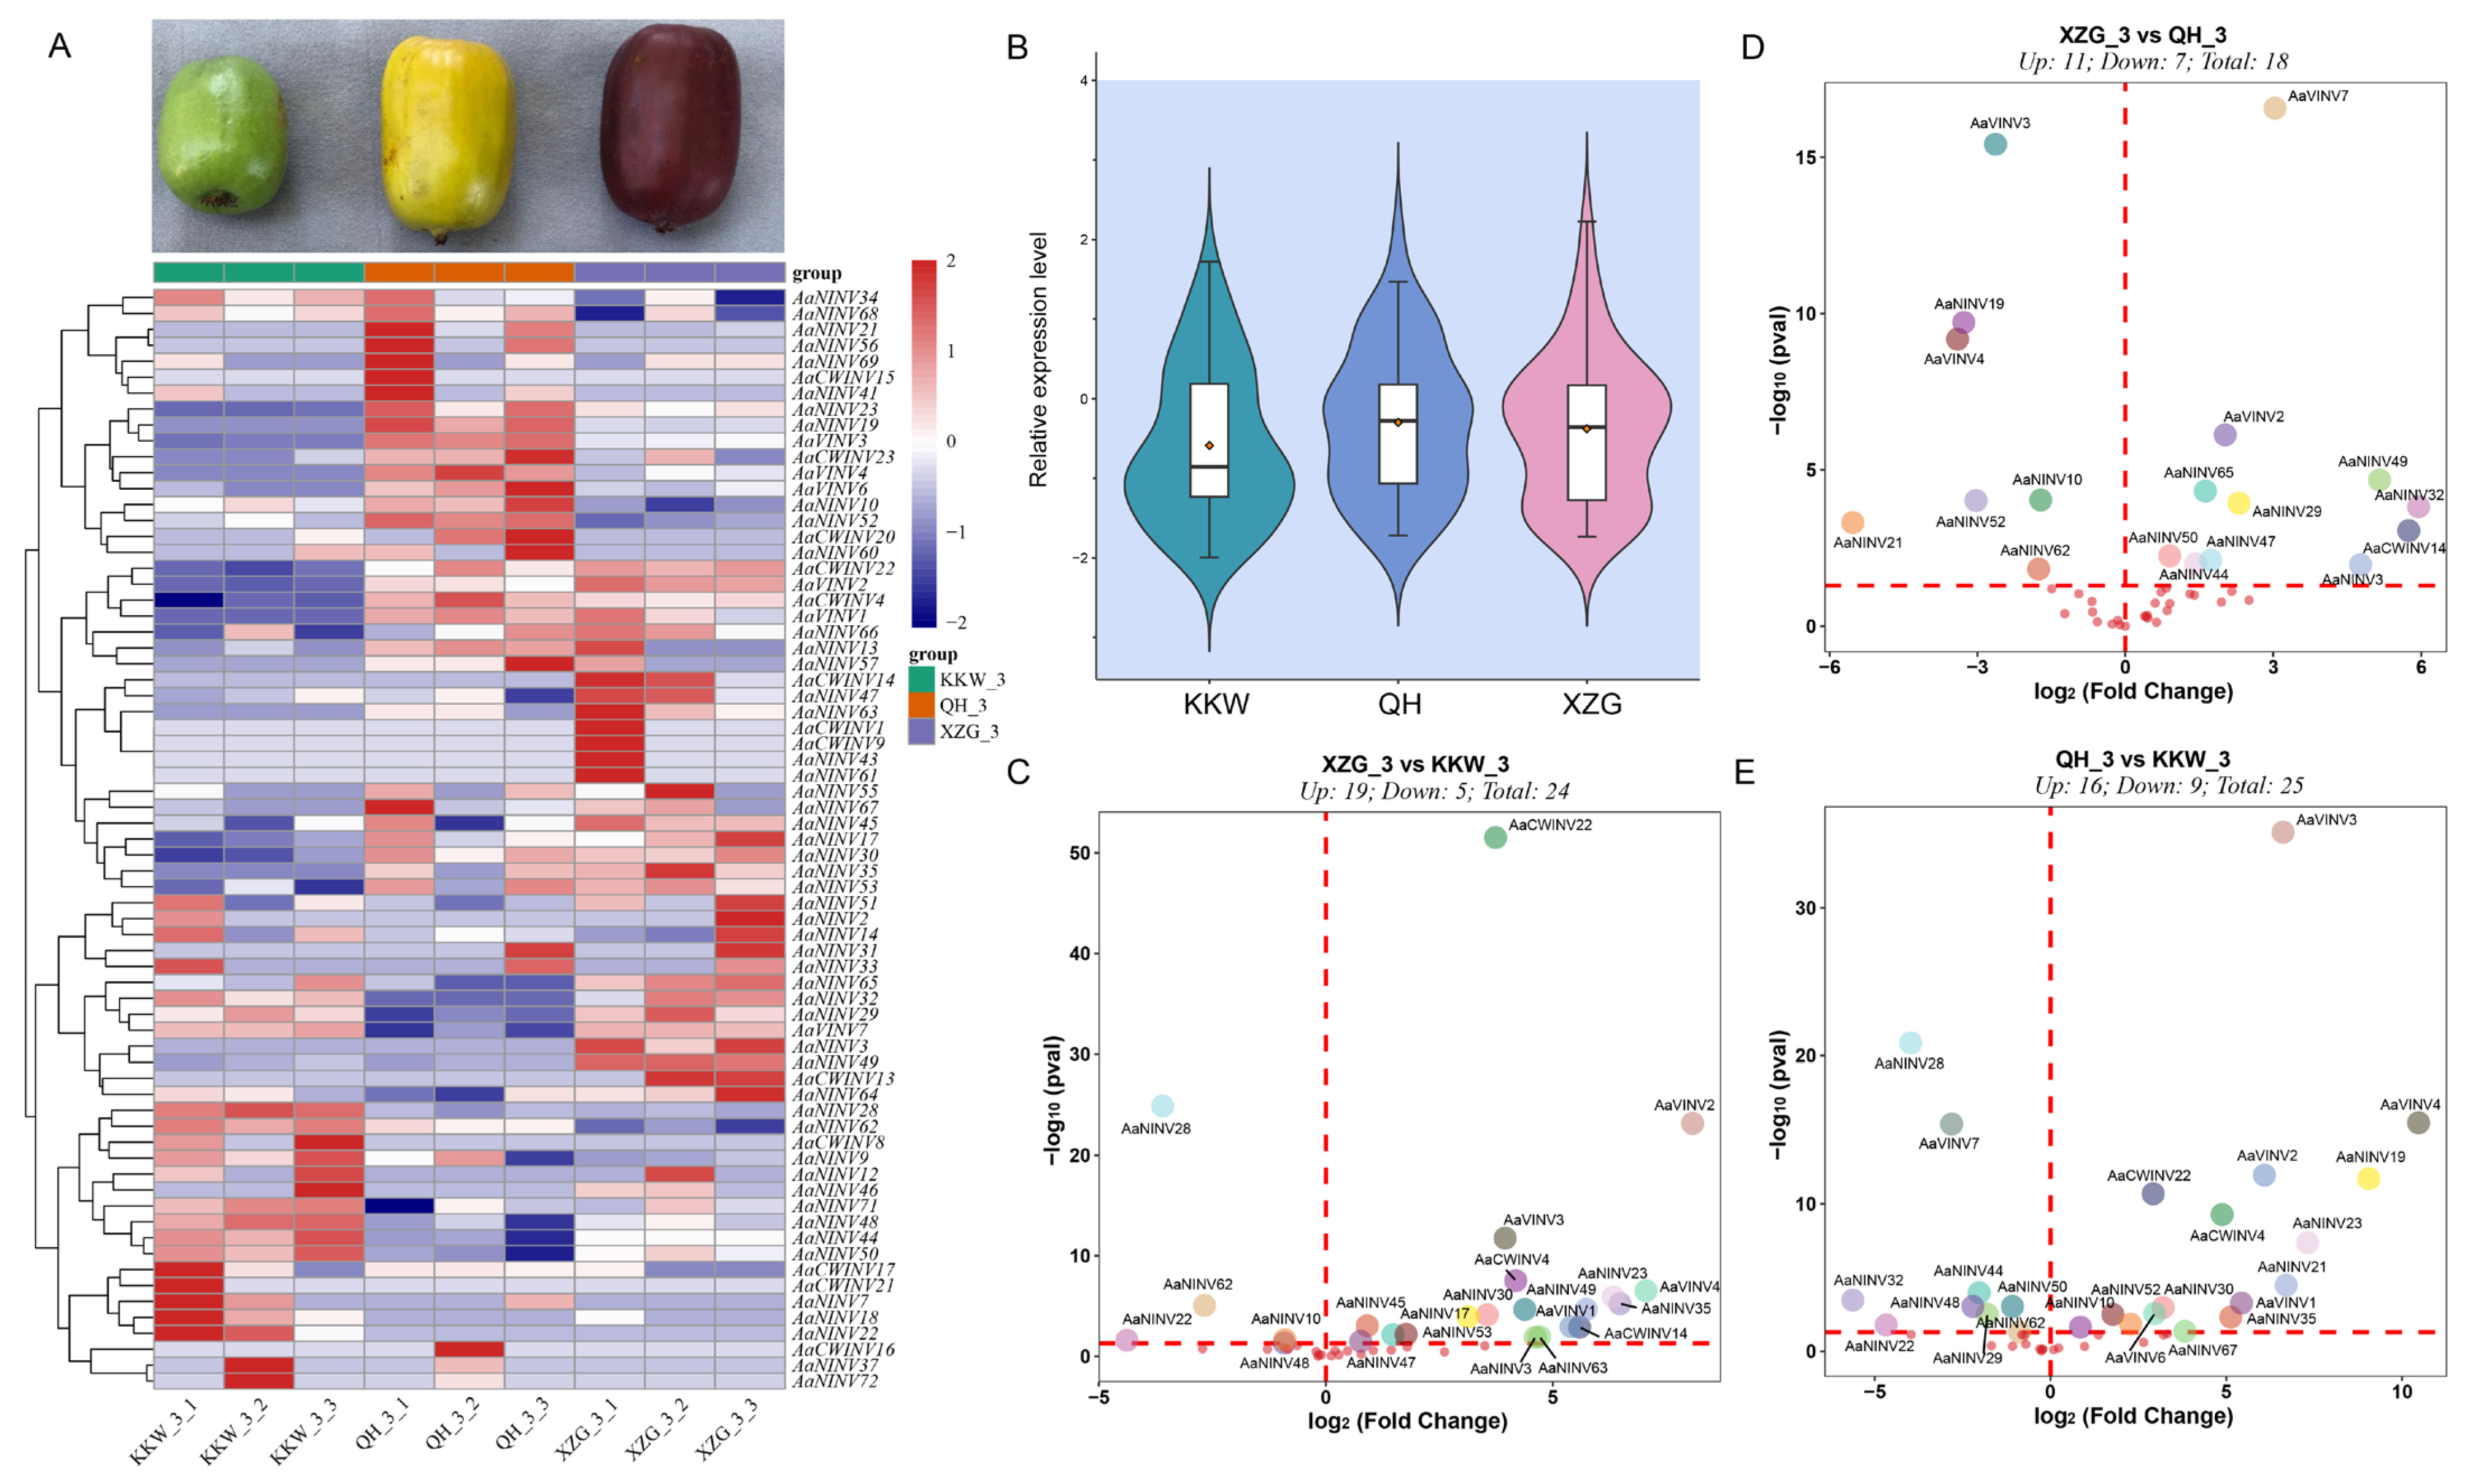
2.7. Genome-Wide Expression Analysis of AaINV Genes in Different Varieties

To further explore the functions of the AaINV family genes, we examined their expression patterns in three A. arguta varieties using RNA-seq data (Table S6). A total of 102 transcripts were annotated as AaINVs in A. arguta, as shown in Figure 6. Pearson correlation coefficient analysis indicated that their expression levels were highly correlated (Pearson’s r > 0.85, p < 0.05), such as AaCWINV1/AaCWINV9, AaNINV32/AaNINV65, AaCWINV4/AaVINV6 and AaVINV7/AaNINV29. However, the expression patterns of AaINV genes varied at fruit maturity stage among different A. arguta varieties (Figure 6A,B and Figure S2). Specifically, we observed significant upregulation of 11, 19 and 16 AaINV genes, respectively, and downregulation of 7, 5 and 9 genes, respectively, between XZG vs. QH, XZG vs. KKW and QH vs. KKW (Figure 6C,D). For instance, AaVINV3, AaVINV4, AaVINV7 and AaNINV19 were significantly upregulated between XZG vs. QH and QH vs. KKW, whereas AaCWINV22, AaNINV28, AaVINV2 and AaVINV3 were specifically upregulated between XZG vs. KKW. Interestingly, several AaINV genes exhibited significantly differential expression among varieties, e.g., AaVINV3, AaVINV4, AaNINV19 and AaNINV21 (Figure S3). Notably, some AaINV genes displayed opposing expression patterns among different varieties. For example, AaCWINV23 and AaVINV6 were predominantly upregulated in QH but downregulated in XZG and KKW (Figure 6). These findings offer valuable insights into the diverse roles and regulatory mechanisms of AaINVs, highlighting their functional diversity and ubiquitous expression patterns.

2.8. GO Functional Annotation of AaINV Genes

To better understand the functional roles of AaINV genes, we used the GO database to analyze their potential biological roles. There were nine functional terms obtained with 102 AaINVs (Figure S4). The most abundantly enriched category was the sucrose catabolic process, endo-alpha-N-acetylgalactosaminidase activity and sucrose alpha-glucosidase activity, which are closely associated with the sucrose metabolic process. Secondly, nine AaINVs were enriched in the trehalose biosynthetic process, indicating that these genes play a crucial role in trehalose accumulation during the ripening of kiwifruit. Furthermore, the regulation of seed germination was also significantly enriched with four AaINVs, therefore INVs may potentially have key regulation roles during seed and fruit development.

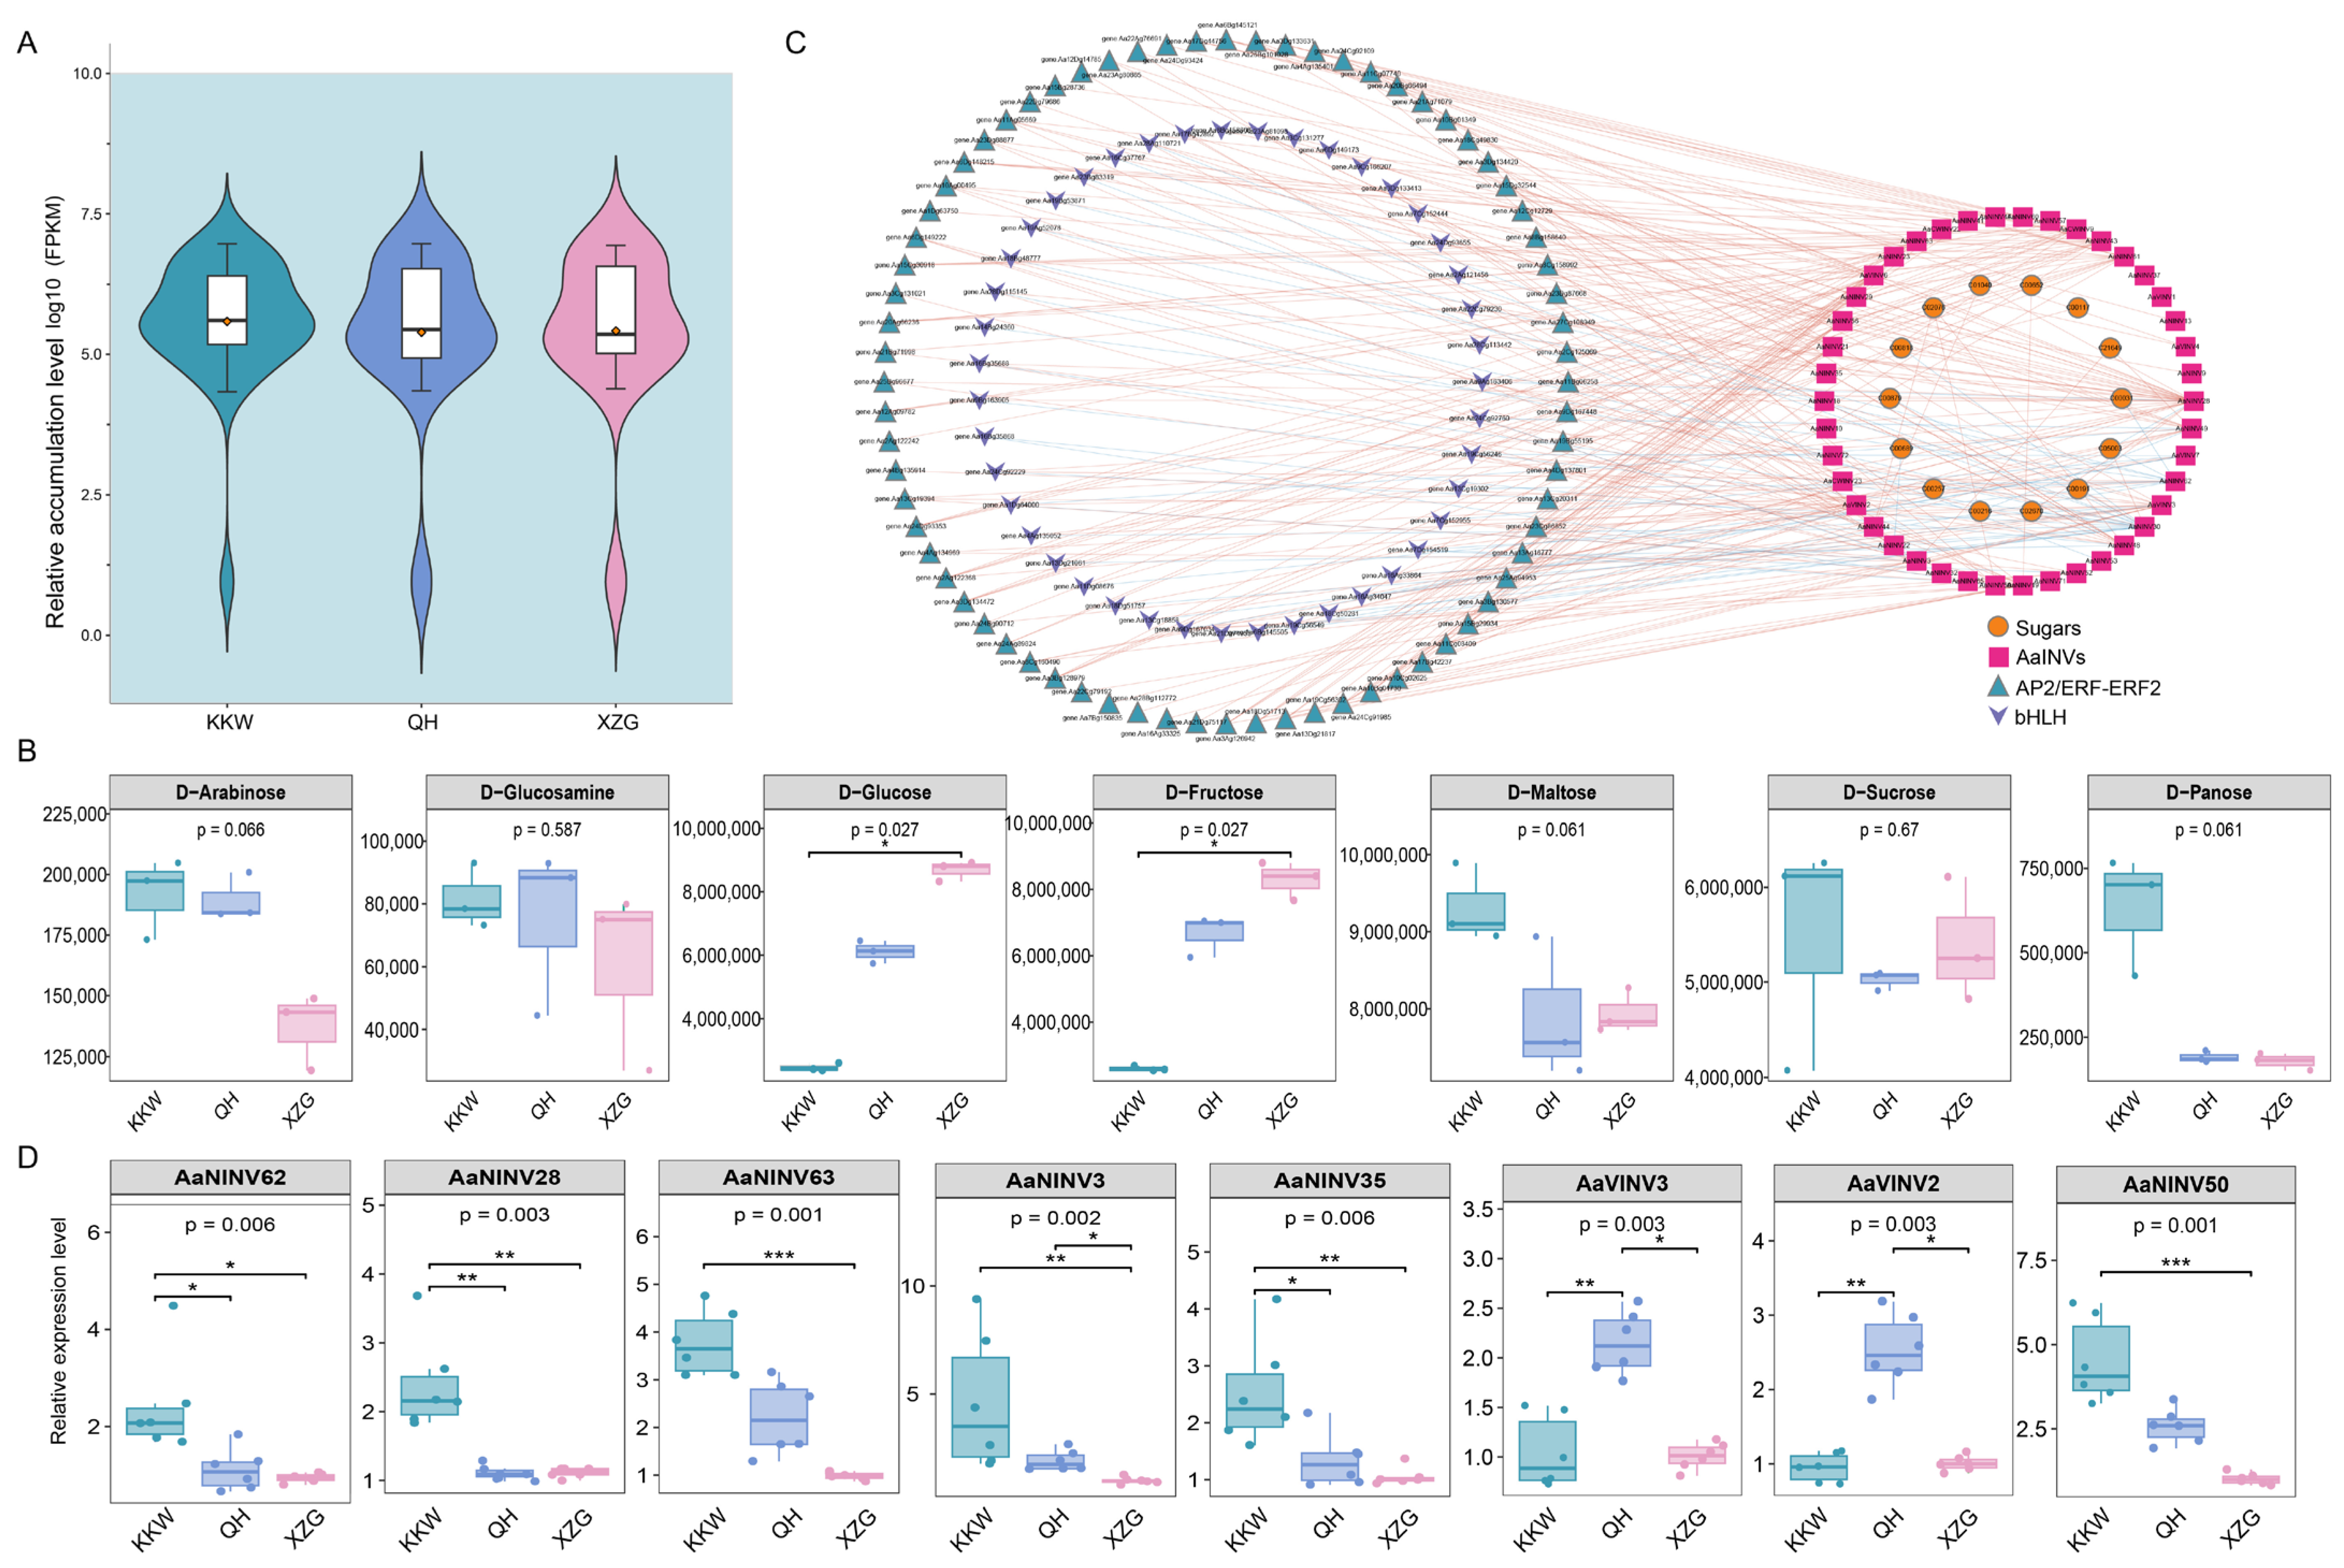
2.9. Correlation Analysis Between AaINVs Expression and Sugar Content in Kiwifruit

To analyze whether the expression levels of AaINVs are correlated with sugar metabolism measured in mature kiwifruit, we calculated the Pearson correlation coefficient (PCCs) between 102 AaINVs and 30 metabolites such as sucrose, fructose, glucose, etc. (Tables S7 and S8). Globally, the green samples (KKW) contained more sugar metabolites than the yellow and purple samples did (Figure 7A). In contrast, XZG samples had high fructose and glucose content as compared to that of KKW and QH; QH samples were more endowed with glucosamine metabolites (Figure 7B). These results suggest a high variation in the sugar metabolism of these three varieties.
A total of 42 AaINV genes, including 3 AaCWINVs, 6 AaVINVs and 33 AaNINVs, were screened according to GO enrichment, and their expression was highly correlated with the accumulation of various metabolites (Figure S5; Table S8). For instance, the expression patterns of AaCWINV22 and AaNINV18 were highly correlated with fructose, glucose and gluconic acid. Furthermore, the expression of three AaINV genes (AaNINV3, AaNINV35 and AaNINV63) were significantly positively correlated with fructose and glucose content. However, AaNINV18, AaNINV22, AaNINV28 and AaNINV62 had a negative correlation with fructose and glucose concentration. In particular, the expression of AaNINV12 was consistent with that of sucrose content, while AaNINV13 and AaNINV66 were negatively correlated with sucrose content.
To investigate the key TFs modulating the activation of the candidates encoding enzymes of sugar accumulation in kiwifruit, we further identified two TF families containing 176 bHLH and 222 AP2/ERF-ERF2. These candidates displayed expression specificity in the three kiwifruit varieties (Figure S6). Subsequently, we performed correlation analysis on the obtained candidates and 14 sugar components (Table S8). Furthermore, the potential regulatory networks mediated by these candidates were then constructed using Cytoscape v3.7.1 (PCC > 0.9, p < 0.05) (Figure 7C). Our analysis revealed strong connectivity between the TFs and the AaINV genes (e.g., AaNINV28, AaNINV30, AaNINV49, AaVINV3 and AaVINV6), highlighting their role in regulating sugar metabolism during the ripening of kiwifruit.

2.10. Validation of AaINV Expression by RT-qPCR

To verify the results of RNA-seq, we checked the expression of five genes, including AaVINV2, AaVINV3, AaVINV7, AaNINV45 and AaNINV50 genes, via qRT-PCR in the three kiwifruit varieties (Figure 7D). The results indicated that the expression levels of these genes were altered in colored accessions. Notably, the expression levels of AaVINV2, AaVINV3 and AaVINV7 were significantly upregulated in QH, whereas the expression of AaNINV45 and AaNINV50 exhibited upregulation in KKW. These results suggest that AaINV genes play complex regulatory roles in kiwifruit.

3. Discussion

INVs have a pivotal role in coordinating carbohydrate metabolism, stress responses and sugar signaling, as well as improving fruit quality [5,42,43,44]. The first INVI was isolated in potato (Solanum tuberosum) [45] and then characterized as a large protein family in multiple plants, with 21 members in maize (Zea mays) [46], 29 in moso bamboo [7], 24 in tomato [16] and 36 in tobacco [4]. However, a genome-wide identification of the INV gene family in kiwifruit has not been reported. With the advancement of third-generation sequencing technology, a high-quality reference genome of A. arguta “M1” has been assembled [41], providing a valuable resource for analyzing the INV gene family in kiwifruit. In this study, we identified and systematically named 102 INV members based on their chromosomal positions in A. arguta, which exceeds the number of genes found in Arabidopsis and other Actinidia species (Table S3). This difference may have occurred because INVs have expanded in the Actinidia species. Gene duplication and divergence are known to play key roles in the expansion of gene families and the development of novel gene functions during evolution [47]. The kiwifruit genome has experienced at least three rounds of WGD, followed by segmental duplication and tandem duplications [41]. These events are believed to be responsible for the expansion of the INV gene family during evolution [7,48]. Similar results have also been discovered in bamboo and tobacco [4,7]. Nevertheless, most of the duplicated gene pairs showed a Ka/Ks ratio of less than 1, suggesting that the ArINV genes were subject to purifying selection, resulting in limited functional divergence after duplication.
Among the known classifications, the INV family is classified into two categories based on their cellular location: AINVs (including CWINVs and VINVs) and NINVs [6,16]. Our analysis demonstrated a high correlation between the phylogenetic relationships, intron–exon structures and protein motif distributions of AaINV members. The phylogenetic analysis clustered ArINVs into Ia and Ib, which correspond to the CWINVs and VINVs subgroups, respectively. The protein sequence analysis showed that two subgroups possessed different functional domains (PF11837 in the VINVs), which may account for the differences in their enzyme activities [49]. The NINVs were separated into group II and group III branches based on 169 NINVs from six species (Figure 1), aligning with the evolutionary characteristics of INVs [7,22]. The diversity observed in ArINVs suggests that they may have experienced distinct evolutionary pressures in kiwifruit.
INV genes play multiple functional roles in different fruit ripening, as is evident from their expression patterns in other plant species [25,28,42]. For instance, the overexpression of the MiINV genes demonstrates that during the mango ripening stage, the levels of sucrose and mannitol show an increasing trend [28]. In tomato, RNAi-mediated knockdown of the apoplastic SlINVINH1 expression results in enhanced seed filling and higher sugar content in the fruits [42]. Here, the RNA-seq analysis revealed that the expression of AaINVs in XZG and QH fruits was higher than that in KKW (Figure 6). Combined with metabolome data, we observed in XZG and QH fruits that fructose and glucose increased and sucrose decreased, which was in line with the trend of expression of AaINVs. The complex and diverse expression patterns of AaINVs were further observed across three kiwifruit varieties, suggesting that they had different functions. For example, AaNINV3, AaNINV35 and AaNINV63 were highly expressed in XZG and showed a significant positive correlation with fructose and glucose content (Figure 6A and Figure S5). This finding aligns with studies on the homologous NINV gene in apple, which is known to play a crucial role in sugar metabolism and accumulation during fruit ripening [25]. The expression levels of AaNINV18, AaNINV22, AaNINV28 and AaNINV62 were higher in KKW compared to those in the other varieties and showed a negative correlation with fructose and glucose concentration (Figure 6A and Figure S5), suggesting their potential involvement in sucrose metabolism [5,6,25]. In contrast, the expression of some AaINVs was not detected in any of the varieties, suggesting that these may be pseudogenes, functionally redundant, or possibly expressed in other specific tissues or under certain conditions [50,51]. In addition, we selected eight AaINV members that were correlated with sugar content to further explore in three varieties by qRT-PCR. Based on the qRT-PCR result, AaVINV2 and AaVINV3 were found to be extremely highly expressed in QH, showing a strong correlation with glucose levels (Figure S5), which might contribute to sucrose accumulation in the fruits. However, five AaNINVs were highly expressed in KKW but expressed at low levels in the other varieties. These results suggest that the functions of AaINVs are diversified and complex. Studies have shown that INVs significantly effect sugar content in fruits [5,25]. Moreover, a subset of 18 to 25 genes exhibited distinct expression patterns across different kiwifruit varieties (Figure 6C,D), thereby suggesting a potential association with fruit functionality. The soluble sugars in kiwifruit, including glucose, fructose, sucrose and oligosaccharides, vary significantly among cultivars, providing a system to explore sugar accumulation mechanisms. Future research should focus on functional validation, including gene knockdown and overexpression studies, across a broader range of varieties to better elucidate the specific mechanisms by which AaINV family members regulate the complex processes of sugar metabolism and accumulation.
The modulation of sugar metabolism by the transcription factors (e.g., bHLH, ERF, NAC and MYB) has been confirmed in different horticulture crops [25,27,52]. Here, we primarily identified bHLHs and AP2/ERF-ERFs in kiwifruits, which were significantly different and highly correlated with sugar content (Figure 7 and Figure S6). As one of the largest TF families in plants, some members of the bHLH family are indicated as the key enzyme involved in carbohydrate accumulation, such as that of sorbitol, sucrose and starch in fruits [53]. ERFs are transcriptional regulators that mediate starch degradation, soluble sugar accumulation and ethylene-dependent gene expression in plants. These TFs are closely linked to fruit ripening [26,54,55]. To determine whether these TFs are involved in sucrose metabolism, we analyzed their correlations with the 42 AaINV genes. The results revealed significant correlations between the TFs and the expression of 14 AaINV genes (Figure 7). Taken together, these findings suggest that the ripening process of kiwifruit is governed by intricate regulatory networks.
In summary, a genome-wide identification and analysis of AaINV genes involved in sugar metabolism and accumulation were conducted in kiwifruit. A total of 102 AaINV genes were identified and categorized into three subgroups based on the phylogenetic tree, with the results further corroborated by gene structural domain and motif analysis. Additionally, differential expression patterns and regulatory networks offer valuable insights into the physiological functions of INV genes in kiwifruit.

4. Materials and Methods

4.1. Identification of INVs in A. arguta Genome

The genome details of A. arguta were downloaded from the China National GeneBank (Table S1). The candidate INV members were predicted using HMMER v3.3.2 [56] and PFAM [57] according to the INV conserved domain (NINV: PF12899; CWINV: PF08244 and PF00251; and VINV: PF11837, PF08244 and PF00251). Then, these members were further confirmed by a local BLASTP v2.15.0+ (E ≤ 1 × 10⁻⁵) search against 17 INV genes from Arabidopsis (Table S1). The redundant hits obtained from the Hidden Markov Model (HMM) profiles and BLASTP v2.15.0+ searches were manually eliminated. The physicochemical properties (e.g., AA, MW and theoretical pI) of AaINV proteins were calculated via ExPASy [58]. The subcellular localization of candidates was predicted by subCELlular LOcalization predictor: CELLO v2.5 (http://cello.life.nctu.edu.tw/ (accessed on 10 October 2024)).

4.2. Phylogenetic Tree Analysis

To classify the evolutionary relationships of the INV gene family, the INV protein sequences of Arabidopsis, A. arguta, A. chinensis, A. eriantha, A. hemsleyana and A. rufa were imported into MEGA v11 [59], and multiple sequence alignments were performed using MUSCLE with the default parameters. The phylogenetic tree based on the alignments was constructed using the neighbor-joining (NJ) method with Bootstrap tests on 1000 resamples.

4.3. Chromosomal Location, Gene Duplication and Collinearity Analyses

The physical position of AaINV genes on the chromosomes was obtained from the database of the A. arguta genome using the R package Circlize v0.4.15 [60]. The possible segmental duplication and tandem duplication events were analyzed through BLASTP (E ≤ 1 × 10⁻⁵) and MCScanX in TBtools v2.084 [61,62]. The JCVI was adopted to conduct the collinearity analysis of the orthologous INV genes between A. arguta and Arabidopsis, A. chinensis and A. eriantha [63]. To estimate the evolution of AaINV genes, KaKs_Calculator v2.0 was used to compute the nonsynonymous (Ka) and synonymous (Ks) substitution ratio of duplicate gene pairs, with Ka/Ks < 1 or Ka/Ks > 1 indicating purifying selection or positive selection, respectively [64].

4.4. Gene Structure, Conserved Motif and Domain Analysis of AaINV Members

The conserved structural domains of kiwifruit AaINV proteins were extracted from GSDS v2.0 [65]. The motifs of kiwifruit AaINV proteins were analyzed using the Multiple Em for Motif Elicitation (MEME) v5.5.3 with the motif number set to 10 [66]. In order to investigate the cis-acting regulatory elements, the 2k bp upstream of the coding regions of the candidates were retrieved from the kiwifruit genomes (A. arguta “M1”). The cis-acting elements were predicted by PlantCARE [67].

4.5. Expression Profiles Analysis of AaINVs in A. arguta Based on RNA-Seq Data

To analyze the AaINV genes expression profile at fruit-ripening stages, the raw reads of the nine mature fruit samples were generated from three A. arguta varieties, namely “Kukuwa” (KKW, full-green flesh), “Qinhuang” (QH, yellow) and “Xianziguang” (XZG, purple). RNA-seq quantitative analysis was completed through filtering adapters and low-quality reads via Trimmomatic v0.33 [68]. The obtained clean reads were then aligned to the reference genome of A. arguta “M” by HISAT2 v2.2.1 [69]. Subsequently, the expression levels of AaINV genes at different varieties were quantified using FPKM values, and the heatmaps of the expression level of these candidates were created by TBtools v2.084 [62]. The differentially expressed genes (DEGs) between different varieties were identified via DESeq2 based on the following criteria: log2Fold Change > 1 with adjusted p-values < 0.05 [70]. GO enrichment analysis was determined with clusterProfiler v4.0 [71]. Additionally, metabolome profiles were assessed by Metware Biotechnology Co., Ltd. (Wuhan, China) using widely targeted metabolome analysis [72]. Metabolite quantification and annotation were carried out using scheduled multiple reaction monitoring methods and the self-built MetWare database and other public databases, respectively. The Kruskal–Wallis test was used to compare any significant differences in metabolite levels. Statistical significance was considered at p < 0.05, and the values are presented as the mean ± SD from two independent samples. The sugar metabolic regulatory networks were constructed through combining the Pearson correlation coefficient (PCC > 0.9, p < 0.05) between TFs and structural genes with Cytoscape v3.7.0 [73].

4.6. Experimental Validation of AaINV Gene Expression Levels by qRT-PCR

To validate the RNA-seq results, we selected eight AaINV genes (AaVINV2, AaVINV3, AaNINV3, AaNINV28, AaNINV35, AaNINV50, AaNINV62 and AaNINV63) that showed a correlation with sugar metabolites. The expression levels of these genes were further confirmed using qRT-PCR across three A. arguta varieties, with Actinidia β-actin serving as the internal control for normalization [74]. Total RNAs were isolated from KKW, QH and XZG fruits by an RNAprep Plant Kit (Tiangen, Beijing, China), and cDNA was synthesized as described by Jia et al. [33]. The qRT-PCR was carried out with SYBR Green PCR Master Mix (Takara, Kyoto, Japan) using a Bio-Rad Real-time PCR System. Each gene was repeated six times, and the data were processed using the 2−ΔΔCT method.

Supplementary Materials

The following supporting information can be downloaded at: https://www.mdpi.com/article/10.3390/ijms26052150/s1.

Author Contributions

Conceptualization, Y.J.; methodology, Y.J. and X.Q.; software, X.Q.; validation, T.R.; formal analysis, X.Q. and T.R.; investigation, Y.J.; resources, Y.Z.; data curation, X.Q.; writing—original draft preparation, X.Q. and Y.J.; writing—review and editing, Y.J.; funding acquisition, Y.J. All authors have read and agreed to the published version of the manuscript.

Funding

This research was supported by the National Natural Science Foundation of China (32300314), the Shaanxi Academy of Science Research Funding Project (2024p-12), the Xi’an Science and Technology Bureau Project (22NYYF002) and the Xi’an Botanical Garden of Shaanxi Province Young Talent Funding Project (2024TJ-02).

Institutional Review Board Statement

Not applicable.

Informed Consent Statement

Not applicable.

Data Availability Statement

The data are contained within the Supplementary Materials.

Acknowledgments

We are grateful to Meng Wang for her valuable suggestions and comments on our manuscript.

Conflicts of Interest

The authors declare no conflicts of interest.

References

  1. Patrick, W.J.; Botha, C.F.; Birch, G.R. Metabolic engineering of sugars and simple sugar derivatives in plants. Plant Biotechnol. J. 2013, 11, 142–156. [Google Scholar] [CrossRef] [PubMed]
  2. Huang, W.; Hu, B.; Liu, J.; Zhou, Y.; Liu, S. Identification and characterization of tonoplast sugar transporter (TST) gene family in cucumber. Hortic. Plant J. 2020, 6, 145–157. [Google Scholar] [CrossRef]
  3. Wang, D.; Zhao, J.T.; Qin, Y.Q.; Qin, Y.H.; Hu, G.B. Molecular cloning, characterization and expression profile of the sucrose synthase gene family in Litchi chinensis. Hortic. Plant J. 2021, 7, 520–528. [Google Scholar] [CrossRef]
  4. Cheng, L.; Jin, J.; He, X.; Luo, Z.; Wang, Z.; Yang, J.; Xu, X. Genome-wide identification and analysis of the invertase gene family in tobacco (Nicotiana tabacum) reveals NtNINV10 participating the sugar metabolism. Front. Plant Sci. 2023, 14, 1164296. [Google Scholar] [CrossRef] [PubMed]
  5. Coculo, D.; Lionetti, V. The plant Invertase/Pectin Methylesterase Inhibitor superfamily. Front. Plant Sci. 2022, 13, 863892. [Google Scholar] [CrossRef]
  6. Veillet, F.; Gaillard, C.; Coutos-Thevenot, P.; La Camera, S. Targeting the AtCWIN1 gene to explore the role of invertases in sucrose transport in roots and during Botrytis cinerea infection. Front. Plant Sci. 2016, 7, 1899. [Google Scholar] [CrossRef]
  7. Zhu, C.; Yang, K.; Li, G.; Li, Y.; Gao, Z. Identification and expression analyses of invertase genes in moso bamboo reveal their potential drought stress functions. Front. Genet. 2021, 12, 696300. [Google Scholar] [CrossRef]
  8. Ruan, Y.L.; Jin, Y.; Yang, Y.J.; Li, G.J.; Boyer, J.S. Sugar input, metabolism, and signaling mediated by invertase: Roles in development, yield potential, and response to drought and heat. Mol. Plant 2010, 3, 942–955. [Google Scholar] [CrossRef]
  9. Stitt, M.; von Schaewen, A.; Willmitzer, L. “Sink” regulation of photosynthetic metabolism in transgenic tobacco plants expressing yeast invertase in their cell wall involves a decrease of the Calvin-cycle enzymes and an increase of glycolytic enzymes. Planta 1991, 183, 40–50. [Google Scholar] [CrossRef]
  10. Sturm, A. Invertases. Primary structures, functions, and roles in plant development and sucrose partitioning. Plant Physiol. 1999, 121, 1–8. [Google Scholar] [CrossRef]
  11. Tamoi, M.; Tabuchi, T.; Demuratani, M.; Otori, K.; Tanabe, N.; Maruta, T.; Shigeoka, S. Point mutation of a plastidic invertase inhibits development of the photosynthetic apparatus and enhances nitrate assimilation in sugar-treated Arabidopsis seedlings. J. Biol. Chem. 2010, 285, 15399–15407. [Google Scholar] [CrossRef] [PubMed]
  12. Battaglia, M.E.; Martin, M.V.; Lechner, L.; Martínez-Noël, G.M.A.; Salerno, G.L. The riddle of mitochondrial alkaline/neutral invertases: A novel Arabidopsis isoform mainly present in reproductive tissues and involved in root ROS production. PLoS ONE 2017, 12, e0185286. [Google Scholar] [CrossRef] [PubMed]
  13. Ji, X.; Van Den Ende, W.; Van Laere, A.; Cheng, S.; Bennett, J. Structure, evolution, and expression of the two invertase gene families of rice. J. Mol. Evol. 2005, 60, 615–634. [Google Scholar] [CrossRef] [PubMed]
  14. Greiner, S.; Krausgrill, S.; Rausch, T. Cloning of a tobacco apoplasmic invertase inhibitor. Proof of function of the recombinant protein and expression analysis during plant development. Plant Physiol. 1998, 116, 733–742. [Google Scholar] [CrossRef]
  15. Reca, I.B.; Brutus, A.; D’Avino, R.; Villard, C.; Bellincampi, D.; Giardina, T. Molecular cloning, expression and characterization of a novel apoplastic invertase inhibitor from tomato (Solanum lycopersicum) and its use to purify a vacuolar invertase. Biochimie 2008, 90, 1611–1623. [Google Scholar] [CrossRef]
  16. Ahiakpa, J.K.; Magdy, M.; Karikari, B.; Munir, S.; Mumtaz, M.A.; Tamim, S.A.; Mahmood, S.; Liu, G.Z.; Chen, W.F.; Wang, Y.; et al. Genome-wide identification and expression profiling of tomato invertase genes indicate their response to stress and phytohormones. J. Plant Growth Regul. 2021, 41, 1481–1498. [Google Scholar] [CrossRef]
  17. Sherson, S.M.; Alford, H.L.; Forbes, S.M.; Wallace, G.; Smith, S.M. Roles of cell-wall invertases and monosaccharide transporters in the growth and development of Arabidopsis. J. Exp. Bot. 2003, 54, 525–531. [Google Scholar] [CrossRef]
  18. Chourey, P.S.; Jain, M.; Li, Q.B.; Carlson, S.J. Genetic control of cell wall invertases in developing endosperm of maize. Planta 2006, 223, 159–167. [Google Scholar] [CrossRef]
  19. Proels, R.K.; Hückelhoven, R. Cell-wall invertases, key enzymes in the modulation of plant metabolism during defence responses. Mol. Plant Pathol. 2014, 15, 858–864. [Google Scholar] [CrossRef]
  20. Liu, J.; Han, L.; Huai, B.; Zheng, P.; Chang, Q.; Guan, T.; Li, D.; Huang, L.; Kang, Z. Down-regulation of a wheat alkaline/neutral invertase correlates with reduced host susceptibility to wheat stripe rust caused by Puccinia striiformis. J. Exp. Bot. 2015, 66, 7325–7338. [Google Scholar] [CrossRef]
  21. Yu, X.; Wang, X.; Zhang, W.; Qian, T.; Tang, G.; Guo, Y.; Zheng, C.C. Antisense suppression of an acid invertase gene (MAI1) in muskmelon alters plant growth and fruit development. J. Exp. Bot. 2008, 59, 2969–2977. [Google Scholar] [CrossRef] [PubMed]
  22. Roitsch, T.; González, M.C. Function and regulation of plant invertases: Sweet sensations. Trends Plant Sci. 2004, 9, 606–613. [Google Scholar] [CrossRef] [PubMed]
  23. Lou, Y.; Gou, J.Y.; Xue, H.W. PIP5K9, an arabidopsis phosphatidylinositol monophosphate kinase, interacts with a cytosolic invertase to negatively regulate sugar-mediated root growth. Plant Cell 2007, 19, 163–181. [Google Scholar] [CrossRef] [PubMed]
  24. Martín, M.L.; Lechner, L.; Zabaleta, E.J.; Salerno, G.L. A mitochondrial alkaline/neutral invertase isoform (A/N-InvC) functions in developmental energy-demanding processes in arabidopsis. Planta 2013, 237, 813–822. [Google Scholar] [CrossRef] [PubMed]
  25. Li, M.; Feng, F.; Cheng, L. Expression patterns of genes involved in sugar metabolism and accumulation during apple fruit development. PLoS ONE 2012, 7, e33055. [Google Scholar] [CrossRef]
  26. Chen, C.; Chen, H.; Yang, W.; Li, J.; Tang, W.; Gong, R. Transcriptomic and metabolomic analysis of quality changes during sweet cherry fruit development and mining of related genes. Int. J. Mol. Sci. 2022, 23, 7402. [Google Scholar] [CrossRef]
  27. Wang, R.; Shu, P.; Zhang, C.; Zhang, J.; Chen, Y.; Zhang, Y.; Du, K.; Xie, Y.; Li, M.; Ma, T.; et al. Integrative analyses of metabolome and genome-wide transcriptome reveal the regulatory network governing flavor formation in kiwifruit (Actinidia chinensis). New Phytol. 2022, 233, 373–389. [Google Scholar] [CrossRef]
  28. Wu, S.; Wu, D.; Song, J.; Zhang, Y.; Tan, Q.; Yang, T.; Yang, J.; Wang, S.; Xu, J.; Xu, W.; et al. Metabolomic and transcriptomic analyses reveal new insights into the role of abscisic acid in modulating mango fruit ripening. Hortic. Res. 2022, 9, uhac102. [Google Scholar] [CrossRef]
  29. Kim, J.Y.; Mahé, A.; Brangeon, J.; Prioul, J.L. A maize vacuolar invertase, IVR2, is induced by water stress. Organ/tissue specificity and diurnal modulation of expression. Plant Physiol. 2000, 124, 71–84. [Google Scholar] [CrossRef]
  30. Wang, Y.J.; Zhen, X.H.; Zhou, Y.J.; Wang, Y.L.; Hou, J.Y.; Wang, X.; Li, R.M.; Liu, J.; Hu, X.W.; Geng, M.T.; et al. MeNINV1: An alkaline/neutral invertase gene of manihot esculenta, enhanced sucrose catabolism and promoted plant vegetative growth in transgenic Arabidopsis. Plants 2022, 11, 946. [Google Scholar] [CrossRef]
  31. Wang, S.; Qiu, Y.; Zhu, F. Kiwifruit (Actinidia spp.): A review of chemical diversity and biological activities. Food Chem. 2021, 350, 128469. [Google Scholar] [CrossRef] [PubMed]
  32. Lu, X.M.; Man, Y.P.; Lei, R.; Liu, Y.B.; Wu, J.H.; Wang, Y.C. Structural analysis of Actinidia arguta natural populations and preliminary application in association mapping of fruit traits. Sci. Hortic. 2022, 304, 111306. [Google Scholar] [CrossRef]
  33. Jia, Y.; Zhang, Y.; Zhang, L.; Wang, F.; Yu, G.; Wang, Y.; Kang, X.; Wu, Y. Characterization and analysis of the full-Length transcriptome provide insights into fruit quality formation in kiwifruit cultivar Actinidia arguta cv. Qinziyu. Agronomy 2023, 13, 143. [Google Scholar] [CrossRef]
  34. Li, Z.Z.; Man, Y.P.; Lan, X.Y.; Wang, Y.C. Ploidy and phenotype variation of a natural Actinidia arguta population in the east of Daba Mountain located in a region of Shanxi. Sci. Hortic. 2013, 161, 259–265. [Google Scholar] [CrossRef]
  35. Wang, Y.H.; Xu, F.X.; Feng, X.Q.; Macarthur, R.L. Modulation of Actinidia arguta fruit ripening by three ethylene biosynthesis inhibitors. Food Chem. 2015, 173, 405–413. [Google Scholar] [CrossRef]
  36. Zhang, J.; Tian, J.; Gao, N.; Gong, E.S.; Xin, G.; Liu, C.; Si, X.; Sun, X.; Li, B. Assessment of the phytochemical profile and antioxidant activities of eight kiwi berry (Actinidia arguta (Siebold & zuccarini) miquel) varieties in China. Food Sci. Nutr. 2021, 9, 5616–5625. [Google Scholar]
  37. Sawicki, T.; Błaszczak, W.; Latocha, P. In vitro anticholinergic and antiglycaemic properties of frost-hardy Actinidia fruit extracts and their polyphenol profile, L-ascorbic acid content and antioxidant capacity. Food Res. Int. 2023, 173, 113324. [Google Scholar] [CrossRef]
  38. Xu, H.R.; Pan, S.; Wang, J.B.; Ye, T.C.; Yan, M.; Liang, X.M.; Qian, G.L.; Yan, T.C.; Xin, G. Comparative characterization of volatile organic compounds and aroma profiles in 10 Actinidia arguta cultivars by gas chromatography-mass spectrometry (GC-MS), sensory analysis, and odor activity value (OAV) combined with chemometrics. J. Food Compos. Anal. 2024, 133, 106450. [Google Scholar] [CrossRef]
  39. Kim, J.G.; Beppu, K.; Kataoka, I. Physical and compositional characteristics of ‘mitsuko’ and local hardy kiwifruits in Japan. Hortic. Environ. Biotechnol. 2012, 53, 1–8. [Google Scholar] [CrossRef]
  40. Lin, Y.; Tang, H.; Zhao, B.; Lei, D.; Zhou, X.; Yao, W.; Fan, J.; Zhang, Y.; Chen, Q.; Wang, Y.; et al. Comparative changes of health-promoting phytochemicals and sugar metabolism of two hardy kiwifruit (Actinidia arguta) cultivars during fruit development and maturity. Front. Plant Sci. 2022, 13, 1087452. [Google Scholar] [CrossRef]
  41. Lu, X.M.; Yu, X.F.; Li, G.Q.; Qu, M.H.; Wang, H.; Liu, C.; Man, Y.P.; Jiang, X.H.; Li, M.Z.; Wang, J.; et al. Genome assembly of autotetraploid Actinidia arguta highlights adaptive evolution and enables dissection of important economic traits. Plant Commun. 2024, 5, 100856. [Google Scholar] [CrossRef] [PubMed]
  42. Jin, Y.; Ni, D.A.; Ruan, Y.L. Posttranslational elevation of Cell Wall invertase activity by silencing its inhibitor in tomato delays leaf senescence and increases seed weight and fruit hexose level. Plant Cell 2009, 21, 2072–2089. [Google Scholar] [CrossRef] [PubMed]
  43. Qin, G.; Zhu, Z.; Wang, W.; Cai, J.; Chen, Y.; Li, L.; Tian, S. A tomato vacuolar invertase inhibitor mediates sucrose metabolism and influences fruit ripening. Plant Physiol. 2016, 172, 1596–1611. [Google Scholar] [CrossRef]
  44. Kawaguchi, K.; Takei-Hoshi, R.; Yoshikawa, I.; Nishida, K.; Kobayashi, M.; Kusano, M.; Lu, Y.; Ariizumi, T.; Ezura, H.; Otagaki, S.; et al. Functional disruption of cell wall invertase inhibitor by genome editing increases sugar content of tomato fruit without decrease fruit weight. Sci. Rep. 2021, 11, 21534. [Google Scholar] [CrossRef]
  45. Pressey, R. Separation and properties of potato invertase and invertase inhibitor. Arch. Biochem. Biophys. 1966, 113, 667–674. [Google Scholar] [CrossRef]
  46. Juarez-Colunga, S.; Lopez-Gonzalez, C.; Morales-Elıas, N.C.; Massange-Sánchez, J.A.; Trachsel, S.; Tiessen, A. Genome-wide analysis of the invertase gene family from maize. Plant Mol. Biol. 2018, 97, 385–406. [Google Scholar] [CrossRef]
  47. Jaillon, O.; Aury, J.M.; Noel, B.; Policriti, A.; Clepet, C.; Casagrande, A.; Choisne, N.; Aubourg, S.; Vitulo, N.; Jubin, C.; et al. The grapevine genome sequence suggests ancestral hexaploidization in major angiosperm phyla. Nature 2007, 449, 463–467. [Google Scholar]
  48. Peng, Z.; Lu, Y.; Li, L.; Zhao, Q.; Feng, Q.; Gao, Z.; Lu, H.; Hu, T.; Yao, N.; Liu, K.; et al. The draft genome of the fast-growing non-timber forest species moso bamboo (Phyllostachys heterocycla). Nat. Genet. 2017, 45, 456–461. [Google Scholar] [CrossRef]
  49. Alberto, F.; Bignon, C.; Sulzenbacher, G.; Henrissat, B.; and Czjzek, M. The three-dimensional structure of invertase (beta-fructosidase) from Thermotoga maritima reveals a bimodular arrangement and an evolutionary relationship between retaining and inverting glycosidases. J. Biol. Chem. 2004, 279, 18903–18910. [Google Scholar] [CrossRef]
  50. Wang, L.; Ruan, Y.L. New insights into roles of cell wall invertase in early seed development revealed by comprehensive spatial and temporal expression patterns of GhCWIN1 in cotton. Plant Physiol. 2012, 160, 777–787. [Google Scholar] [CrossRef]
  51. Tauzin, A.S.; Sulzenbacher, G.; Lafond, M.; Desseaux, V.; Reca, I.B.; Perrier, J.; Bellincampi, D.; Fourquet, P.; Lévêque, C.; Giardina, T. Functional characterization of a vacuolar invertase from Solanum lycopersicum: Post-translational regulation by N-glycosylation and a proteinaceous inhibitor. Biochimie 2014, 101, 39–49. [Google Scholar] [CrossRef] [PubMed]
  52. Jia, Y.; Qiang, X.; Dong, P.; Ren, T.; Zhang, Y.; Yang, Y. Genome-Wide Identification and Characterization of Sucrose Metabolism Genes Involved in Actinidia rufa and Their Expression Profiling during the Fruit Developmental Stages. Horticulturae 2024, 10, 772. [Google Scholar] [CrossRef]
  53. Yu, J.Q.; Gu, K.D.; Sun, C.H.; Zhang, Q.Y.; Wang, J.H.; Ma, F.F.; You, C.X.; Hu, D.G.; Hao, Y.J. The apple bHLH transcription factor MdbHLH3 functions in determining the fruit carbohydrates and malate. Plant Biotechnol. J. 2021, 19, 285–299. [Google Scholar] [CrossRef] [PubMed]
  54. Tournier, B.; Sanchez-Ballesta, M.T.; Jones, B.; Pesquet, E.; Regad, F.; Latché, A.; Pech, J.C.; Bouzayen, M. New members of the tomato ERF family show specific expression pattern and diverse DNA-binding capacity to the GCC box element. FEBS Lett. 2003, 550, 149–154. [Google Scholar] [CrossRef]
  55. Yin, X.R.; Allan, A.C.; Chen, K.S.; Ferguson, I.B. Kiwifruit EIL and ERF genes involved in regulating fruit ripening. Plant Physiol. 2010, 153, 1280–1292. [Google Scholar] [CrossRef]
  56. Mistry, J.; Finn, R.D.; Eddy, S.R.; Bateman, A.; Punta, M. Challenges in homology search: HMMER3 and convergent evolution of coiled-coil regions. Nucleic Acids Res. 2013, 41, e121. [Google Scholar] [CrossRef]
  57. El-Gebali, S.; Mistry, J.; Bateman, A.; Eddy, S.R.; Luciani, A.; Potter, S.C.; Qureshi, M.; Richardson, L.J.; Salazar, G.A.; Smart, A.; et al. The pfam protein families database in 2019. Nucleic Acids Res. 2019, 47, D427–D432. [Google Scholar] [CrossRef]
  58. Duvaud, S.; Gabella, C.; Lisacek, F.; Stockinger, H.; Ioannidis, V.; Durinx, C. Expasy, the Swiss bioinformatics resource portal, as designed by its users. Nucleic Acids Res. 2021, 49, W216–W227. [Google Scholar] [CrossRef]
  59. Tamura, K.; Stecher, G.; Kumar, S. MEGA11: Molecular evolutionary genetics analysis version 11. Mol. Biol. Evol. 2021, 38, 3022–3027. [Google Scholar] [CrossRef]
  60. Gu, Z.; Gu, L.; Eils, R.; Schlesner, M.; Brors, B. Circlize implements and enhances circular visualization in R. Bioinformatics 2014, 30, 2811–2812. [Google Scholar] [CrossRef]
  61. Wang, Y.; Tang, H.; Debarry, J.D.; Tan, X.; Li, J.; Wang, X.; Lee, T.H.; Jin, H.; Marler, B.; Guo, H.; et al. MCScanX: A toolkit for detection and evolutionary analysis of gene synteny and collinearity. Nucleic Acids Res. 2012, 40, e49. [Google Scholar] [CrossRef] [PubMed]
  62. Chen, C.; Wu, Y.; Li, J.; Wang, X.; Zeng, Z.; Xu, J.; Liu, Y.; Feng, J.; Chen, H.; He, Y.; et al. TBtools-II: A “one for all, all for one” bioinformatics platform for biological big-data mining. Mol. Plant 2023, 16, 1733–1742. [Google Scholar] [CrossRef] [PubMed]
  63. Tang, H.; Krishnakumar, V.; Zeng, X.; Xu, Z.; Taranto, A.; Lomas, J.S.; Zhang, Y.; Huang, Y.; Wang, Y.; Yim, W.C.; et al. JCVI: A Versatile Toolkit for Comparative Genomics Analysis. iMeta 2024, 3, e211. [Google Scholar] [CrossRef]
  64. Wang, D.; Zhang, Y.; Zhang, Z.; Zhu, J.; Yu, J. KaKs_Calculator 2.0: A toolkit incorporating gamma-series methods and sliding window strategies. Genom. Proteom. Bioinf. 2010, 8, 77–80. [Google Scholar] [CrossRef]
  65. Hu, B.; Jin, J.; Guo, A.-Y.; Zhang, H.; Luo, J.; Gao, G. GSDS 2.0: An upgraded gene feature visualization server. Bioinformatics 2015, 31, 1296–1297. [Google Scholar] [CrossRef]
  66. Bailey, T.L.; Williams, N.; Misleh, C.; Li, W.W. MEME: Discovering and analyzing DNA and protein sequence motifs. Nucleic Acids Res. 2006, 34, W369–W373. [Google Scholar] [CrossRef]
  67. Rombauts, S.; Déhais, P.; Van Montagu, M.; Rouzé, P. PlantCARE, a plant cis-acting regulatory element database. Nucleic Acids Res. 1999, 27, 295–296. [Google Scholar] [CrossRef]
  68. Bolger, A.M.; Lohse, M.; Usadel, B. Trimmomatic: A flexible read trimming tool for Illumina NGS data. Bioinformatics 2014, 30, 2114–2120. [Google Scholar] [CrossRef]
  69. Kim, D.; Paggi, J.M.; Park, C.; Bennett, C.; Salzberg, S.L. Graph-based genome alignment and genotyping with HISAT2 and HISAT-genotype. Nat. Biotechnol. 2019, 37, 907–915. [Google Scholar] [CrossRef]
  70. Trapnell, C.; Roberts, A.; Goff, L.; Pertea, G.; Kim, D.; Kelley, D.R.; Pimentel, H.; Salzberg, S.L.; Rinn, J.L.; Pachter, L. Differential gene and transcript expression analysis of RNA-seq experiments with TopHat and Cufflinks. Nat. Protoc. 2012, 7, 562–578. [Google Scholar] [CrossRef]
  71. Wu, T.; Hu, E.; Xu, S.; Chen, M.; Guo, P.; Dai, Z.; Feng, T.; Zhou, L.; Tang, W.; Zhan, L.; et al. clusterProfiler 4.0: A universal enrichment tool for interpreting omics data. Innovation 2021, 2, 100141. [Google Scholar] [CrossRef] [PubMed]
  72. Zhang, A.; Zhang, Q.; Li, J.; Gong, H.; Fan, X.; Yang, Y.; Liu, X.; Yin, X. Transcriptome co-expression network analysis identifies key genes and regulators of ripening kiwifruit ester biosynthesis. BMC Plant Biol. 2020, 20, 103. [Google Scholar] [CrossRef] [PubMed]
  73. Kohl, M.; Wiese, S.; Warscheid, B. Cytoscape: Software for visualization and analysis of biological networks. Methods Mol. Biol. 2011, 696, 291–303. [Google Scholar] [PubMed]
  74. Ampomah-Dwamena, C.; McGhie, T.; Reginald, W.; Montefiori, M.; Hellens, R.P.; Allan, A.C. The kiwifruit lycopene beta-cyclase plays a significant role in carotenoid accumulation in fruit. J. Exp. Bot. 2009, 60, 3765–3779. [Google Scholar] [CrossRef]
Figure 1. Phylogenetic analyses of the INV families from five Actinidia species and Arabidopsis. Clades with different colors represent diverse subgroups. Species abbreviations are listed as follows: At: A. thaliana; Aa: A. arguta; Ac: A. chinensis, Ae: A. eriantha; Ah: A. hemsleyana; Ar: A. rufa.
Ijms 26 02150 g001
Figure 2. (A) Neighbor-joining trees constructed for AaINVs. (B) Protein motifs. The number of the motifs 1–10 are presented in different colored boxes. (C) Conserved domains. Different domains are displayed by colored boxes. (D) The gene structure of AaINVs, with orange boxes representing CDS.
Ijms 26 02150 g002
Figure 3. Chromosome distribution and collinearity analysis of AaINVs in the kiwifruit genome. The magenta, green, and black fonts represent the AaCWINV, AaVINV and AaNINV genes, respectively. The purple lines represent collinear AaINV gene pairs, and the pink boxes present the chromosome.
Ijms 26 02150 g003
Figure 4. Synteny analyses for INV gene family between A. argute and A. thaliana, A. chinensis and A. eriantha, respectively. The gray lines in the background show the collinear blocks within A. arguta and other plant genomes; the colored lines indicate orthologous gene pairs.
Ijms 26 02150 g004
Figure 5. Cis-elements prediction in the 2000 bp region upstream from the start codon of AaINVs. The distribution of these cis-elements is illustrated on the right, with different colors showing diverse types of cis-elements. The number of cis-elements is presented in the colored box.
Ijms 26 02150 g005
Figure 6. (A) Color observation and heatmap of the expression from three kiwifruit varieties. KKW, QH and XZG represent the green-, yellow- and purple-colored flesh samples, respectively. (B) Expression profiles of 102 AaINV genes in the three varieties. (CE) Volcano plot from different varieties between XZG vs. KKW, XZG vs. QH and QH vs. KKW, respectively.
Ijms 26 02150 g006
Figure 7. (A) Overview of the sugar metabolome profiles in three kiwifruit varieties. (B) Comparison of the seven representative sugar metabolites between three kiwifruit varieties. (C) The regulatory network of key sugar metabolites in kiwifruit. The orange circles represent sugars, and the rose red squares represent AaINV genes. Green triangles and blue arrows indicate AP2/ERF-ERF2 and bHLH transcription factors, respectively. (D) Results of qRT-PCR analysis of the five selected AaINVs in KKW, QH and XZG; * p < 0.05, ** p < 0.01, *** p < 0.001.
Ijms 26 02150 g007
Disclaimer/Publisher’s Note: The statements, opinions and data contained in all publications are solely those of the individual author(s) and contributor(s) and not of MDPI and/or the editor(s). MDPI and/or the editor(s) disclaim responsibility for any injury to people or property resulting from any ideas, methods, instructions or products referred to in the content.

