Article

Localization of Potential Energy in Hydrogen Bonds of the ATXN2 Gene

1
Research Department, Kuban State University, 350040 Krasnodar, Russia
2
Laboratory of Problems of Stable Isotope Spreading in Living Systems, Southern Scientific Center of the Russian Academy of Sciences, 344006 Rostov-on-Don, Russia
*
Author to whom correspondence should be addressed.
Int. J. Mol. Sci. 2025, 26(3), 933; https://doi.org/10.3390/ijms26030933
Submission received: 7 December 2024 / Revised: 20 January 2025 / Accepted: 21 January 2025 / Published: 23 January 2025

Abstract

:
It is known that a number of neurodegenerative diseases, also called diseases of waiting, are associated with the expansion of the polyQ tract in the first exon of the ATXN2 gene. In the expanded polyQ tract, the probability of occurrence of non-canonical configurations (hairpins, G-quadruplexes, etc.) is significantly higher than in the normal one. Obviously, for their formation, the occurrence of open states (OSs) is necessary. Calculations were made for these processes using the angular mechanical model of DNA. It has been established that the probability of the large OS zones genesis in a DNA segment depends not only on the “strength” of the nucleotide sequence but also on the factors determining the dynamics of DNA; localization of the energy in the DNA molecule and the potential energy of interaction between pairs of nitrogenous bases also depend on environmental parameters. The potential energy of hydrogen bonds does not remain constant, and oscillatory movements lead to its redistribution and localization. In this case, OSs effectively dissipate the energy of oscillations. Thus, mathematical modeling makes it possible to calculate the localization of mechanical energy, which is necessary for the OSs formation, and to predict the places of their origin, taking into account the mechanical oscillations of the DNA molecule.

1. Introduction

The first exon of the ATXN2 gene contains a site of tandemly repeated CAG sequences that form a polyglutamine (polyQ) tract [1,2,3,4]. In a healthy man, the CAG repeat tract in the ATXN2 gene consists of approximately 22–23 CAG trinucleotides [5,6,7]. An increase in the number of CAG repeats can lead to several pathologies: ataxia, amyotrophic lateral sclerosis (ALS), and parkinsonism [7,8,9,10,11,12,13].
The repeat expansion associated with spinocerebellar ataxia type II (SCA2) is greater than 34 and typically represents pure CAG repeats [14,15,16,17,18]. Parkinsonism is associated with a CAG repeat region interrupted by CAA interruptions, compared with the pure CAG repeats typical for SCA2 [19]. Repeats associated with increased risk of ALS consist of shorter CAG sequences interrupted by 1–3 CAA interruptions [20,21,22]. Age at onset of ALS varies significantly depending on the number of CAA interruptions [21,23,24].
It is important to understand how the nucleotide sequence in the CAG repeat region affects the manifestation of pathology. The results of the studies allowed us to suggest that the sequence of repeats affects the stability of the tract [25,26,27]. Pure CAG tract is unstable and tends to expand [28,29,30,31]. It is difficult to detect the dependencies and patterns of such instability experimentally since this requires a large amount of experimental data. Recently, attempts have been made to solve this problem with the help of mouse models [32,33,34]. The most accessible method that allows conducting a large number of experiments and analyzing different options is mathematical modeling. Full-atom modeling in studying the conformational and dynamic properties of nucleic acids has a number of limitations. It requires large computational costs; the study can only be carried out on short time intervals, within which only short nucleotide sequences can be studied. Mechanical models of DNA are currently very popular, they use a number of simplifications but allow studying long sequences over fairly large time intervals [35,36,37,38,39].
The fact that CAA interruptions and continuous CAG sequences of the same length in the ATXN2 gene lead to different diseases: SCA2 or parkinsonism, confirms that sequence configuration and repeat length are important factors in the clinical manifestations and phenotypic variability of the ATXN2 gene [40,41,42,43].
It has been established that the presence of CAA interruptions in the right part of the CAG tract with a high probability leads to the genesis of an additional open states (OS) zone. The calculations made allowed us to establish that CAA interruptions affect the stability of the CAG tract. This influence, depending on the localization of the interruption, can either increase the stability of the CAG tract or decrease it [44]. An open state is a base pair with broken hydrogen bonds between complementary nucleotides.
Toxicity and cell death in SCA2 are thought to be related to the formation of pathogenic secondary structures in DNA, such as hairpins, Z-DNA, triple helices, G-quadruplexes, and various slip strand duplexes [6,45,46,47,48,49,50,51]. It is very important to understand their structural and dynamic characteristics since they can trigger a chain of molecular mechanisms that lead to the development of pathology [52,53].
Another approach relates the development of pathologies with the stability of the CAG tract. Using mathematical modeling methods, it was shown that with an increase in the length of the CAG tract, the probability of the appearance of additional large open state (OS) zones in it increases. A correlation was established between this probability and statistical data on the age of onset of the disease [54]. It is obvious that for the emergence of secondary structures (hairpins, G-quadruplexes, etc.), a necessary condition is the appearance of large OS zones in the CAG tract.
Calculations performed using the mechanical model allowed us to establish the following patterns: an increase in the length of the CAG tract (>40 CAG repeats) or a decrease in the viscosity of the medium surrounding the DNA molecule leads to a decrease in the stability of the CAG tract; and an increase in the viscosity of the CAG tract leads to stabilization of the DNA molecule (a decrease in the probability of the of OS zones genesis). In addition, in the zone close to incomplete penetrance of the disease, viscosity does not have a reliable effect on the stability of the CAG tract [55]. Previous studies have shown that additional OS zones arise precisely in the CAG tract, in which AT pairs make up only one-third of the part. At the same time, near the CAG tract, there are zones with a high content of AT pairs. To explain this fact, it is necessary to take into account the influence of oscillation movements of the DNA molecule on the formation of open states [56].
To take this influence into account, in this work, we investigated the dynamics of the potential energy of hydrogen bonds in base pairs and its influence on the occurrence of OSs. The ATXN2 gene with low stability of the CAG tract containing 50 CAG repeats was selected for the study. It was found that DNA oscillations lead to the redistribution of the potential energy of hydrogen bonds and their concentration in the segment of the additional OS zones genesis in the CAG tract. The influence of external parameters, such as force effect and viscosity of the surrounding liquid, on the distribution of potential energy of hydrogen bonds, was studied. In addition, the influence of CAA interruptions in the CAG tract on the genesis of OS zones and the distribution of hydrogen bonds’ potential energy in base pairs was established.

2. Results and Discussion

Calculations were performed for the ATXN2 gene, containing 50 CAG repeats with torque localized in the segment [5233, 5900]. The beginning of the localization segment coincides with the beginning of the promoter, the end of the segment was chosen based on the results obtained in the work [54].
Calculations were carried out on the gene segment from the 4601st to 6681st base pairs of the ATXN2 gene. This was undertaken to reduce the program execution time, since for the purposes of this study, the segment must contain the first exon of the gene and the CAG tract. In addition, the area from the 4601st to 6681st base pairs was selected taking into account the fact that under the external influence (torque), the disturbance zone does not extend beyond the boundaries of the selected area. This allows us to set the boundary conditions adequately for the calculated time interval.
The calculation results are presented in the form of figures. Figure 1 shows the graphs of angular deviations of the first chain of the selected DNA fragment over the time interval [0; 10−10 s] with the magnitude of the torque M0 = 8.00 pN·nm and the viscosity parameter of the medium λ = 1. It is evident that the disturbance caused by the torque does not reach the boundaries of the selected region of the gene.

2.1. Distribution of Potential Energy of Hydrogen Bonds with a Change in the Magnitude of the Torque M0
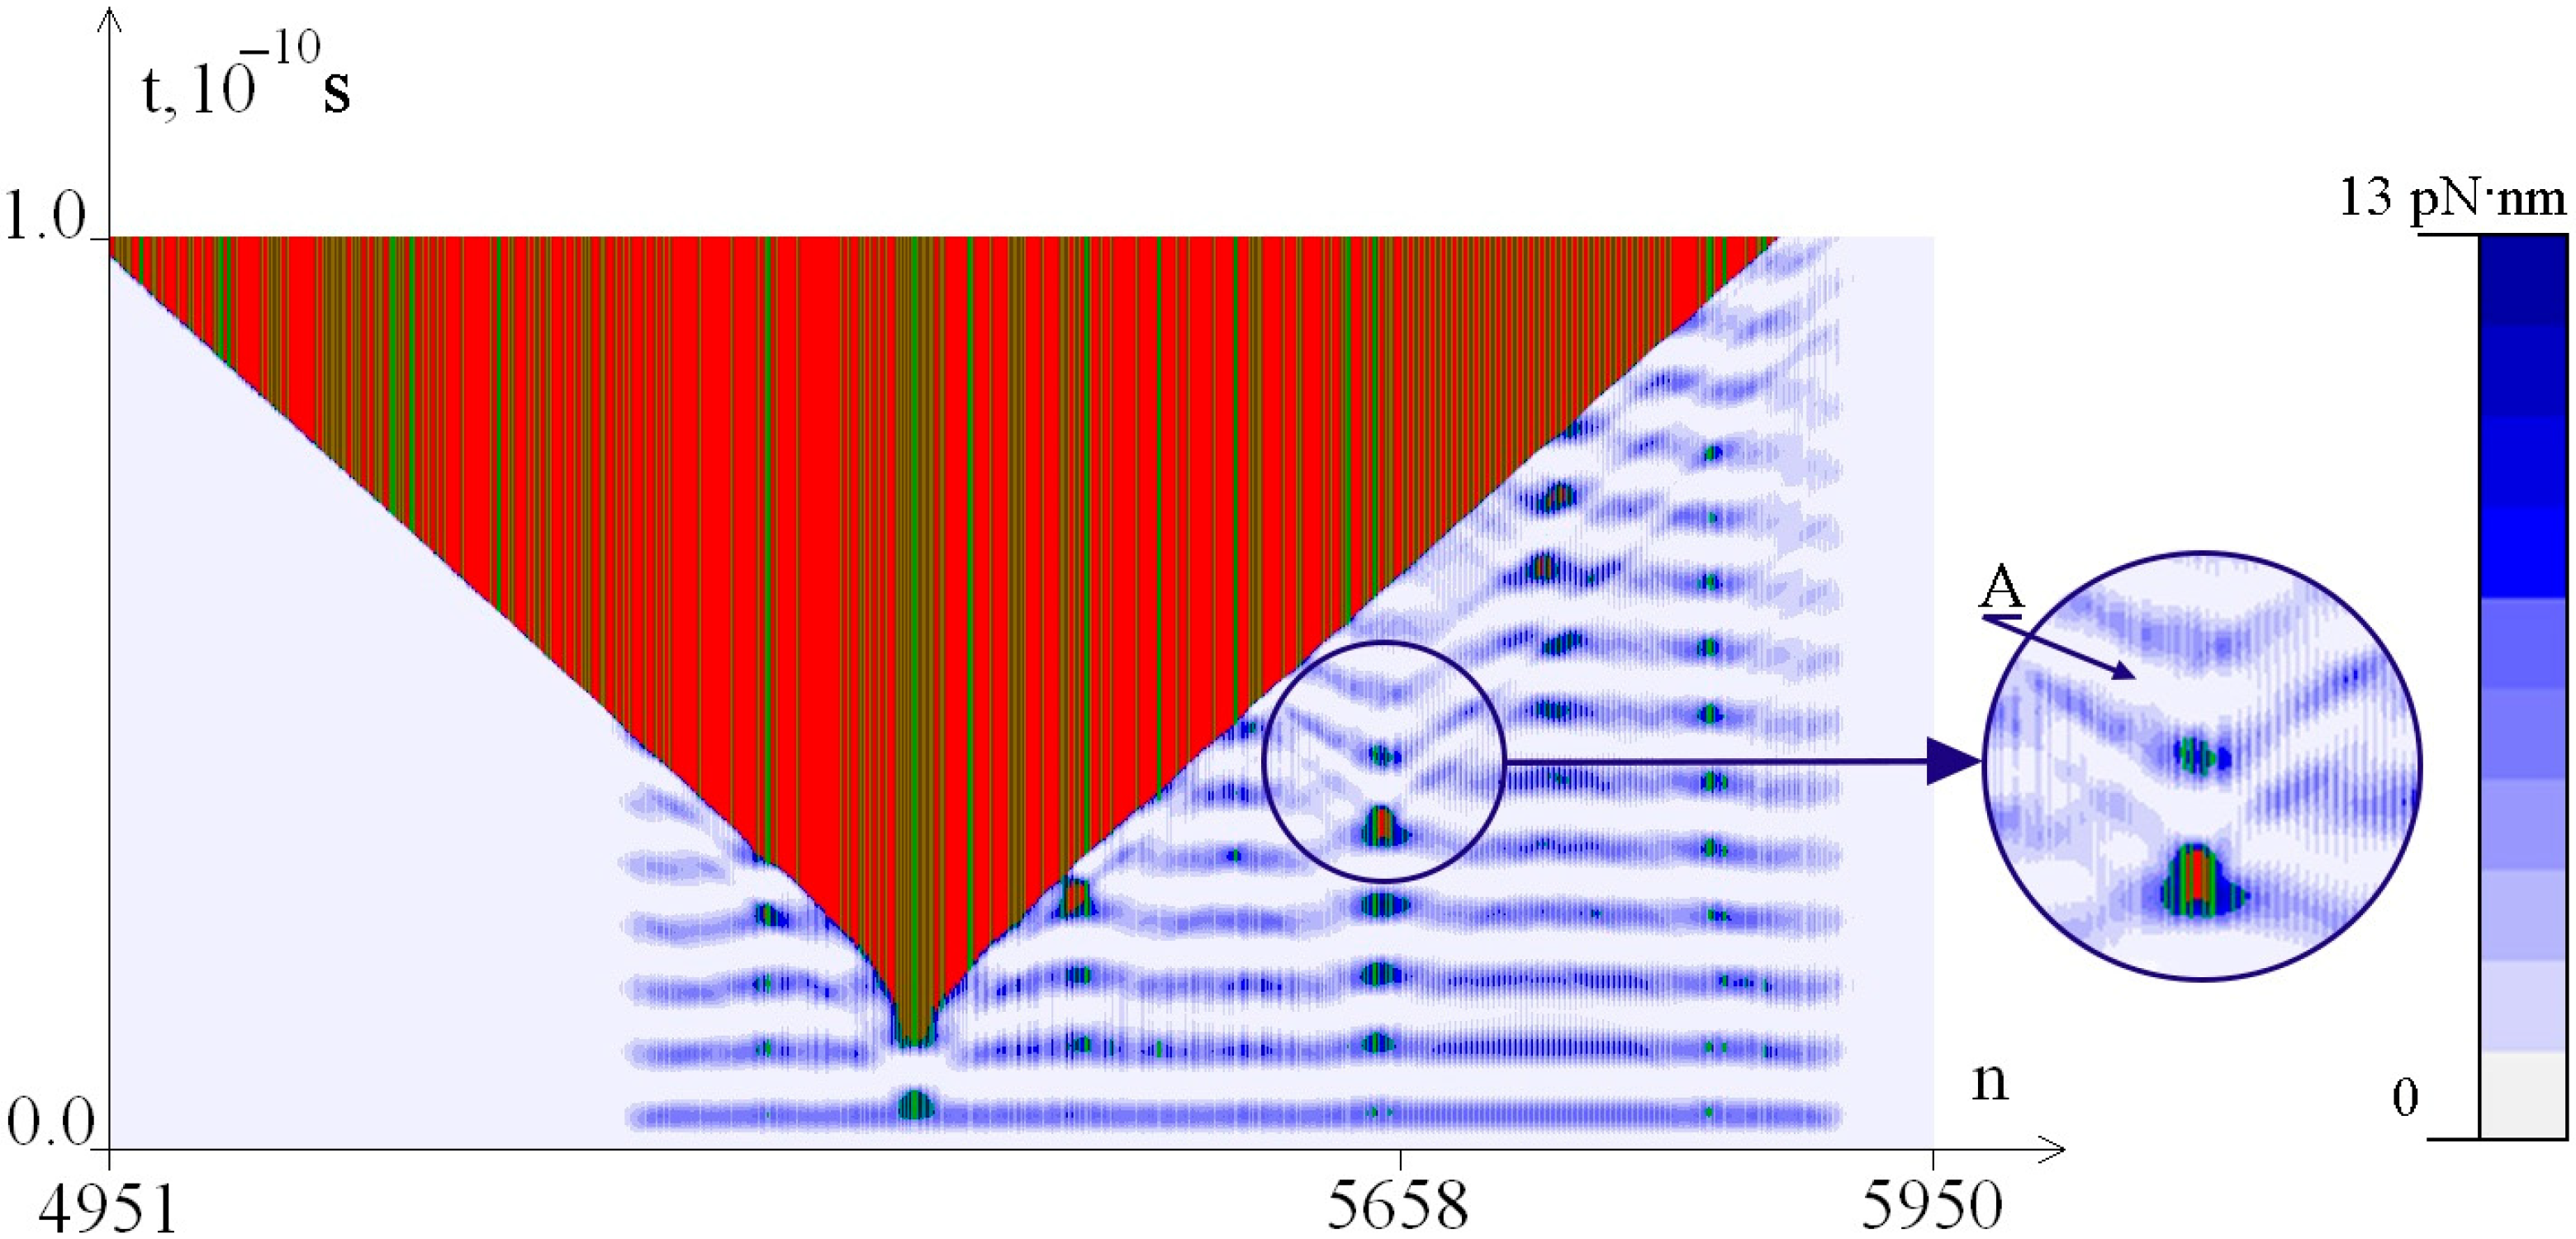
For λ = 1, the OS zones in the promoter region appear at the torque value M0 > 8.28 pN·nm. Figure 2 shows the dynamics of the OS zones genesis and the potential energy of hydrogen bonds in base pairs at M0 = 8.28 pN·nm. The numbers of nitrogenous base pairs are marked horizontally, and time is shown vertically. The OS in AT pairs is shown in green in the figure, and the OS in GC pairs is shown in red. The promoter is highlighted with a darker background; the beginning of the CAG tract is indicated (the 5658th base pair). Closed base pairs are highlighted in blue depending on the potential energy of hydrogen bonds; the lightest shade corresponds to pairs with a potential energy of <1.00 pN·nm, and the darkest—to pairs with a potential energy of >12.00 pN·nm.
From Figure 2b, it is clear that the distribution of the potential energy of hydrogen bonds depends on time: at first, the potential energy is evenly distributed between base pairs, and then it is redistributed and localized on individual DNA sections.
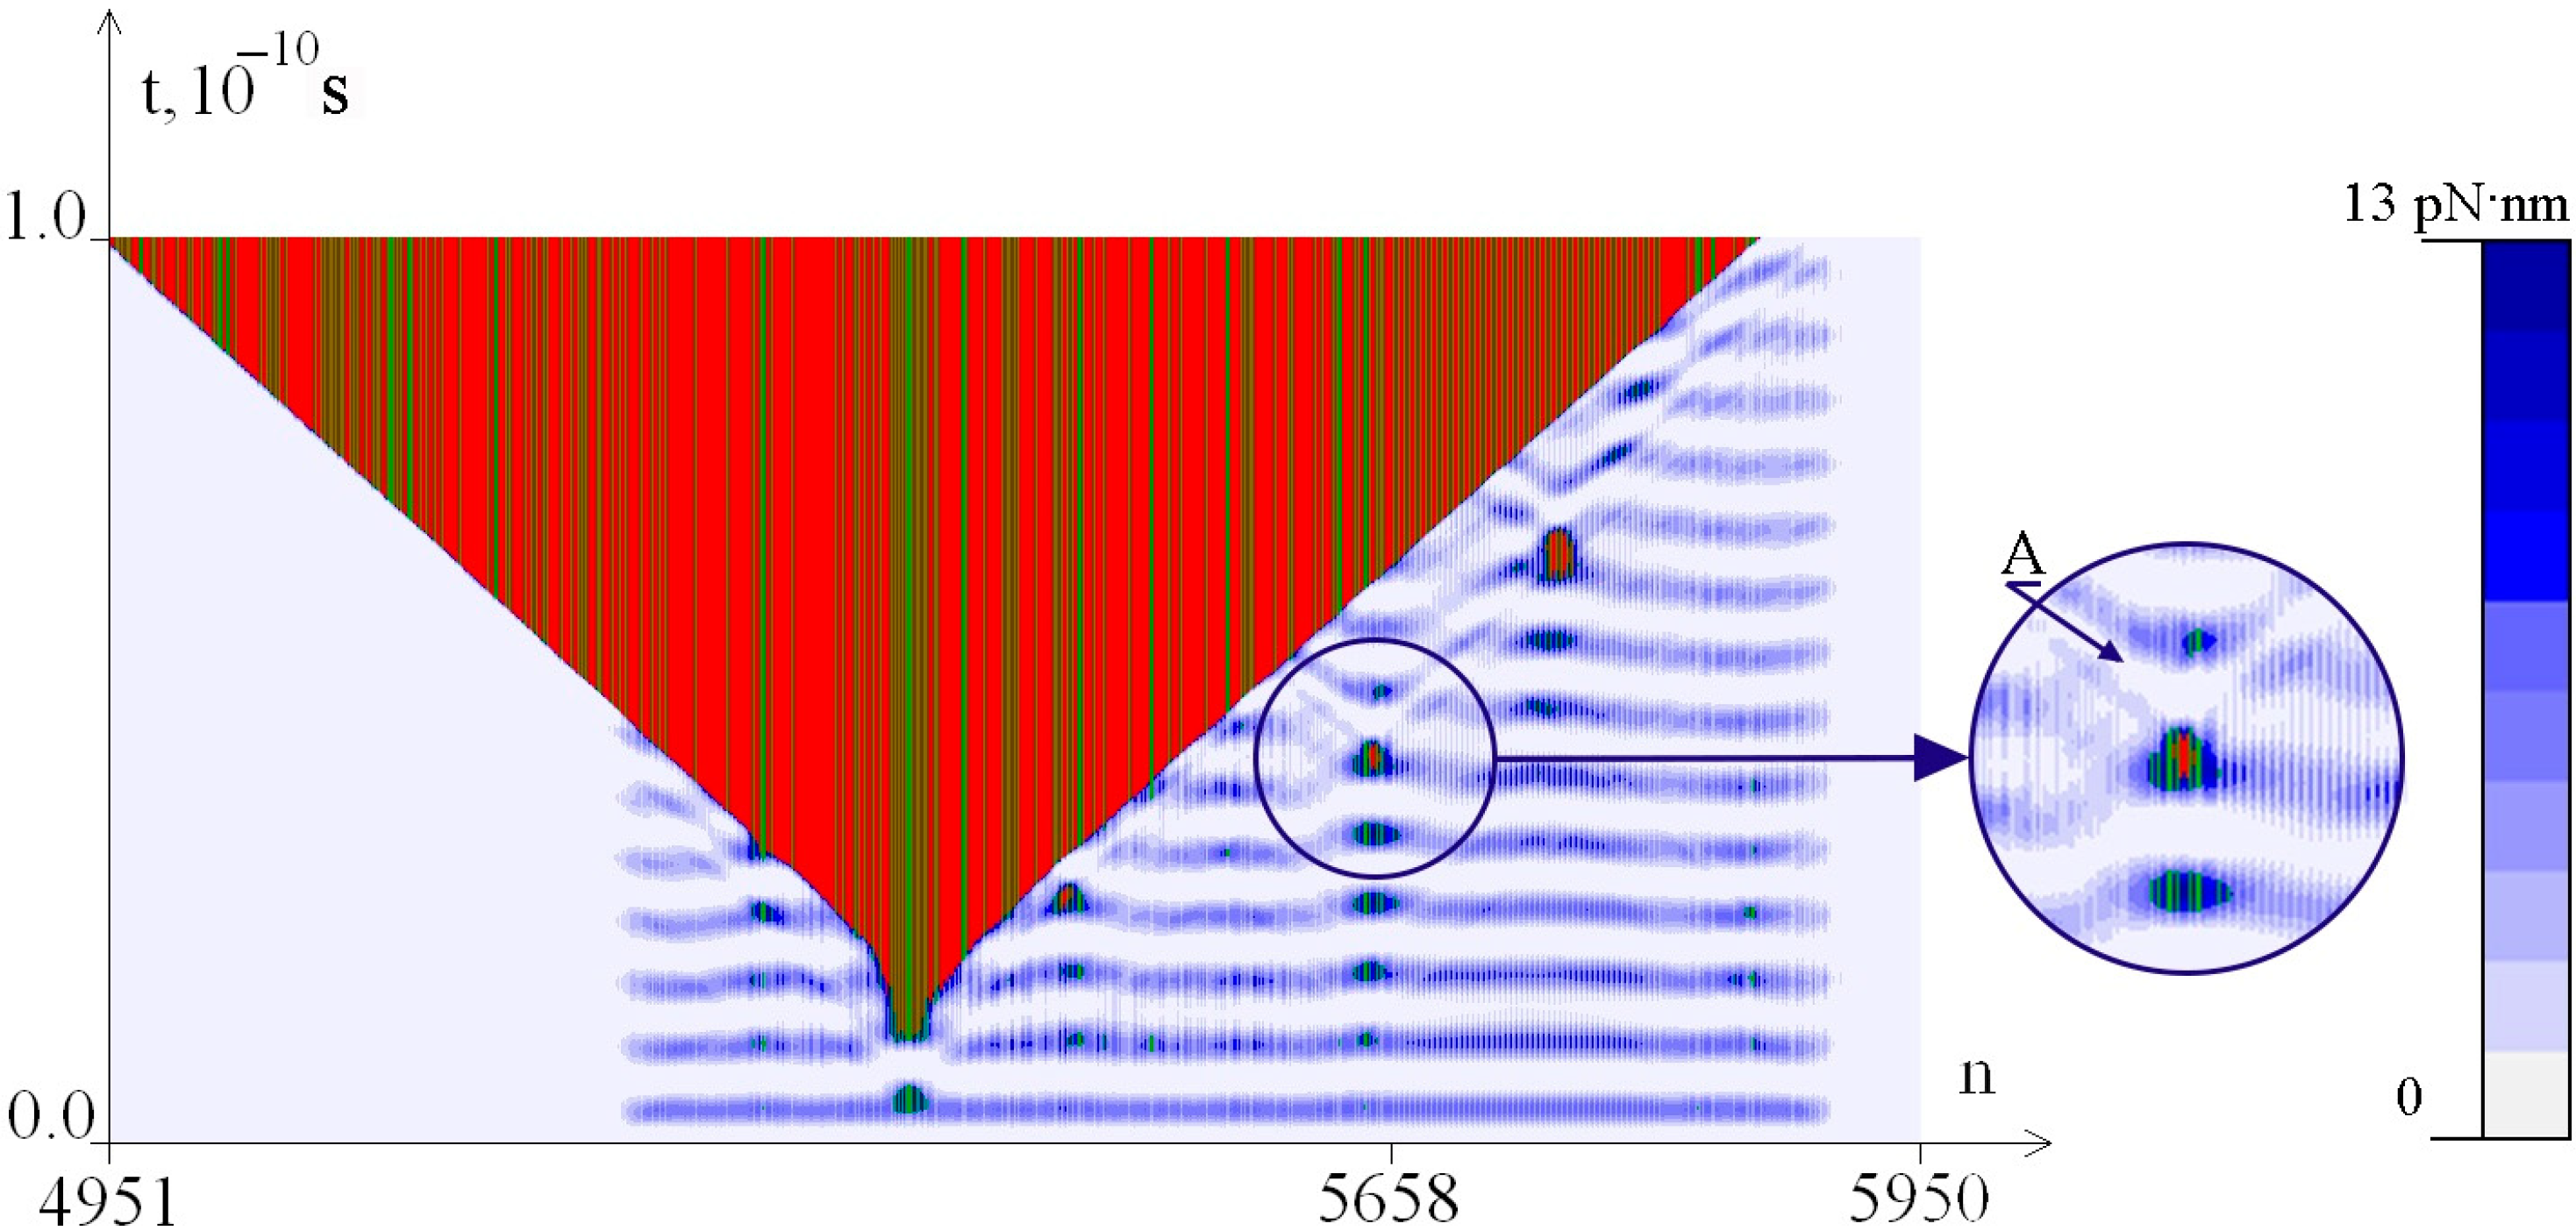
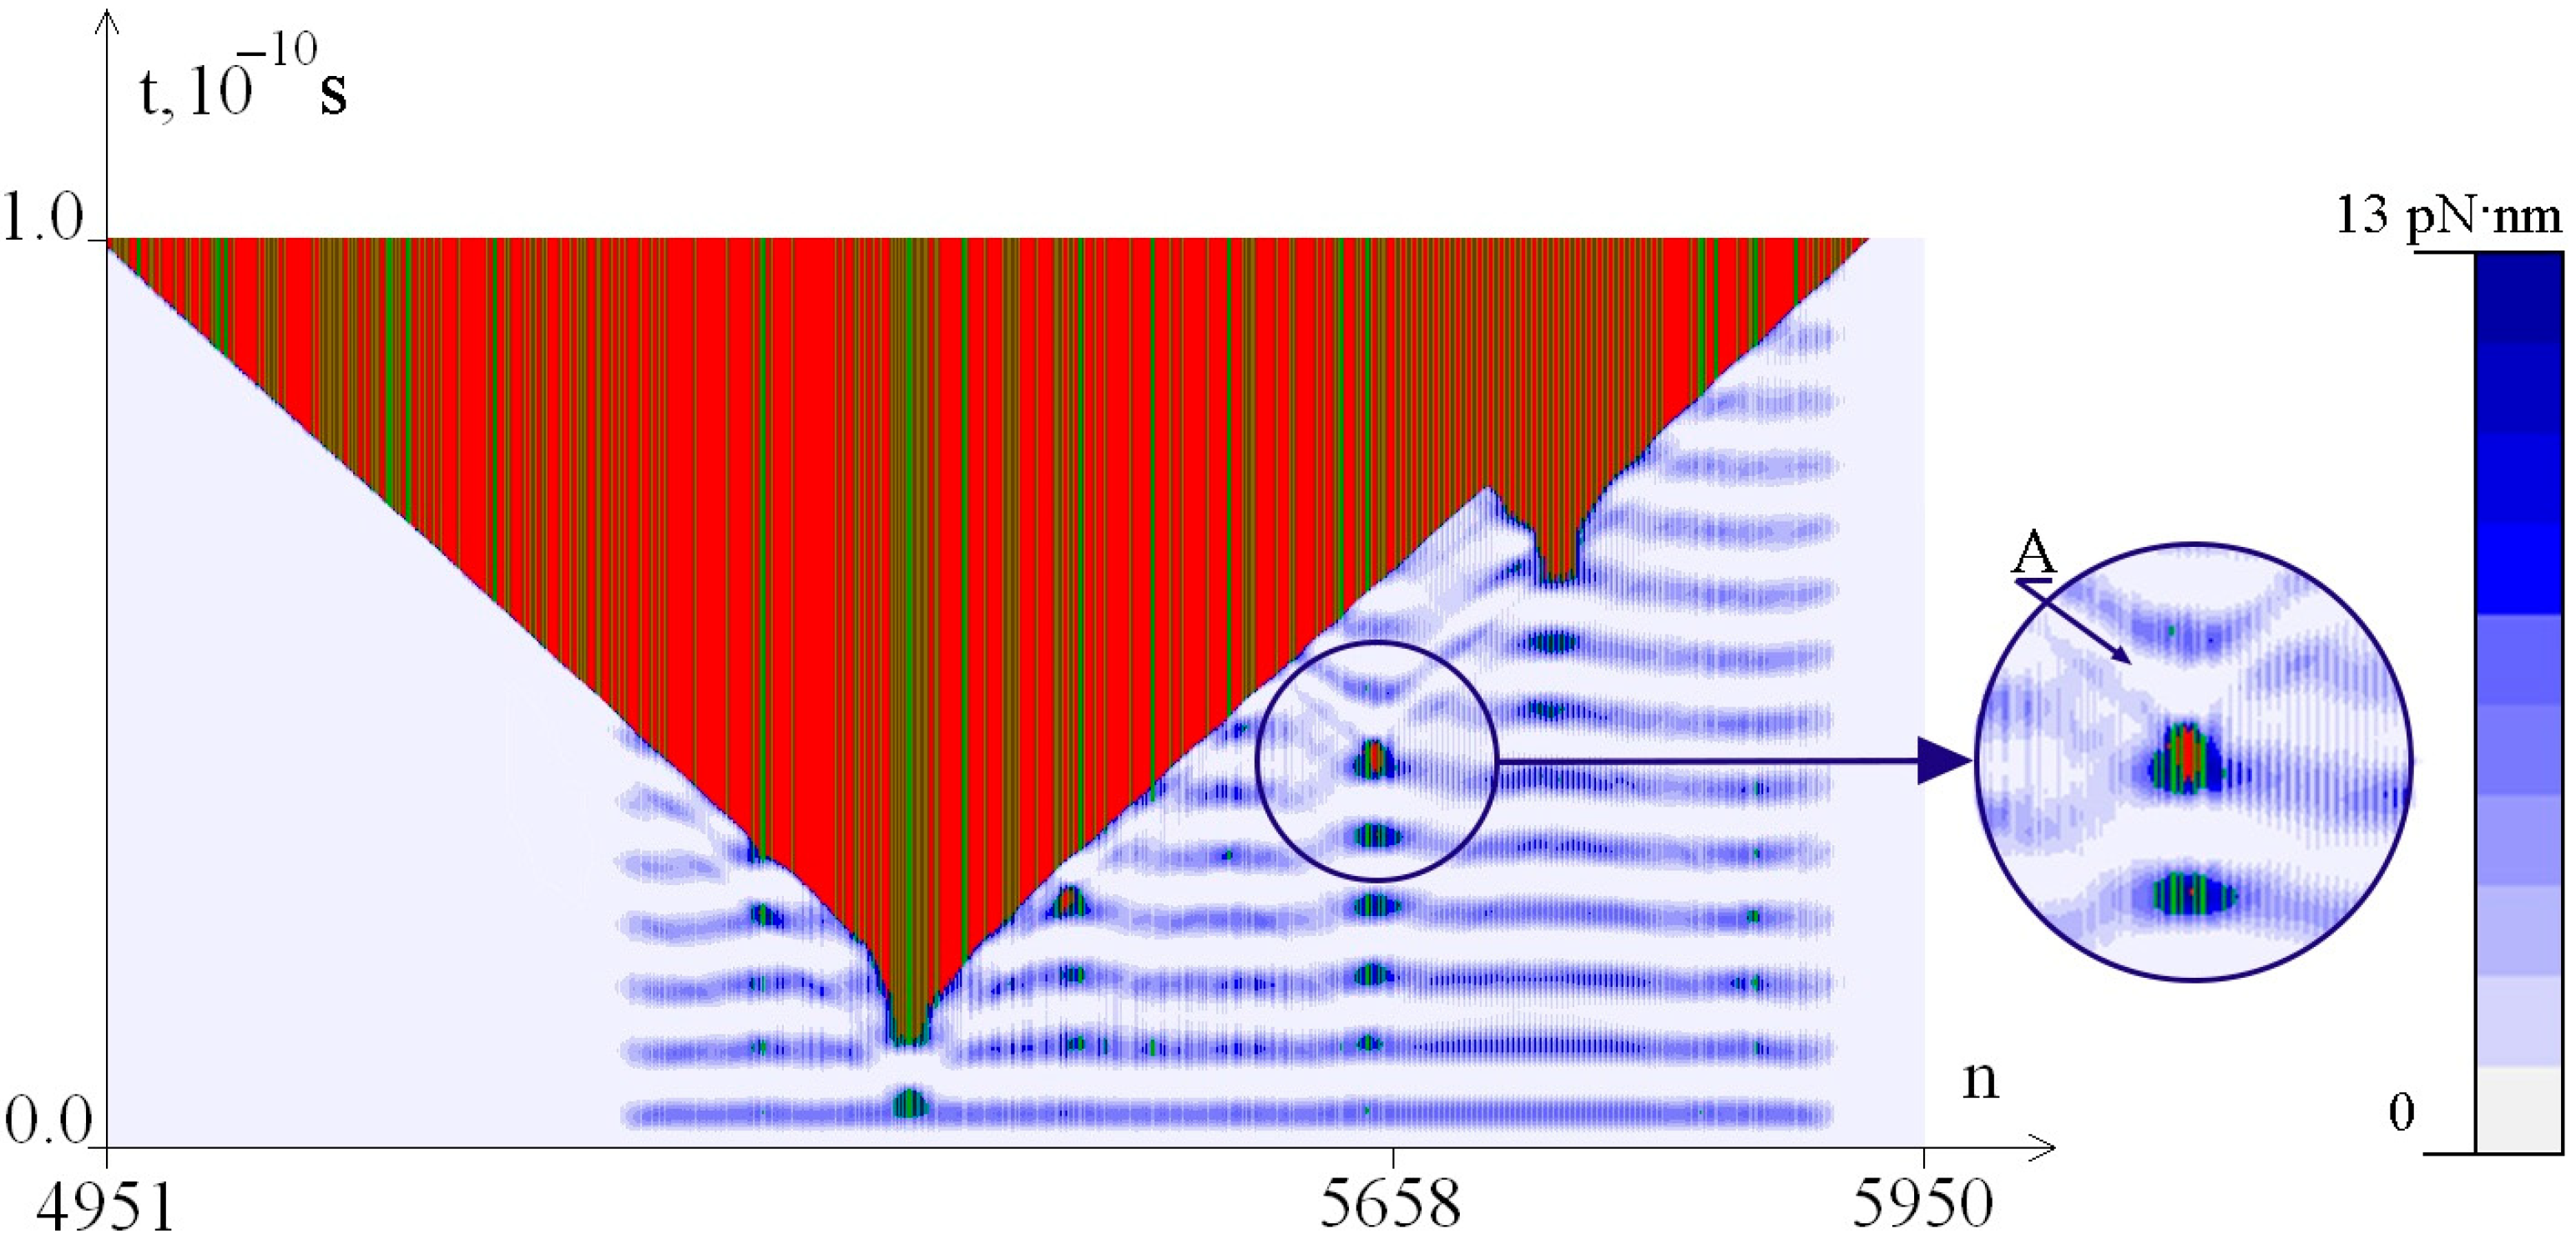
Figure 3, Figure 4 and Figure 5 show the dynamics of the OS zones genesis and the distribution of the potential energy of hydrogen bonds in base pairs depending on the value of M0. It can be seen that the potential energy of hydrogen bonds is localized in the CAG tract, which can lead to the appearance of additional OS zones of various sizes.
Thus, at M0 = 8.49 pN·nm (Figure 3), the accumulated energy is only sufficient to occur in a small OS zone, while at M0 = 8.50 pN·nm (Figure 4), we see the large OS zone genesis.
Enlarged fragments of the figures show that the appearance of small OS zones leads to a local decrease in the potential energy of hydrogen bonds in the opening areas. This can be explained by an increase in the angular velocity of base pairs in the OS zones and, consequently, a more intense dissipation of oscillation energy due to interaction with the environment. Therefore, a stronger torque can lead to earlier localization of potential energy sufficient for the formation of a small OS zone, which, due to the more intense dissipation of oscillation energy, will not allow the further formation of a large OS zone. This explains the non-monotonicity of the formation of OS zones with an increase in the magnitude of the torque M0, which can be seen when comparing Figure 4 (M0 = 8.50 pN·nm) and Figure 5 (M0 = 8.55 pN·nm). This non-monotonicity has been systematically identified in the works [57,58].
Figure 3. Dynamics of OS zones genesis and potential energy of hydrogen bonds in base pairs at M0 = 8.49 pN·nm. The green color in the figure indicates the OS in AT pairs, and the red color indicates the OS in GC pairs. Closed base pairs are highlighted in blue depending on the potential energy values of hydrogen bonds in accordance with the color scale shown on the right.
Ijms 26 00933 g003
The enlarged fragment shows (Figure 3) that the appearance of a small OS zone in the area occurs with a local decrease in the potential energy of hydrogen bonds, indicated by arrow A.
Figure 4 shows how the localization of the potential energy of hydrogen bonds in the CAG tract led to the formation of a large additional OS zone. The enlarged fragment shows that in the area where the small OS zone appears, there is a local decrease in the potential energy of hydrogen bonds, indicated by arrow A.
Figure 4. Dynamics of OS zones genesis and potential energy of hydrogen bonds in base pairs at M0 = 8.50 pN·nm. OS in AT pairs is shown in green, and OS in GC pairs is shown in red. Closed base pairs are highlighted in blue depending on the potential energy values of hydrogen bonds in accordance with the color scale shown on the right.
Ijms 26 00933 g004
The enlarged fragment shows (Figure 5) that in the area of the emergence of a small OS zone, there is a local decrease in the potential energy of hydrogen bonds, indicated by arrow A. This did not allow the formation of a large additional OS zone in the CAG tract.
Calculations show that, in general, an increase in the value of torque leads to an increase in the probability of the occurrence of additional large-sized OS zones [58]; however, this dependence is not monotonic.
Figure 5. Dynamics of OS zones genesis and potential energy of hydrogen bonds in base pairs at M0 = 8.55 pN·nm. OS in AT pairs is shown in green, and OS in GC pairs is shown in red. Closed base pairs are highlighted in blue depending on the potential energy values of hydrogen bonds in accordance with the color scale shown on the right.
Ijms 26 00933 g005

2.2. The Influence of the Environment Viscosity on the Distribution of Hydrogen Bonds Potential Energy

Figure 6 shows the dynamics of OS zones genesis and the distribution of the potential energy of hydrogen bonds in base pairs at M0 = 8.50 pN·nm for different values of λ, which characterizes the viscosity of the environment. It is evident that at λ = 0.9 and λ = 1.0, additional large OS zones appear in the CAG tract, while at λ = 1.1, they do not; i.e., in this case, the increase in viscosity is a stabilizing factor.
Calculations show that, in general, an increase in viscosity leads to a decrease in the probability of the occurrence of additional large OS zones [57]; however, this dependence is not monotonic. This is evident from Figure 7, which shows the dynamics of OS zones genesis and the distribution of the potential energy of hydrogen bonds in base pairs at M0 = 8.52 pN·nm, depending on the value of λ, which characterizes the viscosity of the environment. In this case, at λ = 0.9, small OS zones genesis in the CAG tract, and additional large OS zones genesis at λ = 1.0 and λ = 1.1. This is explained by the fact that the process of redistribution of the potential energy of hydrogen bonds in base pairs and localization of potential energy sufficient for the formation of OS zones is nonlinear.

2.3. The Influence of CAA Interruptions on the Distribution of Hydrogen Bonds Potential Energy

Figure 8 shows the influence of CAA interruptions in the CAG tract on the genesis of OS zones and the distribution of hydrogen bonds’ potential energy in base pairs. The results are shown for M0 = 8.57 pN·nm and CAA interruptions (replacement of the CAG trinucleotide with CAA in positions 15 and 25). It is evident from the figure that CAA interruptions affect the distribution of potential energy and can even lead to the formation of large additional OS zones.
Thus, the probability of the large-sized OS zones genesis on a DNA segment depends not only on the “strength” of the nucleotide sequence of this region but also on the factors that determine the dynamics of DNA.
The obtained results correlate with the data of other authors: the localization of energy in the DNA molecule and the potential energy of pairs of nitrogenous base interactions depend on the parameters of the environment [59,60,61,62]; the viscosity of the liquid surrounding the DNA molecule affects the nature of its wave oscillations [63,64,65,66,67].
In addition, despite the logical assumption that OS zones should appear in DNA regions with a large proportion of AT pairs, since they contain fewer hydrogen bonds than GC base pairs, in regions rich in AT pairs, the probability of the open states genesis will not always be higher [68,69,70].
Thus, the mathematical model allows us to calculate zones of the mechanical energy localization, which is necessary for the formation of OSs, and predict the locations of their nucleation, taking into account the mechanical oscillations of the DNA molecule [61].
The enlarged fragments of Figure 3, Figure 4 and Figure 5 show that the appearance of small OS zones leads to the dissipation of the potential energy of hydrogen bonds in these areas. This can occur due to an increase in the angular velocity of pairs of nitrogenous bases in the OS zones and a more intense dissipation of oscillation energy during interaction with the environment. Therefore, with a stronger torsional effect, localization of potential energy can occur, sufficient for the emergence of a small OS zone at an early stage, as a result of which additional dissipation of energy will occur. This will not allow a large OS zone to form in the future. This explains the non-monotonicity in the OS zones genesis caused by torque.

3. Materials and Methods

The study was carried out using mathematical modeling. We used the angular model of the DNA molecule [71,72], which is based on the analogy between a double-stranded DNA molecule and a mechanical system consisting of two chains of interconnected pendulums. In the model, pendulums correspond to nitrogenous bases. This analogy for modeling the rotational motion of DNA bases was first used by Englander et al. [73]. It was concluded that soliton-like solutions of the sine-Gordon equation, with which the authors modeled the rotational movements of the bases, describe the open states of DNA [74,75,76].
In this work, a numerical solution of the mathematical model equations was performed. This makes it possible to take into account the heterogeneity of the DNA molecule, to calculate the probability of the OSs genesis between pairs of complementary nitrogenous bases, and also allow the use of a wide range of external influences. The mathematical formulation of the problem is a system of ordinary differential equations with respect to the angular deviations of the pendulums [77]:
I 1 i d 2 φ 1 i ( t ) d t 2 = K 1 i φ 1 i 1 ( t ) 2 φ 1 i ( t ) + φ 1 i + 1 ( t )
δ i k 12 i R 1 i ( R 1 i + R 2 i ) s i n φ 1 i + k 12 i R 1 i R 2 i s i n ( φ 1 i φ 2 i ) +
F 1 i t , i = 2 , n 1 ¯ ,
I 1 1 d 2 φ 1 1 ( t ) d t 2 = K 1 1 φ 1 2 ( t ) φ 1 1 ( t )
δ i k 12 1 R 1 1 ( R 1 1 + R 2 1 ) s i n φ 1 1 + k 12 1 R 1 1 R 2 1 s i n ( φ 1 1 φ 2 1 ) + F 1 1 ( t ) ,
I 1 n d 2 φ 1 n ( t ) d t 2 = K 1 n φ 1 n 1 ( t ) φ 1 n ( t )
δ i k 12 n R 1 n R 1 n + R 2 n s i n φ 1 n + k 12 n R 1 n R 2 n sin φ 1 n φ 2 n + F 1 n t ,
I 2 i d 2 φ 2 i ( t ) d t 2 = K 2 i φ 2 i 1 ( t ) 2 φ 2 i ( t ) + φ 2 i + 1 ( t ) +
+ δ i k 12 i R 2 i R 1 i + R 2 i s i n φ 2 i k 12 i R 1 i R 2 i sin φ 2 i φ 1 i +
+ F 2 i ( t ) , i = 2 , n 1 ¯ ,
I 2 1 d 2 φ 2 1 t d t 2 = K 2 1 φ 2 2 t φ 2 1 t +
δ i k 12 1 R 2 1 ( R 1 1 + R 2 1 ) s i n φ 2 1 1 k 12 1 R 1 1 R 2 1 s i n ( φ 2 1 φ 1 1 ) + F 2 1 ( t ) ,
I 2 n d 2 φ 2 n ( t ) d t 2 = K 2 n φ 2 n 1 ( t ) φ 2 n ( t ) +
+ δ i k 12 n R 2 n ( R 1 n + R 2 n ) s i n φ 2 n k 12 n R 1 n R 2 n s i n ( φ 2 n φ 1 n ) + F 2 n ( t ) .
Here,
φ j i ( t ) —angular deviation of the i-pendulum of the j-chain, counted counterclockwise relatively straight line connecting complementary nitrogenous bases, at time t;
I j i —moment of inertia of the i-pendulum of the j-chain;
R j i —distance from the center of mass of the i-pendulum of the j-chain to the thread;
K j i —constant characterizing the torque of the i-section of the j-thread;
k 12 i —constant characterizing the elastic properties of the connection of the i-pair of pendulums;
F j i t —external influence on the i-pendulum of the j-chain at time t;
n —the number of pairs of pendulums in the system.
In Equations (1)–(6), the first term to the right of the equal sign describes the force action on the i-th pendulum from the side of the elastic thread, the second term—from the side of the paired pendulum, the third term—the external force action. The magnitude of the external influence is assumed to be equal to F j i ( t ) = β j i d φ j i d t ( t ) + M i ( t ) , where the term λ β j i d φ j i d t ( t ) models dissipation effects caused by interaction with the liquid surrounding the DNA molecule, the term M i ( t ) —torque.
By changing the parameter λ, we modeled the change in viscosity of the environment surrounding the DNA molecule.
Equations (1)–(6) make it possible to simulate a hydrogen bond in the i-th pair ( δ i = 1 ) and break that bond ( δ i = 0 ). We assume that a break occurs in i-th base pair if the potential energy of hydrogen bonds in this pair exceeds the critical value EAT for AT base pair and EGC for GC; the bond is restored if its potential energy becomes less than the corresponding critical value. The potential energy in the i-th pair of nitrogenous bases was taken to be equal to k 12 i · l 2 / 2 , where l is the distance between complementary nitrogenous bases.
To Equations (1)–(6), we add the initial conditions:
φ 1 i ( 0 ) = φ 1,0 i , d φ 1 i d t ( 0 ) = φ 1,1 i ,
φ 2 i 0 = φ 2,0 i , d φ 2 i d t 0 = φ 2,1 i , i = 1 , n ¯ .
The values of the coefficients of Equations (1)–(6) are given in Table 1. The data were taken from the work [71].
The values of the energy of hydrogen bond disrupting in AT and GC pairs were taken from [57]: EAT = 5.1020 pN nm, EGC = 12.7064 pN nm.
Using the initial conditions (7) and (8), an unperturbed state was specified:
φ 1,0 i = φ 1,1 i = φ 2,1 i = 0 , φ 2,0 i = π , i = 1 , n ¯ ,
The torque M i ( t ) was chosen to be constant in time and spatially localized on the segment [i1, i2]:
M i t = M 0 i ,   i = 1 , n ¯ ,
moreover, Mi0 = M0 at 1 ≤ i1ii2n and Mi0 = 0 for other i values.
The system (1)–(8) was solved numerically.
Calculations and figures were performed using an original computer program written by the authors of the article [78].

4. Conclusions

The results of our work allow us a deeper understanding of the mechanisms that lead to open states genesis. The study of hydrogen bonds’ potential energy allows us to predict its redistribution and localization sites depending on the nucleotide sequence and external factors.
The calculations performed showed that hydrogen bonds’ potential energy does not remain constant, and oscillatory movements lead to its redistribution and localization. In this case, open states play an important role, which can effectively dissipate the energy of oscillations. All this allows us to explain the non-monotonic dependence of the probability of open states occurrence with an increase in the value of external torque and a change in the viscosity of the environment.
When studying the occurrence of open states in the ATXN2 gene, an important role is played by additional OS zones that arise in the CAG tract, in which AT pairs make up only one-third. Studying the processes of nitrogenous bases’ mechanical oscillation potential energy redistribution allows us to answer the question of how the nucleotide sequence in the region of CAG repeats affects the stability of the polyQ tract.

Author Contributions

Conceptualization, M.D., S.D., and A.D.; methodology, M.D. and O.L. (Oksana Lyasota); software, A.S.; formal analysis, M.B., O.L. (Oksana Lyasota), and O.L. (Olga Leontyeva); writing—original draft preparation, M.D. and S.D.; writing—review and editing, S.D. and A.D.; funding acquisition, A.D. All authors have read and agreed to the published version of the manuscript.

Funding

The research is carried out with the financial support of the Russian Science Foundation and the Kuban Science Foundation in the framework of the scientific project Num. 24-14-20014, https://rscf.ru/en/project/24-14-20014/ (accessed on 11 November 2024).

Institutional Review Board Statement

Not applicable.

Informed Consent Statement

Not applicable.

Data Availability Statement

The raw data supporting the conclusions of this article will be made available by the authors on request.

Conflicts of Interest

The authors declare no conflicts of interest.

References

  1. Costa, R.G.; Conceição, A.; Matos, C.A.; Nóbrega, C. The polyglutamine protein ATXN2: From its molecular functions to its involvement in disease. Cell Death Dis. 2024, 15, 415. [Google Scholar] [CrossRef] [PubMed]
  2. Carmo-Silva, S.; Nobrega, C.; Pereira de Almeida, L.; Cavadas, C. Unraveling the role of ataxin-2 in metabolism. Trends Endocrinol. Metab. 2017, 28, 309–318. [Google Scholar] [CrossRef] [PubMed]
  3. Sonakar, A.K.; Shamim, U.; Srivastava, M.P.; Faruq, M.; Srivastava, A.K. SCA2 in the Indian population: Unified haplotype and variable phenotypic patterns in a large case series. Parkinsonism Relat. Disord. 2021, 89, 139–145. [Google Scholar] [CrossRef] [PubMed]
  4. Borrego-Hernández, D.; Vázquez-Costa, J.F.; Domínguez-Rubio, R.; Expósito-Blázquez, L.; Aller, E.; Padró-Miquel, A.; García-Casanova, P.; Colomina, M.J.; Martín-Arriscado, C.; Osta, R.; et al. Intermediate Repeat Expansion in the ATXN2 Gene as a Risk Factor in the ALS and FTD Spanish Population. Biomedicines 2024, 12, 356. [Google Scholar] [CrossRef]
  5. Iyer, R.R.; Pluciennik, A.; Napierala, M.; Wells, R.D. DNA triplet repeat expansion and mismatch repair. Annu. Rev. Biochem. 2015, 84, 199–226. [Google Scholar] [CrossRef]
  6. Polleys, E.J.; Del Priore, I.; Haber, J.E.; Freudenreich, C.H. Structure-forming CAG/CTG repeats interfere with gap repair to cause repeat expansions and chromosome breaks. Nat. Commun. 2023, 14, 2469. [Google Scholar] [CrossRef] [PubMed]
  7. Li, Y.; Liu, Z.; Hou, X.; Chen, Z.; Shen, L.; Xia, K.; Tang, B.; Jiang, H.; Wang, J. Effect of CAG repeats on the age at onset of patients with spinocerebellar ataxia type 2 in China. J. Cent. South Univ. Med. Sci. 2021, 46, 793–799. [Google Scholar] [CrossRef]
  8. Hu, T.; Morten, M.J.; Magennis, S.W. Conformational and migrational dynamics of slipped-strand DNA three-way junctions containing trinucleotide repeats. Nat. Commun. 2021, 12, 204. [Google Scholar] [CrossRef]
  9. Glass, J.D.; Dewan, R.; Ding, J.; Gibbs, J.R.; Dalgard, C.; Keagle, P.J.; Shankaracharya García-Redondo, A.; Traynor, B.J.; Chia, R.; Landers, J.E. ATXN2 intermediate expansions in amyotrophic lateral sclerosis. Brain 2022, 145, 2671–2676. [Google Scholar] [CrossRef]
  10. Pan, F.; Zhang, Y.; Xu, P.; Man, V.H.; Roland, C.; Weninger, K.; Sagui, C. Molecular conformations and dynamics of nucleotide repeats associated with neurodegenerative diseases: Double helices and CAG hairpin loops. Comput. Struct. Biotechnol. J. 2021, 19, 2819–2832. [Google Scholar] [CrossRef] [PubMed]
  11. Magaña, J.J.; Tapia-Guerrero, Y.S.; Velázquez-Pérez, L.; Cerecedo-Zapata, C.M.; Maldonado-Rodríguez, M.; Jano-Ito, J.S.; Leyva-García, N.; González-Piña, R.; Martínez-Cruz, E.; Hernández-Hernández, O.; et al. Analysis of CAG repeats in five SCA loci in Mexican population: Epidemiological evidence of a SCA7 founder effect. Clin. Genet. 2014, 85, 159–165. [Google Scholar] [CrossRef]
  12. Velázquez-Pérez, L.; Tünnerhoff, J.; Rodríguez-Labrada, R.; Torres-Vega, R.; Ruiz-Gonzalez, Y.; Belardinelli, P.; Medrano-Montero, J.; Canales-Ochoa, N.; González-Zaldivar, Y.; Vazquez-Mojena, Y.; et al. Early corticospinal tract damage in prodromal SCA2 revealed by EEG-EMG and EMG-EMG coherence. Clin. Neurophysiol. 2017, 128, 2493–2502. [Google Scholar] [CrossRef]
  13. Yokoshi, M.; Li, Q.; Yamamoto, M.; Okada, H.; Suzuki, Y.; Kawahara, Y. Direct binding of Ataxin-2 to distinct elements in 3’ UTRs promotes mRNA stability and protein expression. Mol. Cell 2014, 55, 186–198. [Google Scholar] [CrossRef] [PubMed]
  14. Orr, H.T.; Zoghbi, H.Y. Trinucleotide repeat disorders. Annu. Rev. Neurosci. 2007, 30, 575–621. [Google Scholar] [CrossRef] [PubMed]
  15. Choudhry, S.; Mukerji, M.; Srivastava, A.K.; Jain, S.; Brahmachari, S.K. CAG repeat instability at SCA2 locus: Anchoring CAA interruptions and linked single nucleotide polymorphisms. Hum. Mol. Genet. 2001, 10, 2437–2446. [Google Scholar] [CrossRef] [PubMed]
  16. Rodriguez-Labrada, R.; Ortega-Sanchez, R.; Hernández Casaña, P.; Santos Morales, O.; Padrón-Estupiñan, M.D.C.; Batista-Nuñez, M.; Jiménez Rodríguez, D.; Canales-Ochoa, N.; Peña Acosta, A.; Medrano Montero, J.; et al. Erythropoietin in Spinocerebellar Ataxia Type 2: Feasibility and Proof-of-Principle Issues from a Randomized Controlled Study. Mov. Disord. 2022, 37, 1516–1525. [Google Scholar] [CrossRef] [PubMed]
  17. Tang, B.; Liu, C.; Shen, L.; Dai, H.; Pan, Q.; Jing, L.; Ouyang, S.; Xia, J. Frequency of SCA1, SCA2, SCA3/MJD, SCA6, SCA7, and DRPLA CAG trinucleotide repeat expansion in patients with hereditary spinocerebellar ataxia from Chinese kindreds. Arch. Neurol. 2000, 57, 540–544. [Google Scholar] [CrossRef] [PubMed]
  18. Vázquez-Mojena, Y.; Rodríguez-Córdova, Y.; Dominguez-Barrios, Y.; León-Arcia, K.; Miranda-Becerra, D.; Gonzalez-Zaldivar, Y.; Guerra-Bustillos, G.; Ziemann, U.; Auburger, G.; Rodríguez-Labrada, R.; et al. Peripheral Inflammation Links with the Severity of Clinical Phenotype in Spinocerebellar Ataxia 2. Mov. Disord. 2023, 38, 880–885. [Google Scholar] [CrossRef]
  19. Wang, J.L.; Xiao, B.; Cui, X.X.; Guo, J.F.; Lei, L.F.; Song, X.W.; Shen, L.; Jiang, H.; Yan, X.X.; Pan, Q.; et al. Analysis of SCA2 and SCA3/MJD repeats in Parkinson’s disease in mainland China: Genetic, clinical, and positron emission tomography findings. Mov. Disord. 2009, 24, 2007–2011. [Google Scholar] [CrossRef] [PubMed]
  20. Hou, X.; Li, W.; Liu, P.; Liu, Z.; Yuan, Y.; Ni, J.; Shen, L.; Tang, B.; Wang, J. The Clinical and Polynucleotide Repeat Expansion Analysis of ATXN2, NOP56, AR and C9orf72 in Patients With ALS From Mainland China. Front. Neurol. 2022, 3, 811202. [Google Scholar] [CrossRef] [PubMed]
  21. Yu, Z.; Zhu, Y.; Chen-Plotkin, A.S.; Clay-Falcone, D.; McCluskey, L.; Elman, L.; Kalb, R.G.; Trojanowski, J.Q.; Lee, V.M.; Van Deerlin, V.M.; et al. PolyQ repeat expansions in ATXN2 associated with ALS are CAA interrupted repeats. PLoS ONE 2011, 6, e17951. [Google Scholar] [CrossRef] [PubMed]
  22. Liu, Z.; Yuan, Y.; Wang, M.; Ni, J.; Li, W.; Huang, L.; Hu, Y.; Liu, P.; Hou, X.; Hou, X.; et al. Mutation spectrum of amyotrophic lateral sclerosis in Central South China. Neurobiol. Aging 2021, 107, 181–188. [Google Scholar] [CrossRef] [PubMed]
  23. Salmon, K.; Ross, J.P.; Bertone, V.; Gobbo, M.; Anoja, N.; Karamchandani, J.; Dion, P.A.; Rouleau, G.A.; Genge, A. The value of testing for ATXN2 intermediate repeat expansions in routine clinical practice for amyotrophic lateral sclerosis. Eur. J. Hum. Genet. 2022, 30, 1205–1207. [Google Scholar] [CrossRef]
  24. Scoles, D.R.; Gandelman, M.; Paul, S.; Dexheimer, T.; Dansithong, W.; Figueroa, K.P.; Pflieger, L.T.; Redlin, S.; Kales, S.C.; Sun, H.; et al. A quantitative high-throughput screen identifies compounds that lower expression of the SCA2-and ALS-associated gene ATXN2. J. Biol. Chem. 2022, 298, 102228. [Google Scholar] [CrossRef] [PubMed]
  25. Monte, T.L.; Reckziegel, E.D.R.; Augustin, M.C.; Locks-Coelho, L.D.; Santos, A.S.P.; Furtado, G.V.; de Mattos, E.P.; Pedroso, J.L.; Barsottini, O.P.; Vargas, F.R.; et al. The progression rate of spinocerebellar ataxia type 2 changes with stage of disease. Orphanet. J. Rare. Dis. 2018, 13, 20. [Google Scholar] [CrossRef] [PubMed]
  26. Blazek, A.M.; Meade, G.; Jackson, L.M.; Gavrilova, R.; Stierwalt, J.; Martinez-Thompson, J.M.; Duffy, J.R.; Clark, H.; Machulda, M.M.; Whitwell, J.L.; et al. Progressive Apraxia of Speech as a Manifestation of Spinocerebellar Ataxia 2 Case Report. Neurol. Genet. 2024, 10, e200202. [Google Scholar] [CrossRef] [PubMed]
  27. Vieira de Sá, R.; Sudria-Lopez, E.; Cañizares Luna, M.; Harschnitz, O.; van den Heuvel, D.M.A.; Kling, S.; Vonk, D.; Westeneng, H.J.; Karst, H.; Bloemenkamp, L.; et al. ATAXIN-2 intermediate-length polyglutamine expansions elicit ALS-associated metabolic and immune phenotypes. Nat. Commun. 2024, 15, 7484. [Google Scholar] [CrossRef] [PubMed]
  28. Ghahremani Nezhad, H.; Franklin, J.P.; Alix, J.J.P.; Moll, T.; Pattrick, M.; Cooper-Knock, J.; Shanmugarajah, P.; Beauchamp, N.J.; Hadjivissiliou, M.; Paling, D.; et al. Simultaneous ALS and SCA2 associated with an intermediate-length ATXN2 CAG-repeat expansion. Amyotroph. Lateral Scler. Front. Degener. 2021, 22, 579–582. [Google Scholar] [CrossRef]
  29. Charles, P.; Camuzat, A.; Benammar, N.; Sellal, F.; Destée, A.; Bonnet, A.M.; Lesage, S.; Le Ber, I.; Stevanin, G.; Dürr, A.; et al. French Parkinson’s Disease Genetic Study Group. Are interrupted SCA2 CAG repeat expansions responsible for parkinsonism? Neurology 2007, 69, 1970–1975. [Google Scholar] [CrossRef] [PubMed]
  30. Tan, D.; Wei, C.; Chen, Z.; Huang, Y.; Deng, J.; Li, J.; Liu, Y.; Bao, X.; Xu, J.; Hu, Z.; et al. CAG Repeat Expansion in THAP11 Is Associated with a Novel Spinocerebellar Ataxia. Mov. Disord. 2023, 38, 1282–1293. [Google Scholar] [CrossRef] [PubMed]
  31. Ferrari, V.; Conti, M.; Bovenzi, R.; Cerroni, R.; Pierantozzi, M.; Mercuri, N.B.; Stefani, A. Rare association between spinocerebellar ataxia and amyotrophic lateral sclerosis: A case series. Neurol. Sci. 2024, 45, 4367–4371. [Google Scholar] [CrossRef] [PubMed]
  32. Niewiadomska-Cimicka, A.; Fievet, L.; Surdyka, M.; Jesion, E.; Keime, C.; Singer, E.; Eisenmann, A.; Kalinowska-Poska, Z.; Nguyen, H.H.P.; Fiszer, A.; et al. AAV-Mediated CAG-Targeting Selectively Reduces Polyglutamine-Expanded Protein and Attenuates Disease Phenotypes in a Spinocerebellar Ataxia Mouse Model. Int. J. Mol. Sci. 2024, 25, 4354. [Google Scholar] [CrossRef]
  33. Paul, S.; Dansithong, W.; Gandelman, M.; Figueroa, K.P.; Scoles, D.R.; Pulst, S.M. Cerebellar Micro-RNA Profile in a Mouse Model of Spinocerebellar Ataxia Type 2. Neurol. Genet. 2024, 10, e200144. [Google Scholar] [CrossRef] [PubMed]
  34. Scoles, D.R.; Dansithong, W.; Pflieger, L.T.; Paul, S.; Gandelman, M.; Figueroa, K.P.; Rigo, F.; Bennett, C.F.; Pulst, S.M. ALS-associated genes in SCA2 mouse spinal cord transcriptomes. Hum. Mol. Genet. 2020, 29, 1658–1672. [Google Scholar] [CrossRef] [PubMed]
  35. Nikitiuk, A.S.; Burmistrova, O.S.; Naimark, O.B. Study of the DNA denaturation based on the Peyrard-Bishop-Dauxois model and recurrence quantification analysis. Rus. J. Biomech. 2022, 26, 34–44. [Google Scholar] [CrossRef]
  36. Manghi, M.; Destainville, N. Physics of base-pairing dynamics in DNA. Phys. Rep. 2016, 631, 1–41. [Google Scholar] [CrossRef]
  37. Khater, M.M.A.; Zakarya, M.; Nisar Sooppy, K.; Abdel-Aty, A.H. Dynamics and stability analysis of nonlinear DNA molecules: Insights from the Peyrard-Bishop model. AIMS Math. 2024, 9, 23449–23467. [Google Scholar] [CrossRef]
  38. Tantawy, M.; Abdel-Gawad, H.I. Dynamics of molecules in torsional DNA exposed to microwave and possible impact on its deformation: Stability analysis. Eur. Phys. J. Plus 2024, 139, 312. [Google Scholar] [CrossRef]
  39. Chevizovich, D.; Michieletto, D.; Mvogo, A.; Zakiryanov, F.; Zdravković, S. A review on nonlinear DNA physics. R. Soc. Open Sci. 2020, 7, 200774. [Google Scholar] [CrossRef] [PubMed]
  40. Sobczak, K.; Krzyzosiak, W.J. CAG Repeats Containing CAA Interruptions Form Branched Hairpin Structures in Spinocerebellar Ataxia Type 2 Transcripts. J. Biol. Chem. 2005, 280, 3898–3910. [Google Scholar] [CrossRef] [PubMed]
  41. Wang, J.Y.; Liu, Y.J.; Zhang, X.L.; Liu, Y.H.; Jiang, L.L.; Hu, H.Y. PolyQ-expanded ataxin-2 aggregation impairs cellular processing-body homeostasis via sequestering the RNA helicase DDX6. J. Biol. Chem. 2024, 300, 107413. [Google Scholar] [CrossRef] [PubMed]
  42. Stezin, A.; Sathe, G.J.; Gajbhiye, A.; Bharadwaj, S.; Ghose, V.; Bellad, A.; Malo, P.K.; Holla, V.; Hegde, S.; Bharath, R.D.; et al. Dysregulated Cerebrospinal Fluid Proteome of Spinocerebellar Ataxia Type 2 and its Clinical Implications. Mov. Disord. 2024, 39, 1418–1423. [Google Scholar] [CrossRef]
  43. Xu, Y.D.; Zhou, X.Y.; Wei, S.D.; Liu, F.T.; Zhao, J.; Tang, Y.L.; Shen, B.; Ding, Z.T.; Wu, J.J.; Sun, Y.M.; et al. Clinical features, disease progression, and nuclear imaging in ATXN2-related parkinsonism in a longitudinal cohort. Neurol. Sci. 2024, 45, 3191–3200. [Google Scholar] [CrossRef] [PubMed]
  44. Lyasota, O.; Dorohova, A.; Hernandez-Caceres, J.L.; Svidlov, A.; Tekutskaya, E.; Drobotenko, M.; Dzhimak, S. Stability of the CAG Tract in the ATXN2 Gene Depends on the Localization of CAA Interruptions. Biomedicines 2024, 12, 1648. [Google Scholar] [CrossRef]
  45. Matos-Rodrigues, G.; Hisey, J.A.; Nussenzweig, A.; Mirkin, S.M. Detection of alternative DNA structures and its implications for human disease. Mol. Cell 2023, 83, 3622–3641. [Google Scholar] [CrossRef]
  46. Ni, C.W.; Wei, Y.J.; Shen, Y.I.; Lee, I.R. Long-Range Hairpin Slippage Reconfiguration Dynamics in Trinucleotide Repeat Sequences. J. Phys. Chem. Lett. 2019, 10, 3985–3990. [Google Scholar] [CrossRef] [PubMed]
  47. Xu, P.; Pan, F.; Roland, C.; Sagui, C.; Weninger, K. Dynamics of strand slippage in DNA hairpins formed by CAG repeats: Role of sequence parity and trinucleotide interrupts. Nucl. Acids Res. 2020, 48, 2232. [Google Scholar] [CrossRef]
  48. Xu, P.; Zhang, J.; Pan, F.; Mahn, C.; Roland, C.; Sagui, C.; Weninger, K. Frustration Between Preferred States of Complementary Trinucleotide Repeat DNA Hairpins Anticorrelates with Expansion Disease Propensity. J. Mol. Biol. 2023, 435, 168086. [Google Scholar] [CrossRef] [PubMed]
  49. Belotserkovskii, B.P.; Hanawalt, P.C. Topology and kinetics of R-loop formation. Biophys. J. 2022, 121, 3345–3357. [Google Scholar] [CrossRef] [PubMed]
  50. Murmann, A.E.; Patel, M.; Jeong, S.Y.; Bartom, E.T.; Jennifer Morton, A.; Peter, M.E. The length of uninterrupted CAG repeats in stem regions of repeat disease associated hairpins determines the amount of short CAG oligonucleotides that are toxic to cells through RNA interference. Cell Death Dis. 2022, 13, 1078. [Google Scholar] [CrossRef]
  51. Tevonyan, L.L.; Beniaminov, A.D.; Kaluzhny, D.N. Quenching of G4-DNA intrinsic fluorescence by ligands. Eur. Biophys. J. 2024, 53, 47–56. [Google Scholar] [CrossRef]
  52. Belotserkovskii, B.P.; Hanawalt, P.C. Mechanism for R-loop formation remote from the transcription start site: Topological issues and possible facilitation by dissociation of RNA polymerase. DNA Repair. 2022, 110, 103275. [Google Scholar] [CrossRef]
  53. Crossley, M.P.; Bocek, M.; Cimprich, K.A. R-Loops as Cellular Regulators and Genomic Threats. Mol. Cell 2019, 73, 398–411. [Google Scholar] [CrossRef] [PubMed]
  54. Drobotenko, M.I.; Lyasota, O.M.; Hernandez-Caceres, J.L.; Rodriguez-Labrada, R.; Svidlov, A.A.; Dorohova, A.A.; Baryshev, M.G.; Nechipurenko, Y.D.; Velázquez-Pérez, L.; Dzhimak, S.S. Abnormal open states patterns in the ATXN2 DNA sequence depends on the CAG repeats length. Intl. J. Biol. Macromol. 2024, 276, 133849. [Google Scholar] [CrossRef] [PubMed]
  55. Dorohova, A.; Lyasota, O.; Dzhimak, S.; Svidlov, A.; Leontyeva, O.; Drobotenko, M. Fluctuations in Medium Viscosity May Affect the Stability of the CAG Tract in the ATXN2 Gene. Biomedicines 2024, 12, 2396. [Google Scholar] [CrossRef] [PubMed]
  56. Dorohova, A.; Lyasota, O.; Svidlov, A.; Anashkina, A.; Tekutskaya, E.; Dzhimak, S.; Drobotenko, M. Ratio of AT and GC pairs in the zones of open states genesis in DNA molecules. Front. Biosci. (Landmark Ed.) 2024, 29, 381. [Google Scholar] [CrossRef]
  57. Drobotenko, M.; Svidlov, A.; Dorohova, A.; Baryshev, M.; Dzhimak, S. Medium viscosity influence on the open states genesis in a DNA molecule. J. Biomolec. Struc. Dyn. 2023, 1–9. [Google Scholar] [CrossRef]
  58. Dzhimak, S.; Svidlov, A.; Elkina, A.; Gerasimenko, E.; Baryshev, M.; Drobotenko, M. Genesis of Open States Zones in a DNA Molecule Depends on the Localization and Value of the Torque. Int. J. Mol. Sci. 2022, 23, 4428. [Google Scholar] [CrossRef] [PubMed]
  59. Tabi, C.B.; Bineli, G.; Mohamadou, A. Energy patterns in twist-opening models of DNA with solvent interactions. J. Biol. Phys. 2015, 41, 391–408. [Google Scholar] [CrossRef] [PubMed]
  60. Li, R.; Mak, C.H. A Deep Dive into DNA Base Pairing Interactions under Water. J. Phys. Chem. B 2020, 124, 5559–55709. [Google Scholar] [CrossRef]
  61. Kannan, S.; Zacharias, M. Folding of a DNA hairpin loop structure in explicit solvent using replica-exchange molecular dynamics simulations. Biophys. J. 2007, 93, 3218–3228. [Google Scholar] [CrossRef]
  62. Völker, J.; Eric Plum, G.; Gindikin, V.; Breslauer, K.J. Dynamic DNA energy landscapes and substrate complexity in triplet repeat expansion and DNA repair. Biomolecules 2019, 9, 709. [Google Scholar] [CrossRef] [PubMed]
  63. Zdravković, S.; Satarić, M.V.; Hadžievski, L.J. DNA-RNA transcription as an impact of viscosity. Chaos 2010, 20, 043141. [Google Scholar] [CrossRef] [PubMed]
  64. Svidlov, A.; Drobotenko, M.; Basov, A.; Gerasimenko, E.; Elkina, A.; Baryshev, M.; Nechipurenko, Y.; Dzhimak, S. Influence of Environmental Parameters on the Stability of the DNA Molecule. Entropy 2021, 23, 1446. [Google Scholar] [CrossRef] [PubMed]
  65. Tabi, C.B.; Mohamadou, A.; Kofané, T.C. Modulated wave packets in DNA and impact of viscosity. Chin. Phys. Lett. 2009, 26, 068703. [Google Scholar] [CrossRef]
  66. Tabi, C.B.; Mohamadou, A.; Kofané, T.C. Modulational instability and pattern formation on DNA dynamics with viscosity. J. Comp. Theor. Nanosci. 2008, 5, 647–654. [Google Scholar] [CrossRef]
  67. Saha, M.; Kofané, T.C. DNA base pairs openings perturbed by the surrounding medium. Comm. Non. Sci. Num. Sim. 2015, 23, 1–9. [Google Scholar] [CrossRef]
  68. Dornberger, U.; Leijon, M.; Fritzsche, H. High base pair opening rates in tracts of GC base pairs. J. Biol. Chem. 1999, 274, 6957–6962. [Google Scholar] [CrossRef]
  69. Choi, C.H.; Kalosakas, G.; Rasmussen, K.O.; Hiromura, M.; Bishop, A.R.; Usheva, A. DNA dynamically directs its own transcription initiation. Nucleic Acids Res. 2004, 32, 1584–1590. [Google Scholar] [CrossRef] [PubMed]
  70. Kalosakas, G.; Rasmussen, K.O.; Bishop, A.R.; Choi, C.H.; Usheva, A. Sequence-specific thermal fluctuations identify start sites for DNA transcription. Europhys. Lett. 2004, 68, 127–133. [Google Scholar] [CrossRef]
  71. Yakushevich, L.V. Nonlinear Physics of DNA.; John Wiley & Sons: Hoboken, HJ, USA, 2007; p. 252. [Google Scholar] [CrossRef]
  72. Drobotenko, M.I.; Dzhimak, S.S.; Svidlov, A.A.; Basov, A.A.; Lyasota, O.M.; Baryshev, M.G. A mathematical model for basepair opening in a DNA double helix. Biophysics 2018, 63, 177–182. [Google Scholar] [CrossRef]
  73. Englander, S.W.; Kallenbach, N.R.; Heeger, A.J.; Krumhansl, J.A.; Litwin, S. Nature of the open state in long polynucleotide double helices: Possibility of soliton excitations. Proc. Natl. Acad. Sci. USA 1980, 77, 7222–7226. [Google Scholar] [CrossRef]
  74. Krasnobaeva, L.A.; Yakushevich, L.V. The dynamic and statistical properties of DNA kinks. Biophysics 2020, 65, 22–27. [Google Scholar] [CrossRef]
  75. Masulis, I.; Grinevich, A.; Yakushevich, L. Dynamics of Open States and Promoter Functioning in the appY_red and appY_green Genetic Constructions Based on the pPF1 Plasmid. Front. Biosci. (Landmark Ed.) 2024, 29, 155. [Google Scholar] [CrossRef] [PubMed]
  76. Yakushevich, L.V.; Krasnobaeva, L.A. Trajectories of solitons movement in the potential field of pPF1 plasmid with non-zero initial velocity. Math. Biol. Bioinform. 2024, 19, 232–247. [Google Scholar] [CrossRef]
  77. Svidlov, A.A.; Drobotenko, M.I.; Basov, A.A.; Elkina, A.A.; Gerasimenko, E.O.; Malyshko, V.V.; Baryshev, M.G.; Dzhimak, S.S. Influence of the 2H/1H isotope composition of the water environment on the probability of denaturation bubble formation in a DNA molecule. Phys. Wave Phen. 2021, 29, 180–185. [Google Scholar] [CrossRef]
  78. Drobotenko, M.I.; Svidlov, A.A.; Baryshev, M.G.; Dzhimak, S.S. Calculation of Rotational Motions in a Double-Stranded DNA Molecule, Computer Program Registration Certificate RU 2017660682. Available online: https://new.fips.ru/registers-doc-view/fips_servlet?DB=EVM&DocNumber=2017660682&TypeFile=html (accessed on 27 November 2024).
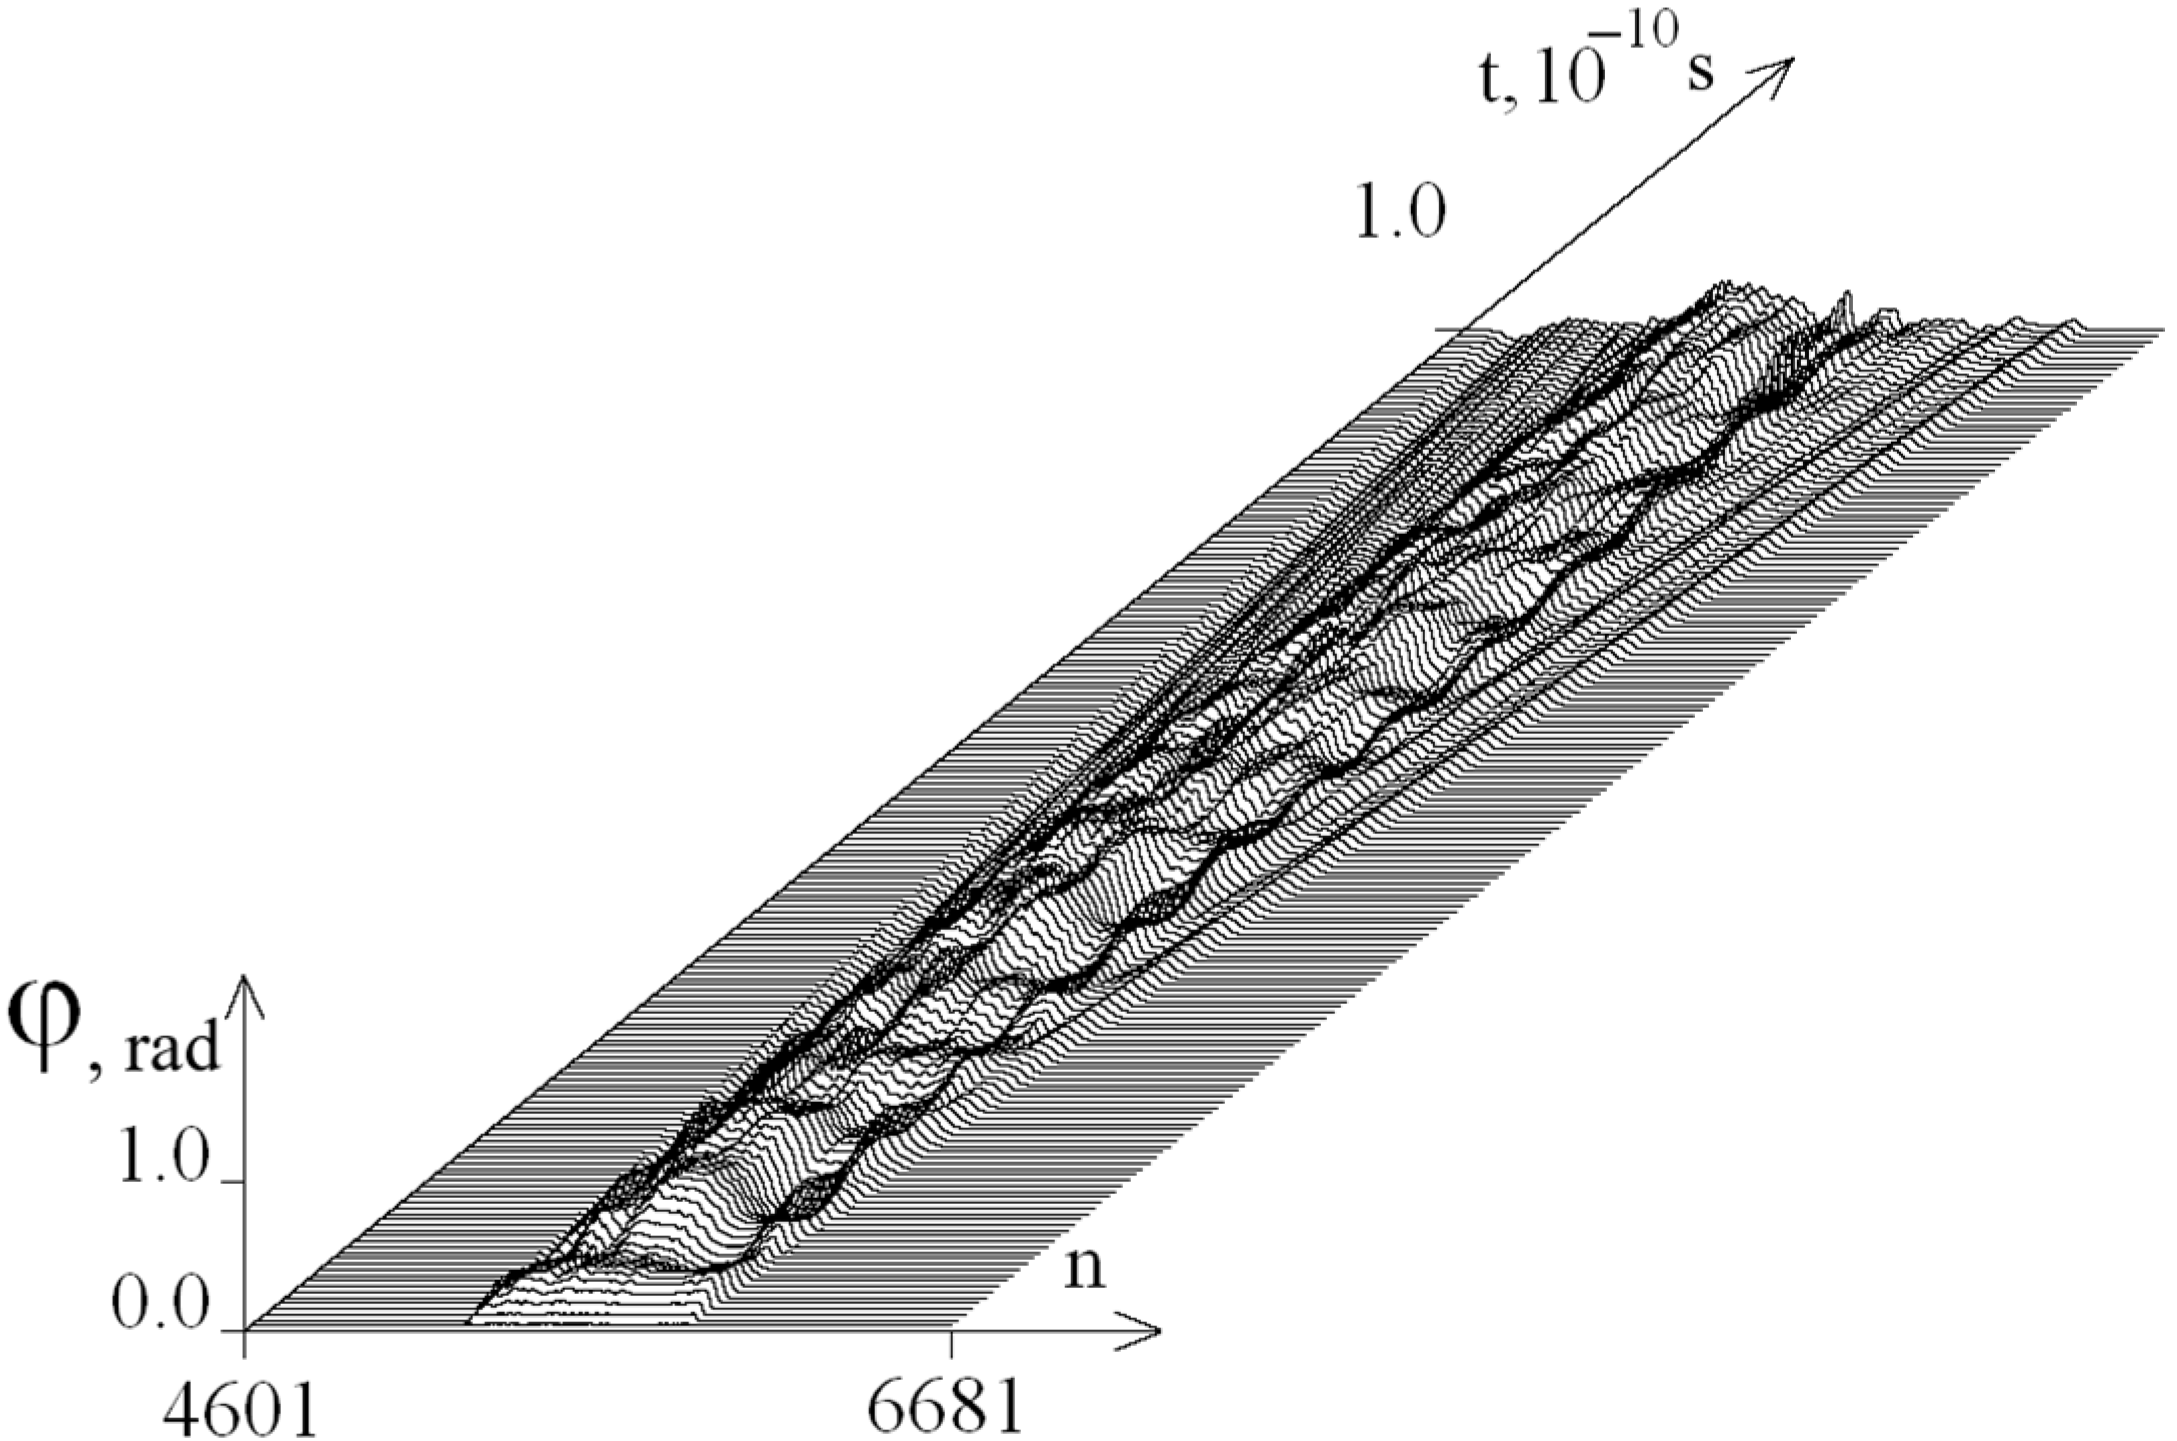
Figure 1. Dynamics of angular deviations of the first chain of the selected DNA fragment over the time interval [0; 10−10 s] with a torque M0 = 8.00 pN·nm and a viscosity parameter of the medium λ = 1.
Ijms 26 00933 g001
Figure 2. Dynamics of OS zones genesis and potential energy of hydrogen bonds in base pairs at M0 = 8.28 pN·nm. OS in AT pairs is shown in green, and OS in GC pairs is shown in red, and the promoter is highlighted with a darker background (a). Closed base pairs are highlighted in blue depending on the potential energy values of hydrogen bonds in accordance with the color scale shown on the right (b).
Ijms 26 00933 g002
Figure 6. Dynamics of OS zones genesis and potential energy of hydrogen bonds in base pairs at M0 = 8.50 pN·nm for different values of the parameter characterizing the viscosity of the environment: λ = 0.9 (a), λ = 1.0 (b), and λ = 1.1 (c). The green color in the figure indicates the OS in AT pairs, and the red color indicates the OS in GC pairs. Closed base pairs are highlighted in blue depending on the potential energy values of hydrogen bonds in accordance with the color scale shown on the right.
Ijms 26 00933 g006
Figure 7. Dynamics of OS zones genesis and potential energy of hydrogen bonds in base pairs at M0 = 8.52 pN·nm for different values of the parameter characterizing the viscosity of the environment: λ = 0.9 (a), λ = 1.0 (b), and λ = 1.1 (c). The green color in the figure indicates the OS in AT pairs, and the red color indicates the OS in GC pairs. Closed base pairs are highlighted in blue depending on the potential energy values of hydrogen bonds in accordance with the color scale shown on the right.
Ijms 26 00933 g007
Figure 8. Dynamics of OS zones genesis and hydrogen bond potential energy distribution in base pairs for M0 = 8.57 pN·nm with CAA interruptions in the CAG tract: (a) corresponds to CAG tract without interruptions, (b) corresponds to CAA trinucleotide in the 15th position, and (c) to the CAA trinucleotide in the 25th position. The green color in the figure shows the OS in the AT pairs, and the red color shows the OS in the GC pairs. Closed base pairs are highlighted in blue depending on the potential energy values of hydrogen bonds in accordance with the color scale shown on the right.
Ijms 26 00933 g008
Table 1. Coefficients of Equations (1)–(6).
Type of Base A T G C
I 1 0 44 , k g m 2 7.614.868.224.11
R , Å5.804.805.704.70
K 1 0 18 , N·m2.351.612.271.54
k 12 H 1 0 2 ,   N / m 6.206.209.609.60
β 1 0 34 , N · m s 4.252.914.102.79
Disclaimer/Publisher’s Note: The statements, opinions and data contained in all publications are solely those of the individual author(s) and contributor(s) and not of MDPI and/or the editor(s). MDPI and/or the editor(s) disclaim responsibility for any injury to people or property resulting from any ideas, methods, instructions or products referred to in the content.