Article

Genome-Wide Identification of DlGRAS Family and Functional Analysis of DlGRAS10/22 Reveal Their Potential Roles in Embryogenesis and Hormones Responses in Dimocarpus longan

Institute of Horticultural Biotechnology, Fujian Agriculture and Forestry University, Fuzhou 350002, China
*
Authors to whom correspondence should be addressed.
These authors contributed equally to this work.
These corresponding authors contributed equally to this work.
Int. J. Mol. Sci. 2025, 26(21), 10323; https://doi.org/10.3390/ijms262110323
Submission received: 30 August 2025 / Revised: 12 October 2025 / Accepted: 13 October 2025 / Published: 23 October 2025
(This article belongs to the Special Issue Advances in Plant Genomics and Genetics: 3rd Edition)

Abstract

GRAS family plays a critical role in plant growth and stress responses. In this study, we identified 47 GRAS (DlGRAS) genes in the longan genome and conducted a comprehensive bioinformatics analysis of these genes. RNA-seq analysis revealed that the expression of these DlGRAS genes differed during early SE and across various longan tissues. The quantitative real-time PCR (qRT-PCR) results indicated that the DlGRAS genes exhibited differential expression during the early SE of longan, with most of them showing high expression at the globular embryo (GE) stage. Under GA3 treatment, the transcript levels of DlGRAS12/15 decreased significantly. In contrast, exogenous ABA promoted the expression of DlGRAS6/10/23, indicating that DlGRAS genes are responsive to hormones. Compared with CaMV35S-driven GUS expression, the promoters of DlGRAS10/22 increased GUS expression, GA3 and ABA treatments enhanced promoter activity. DlGRAS10/22 were located in the nucleus. Overexpression of DlGRAS10/22 in longan SE significantly promoted the transcription levels of SE-related genes, including DlGID1, DlGA20ox2, DlLEC1, DlFUS3, DlABI3 and DlLEC2. Therefore, DlGRAS may be involved in the early morphogenesis of longan SE through the hormone signaling pathway.

1. Introduction

The GRAS family is a plant-specific transcription factor. It plays a crucial regulatory role in various plant biological processes, including plant growth and development [1], stress responses [2], anther microspore formation [3], signal transduction, nodule and mycorrhizal formation, biological detoxification, and other relevant processes [4]. The name derives from the first three members: GIBBERELLIC-ACID INSENSITIVE (GAI), REPRESSOR of GAI (RGA) and SCARECROW (SCR) [5]. The typical GRAS proteins generally consist of 400 to 770 amino acids (aa), comprising a variable N-terminal sequence and a highly conserved C-terminal sequence [6]. The C-terminal 5 motifs (LHRI, VHIID, LHRII, PFYRE, SAW) together form the GRAS domain, with VHIID, PFYRE, and SAW showing higher conservation [7]. The N-terminus of GRAS proteins is a highly variable region that harbors 2 evolutionarily conserved protein domains, DELLA and TVHYNP. Due to the divergence in N-terminal motifs, GRAS proteins can interact with distinct target proteins, thereby contributing to the functional diversity of genes [8]. Members of the GRAS family can be divided into multiple subfamilies according to the structural and functional features of their protein sequences. In Arabidopsis thaliana, the GRAS family has been classified into 10 subfamilies: LS, PAT1, SCL3, DELLA, LISCL, SCR, HAM, SHR, SCL4/7 and DLT [9]. In Secale cereale, the GRAS family has been divided into 13 subfamilies: LISCL, DLT, OS19, SCL4/7, PAT1, SHR, SCL3, HAM-1, SCR, DELLA, HAM-2, LAS and OS4, with each subfamily exhibiting distinct physiological functions [10].
At present, The GRAS family, having been comprehensively identified and analyzed in model plants, exhibits diverse and conserved physiological functions across species, with its roles validated through functional studies in Arabidopsis thaliana [7], Oryza sativa [11], Populus przewalskii [12], Eucalyptus grandis [13], Cymbidium goeringii [14], Solanum lycopersicum [15], Secale cereale [10]. In terms of stress response regulation, GRAS genes enhance plant tolerance to abiotic stresses via multiple mechanisms. In Betula platyphylla, BpPAT1 safeguards the integrity of the cell membrane structure by reducing reactive oxygen species (ROS) accumulation, thereby enhancing salt stress tolerance [16]. Heterologous expression of the HcSCL13 in Halostachys caspica significantly enhances the drought and salt resistance of Arabidopsis thaliana [17]. Overexpression of GmGRAS37 improves the drought and salt tolerance of Glycine max [18]. In Populus davidiana, PdbSCL1 interacts with PdbHAG3, which catalyses its acetylation, thereby promoting drought tolerance and growth [19]. GRAS genes play key roles in biotic stress responses. In Oryza sativa, OsGRAS30 acts upstream of OsHDAC1 and interacts with OsHDAC1 to suppress its enzymatic activity. This inhibition increases the histone H3K27ac level, thereby boosting broad-spectrum blast resistance [20]. In hormone signal transduction, GRAS genes, especially the DELLA subfamily, are core regulators of gibberellin (GA) signaling. In Arabidopsis thaliana, GA is perceived by the nuclear receptor GID1, which then interacts with DELLA proteins and promotes their degradation—this relieves DELLA’s inhibitory effect on downstream transcription factors, regulating plant growth [21]. In Sorghum bicolor, the DELLA subfamily participates in GA-mediated growth regulation, while other subfamilies have distinct hormone-related functions [22]. In Arabidopsis thaliana, AtLAS regulates axillary meristem formation and controls GA metabolism by modulating the expression of GA2ox4 [23,24]. In growth and development, GRAS genes govern critical processes such as meristem maintenance, organ formation, and embryonic development. SCR interacts with SHR to regulate root radial growth [25], while HAM maintains the undifferentiated state of apical meristem stem cells to support continuous differentiation [26]. In Populus trichocarpa, PtrDLT specifically regulates xylem differentiation [27]. For crop yield-related traits, ZmGRAS11 controls kernel development: loss-of-function mutants show delayed cell expansion and reduced kernel size/weight, while overexpression lines exhibit the opposite phenotype [28]. In Solanum lycopersicum, silencing the SlGRAS4 gene under high-temperature stress reduces heat tolerance [29], and down-regulating SlGRAS26 alters plant architecture and flowering time [30], demonstrating the gene’s role in balancing stress response and reproductive development. Notably, GRAS genes have shown regulatory potential in embryonic development. For example, in Lilium brownii, the GRAS protein LlSCL participates in the transcriptional regulation of anther microspore development [3], while in A. thaliana, DELLA proteins interact with the key embryonic regulator LEC1 (LEAFY COTYLEDON1) during late embryogenesis: GA-mediated DELLA degradation relieves its inhibitory effect on LEC1, thereby promoting embryonic development [31].
Longan (Dimocarpus longan Lour.) belongs to the Dimocarpus of Sapindaceae, primarily distributed in tropical and subtropical regions. For longan research, the somatic embryogenesis (SE) system serves as an effective solution to overcome the challenges of difficult sampling and inconsistent material quality of embryos under natural conditions—critical limitations that have hindered studies on its embryonic development. Notably, the status of embryonic development directly impacts longan fruit yield and quality, making this process biologically and agronomically significant [32,33,34]. Previously, Chen [35] reported that DlGAI and DlGAIP-B, 2 members of the DELLA subfamily, not only regulate longan seed germination and floral organ development but also participate in hormone transduction and stress response mechanisms, highlighting the functional diversity of GRAS genes in longan. While existing research on GRAS genes has largely focused on their roles in growth, development, and stress responses in model plants (Arabidopsis thaliana, Solanum lycopersicum, Populus davidiana, Zea mays and Oryza sativa), their involvement in longan SE remains underexplored. To address this gap, we conducted a comprehensive bioinformatics analysis of the DlGRAS family using longan genome and transcriptome data, with the goal of elucidating the physicochemical properties, expression patterns, and biological functions of its members. Additionally, we performed subcellular localization verification and promoter function analysis to further clarify the potential functions of DlGRAS genes. Collectively, these efforts lay a foundation for deciphering the regulatory mechanisms underlying the DlGRAS family’s role in longan SE.

2. Results

2.1. Diverse Physical and Chemical Properties of DlGRAS Family Members

Utilizing TBtools software (V2.031) and NCBI Blastp, potential DlGRAS family members were identified from the third-generation longan genome database. Through multiple alignment of amino acid sequences and verification of DlGRAS-related domains via NCBI Blastp and Conserved Domains Database (CDD), 47 valid DlGRAS members were finally confirmed. Based on their chromosome location information, these 47 DlGRAS genes were named DlGRAS1~DlGRAS47 (Supplementary Table S1).
Physicochemical properties of DlGRAS family indicated that none of the DlGRAS members possessed a signal peptide or a transmembrane domain, indicating that they were probably not a secreted protein (Supplementary Table S1). The molecular weight of the protein ranged from 24281.44~86620.45 D, with the number of amino acids varying between 212~761 aa. The isoelectric point fell within the range of 4.62 to 6.70. The instability coefficient ranged from 35.65 to 60.44. The hydrophilicity coefficient of DlGRAS ranged from −0.595 to −0.05, with the exception of DlGRAS22, which had a hydrophilicity coefficient of 0.057, classifying it as a hydrophobic protein. Subcellular localization predictions indicated that DlGRAS were predominantly localized in the nucleus.

2.2. High Homology of DlGRAS Exists in Litchi and Longan

To further explore the evolutionary relationship of the DlGRAS family, the phylogenetic tree of DlGRAS, including longan (47) and Arabidopsis thaliana (32), was constructed by MEGA5.0 software (Figure 1A). Based on the evolutionary relationship, the DlGRAS family were classified into 10 subfamilies: LISCL, SCL3, DELLA, HAM, SCR, PAT1, SCL4/7, DLT, SHR and LAS. Among these subfamilies, the LISCL subfamily comprised 11 members, while the DLT, LAS and the SCL4/7 subfamilies each contained only 1 member. Given the distinct distribution patterns of DlGRAS members within the clustering relationships, it is plausible to speculate that these patterns are associated with the diverse biological functions of each subfamily.
The collinearity analysis was conducted both within longan species and between litchi and longan species to further elucidate their evolutionary relationships. The results demonstrated that DlGRAS genes were unevenly distributed on 12 chromosomes within the longan species, of which 25 genes were distributed on DlChr5, DlChr7 and DlChr12, accounting for approximately 53.2% of the total genes (Figure 1B). A total of 14 members within the DlGRAS family were identified to participate in 10 tandem duplication events. These duplication pairs are as follows: DlGRAS3 and DlGRAS8, DlGRAS28 and DlGRAS37, DlGRAS28 and DlGRAS5, DlGRAS30 and DlGRAS41, DlGRAS36 and DlGRAS40, DlGRAS30 and DlGRAS7, DlGRAS37 and DlGRAS5, DlGRAS41 and DlGRAS7, DlGRAS46 and DlGRAS11, DlGRAS23 and DlGRAS27. The collinearity analysis between longan and litchi revealed that DlGRAS genes in litchi were also distributed on 12 chromosomes. Moreover, 38 pairs of genes exhibited significant collinearity with DlGRAS, indicating a close evolutionary relationship between longan and litchi (Figure 1C).

2.3. DlGRAS Exhibits Remarkable Conservation During Evolutionary Processes

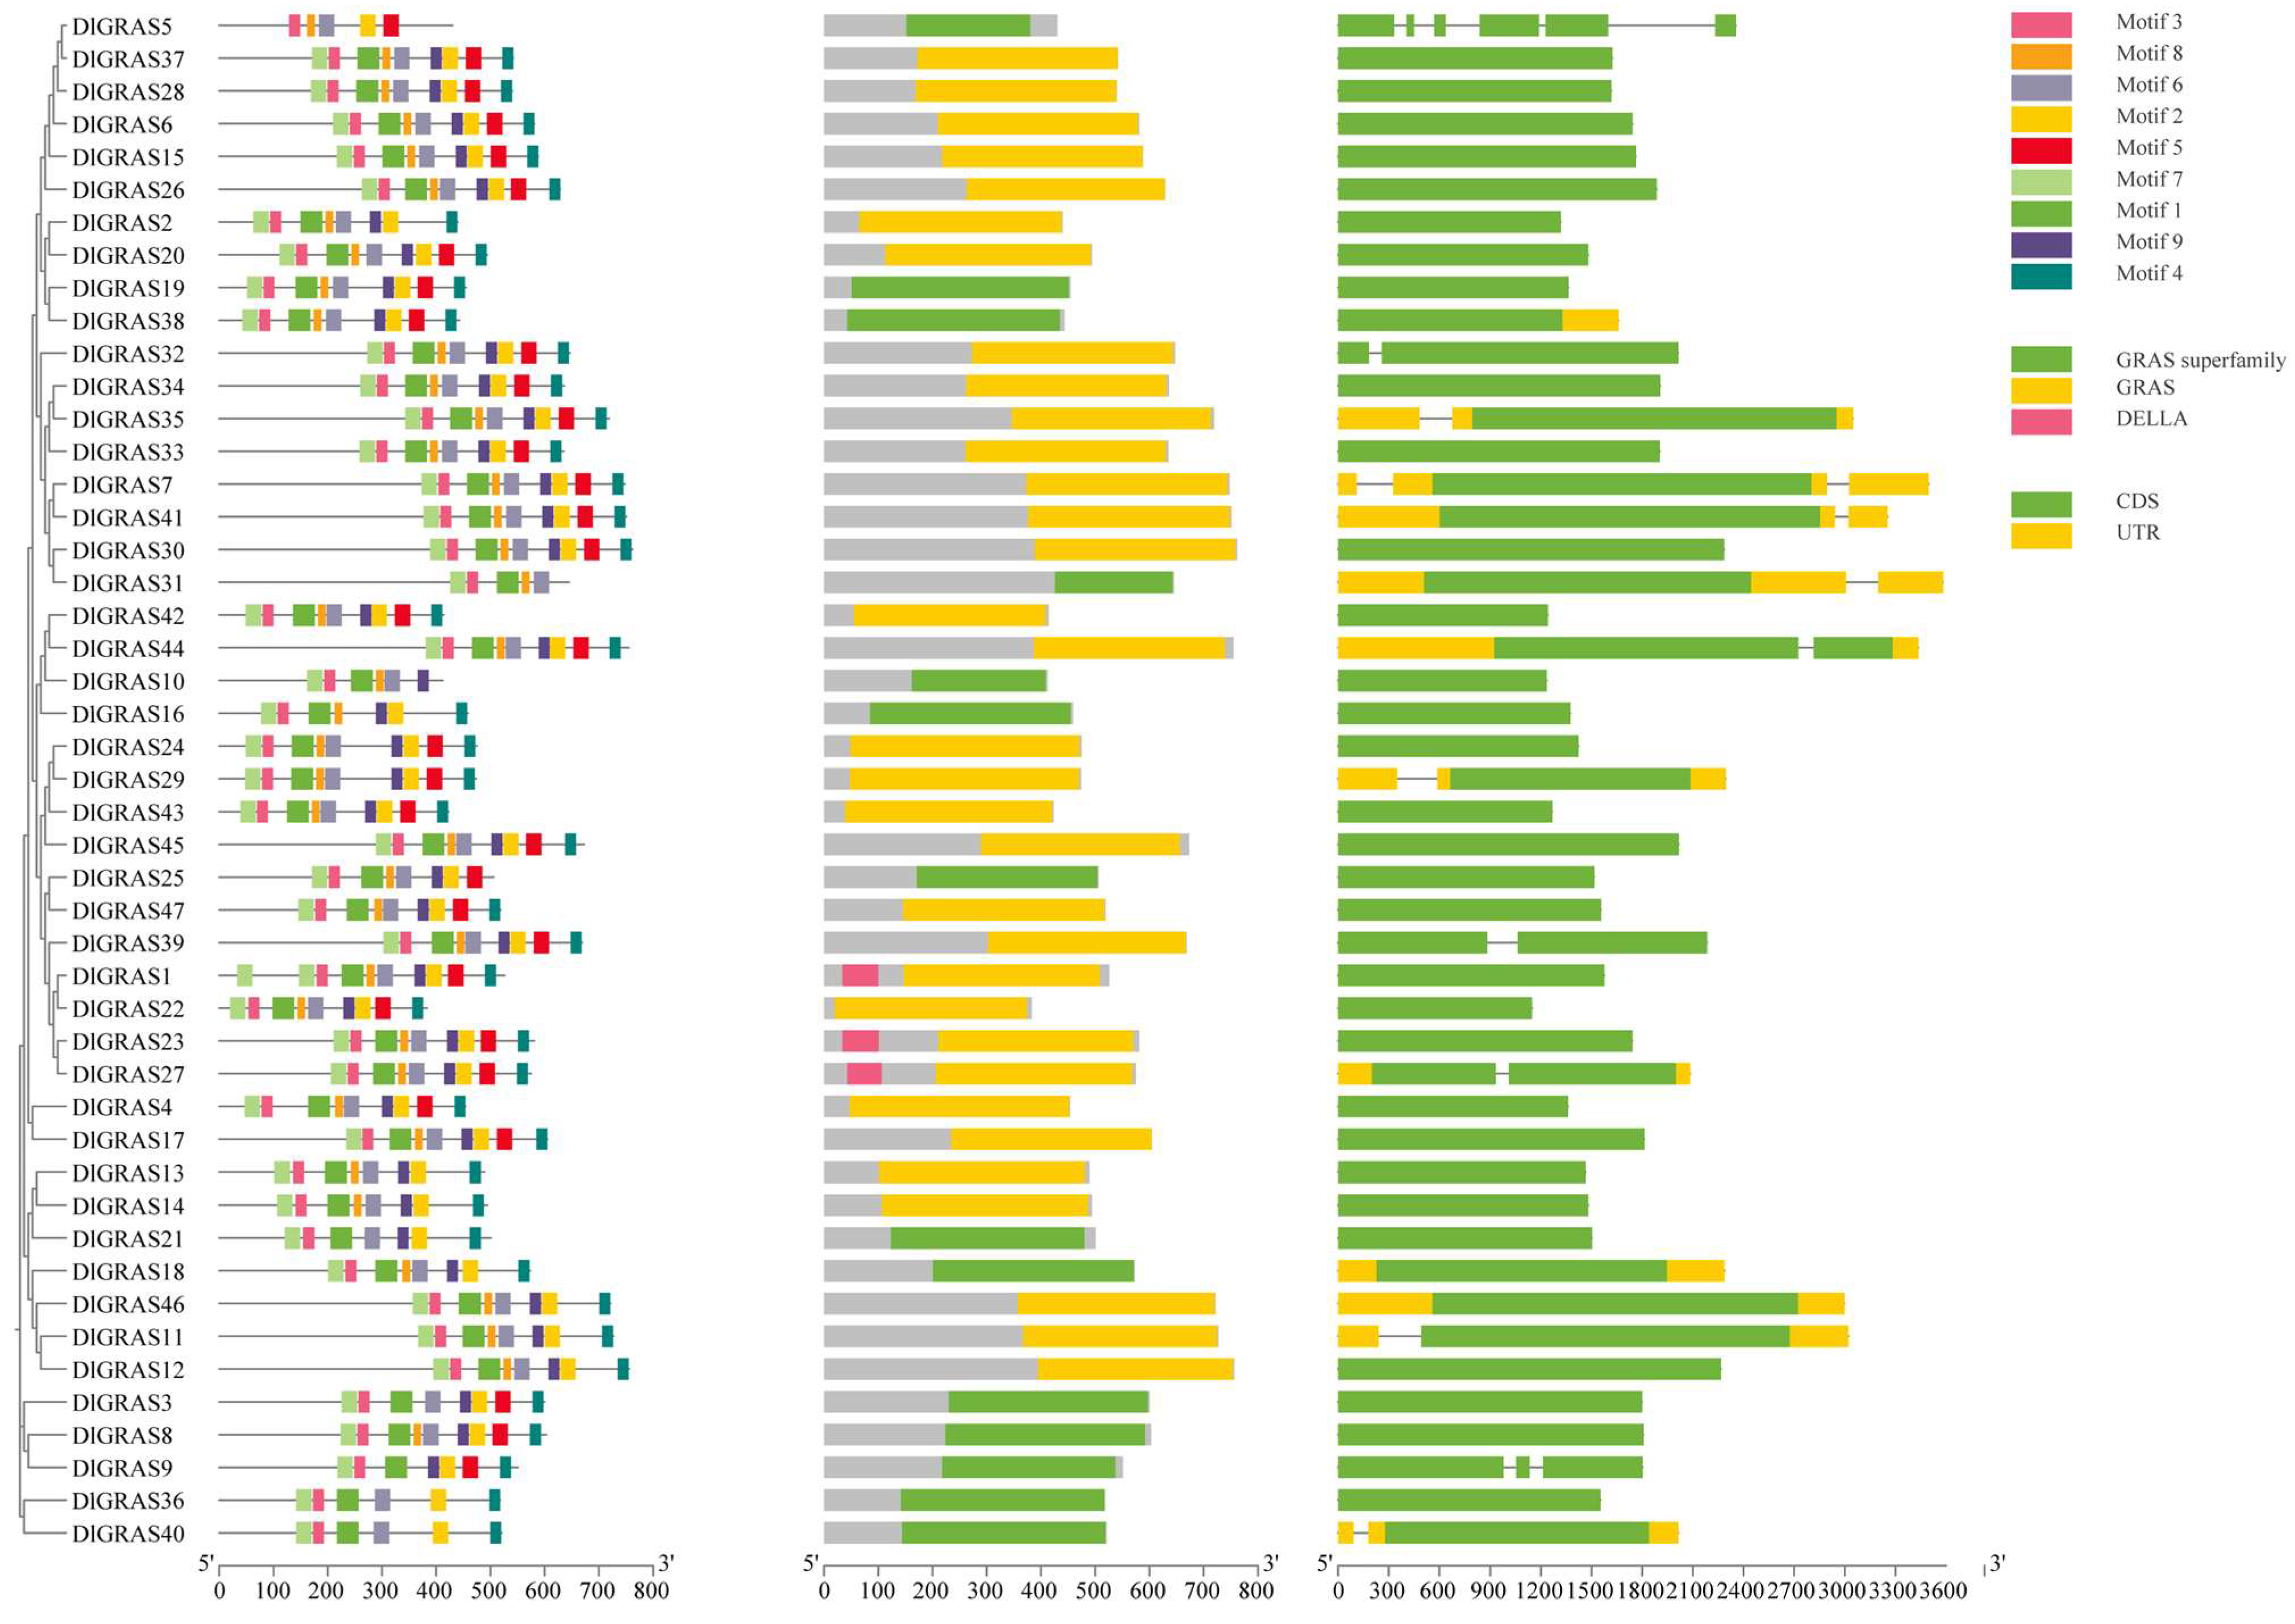
The results of the analyses focusing on conserved motifs, protein conserved domains and gene structure of the DlGRAS are presented in Figure 2. Gene structure analysis revealed striking variability in intron number, with 72.3% of DlGRAS genes being intronless, a finding consistent with the results of GRAS studies in other plants [36,37]. This high intronless rate suggests that DlGRAS genes may have evolved via horizontal gene transfer from prokaryotes or undergone intron loss during evolution. Notably, the number of introns varies among different subfamilies of DlGRAS, and this subfamily-specific gene structure may reflect functional divergence. Following the prediction of conserved motifs in the DlGRAS proteins, it was observed that motif 3 was distributed among 47 members, indicating that motif 3 is highly conserved within the DlGRAS family. In conjunction with the aforementioned analyses, it was revealed that members belonging to the same subfamily of DlGRAS exhibited similar gene structures. This similarity in gene structure implies that the functions of each subfamily within DlGRAS are distinct. In summary, the evolution of DlGRAS balances the strong conservation of core motifs/domains and the subfamily-specific divergence of gene structures, enabling longan to adapt to unique developmental and environmental requirements.

2.4. Multiple Hormones and Transcription Factors Regulate DlGRAS Expression

The binding sites of transcription factors for the DlGRAS were predicted, and their interactions with transcription factors were further scrutinized. A total of 17 transcription factors were identified (Figure 3A). Notably, there were variations in the number, type, and distribution of transcription factors in longan promoters of DlGRAS. Specifically, the binding sites for BBR-BPC, MIKC-MADS, and Dof transcription factor were extensively distributed in the promoter regions of DlGRAS. In contrast, the Nin-like transcription factor binding site was exclusively found in the promoter region of DlGRAS23. Based on the analysis results mentioned above, it can be inferred that the promoter regions of DlGRAS had transcription factor binding sites and played a vital role in regulating gene expression.
To further understand the functional disparities among the promoters of DlGRAS, the PlantCARE online tool was used to analyze the cis-elements in the 2000 bp promoter sequence upstream of the initiation codon of the DlGRAS family in longan. The results demonstrated that the promoter regions of DlGRAS contained multiple response elements involved in plant growth and development, hormone responses, stress tolerance, and light signaling (Figure 3B). Specifically, 98% of DlGRAS possessed light-responsive elements, indicating DlGRAS can respond to light signals, thus influence the growth and development of longan. Furthermore, the vast majority of members exhibited responsiveness to hormone regulation. Approximately 68% of the members responded to abscisic acid, while 50% responded to gibberellin. These findings suggest that the DlGRAS genes may participate in diverse hormone signal transduction pathways and have distinct roles in hormone response.

2.5. DlGRAS Transcription Factor Coordinates SE, Organogenesis and Stress Adaptation in Longan

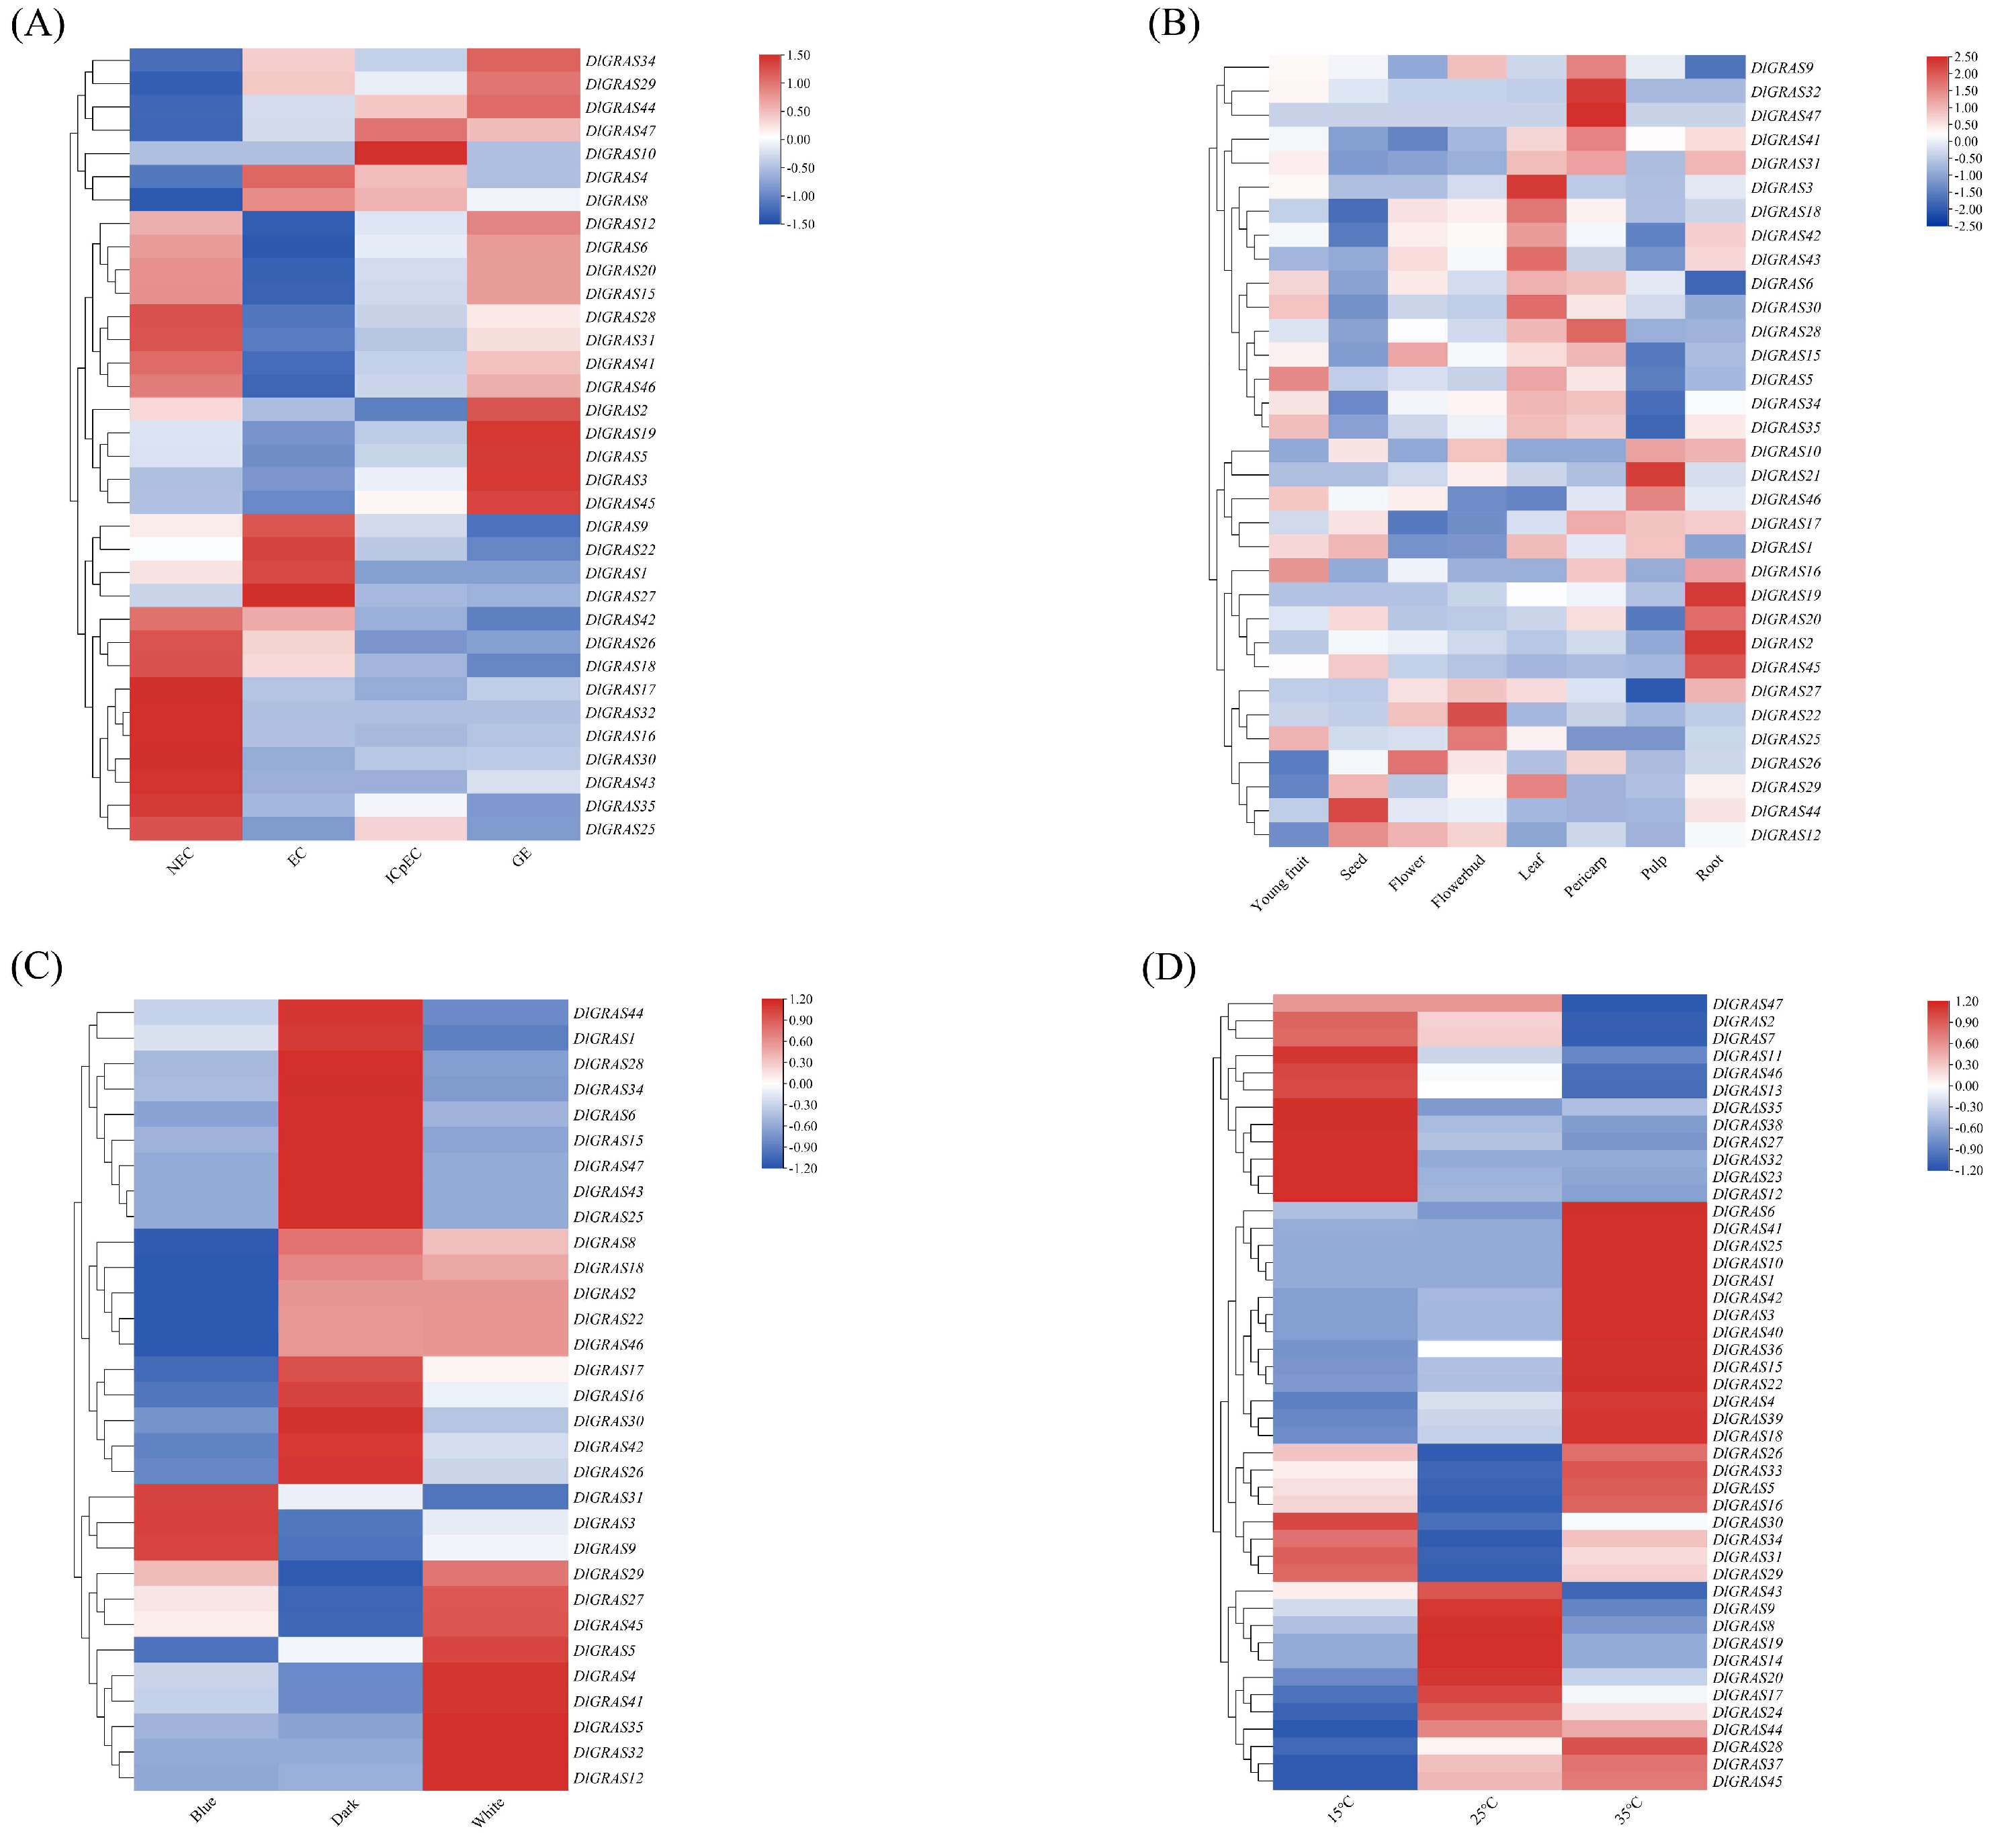
Distinct expression patterns were observed among different genes of the DlGRAS at various stages of early SE (Figure 4A). DlGRAS6/15/28 were continuously upregulated from EC to GE; DlGRAS10 was specifically expressed only at the ICpEC stage. DlGRAS22/26/27 were downregulated from EC to GE and 10 genes were highly expressed in NEC but low in SE stages. Based on these unique expression profiles associated with SE progression, 9 core candidate genes (DlGRAS6, DlGRAS10, DlGRAS12, DlGRAS15, DlGRAS22, DlGRAS23, DlGRAS26, DlGRAS27, DlGRAS28) were finally screened, implying their differential regulatory roles in distinct SE stages. DlGRAS genes exhibited varying expression patterns in different tissues (Figure 4B). DlGRAS2/19/45 were highly expressed in roots, DlGRAS3 in leaves, DlGRAS32/47 specifically in pericarp, and DlGRAS44 in seeds. DlGRAS22 was highly expressed in flower buds and DlGRAS26 in flowers, while all DlGRAS genes showed low expression in stems. These results indicated that candidate DlGRAS genes might participate in specific organogenesis processes.
12 DlGRAS genes were highly expressed in darkness. DlGRAS3/9/31 were upregulated under blue light, and DlGRAS4/5/12 were upregulated under white light, indicating that these genes might respond to light signals to regulate SE (Figure 4C). Under different temperature treatments, most of the DlGRAS genes were highly expressed at 35 °C (Figure 4D). It is speculated that high temperature can up-regulate the expression of DlGRAS genes to counteract or repair the damage caused by stress, thereby ensuring the normal growth and development of longan.

2.6. Differential Regulation of Longan Embryo Development by DlGRAS Genes

Based on the results of RNA-seq analysis, it was observed that, in comparison to other genes, these 9 genes (DlGRAS6, DlGRAS10, DlGRAS12, DlGRAS15, DlGRAS22, DlGRAS23, DlGRAS26, DlGRAS27 and DlGRAS28) potentially play a vital role in the process of longan SE. Consequently, we conducted qRT-PCR assays on these 9 genes to further validate their expression patterns during longan embryogenesis. The relative expression levels of DlGRAS6, DlGRA26 and DlGRAS27 exhibited a gradual increase from EC to GE stage, indicating that DlGRAS play a positive regulatory role during longan SE (Figure 5B). In contrast, the relative expression levels of DlGRAS10 and DlGRAS23 decreased rapidly from EC to GE stage and then increased, with the highest expression level observed at the GE stage. Specifically, the specific high expression of DlGRAS22 at the EC stage indicates its crucial role in the induction and maintenance of longan EC. DlGRAS12, DlGRAS15 and DlGRAS28 displayed the same expression trend. In summary, the DlGRAS may play different roles during the early SE of longan.
The qRT-PCR analysis of DlGRAS at different developmental stages of zygotic embryos revealed that DlGRAS could be expressed from the S1 to S8 stages and exhibited diverse expression patterns (Figure 5D). The expression profiles of DlGRAS6 and DlGRAS26 exhibited distinct stage-specific patterns during zygotic embryo development. Specifically, their expression levels were elevated at the S5 stage and markedly decreased at the S8 stage. Notably, the expression level of DlGRAS10 demonstrated a significant up-regulation throughout the S2 to S8 period of zygotic embryo development compared to that at the S1 stage. Regarding the expression patterns of DlGRAS12, DlGRAS23, DlGRAS27 and DlGRAS28, they displayed a high degree of similarity. All 4 genes were highly expressed at the S7 stage, indicating a potential coordinated regulatory mechanism at this particular developmental stage. During the transition from S1 to S4, DlGRAS15 and DlGRAS22 exhibited an identical expression trend. However, a divergence in their expression patterns was observed from S4 to S8. Based on these observed expression patterns, it can be inferred that DlGRAS gene may play crucial regulatory roles at different developmental stages of zygotic embryos, potentially contributing to the precise control of embryo development processes.

2.7. DlGRAS Integrates GA3 and ABA Signaling to Regulate Longan SE

Previous studies have indicated that DlGRAS genes may be implicated in hormone signaling pathways. Therefore, we examined the expression levels of DlGRAS genes in longan EC treated with GA3 and ABA. This was done with the aim of elucidating the specific regulatory pathways involving DlGRAS genes. The qRT-PCR analysis of longan EC treated with varying concentrations of GA3 are presented in Figure 6A. As the concentration of GA3 increased, the transcription levels of DlGRAS6, DlGRAS10, DlGRAS23, DlGRAS26, DlGRAS27 and DlGRAS28 exhibited a significant upregulation, indicating that GA3 can promote the expression of the these genes. The transcriptional level of DlGRAS12 was completely suppressed, while the expression of DlGRAS22 was inhibited only under the treatment of 9 mg/L GA3. The qRT-PCR analysis of DlGRAS under ABA treatment showed that the relative expression levels of DlGRAS6, DlGRAS10, DlGRAS23 and DlGRAS26 upregulated after treatment with 3~12 mg/L ABA. However, within this concentration range, the transcription level of these genes generally showed a decreasing trend with the increase in ABA concentration (Figure 6B). The relative expression levels of DlGRAS12, DlGRAS15, DlGRAS27 and DlGRAS28 were significantly lower than those of the CK, indicating that ABA treatment inhibited their transcription levels. DlGRAS22 significantly promoted its transcription level only when treated with 1 mg/L ABA. Hence, DlGRAS genes can respond to GA3 and ABA hormones.

2.8. DlGRAS10 and DlGRAS22 Play an Important Role in the Nucleus

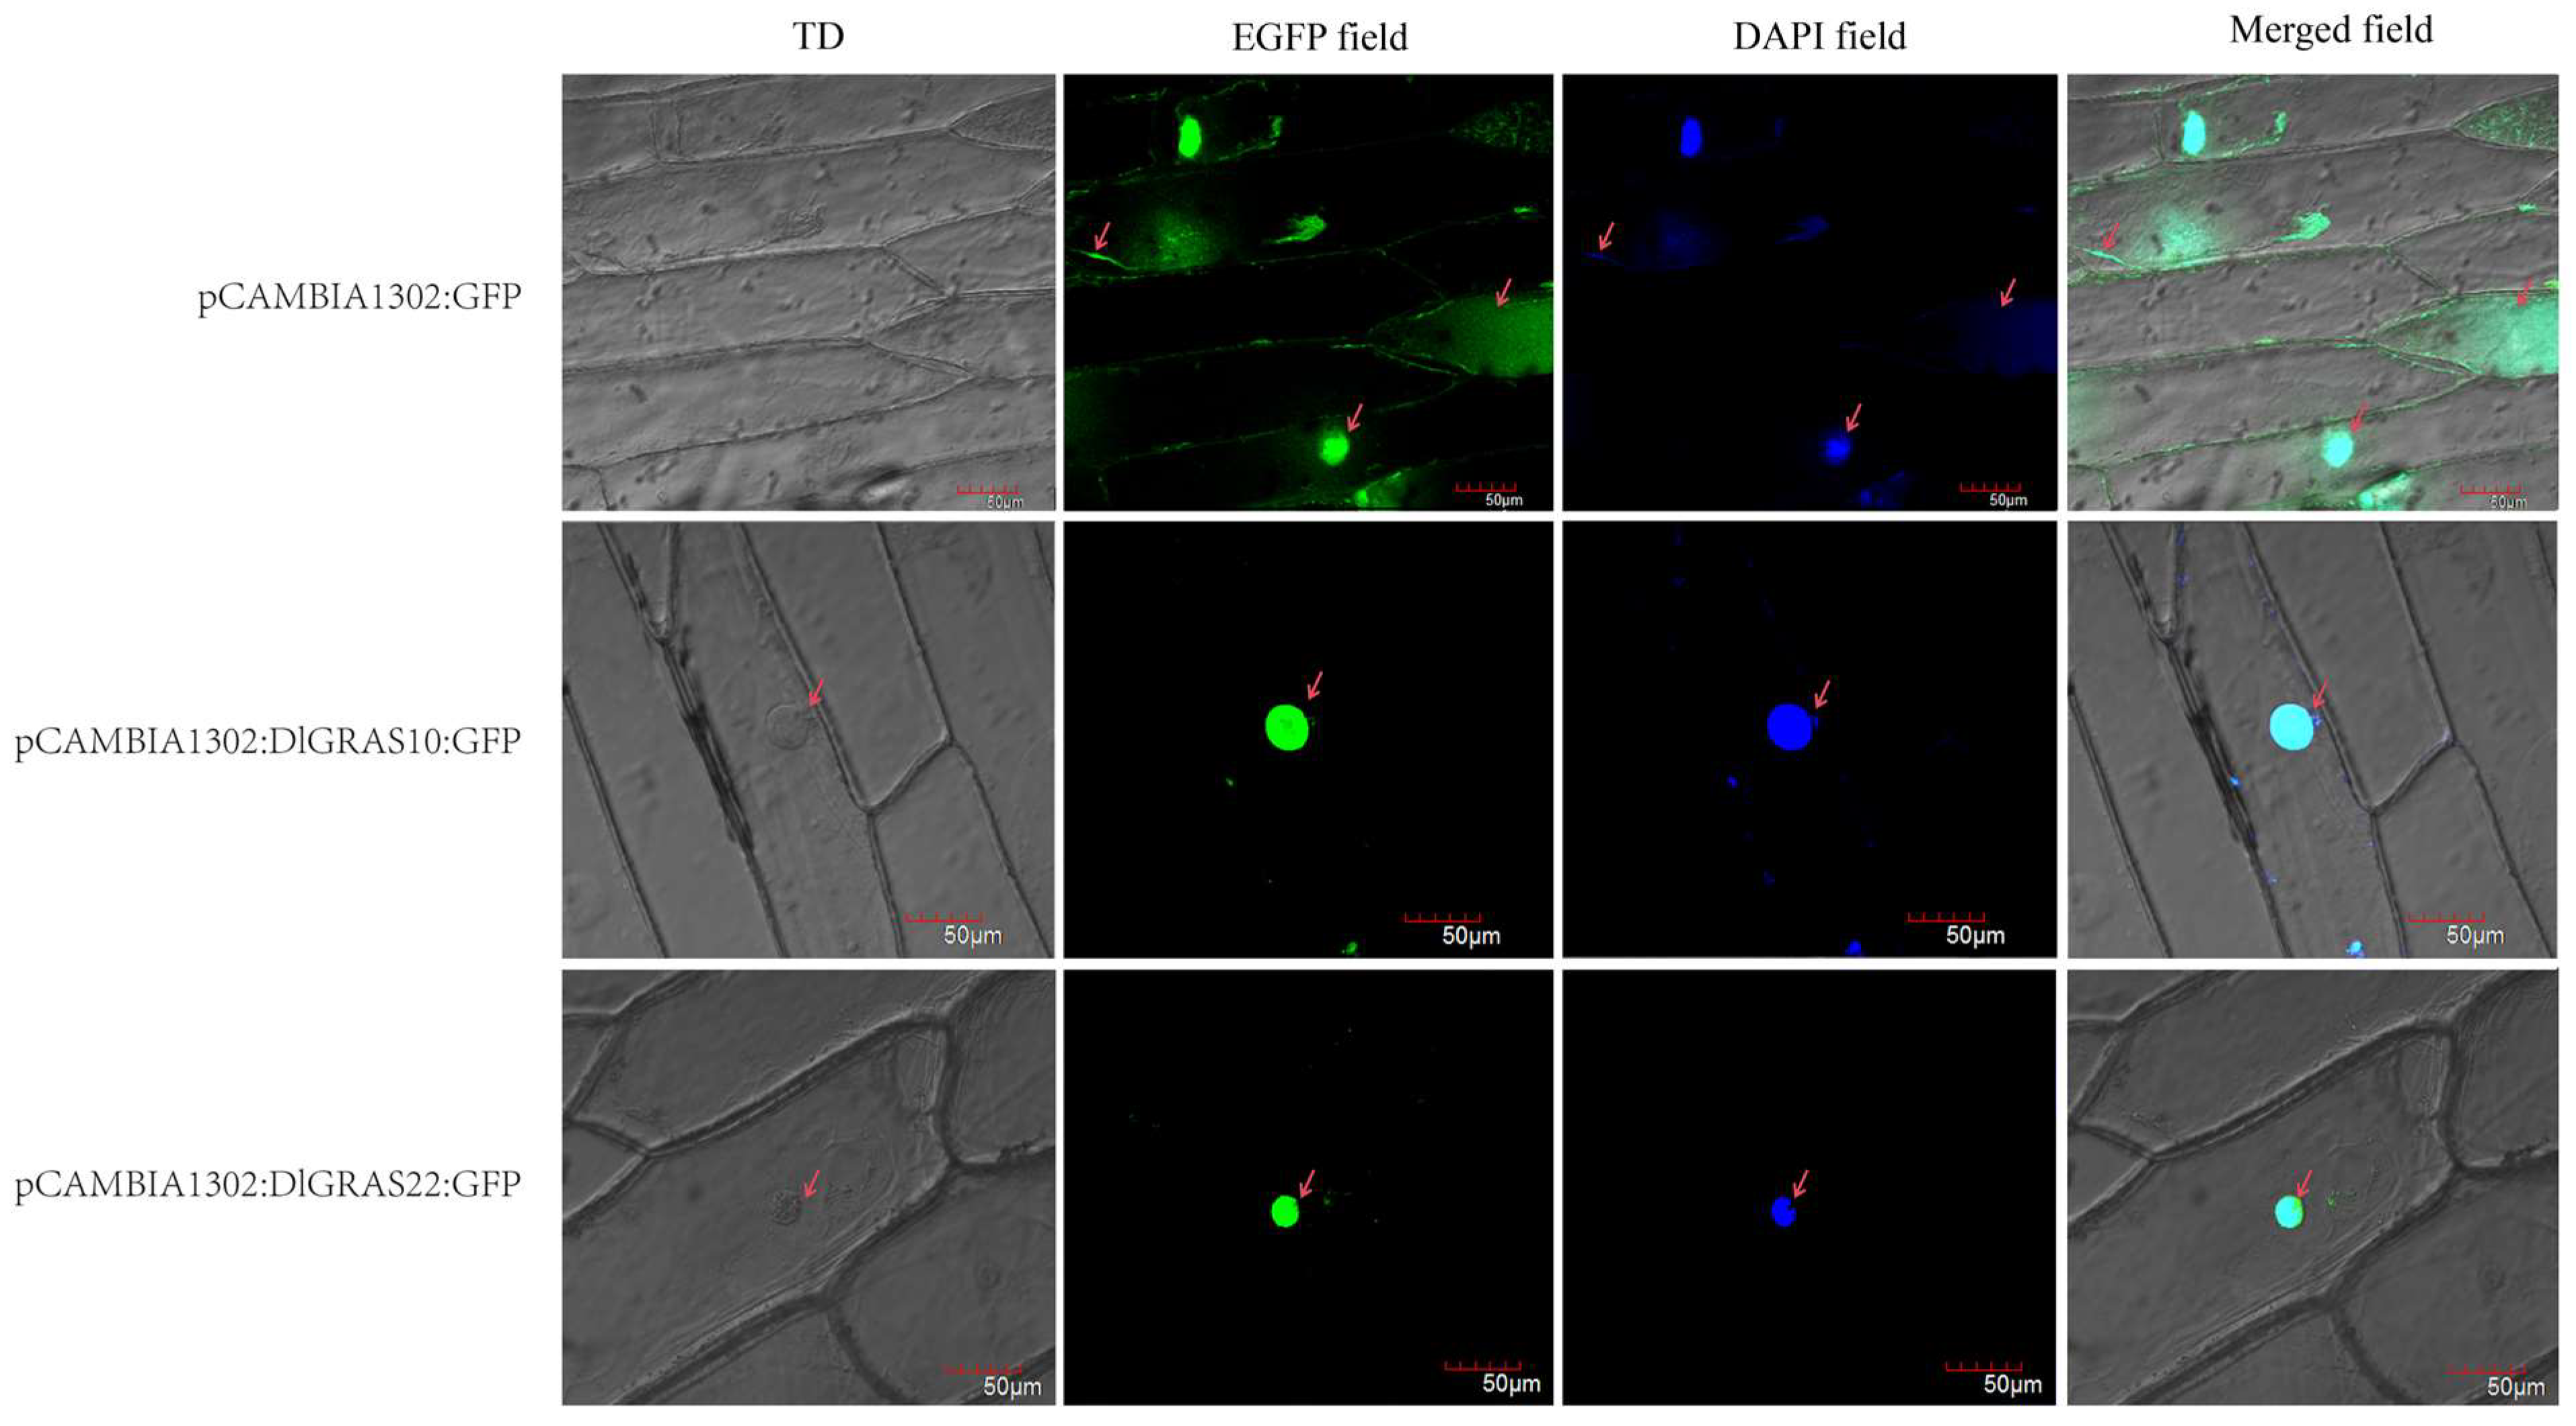
Our findings revealed that DlGRAS10 and DlGRAS22 exhibited distinct expression patterns. Specifically, when compared with other genes, the expression level of DlGRAS10 was notably higher at the S2~S8 stages of zygotic embryo development than that at the S1 stage. Meanwhile, the expression level of DlGRAS22 at the EC stage, which represents the early phase of SE, was significantly elevated compared to the other two developmental stages under investigation. Based on these observations, we hypothesize that DlGRAS10 and DlGRAS22 may assume more crucial roles than other genes in the relevant biological processes. To gain a deeper understanding of the potential biological functions of the DlGRAS10 and DlGRAS22 genes, we conducted an investigation into the subcellular localization of their corresponding proteins in the inner epidermis of onion (Figure 7). In pCAMBIA1302:GFP, the fluorescence signal was uniformly distributed throughout the onion inner epidermis. In contrast, in the pCAMBIA1302-DlGRAS10:GFP and pCAMBIA1302-DlGRAS22:GFP, the fluorescence signal was exclusively detected in the nucleus, indicating DlGRAS10 and DlGRAS22 play a crucial role within the nucleus.

2.9. Exogenous GA3 and ABA Modulate DlGRAS10 and DlGRAS22 Promoter Activities During Longan SE

The core promoter regions and transcription start site of DlGRAS10 and DlGRAS22 were predicted by the BDGP (https://fruitfly.org/seq_tools/promoter.html). The prediction results showed that both DlGRAS10 and DlGRAS22 possess type A transcription start sites. Specifically, DlGRAS10 has two transcription start sites, labeled as A and C, while DlGRAS22 has two types of transcription start sites, namely A and T (Supplementary Table S2).
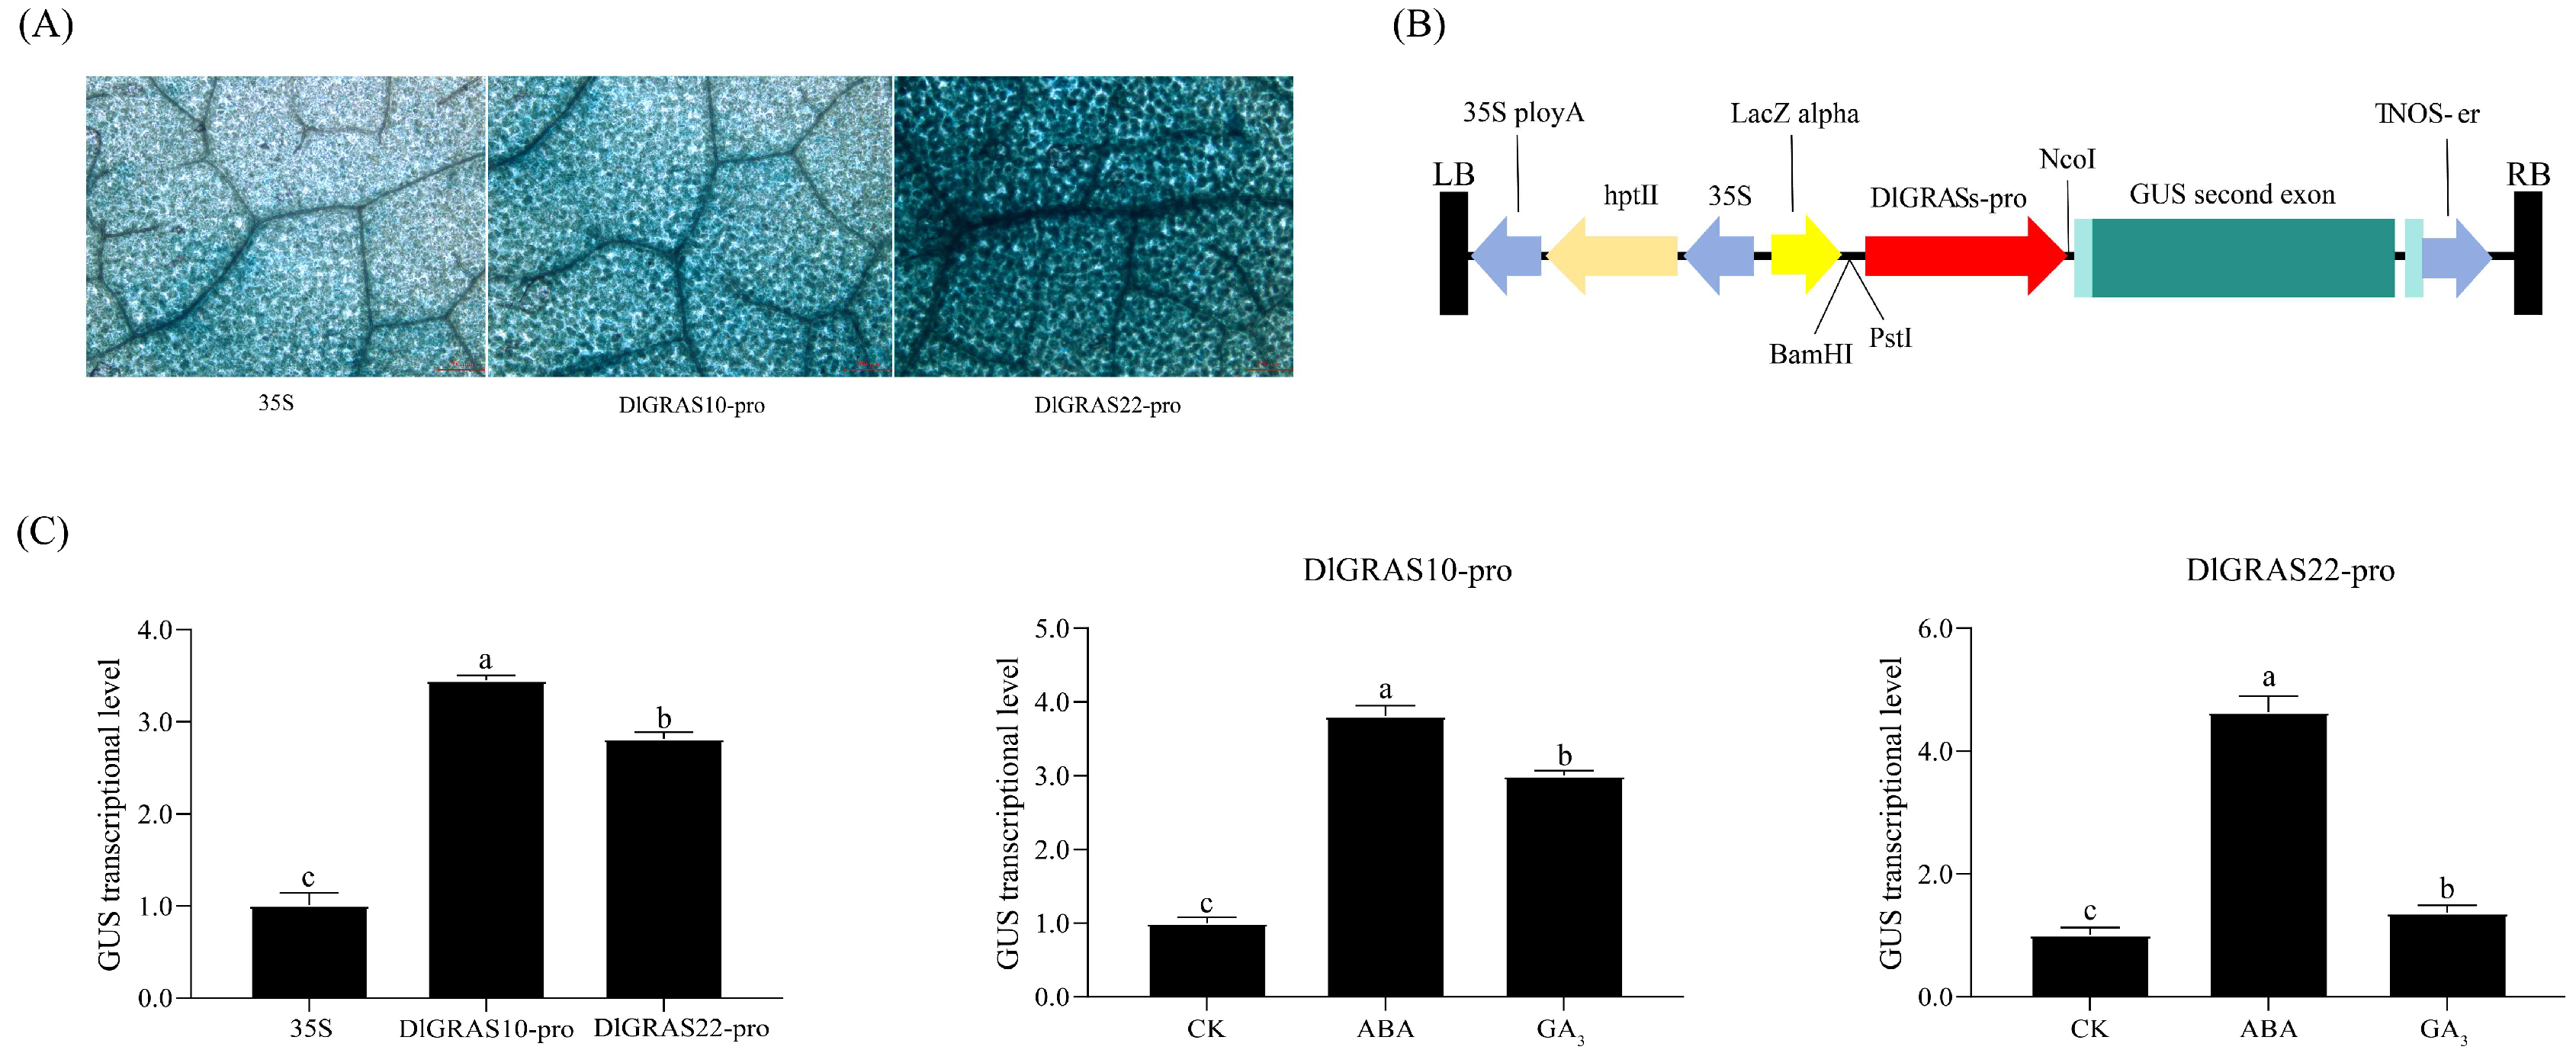
The pCAMBIA1301-DlGRAS10pro::GUS and pCAMBIA1301-DlGRAS22pro::GUS vectors were constructed and transiently transformed into N. benthamiana by Agrobacterium-mediated transformation (Figure 8B). A blue color was observed in N. benthamiana leaves in the GUS staining assay, indicating the expression of the GUS gene in these leaves (Figure 8A). The results demonstrated that both DlGRAS10 and DlGRAS22 promoters were capable of activating and enhancing the expression of downstream GUS genes. Notably, DlGRAS10 had a more significant driving ability for GUS gene expression (Figure 8C). The transiently transformed N. benthamiana were sprayed with different hormones, with water serving as the control. The results indicated that DlGRAS10 and DlGRAS22 promoted the expression of downstream GUS genes in response to ABA and GA3 signals. Among the treatments, both DlGRAS10 and DlGRAS22 showed the most significant ability to drive GUS gene expression under ABA treatment. Under ABA treatment, the driving ability of DlGRAS10 for GUS gene expression was approximately 4 times that of the control group, while the ability of DlGRAS22 to activate GUS gene expression was about 3 times that of the control group. Therefore, it can be inferred that DlGRAS promoters may affect the SE of longan by responding to hormones and enhancing the expression of downstream GUS gene.

2.10. DlGRAS10/22 Transient Expression Activates Embryogenic Transcriptional Networks and Modulates Endogenous ABA/GA3 Homeostasis

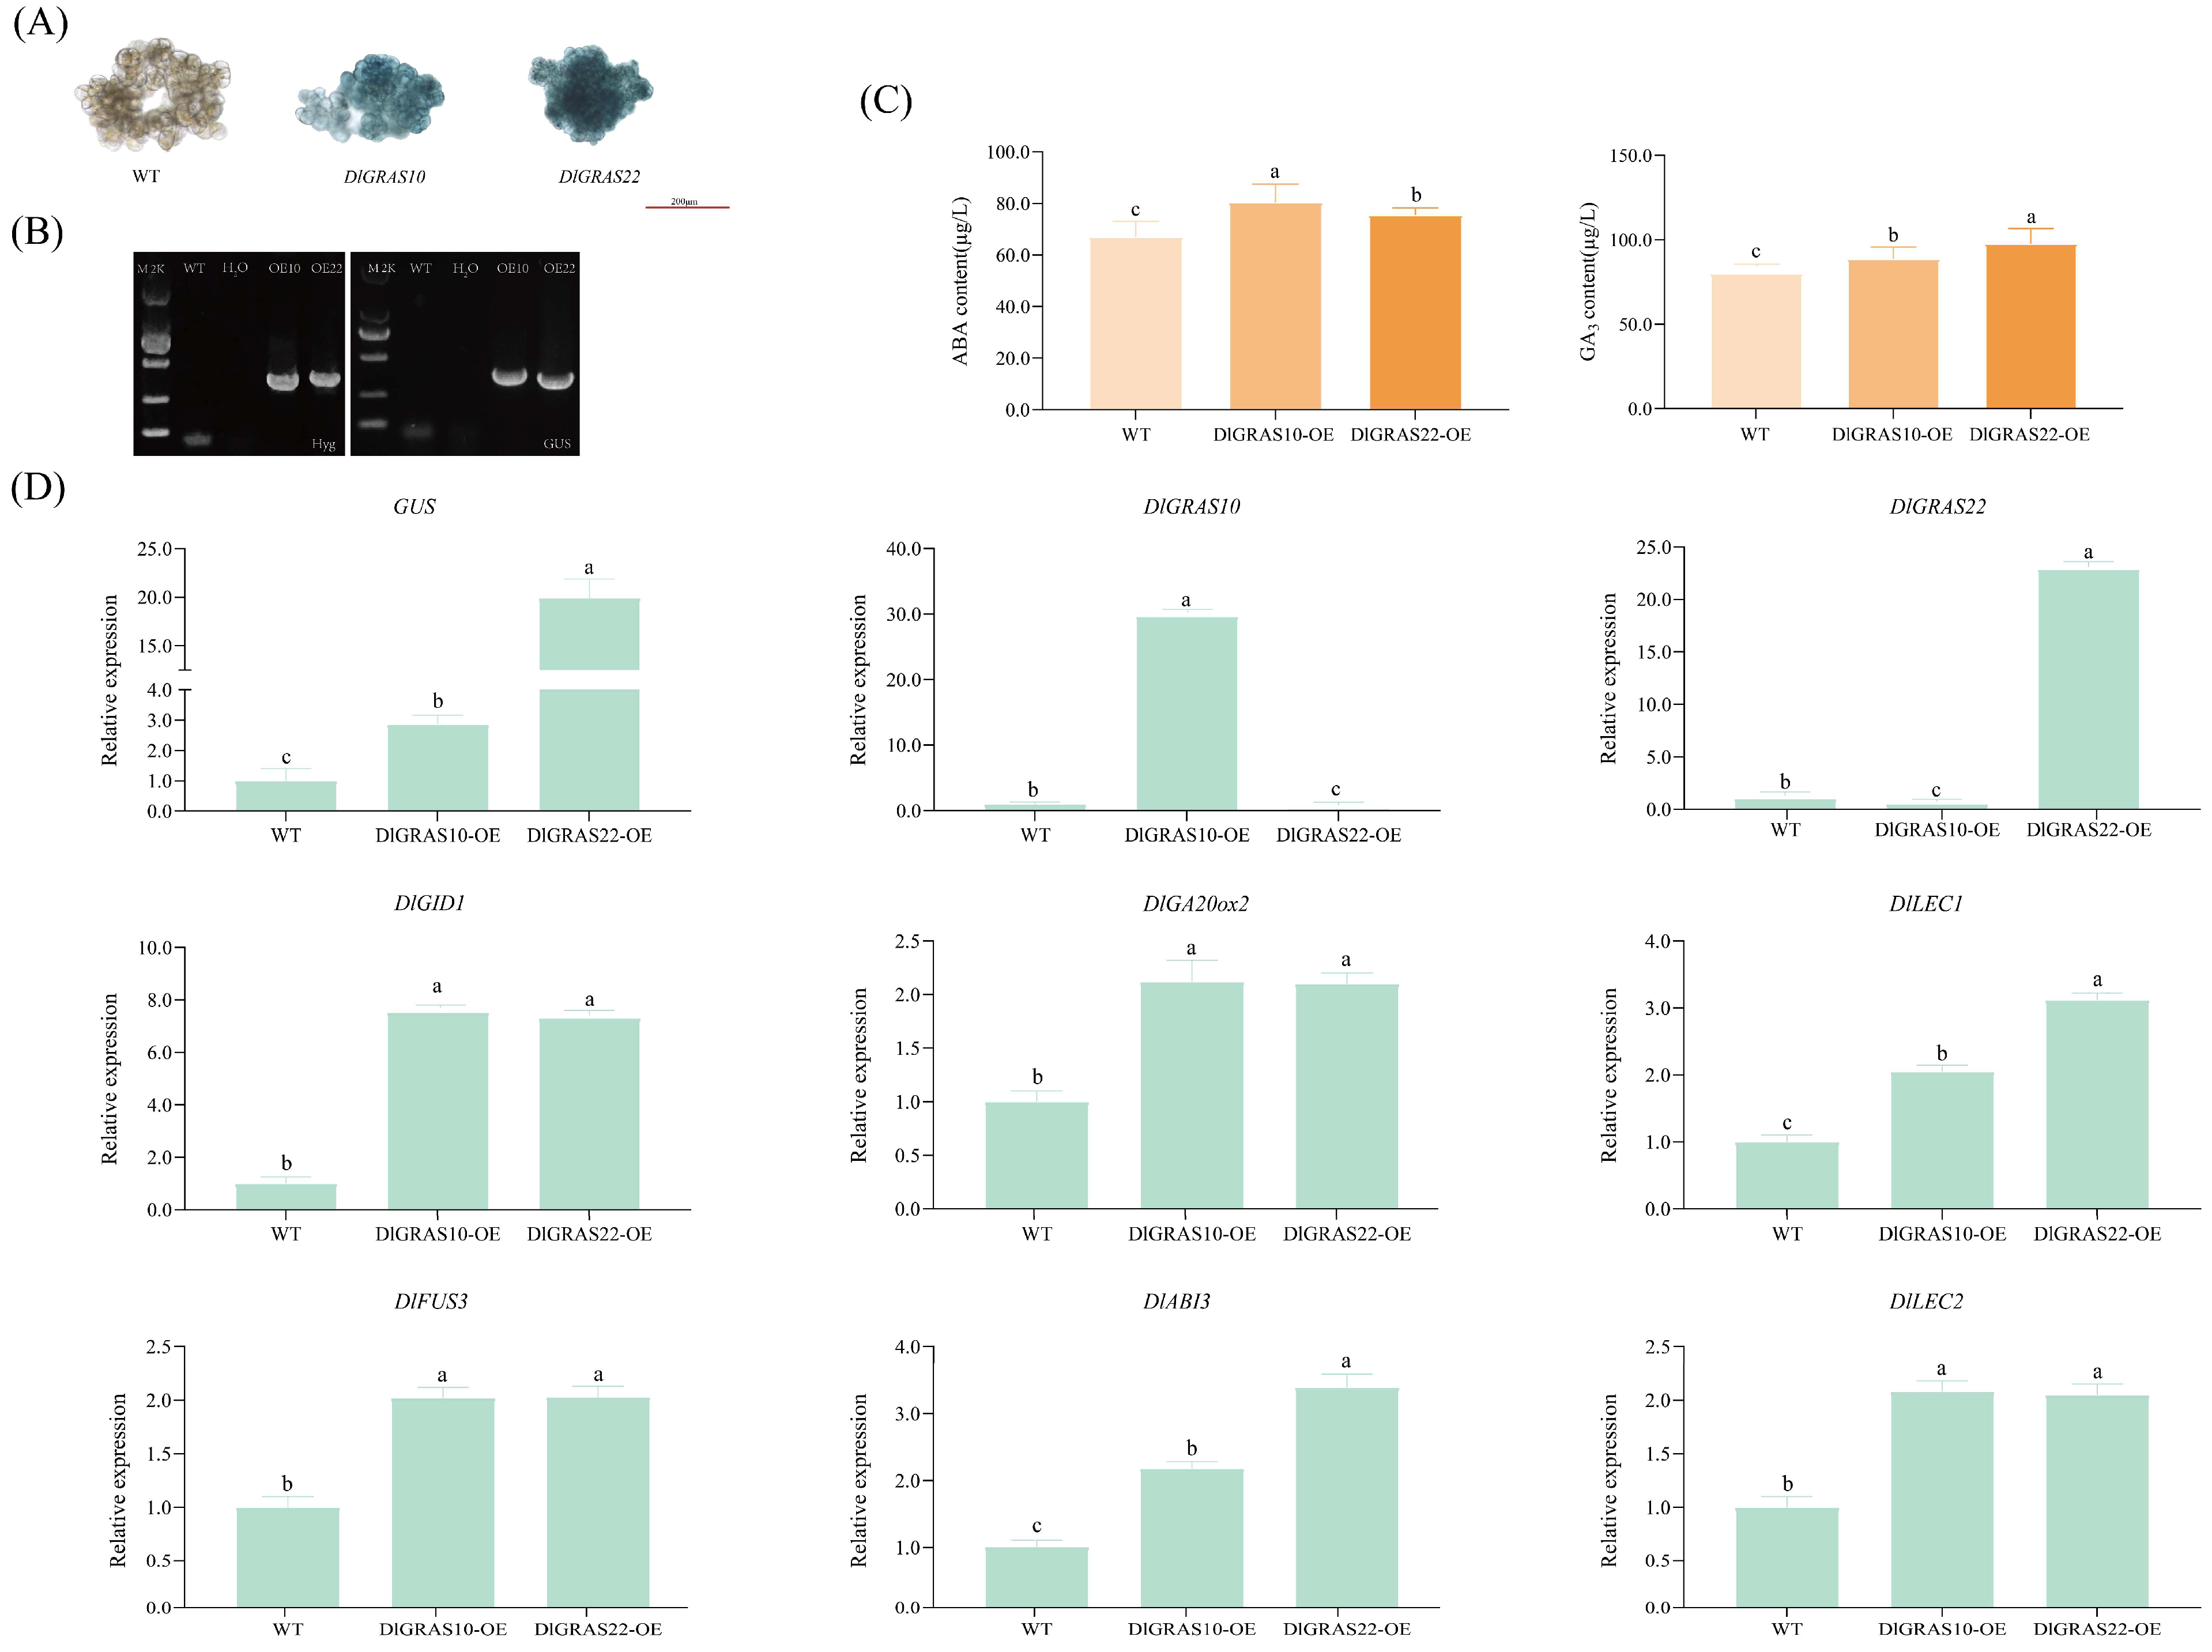
To further elucidate the mechanisms by which DlGRAS10 and DlGRAS22 function in SE, we conducted transient expression of DlGRAS10 and DlGRAS22. Subsequently, we examined their regulatory relationships with other genes known to be involved in SE. GUS staining revealed that DlGRAS10-OE and DlGRAS22-OE exhibited a distinct blue coloration, whereas the control group did not appear color (Figure 9A). PCR-based molecular identification of DlGRAS10/22-OE lines confirmed the amplification of specific bands corresponding to the Hyg and GUS genes within the range of 300~500 bp (Figure 9B), indicating successful integration of the recombinant plasmid into Agrobacterium tumefaciens and infection of the longan EC. The qRT-PCR showed that the GUS gene was highly expressed in both DlGRAS10-OE and DlGRAS22-OE lines. Specifically, the expression level of the GUS gene in DlGRAS10-OE was 1.86 times higher than that in the control group, while in DlGRAS22-OE, it was approximately 20 times higher (Figure 9D). DlGRAS10 and DlGRAS22 genes were significantly upregulated in their respective overexpressing lines. The expression level of DlGRAS10 in DlGRAS10-OE was about 116 times higher than that in the control group, whereas the expression level of DlGRAS22 in DlGRAS22-OE was about 23 times higher.
To investigate the regulatory relationship between DlGRAS10/22 and other SE-related genes, the expression profiles of DlGID1, DlGA20ox2, DlLEC1, DlFUS3, DlABI3 and DlLEC2 were analyzed in transgenic longan EC. The results indicated a significant enhancement in the transcription levels of these genes (Figure 9D). Specifically, the expression levels of DlGID1, DlGA20ox2, DlFUS3, DlABI3 and DlLEC2 in DlGRAS10-OE were about 7.5 times, 2.1 times, 2 times, 2.2 times and 2.1 times higher, respectively, compared to the control group. In DlGRAS22-OE, the expression level of DlLEC1 was the highest, reaching 3.12 times that of the control group, while the expression level of DlABI3 was about 3.4 times higher. These findings suggest that DlGRAS10/22 may affect longan SE through reciprocal regulation with SE-related genes, including DlGID1, DlGA20ox2, DlLEC1, DlFUS3, DlABI3 and DlLEC2.
In order to study whether DlGRAS10 and DlGRAS22 genes are involved in hormone biosynthesis pathways, the contents of relevant hormones were measured in DlGRAS10-OE and DlGRAS22-OE cell lines. The contents of ABA and GA3 were determined (Figure 9C). The results showed that the contents of ABA and GA3 increased in DlGRAS10/22-OE lines. Therefore, DlGRAS10/22 may collectively influence the process of longan SE by coordinately regulating the metabolism and signaling pathways of ABA and GA3.

3. Discussion

3.1. DlGRAS Family May Exhibit Evolutionary Conservation

The GRAS family of transcription factors is paramount importance in plant growth, development, hormone signaling, and stress responses. Elucidating the biological functions of GRAS genes in longan holds significant scientific value. In this study, a total of 47 DlGRAS family members were identified through bioinformatics approaches. The phylogenetic tree constructed for the DlGRAS family clustered its members into 10 distinct branches. It is postulated that these branches are associated with the diverse biological functions of different subfamilies. For instance, scarecrow (SCR) and short-root (SHR) have been demonstrated to co-regulate endothelial development and stem cell maintenance [6,38]. The LlSCL protein is implicated in the transcriptional regulation of microspore development in Lilium browni anthers [3]. The LAS subfamily is known to regulate the development of axillary bud meristems in plants [6], while the HAM subfamily can maintain the growth of adventitious buds in flowering plants [39]. During the course of plant evolution, it has been hypothesized that genes lacking introns may exhibit greater evolutionary conservation [40,41]. Previous studies have revealed that a substantial proportion of GRAS genes in various plant species are intron-less. For example, Arabidopsis thaliana [12], Gossypium hirsutum [42], Secale cereale [10], Avena sativa [43] and Castanea mollissima [44], most GRAS genes lack introns. In the present study, only 13 DlGRAS genes contained introns, resulting in an intron-less rate of 72.3%. This finding is consistent with the intron-less characteristics observed in the GRAS gene of A. thaliana, indicating that the GRAS genes may have evolved from prokaryotes via horizontal gene transfer and gene replication events [45,46]. Studies have indicated that RGL1, RGL2, RGL3, RGA1 and GAI within the AtGRAS family belong to the DELLA subfamily [6]. The DELLA protein acts as an inhibitory factor in the GA signaling pathway. Endogenous GA relies on the DELLA domain within the DELLA protein to induce its degradation, thereby relieving its inhibitory effect [47,48]. The N-terminus of DlGRAS1, DlGRAS23 and DlGRAS27 contain a DELLA domain. Given that these genes belong to the DELLA subfamily, they may participate in GA signal transduction during the growth and development of longan. Tandem repeats and segmental repeats are recognized as the primary mechanisms driving gene family expansion. Genes are retained in plant genomes through these mechanisms play an essential roles in development and environmental stress responses [49,50]. The collinearity analysis revealed a total of 10 tandem repeat events within the DlGRAS in longan. Through the prediction and experimental verification of subcellular localization of DlGRAS protein sequences, it was determined that these proteins are predominantly located in the nucleus. This localization pattern suggests that DlGRAS function within the nucleus, and their functions are likely to be evolutionarily conserved.

3.2. DlGRAS Genes May Be Involved in Longan SE Through Hormone Responses

Gene expression patterns can offer vital information for predicting gene functions [51]. The results of qRT-PCR demonstrated that DlGRAS exhibited different expression trends under GA3 treatment, indicating its potential significant role in SE via the gibberellin signal transduction pathway. Previous studies have indicated that when plants are subjected to environmental stresses, the expression of corresponding stress-responsive genes is activated, and ABA, a vital plant stress-signaling hormone, also accumulates in plants [52]. The cis-elements in the promoter region play an important role in gene regulation and expression [53]. To adapt to changes in the external environment and respond to stress responses, the combination of transcription factors and cis-elements can regulate the expression of related responsive genes, thereby improving plant resistance to stresses [54]. The promoter cis-elements of DlGRAS were predicted, revealing that DlGRAS possessed light-responsive elements as well as various hormone-responsive elements, such as those for auxin, gibberellin, abscisic acid, and salicylic acid. Through the construction and functional analysis of DlGRAS vector, it was found that compared with GUS expression driven by the CaMV35S, the promoters of DlGRAS10/22 increased GUS expression. Moreover, GA3 and ABA treatments enhanced promoter activity (Figure 10). In conclusion, the DlGRAS genes may be involved in the process of longan SE through hormone responses.

3.3. DlGRAS10/22 Affected Longan SE by Regulating SE-Related Genes and Hormone Synthesis

During SE, the GRAS gene is regulated by hormone signals and environmental factors, and interacts with other transcription factors; these regulatory and interactive effects collectively modulate embryonic cell differentiation, proliferation, and development. The GA signaling pathway regulates signals through the formation of the GA-GID1-DELLA complex and DELLA degradation [55]. Additionally, the DELLA protein interacts with GAF1 to co-regulate the target gene GA20ox2 [56]. The GA signal suppressor, DELLA, can directly interact with the key regulator LEAFY COTYLEDON1 (LEC1) during late embryonic development. GA-mediated DELLA degradation relieves its inhibitory effect on LEC1, thereby promoting embryonic development [31]. In Arabidopsis, AtLEC2 can activate the expression of ABI3 and FUS3 [57]. The ABI3 gene can regulate ABA synthesis, and FUS3 also modulates the dynamic balance of ABA/GA in plants by either inhibiting GA synthesis or promoting ABA accumulation [58]. In this study, overexpression of DlGRAS10/22 significantly enhanced the transcription levels of DlGID1, DlGA20ox2, DlLEC1, DlFUS3, DlABI3 and DlLEC2. Moreover, the contents of GA3 and ABA increased in DlGRAS10/22-OE lines (Figure 10). It is hypothesized that the interaction between DlGRAS gene and other SE-related genes affects the longan SE by signal transduction pathway.
Figure 10. The molecular mechanism of DlGRAS gene regulating longan SE. The red arrow indicates that the gene expression is up-regulated or down-regulated under this treatment, and the endogenous hormone level is increased.
Ijms 26 10323 g010

4. Materials and Methods

4.1. Materials

Embryogenic callus (EC), incomplete compact pro-embryogenic cultures (ICpEC), and globular embryos (GE) of longan were successfully obtained by following the protocol established by Lai et al. [32]. In accordance with the method described by Tang et al. [59], different developmental stages of zygotic embryos were collected. Additionally, longan EC was subjected to treatments with varying concentrations of GA3 and ABA. The third-generation of longan genome data were downloaded from NCBI (BioProject accession: PRJNA792504; genome sequence of D. longan: SRR17675476) [60]. Furthermore, the genome data of Arabidopsis thaliana were retrieved from TAIR (http://arabidopsis.org) (9 November 2022) [61], and the genome data of Litchi chinensis [62] were downloaded from (https://data.mendeley.com/datasets/kggzfwpdr9/1) (15 November 2022).

4.2. Identification of DlGRAS in Longan

The GRAS protein domain model (PF03514) was obtained from the Pfam database (http://pfam-legacy.xfam.org/) (2 December 2022) [63]. Subsequently, the HMMER3.0 software was utilized to construct hidden Markov model for the GRAS protein. Utilizing an E-value threshold of less than 10−5 as the criterion, potential members of the DlGRAS family were identified and sifted from the third-generation sequences of the longan genome database. The GRAS protein sequences of A. thaliana were selected as the query sequence. Blastp homology comparison was performed on the aligned protein sequences through the NCBI and the Conserved Domains Database (CDD, https://www.ncbi.nlm.nih.gov/cdd) (20 December 2022) [64] was utilized for protein domain prediction, and members lacking DlGRAS-related domains were excluded from further analysis. The TBtools software was used to visualize [65].
The molecular weight (MW), number of amino acids (aa), isoelectric point (PI), instability index (Instability index), and average hydrophilicity (GRAVY) of DlGRAS were predicted by ExPASy software (https://web.expasy.org/protparam) [66]. The SignalP (http://www.cbs.dtu.dk/services/SignalP/) (2 January 2023) [67] was applied to identify the signal peptide of DlGRAS proteins. The subcellular localization of the DlGRAS protein sequences was predicted by WOLF PSORT (https://wolfpsort.hgc.jp/) (10 January 2023) [68]. Additionally, the transmembrane domain (TM) of DlGRAS protein was predicted by TMHMM Server2.0 (http://www.cbs.dtu.dk/services/TMHMM/) (22 January 2023) [69]. Chromosome localization analysis and visualization of the DlGRAS were performed using TBtools.

4.3. Phylogenetic Relationship and Collinearity Analysis of DlGRAS in Longan

To construct the phylogenetic tree of the GRAS family between longan and Arabidopsis, the neighbor-joining (NJ) method in MEGA5.0 software was used. The analysis settings included 1000 bootstrap replicates, a Poisson model, and partial deletion with 95% cutoff. The resulting phylogenetic tree was refined and visualized using the online tool iTOL (https://itol.embl.de/upload.cgi) (25 January 2023) [70]. TBtools software was used to visualize both the intraspecific collinearity within longan and the interspecific collinearity between longan and litchi.

4.4. Analysis of Conserved Motifs, Domains and Gene Structure of DlGRAS

The conserved motifs of DlGRAS protein were analyzed using the online MEME software (https://memesuite.org/meme/tools/meme) (27 January 2023) [71], with the number of motifs set to 10 and other parameters set to their default values. The gene structure of DlGRAS was analyzed using the GSDS online software (https://gsds.gao-lab.org/) (6 February 2023) [72]. Protein domain prediction was carried out using the CDD. The results were visualized using TBtools software.

4.5. Transcription Factor Binding Site and Cis-Element Analysis of DlGRAS

The 2000 bp upstream sequence from the ATG start codon of 47 DlGRAS genes was extracted using TBtools software, and this sequence was designated as the promoter sequence. The cis-elements within these promoter sequences were analyzed using the online software PlantCARE (http://bioinformatics.psb.ugent.be/webtools/plantcare/html/) (10 February 2023) [73]. Additionally, the PlantTFDB software (http://planttfdb.cbi.pku.edu.cn) (17 February 2023) [74] was used to predict transcription factors that potentially regulate the target genes, threshold p-value ≤ 1 × 10⁻⁴. TBtools software was utilized for the visualization of the results.

4.6. Expression Analysis of DlGRAS During Early SE and Different Tissues/Light Qualities/Abiotic Stresses

In accordance with the method described by Tang et al. [59], the FPKM values of DlGRAS genes were obtained for different stages during early SE (NEC [non-embryogenic callus], EC [embryogenic callus], ICpEC [incomplete compact pro-embryogenic cultures], GE [globular embryos]) (NCBI BioProject number: PRJNA891444) [75]. Additionally, FPKM values were collected for various tissues (NCBI BioProject number: PRJNA326792) (root, stem, flower bud, flower, leaf, young fruit, peel, seed), different light qualities [76] (blue, white, black), different temperatures (15 °C, 25 °C, 35 °C) (NCBI BioProject number PRJNA889670). The FPKM values were normalized using the log2FPKM transformation. The heatmap was generated to visualize the expression patterns using TBtools software.

4.7. RNA Extraction and qRT-PCR Analysis of DlGRAS

Total RNA was extracted from samples during the early stage of longan SE and under different hormone treatments using the TransZolUp kit (TransGenBiotech, Beijing, China). First-strand cDNA was synthesized using the Hifair® III 1st Strand cDNA Synthesis SuperMix for qPCR (gDNA digester plus) (Yeasen, Shanghai, China). Primers were designed using Primer3 software (https://primer3.ut.ee/cgi-bin/primer3/primer3web_results.cgi) (13 February 2023) [77] and DNAMAN 6.0 software (Supplementary Table S3). DlACTB, DlEF-la, and DlUBQ were selected as internal reference genes. The qRT-PCR reaction system had a total volume of 20 μL, consisting of 8.2 μL ddH2O, 10 μL HRbioTM qPCR SYBR®Green Master Mix (No Rox) (Heruibio, Guangzhou, China), 0.4 μL specific primer pairs, and 1 μL 10-fold diluted cDNA. The operating parameters of the qRT-PCR were as follows: 95 °C for 30 s, followed by 40 cycles of 95 °C for 10 s, and 58 °C for 30 s. Each reaction was performed with 3 biological replicates. The data obtained from qRT-PCR were analyzed, and the relative expression levels of each gene were calculated using the 2−ΔCT method [78].

4.8. Subcellular Localization of DlGRAS10/12

The subcellular localization of DlGRAS protein sequences was predicted by WOLF PSORT (https://wolfpsort.hgc.jp/). The CDS sequences of DlGRAS10 and DlGRAS22 were subjected to restriction endonuclease analysis. Primers were designed utilizing DNAMAN 6.0 software (Supplementary Table S3). The pCAMBIA1302-GFP vector was constructed following the method described by Zhang et al. [79]. The recombinant plasmid carrying the target gene was transferred into Agrobacterium. Subsequently, DlGRAS10 and DlGRAS22 were transiently expressed in Allium cepa epidermal cells via Agrobacterium-mediated approach. The samples were incubated in the dark environment at 28 °C for 3 d. The inner epidermis of the onion was meticulously dissected using blades and tweezers, and immersed in 4’,6-diamidino-2-phenylindol (DAPI) solution for 5 min, and then soaked in distilled water for 1 min. The fluorescence signal localization of DlGRAS10 and DlGRAS22 was observed using Olympus FV1200 confocal laser microscope (Olympus, Tokyo, Japan).

4.9. Functional Analysis of DlGRAS10 and DlGRAS22 Promoters

The core promoter regions and transcription start sites of DlGRAS10 and DlGRAS22 were predicted using the BDGP (https://fruitfly.org/seq_tools/promoter.html) (19 June 2023) [80]. Primers were designed with DNAMAN 6.0 software, encompassing the core promoter region (Supplementary Table S3). The pCAMBIA1301-DlGRAS10pro::GUS and pCAMBIA1301-DlGRAS22pro::GUS vectors were constructed and transiently expressed in Nicotiana benthamiana via the Agrobacterium-mediated method. The plants were cultured in the dark for 24 h and then exposed to light for another 24 h. Exogenous hormones, namely 50 μM ABA and GA3, were evenly sprayed on the abaxial surface of transgenic N. benthamiana leaves, with water serving as the control. Samples were collected after 24 h of light culture. Subsequently, GUS staining and relative expression detection were carried out.

4.10. DlGRAS10/22 Transiently Transformed to Longan EC

Primers for the CDS sequences of DlGRAS10/22 were designed using the DNAMAN online tool and the pCAMBIA1301-GUS vector was constructed (Supplementary Table S3). The plasmids of pCAMBIA1301-DlGRAS10-GUS and pCAMBIA1301-DlGRAS22-GUS were separately transformed into Agrobacterium tumefaciens (EHA105). A single colony was selected for bacterial liquid PCR verification, and the positive clone bacterial liquid was expanded and cultured. The bacteria were collected by centrifugation at 5000 r/min for 10 min. The cells were resuspended in a MS (Coolaber, Beijing, China) suspension containing 3% sucrose, 200 mM acetosyringone (AS), 100 mM MgCl2 and the OD600 was adjusted to 0.6~0.8. The longan EC with favorable growth after 15 d of culture was selected and transferred to the prepared bacterial solution for infection for 30 min. The bacterial solution was filtered using filter paper and allowed to dry. After the longan EC had dried, it was transferred to MS solid medium containing 100 mM AS for 3 d. After this period, GUS staining was performed, and the results were observed using fluorescence microscope. The common longan EC was used as a control. The transiently transformed longan EC was sampled and stored at −80 °C.

4.11. RNA, DNA Extraction and Molecular Identification of Transiently Transformed Longan EC

Total RNA from the transiently transformed longan EC was extracted using the BioTeke kit (BioTeke, Wuxi, China) and reverse transcribed into cDNA using Revertaid Master Mix (Thermo Fisher Scientific, Shanghai, China). DNA was extracted using FastPure Plant DNA Isolation Mini Kit (Vazyme, Nanjing, China), and DNA was used as template for resistance gene detection.

4.12. Expression Analysis of Transiently Transformed Longan EC

Primers were designed as described above (Supplementary Table S3), DlACTB was used as the internal reference gene, and the relative expression level was calculated using the 2−ΔΔCT method. Significance analysis was performed using SPSS, and the graphs were generated using GraphPad Prism 8.0.2 software.

4.13. Determination of Endogenous Hormones in Transiently Transformed Longan EC

0.1 g sample was accurately weighed into a mortar, and 1 mL of phosphate-buffered saline (PBS) with pH = 7.0 was added for grinding. The contents of GA3 and ABA were determined using an Elisa kit (Shanghai Enzyme Linked Technology Co., Ltd., Shanghai, China). The specific operational procedures method and calculation formula are detailed in the respective kit instructions.

4.14. The Statistical Analysis

In this study, all data were analyzed via one-way analysis of variance (ANOVA) using SPSS 20 software, followed by post hoc comparisons. GraphPad Prism 8.0.2 software was employed for data visualization and figure generation. In the figures, distinct lowercase letters denote statistically significant differences among treatment groups, with a significance level set at p < 0.05.

5. Conclusions

In this study, a total of 47 DlGRAS were identified based on D. longan genome data. RNA-seq and qRT-PCR analyses demonstrated that DlGRAS genes exhibited distinct expression patterns during early SE of longan, with specific responses to exogenous GA3 and ABA. Subcellular localization confirmed that DlGRAS10 and DlGRAS22 localized to the nucleus. Promoter functional assays showed that the promoters of DlGRAS10/22 drove higher GUS expression than the CaMV35S promoter, and this activity was significantly enhanced by GA3 and ABA treatments. Transient overexpression of DlGRAS10/22 in longan EC increased endogenous GA3 and ABA contents, and significantly upregulated the transcription of SE-related genes (DlGID1, DlGA20ox2, DlLEC1, DlFUS3, DlABI3, DlLEC2). Collectively, these findings indicate that DlGRAS genes, particularly DlGRAS10 and DlGRAS22, participate in regulating early SE of longan by mediating hormone (GA3/ABA) signaling pathways and modulating the expression of SE-related genes.

Supplementary Materials

The following supporting information can be downloaded at: https://www.mdpi.com/article/10.3390/ijms262110323/s1.

Author Contributions

G.Z.: Writing—original draft, Conceptualization, Methodology. M.T.: Data curation, Writing—review and editing. W.W.: Investigation, Data curation. W.G.: Data curation. J.X. and J.W.: Investigation. Z.L.: Supervision. Y.L.: Supervision. Y.C.: Supervision, Funding acquisition, Project administration, Writing—review and editing. All authors have read and agreed to the published version of the manuscript.

Funding

The research was funded by the General Program of the National Natural Science Foundation of China (No. 32472716), and the Natural Science Foundation of Fujian Province (2021J0113).

Institutional Review Board Statement

Not applicable.

Informed Consent Statement

Not applicable.

Data Availability Statement

All data generated or analyzed during this study are included in this published article.

Acknowledgments

Thanks to the Institute of Horticultural Biotechnology of Fujian Agriculture and Forestry University for providing conditions for this study. Thanks to the workers who contributed to our research.

Conflicts of Interest

The authors declare no conflicts of interest.

Abbreviations

DlDimocarpus longan
aaamino acid
NECnon-embryogenic callus
ECembryogenic callus
ICpECincomplete compact pro-embryogenic cultures
GEglobular embryos
SEsomatic embryogenesis
DNAdeoxyribonucleic acid
RNAribonucleic acid
cDNAcomplementary DNA
qPCRquantitative real-time PCR
CDScoding sequence
UTRsuntranslated regions
bpbase pairs
ggram
dday
hhour
minminute
FPKMFragments Per Kilo-base of exon per Million fragments mapped
ABAabscisic acid
GAgibberellin
DAPI4’,6-diamidino-2-phenylindol
GFPGreen Fluorescent Protein
RNA-seqRNA sequencing

References

  1. Yang, L.; Chen, D.; Peng, Z.; Zhao, H.; Gao, Z. Cloning of Transcription Factor DlSCL6 from Dendrocalamus latiflorus and Its Ectopic Expression in Arabidopsis thaliana. Sci. Silvae Sin. 2014, 50, 52–57. [Google Scholar]
  2. Yuan, Y. Functional Study of VaPATI, a GRAS Gene from Vitis amerunsis, in Response to Abiotic Stresses. Doctor’s Thesis, University of Chinese Academy of Sciences (Wuhan Botanical Garden, Chinese Academy of Sciences), Wuhan, China, 2016. [Google Scholar]
  3. Morohashi, K.; Minami, M.; Takase, H.; Hotta, Y.; Hiratsuka, K. Isolation and Characterization of a Novel GRAS Gene That Regulates Meiosis-associated Gene Expression. J. Biol. Chem. 2003, 278, 20865–20873. [Google Scholar] [CrossRef] [PubMed]
  4. Yin, L.; Zhang, Z.; Yu, R.; Wu, Z. Progress of the Structural and Functional Analysis of GRAS Gene in Plants. Mol. Plant Breed. 2019, 17, 6323–6331. [Google Scholar] [CrossRef]
  5. Aoyanagi, T.; Ikeya, S.; Kobayashi, A.; Kozaki, A. Gene Regulation via the Combination of Transcription Factors in the INDETERMINATE DOMAIN and GRAS Families. Genes 2020, 11, 613. [Google Scholar] [CrossRef]
  6. Pysh, L.D.; Wysocka-Diller, J.W.; Camilleri, C.; Bouchez, D.; Benfey, P.N. The GRAS gene family in Arabidopsis: Sequence characterization and basic expression analysis of the SCARECROW-LIKE genes. Plant J. 1999, 18, 111–119. [Google Scholar] [CrossRef]
  7. Lee, M.-H.; Kim, B.; Song, S.-K.; Heo, J.-O.; Yu, N.-I.; Lee, S.A.; Kim, M.; Kim, D.G.; Sohn, S.O.; Lim, C.E.; et al. Large-scale analysis of the GRAS gene family in Arabidopsis thaliana. Plant Mol. Biol. 2008, 67, 659–670. [Google Scholar] [CrossRef]
  8. Bolle, C. The role of GRAS proteins in plant signal transduction and development. Planta 2004, 218, 683–692. [Google Scholar] [CrossRef]
  9. Liu, M.; Huang, L.; Ma, Z.; Sun, W.; Wu, Q.; Tang, Z.; Bu, T.; Li, C.; Chen, H. Genome-wide identification, expression analysis and functional study of the GRAS gene family in Tartary buckwheat (Fagopyrum tataricum). BMC Plant Biol. 2019, 19, 1–17. [Google Scholar] [CrossRef] [PubMed]
  10. Fan, Y.; Wan, X.; Zhang, X.; Zhang, J.; Zheng, C.; Yang, Q.; Yang, L.; Li, X.; Feng, L.; Zou, L.; et al. GRAS gene family in rye (Secale cereale L.): Genome-wide identification, phylogeny, evolutionary expansion and expression analyses. BMC Plant Biol. 2024, 24, 46. [Google Scholar] [CrossRef]
  11. Tian, C.; Wan, P.; Sun, S.; Li, J.; Chen, M. Genome-Wide Analysis of the GRAS Gene Family in Rice and Arabidopsis. Plant Mol. Biol. 2004, 54, 519–532. [Google Scholar] [CrossRef]
  12. Liu, X.; Widmer, A. Genome-wide Comparative Analysis of the GRAS Gene Family in Populus, Arabidopsis and Rice. Plant Mol. Biol. Rep. 2014, 32, 1129–1145. [Google Scholar] [CrossRef]
  13. Lu, H.; Xu, J.; Li, G.; Zhong, T.; Chen, D.; Lv, J. Genome-wide identification and expression analysis of GRAS gene family in Eucalyptus grandis. BMC Plant Biol. 2024, 24, 1–18. [Google Scholar] [CrossRef] [PubMed]
  14. Huang, Y.; Zheng, Q.; Zhang, M.-M.; He, X.; Zhao, X.; Wang, L.; Lan, S.; Liu, Z.-J. Genome-Wide Identification and Expression Analysis of the GRAS Gene Family and Their Responses to Heat Stress in Cymbidium goeringii. Int. J. Mol. Sci. 2024, 25, 6363. [Google Scholar] [CrossRef]
  15. Khan, I.; Lubna; Asaf, S.; Jan, R.; Bilal, S.; Khan, A.L.; Kim, K.-M.; Al-Harrasi, A. Dynamic interplay of WRKY, GRAS, and ERF transcription factor families in tomato-endophytic fungal symbiosis: Insights from transcriptome and genome-wide analysis. Front. Plant Sci. 2023, 14, 1181227. [Google Scholar] [CrossRef]
  16. Tian, Z. Functional Study on Salt Tolerance of PAT1 Gene from Betula platyphylla. Master’s Thesis, Northeast Forestry University, Harbin, China, 2021. [Google Scholar]
  17. Delinur, A.; Feng, X.; Wang, Y. Study of the promoter properties of the HcSCL1313 gene for the transcription factor of Halostachys caspica (Bieb.) CA Mey. Xinjiang Agric. Sci. 2022, 59, 990–1000. [Google Scholar] [CrossRef]
  18. Wang, T.-T.; Yu, T.-F.; Fu, J.-D.; Su, H.-G.; Chen, J.; Zhou, Y.-B.; Chen, M.; Guo, J.; Ma, Y.-Z.; Wei, W.-L.; et al. Genome-Wide Analysis of the GRAS Gene Family and Functional Identification of GmGRAS37 in Drought and Salt Tolerance. Front. Plant Sci. 2020, 11. [Google Scholar] [CrossRef]
  19. Wang, P.; Yang, X.; Sun, S.; Wang, J.; Wang, J.; Li, X.; Li, D.; Wang, Y. The SCARECROW-LIKE transcription factor from Populus davidiana × P. bolleana simultaneously improved drought tolerance and plant growth through acetylation-dependent mechanisms. Plant Biotechnol. J. 2025, 23, 3650–3666. [Google Scholar] [CrossRef]
  20. Hou, J.; Xiao, H.; Yao, P.; Ma, X.; Shi, Q.; Yang, J.; Hou, H.; Li, L. Unveiling the mechanism of broad-spectrum blast resistance in rice: The collaborative role of transcription factor OsGRAS30 and histone deacetylase OsHDAC1. Plant Biotechnol. J. 2024, 22, 1740–1756. [Google Scholar] [CrossRef]
  21. Hernández-García, J.; Briones-Moreno, A.; Blázquez, M.A. Origin and evolution of gibberellin signaling and metabolism in plants. Semin. Cell Dev. Biol. 2021, 109, 46–54. [Google Scholar] [CrossRef]
  22. Fan, Y.; Yan, J.; Lai, D.; Yang, H.; Xue, G.; He, A.; Guo, T.; Chen, L.; Cheng, X.-B.; Xiang, D.-B.; et al. Genome-wide identification, expression analysis, and functional study of the GRAS transcription factor family and its response to abiotic stress in sorghum [Sorghum bicolor (L.) Moench]. BMC Genom. 2021, 22, 1–21. [Google Scholar] [CrossRef]
  23. Zhang, Q. Functional Study of Gibberellines Effects on the Initiation of Axillary Meristem in Arabidopsis. Master’s Thesis, ShanDong University, Jinan, China, 2018. [Google Scholar]
  24. Greb, T.; Clarenz, O.; Schäfer, E.; Müller, D.; Herrero, R.; Schmitz, G.; Theres, K. Molecular analysis of the LATERAL SUPPRESSOR gene in Arabidopsis reveals a conserved control mechanism for axillary meristem formation. Genes Dev. 2003, 17, 1175–1187. [Google Scholar] [CrossRef]
  25. Hughes, T.E.; Sedelnikova, O.V.; Wu, H.; Becraft, P.W.; Langdale, J.A. Redundant SCARECROW genes pattern distinct cell layers in roots and leaves of maize. Development 2019, 146, dev177543. [Google Scholar] [CrossRef]
  26. Rich, M.K.; Courty, P.-E.; Roux, C.; Reinhardt, D. Role of the GRAS transcription factor ATA/RAM1 in the transcriptional reprogramming of arbuscular mycorrhiza in Petunia hybrida. BMC Genom. 2017, 18, 1–14. [Google Scholar] [CrossRef] [PubMed]
  27. Mao, Y. Functional Analysis of PtrDLT and PtrWOX4 Genes in the Development of Vascular Cambium in Populus trichocarpa. Master’s Thesis, Northeast Forestry University, Harbin, China, 2020. [Google Scholar]
  28. Ji, C.; Xu, L.; Li, Y.; Fu, Y.; Li, S.; Wang, Q.; Zeng, X.; Zhang, Z.; Zhang, Z.; Wang, W.; et al. The O2-ZmGRAS11 transcriptional regulatory network orchestrates the coordination of endosperm cell expansion and grain filling in maize. Mol. Plant 2022, 15, 468–487. [Google Scholar] [CrossRef]
  29. Zhu, Z.; Jiang, F.; Wen, J.; Shi, X.; Wu, C.; Liu, M.; Wu, Z. Identification and Heat Resistance Analysis of SlGRAS4 Gene in Tomato. Acta Bot. Boreali-Occident. Sin. 2021, 41, 539–548. [Google Scholar] [CrossRef]
  30. Zhou, S.; Hu, Z.; Li, F.; Yu, X.; Naeem, M.; Zhang, Y.; Chen, G. Manipulation of plant architecture and flowering time by down-regulation of the GRAS transcription factor SlGRAS26 in Solanum lycopersicum. Plant Sci. 2018, 271, 81–93. [Google Scholar] [CrossRef] [PubMed]
  31. Hu, Y.; Zhou, L.; Huang, M.; He, X.; Yang, Y.; Liu, X.; Li, Y.; Hou, X. Gibberellins play an essential role in late embryogenesis of Arabidopsis. Nat. Plants 2018, 4, 289–298. [Google Scholar] [CrossRef]
  32. Lai, Z.; Pan, L.; Chen, Z. Establishment and maintenance of longan embryogenic cell lines. J. Fujian Agric. For. Univ. (Nat. Sci. Ed.) 1997, 2, 33–40. [Google Scholar]
  33. Lai, Z.; Chen, Z. Somatic embryogenesis of high frequency from longan embryogenic calli. J. Fujian Agric. For. Univ. (Nat. Sci. Ed.) 1997, 3, 271–276. [Google Scholar]
  34. Lin, Y.; Lai, Z. Reference gene selection for qPCR analysis during somatic embryogenesis in longan tree. Plant Sci. 2010, 178, 359–365. [Google Scholar] [CrossRef]
  35. Chen, Y. Transcriptome and Proteomics Analysis During Early Somatic Embryogenesis and Expression, Functional Analysis of Flowering Time Related Genes in Dimocarpus longan Lour. Doctor’s Thesis, Fujian Agriculture and Forestry University, Fuzhou, China, 2018. [Google Scholar]
  36. Sun, J.; Wu, C.; Guan, E.; Xiong, D.; Zhou, T.; Chen, Y.; Liu, X.; Zhao, Q.; Wang, D.; Li, Z.; et al. Genome-Wide Identification and Expression Analysis of GRAS Gene Family in Nicotiana tabacum L. Chin. Tob. Sci. 2024, 45, 7–18. [Google Scholar] [CrossRef]
  37. Chen, T.; Li, H.; Wang, P.; Jiang, Y.; Xiao, J.; Yan, L.; Wang, Y.; Fan, Y. Identification of GRAS Gene Family in Paper Mulberry and Analysis of Its Expression in Stem Development. Guangdong Agric. Sci. 2024, 51, 107–119. [Google Scholar] [CrossRef]
  38. Ortiz-Ramírez, C.; Guillotin, B.; Xu, X.; Rahni, R.; Zhang, S.; Yan, Z.; Araujo, P.C.D.; Demesa-Arevalo, E.; Lee, L.; Van Eck, J.; et al. Ground tissue circuitry regulates organ complexity in maize and Setaria. Science 2021, 374, 1247–1252. [Google Scholar] [CrossRef]
  39. Engstrom, E.M. HAM proteins promote organ indeterminacy. Plant Signal. Behav. 2012, 7, 227–234. [Google Scholar] [CrossRef]
  40. Jain, M.; Khurana, P.; Tyagi, A.K.; Khurana, J.P. Genome-wide analysis of intronless genes in rice and Arabidopsis. Funct. Integr. Genom. 2007, 8, 69–78. [Google Scholar] [CrossRef] [PubMed]
  41. Rogozin, I.B.; Sverdlov, A.V.; Babenko, V.N.; Koonin, E.V. Analysis of evolution of exon-intron structure of eukaryotic genes. Brief. Bioinform. 2005, 6, 118–134. [Google Scholar] [CrossRef] [PubMed]
  42. Chen, C.; Lu, L.-L.; Ma, S.-Y.; Zhao, Y.-P.; Wu, N.; Li, W.-J.; Ma, L.; Kong, X.-H.; Xie, Z.-M.; Hou, Y.-X. Analysis of PAT1 subfamily members in the GRAS family of upland cotton and functional characterization of GhSCL13-2A in Verticillium dahliae resistance. Plant Cell Rep. 2023, 42, 487–504. [Google Scholar] [CrossRef]
  43. Wu, R.; Liu, W.; Liu, K.; Liang, G.; Wang, Y. Genome-Wide Identification and Expression of the GRAS Gene Family in Oat (Avena sativa L.). Agronomy 2023, 13, 1807. [Google Scholar] [CrossRef]
  44. Yu, L.; Hui, C.; Huang, R.; Wang, D.; Fei, C.; Guo, C.; Zhang, J. Genome-wide identification, evolution and transcriptome analysis of GRAS gene family in Chinese chestnut (Castanea mollissima). Front. Genet. 2023, 13, 1080759. [Google Scholar] [CrossRef]
  45. Kumari, P.; Gahlaut, V.; Kaur, E.; Singh, S.; Kumar, S.; Jaiswal, V. Genome-Wide Identification of GRAS Transcription Factors and Their Potential Roles in Growth and Development of Rose (Rosa chinensis). J. Plant Growth Regul. 2022, 42, 1505–1521. [Google Scholar] [CrossRef]
  46. Zhang, C.; Liu, S.; Liu, D.; Guo, F.; Yang, Y.; Dong, T.; Zhang, Y.; Ma, C.; Tang, Z.; Li, F.; et al. Genome-wide survey and expression analysis of GRAS transcription factor family in sweetpotato provides insights into their potential roles in stress response. BMC Plant Biol. 2022, 22, 1–19. [Google Scholar] [CrossRef] [PubMed]
  47. Gómez, M.D.; Fuster-Almunia, C.; Ocaña-Cuesta, J.; Alonso, J.M.; Pérez-Amador, M.A. RGL2 controls flower development, ovule number and fertility in Arabidopsis. Plant Sci. 2019, 281, 82–92. [Google Scholar] [CrossRef]
  48. Zhou, P.; Li, Q.; Xiong, M.; Fan, X.; Zhao, D.; Zhang, C. Advances in DELLA protein-mediated phytohormonal crosstalk in regulation of plant growth and development. Plant Physiol. J. 2020, 56, 661–671. [Google Scholar] [CrossRef]
  49. Cannon, S.B.; Mitra, A.; Baumgarten, A.; Young, N.D.; May, G. The roles of segmental and tandem gene duplication in the evolution of large gene families in Arabidopsis thaliana. BMC Plant Biol. 2004, 4, 10. [Google Scholar] [CrossRef]
  50. Wang, Y.; Lü, J.; Chen, D.; Zhang, J.; Qi, K.; Cheng, R.; Zhang, H.; Zhang, S. Genome-wide identification, evolution, and expression analysis of the KT/HAK/KUP family in pear. Genome 2018, 61, 755–765. [Google Scholar] [CrossRef] [PubMed]
  51. Jin, J.F.; Wang, Z.Q.; He, Q.Y.; Wang, J.Y.; Li, P.F.; Xu, J.M.; Zheng, S.J.; Fan, W.; Yang, J.L. Genome-wide identification and expression analysis of the NAC transcription factor family in tomato (Solanum lycopersicum) during aluminum stress. BMC Genom. 2020, 21, 1–14. [Google Scholar] [CrossRef]
  52. Yamaguchi-Shinozaki, K.; Shinozaki, K. TRANSCRIPTIONAL REGULATORY NETWORKS IN CELLULAR RESPONSES AND TOLERANCE TO DEHYDRATION AND COLD STRESSES. Annu. Rev. Plant Biol. 2006, 57, 781–803. [Google Scholar] [CrossRef] [PubMed]
  53. Upadhyay, R.K.; Mattoo, A.K. Genome-wide identification of tomato (Solanum lycopersicum L.) lipoxygenases coupled with expression profiles during plant development and in response to methyl-jasmonate and wounding. J. Plant Physiol. 2018, 231, 318–328. [Google Scholar] [CrossRef]
  54. Kim, J.C.; Lee, S.H.; Cheong, Y.H.; Yoo, C.; Lee, S.I.; Chun, H.J.; Yun, D.; Hong, J.C.; Lee, S.Y.; Lim, C.O.; et al. A novel cold-inducible zinc finger protein from soybean, SCOF-1, enhances cold tolerance in transgenic plants. Plant J. 2001, 25, 247–259. [Google Scholar] [CrossRef]
  55. Wang, J.-D.; Liu, Q.-Q.; Li, Q.-F. DELLA family proteins function beyond the GA pathway. Trends Plant Sci. 2025, 30, 352–355. [Google Scholar] [CrossRef]
  56. Fukazawa, J.; Mori, M.; Watanabe, S.; Miyamoto, C.; Ito, T.; Takahashi, Y. DELLA-GAF1 Complex Is a Main Component in Gibberellin Feedback Regulation of GA20 Oxidase. Plant Physiol. 2017, 175, 1395–1406. [Google Scholar] [CrossRef]
  57. Troncoso-Ponce, M.A.; Barthole, G.; Tremblais, G.; To, A.; Miquel, M.; Lepiniec, L.; Baud, S. Transcriptional Activation of Two Delta-9 Palmitoyl-ACP Desaturase Genes by MYB115 and MYB118 Is Critical for Biosynthesis of Omega-7 Monounsaturated Fatty Acids in the Endosperm of Arabidopsis Seeds. Plant Cell 2016, 28, 2666–2682. [Google Scholar] [CrossRef]
  58. Curaba, J.; Moritz, T.; Blervaque, R.; Parcy, F.; Raz, V.; Herzog, M.; Vachon, G. AtGA3ox2, a Key Gene Responsible for Bioactive Gibberellin Biosynthesis, Is Regulated during Embryogenesis by LEAFY COTYLEDON2 and FUSCA3 in Arabidopsis. Plant Physiol. 2004, 136, 3660–3669. [Google Scholar] [CrossRef]
  59. Tang, M.; Gao, X.; Meng, W.; Lin, J.; Zhao, G.; Lai, Z.; Lin, Y.; Chen, Y. Transcription factors NF-YB involved in embryogenesis and hormones responses in Dimocarpus longan Lour. Front. Plant Sci. 2023, 14, 1255436. [Google Scholar] [CrossRef]
  60. Chen, Y.; Xie, D.; Ma, X.; Xue, X.; Liu, M.; Xiao, X.; Lai, C.; Xu, X.; Chen, X.; Chen, Y.; et al. Genome-wide high-throughput chromosome conformation capture analysis reveals hierarchical chromatin interactions during early somatic embryogenesis. Plant Physiol. 2023, 193, 555–577. [Google Scholar] [CrossRef]
  61. Huala, E.; Dickerman, A.W.; Garcia-Hernandez, M.; Weems, D.; Reiser, L.; LaFond, F.; Hanley, D.; Kiphart, D.; Zhuang, M.; Huang, W.; et al. The Arabidopsis Information Resource (TAIR): A comprehensive database and web-based information retrieval, analysis, and visualization system for a model plant. Nucleic Acids Res. 2001, 29, 102–105. [Google Scholar] [CrossRef]
  62. Hu, G.; Feng, J.; Xiang, X.; Wang, J.; Salojärvi, J.; Liu, C.; Wu, Z.; Zhang, J.; Liang, X.; Jiang, Z.; et al. Two divergent haplotypes from a highly heterozygous lychee genome suggest independent domestication events for early and late-maturing cultivars. Nat. Genet. 2022, 54, 73–83. [Google Scholar] [CrossRef]
  63. Mistry, J.; Chuguransky, S.; Williams, L.; Qureshi, M.; Salazar, G.A.; Sonnhammer, E.L.L.; Tosatto, S.C.; Paladin, L.; Raj, S.; Richardson, L.J.; et al. Pfam: The protein families database in 2021. Nucleic Acids Res. 2021, 49, D412–D419. [Google Scholar] [CrossRef] [PubMed]
  64. Wang, J.; Chitsaz, F.; Derbyshire, M.K.; Gonzales, N.R.; Gwadz, M.; Lu, S.; Marchler, G.H.; Song, J.S.; Thanki, N.; Yamashita, R.A.; et al. The conserved domain database in 2023. Nucleic Acids Res. 2023, 51, D384–D388. [Google Scholar] [CrossRef] [PubMed]
  65. Chen, C.J.; Chen, H.; Zhang, Y.; Thomas, H.R.; Frank, M.H.; He, Y.H.; Xia, R. TBtools: An Integrative Toolkit Developed for Interactive Analyses of Big Biological Data. Mol. Plant 2020, 13, 1194–1202. [Google Scholar] [CrossRef] [PubMed]
  66. Duvaud, S.; Gabella, C.; Lisacek, F.; Stockinger, H.; Ioannidis, V.; Durinx, C. Expasy, the Swiss Bioinformatics Resource Portal, as designed by its users. Nucleic Acids Res. 2021, 49, W216–W227. [Google Scholar] [CrossRef]
  67. Teufel, F.; Armenteros, J.J.A.; Johansen, A.R.; Gíslason, M.H.; Pihl, S.I.; Tsirigos, K.D.; Winther, O.; Brunak, S.; von Heijne, G.; Nielsen, H. SignalP 6.0 predicts all five types of signal peptides using protein language models. Nat. Biotechnol. 2022, 40, 1023–1025. [Google Scholar] [CrossRef]
  68. Horton, P.; Park, K.-J.; Obayashi, T.; Fujita, N.; Harada, H.; Adams-Collier, C.J.; Nakai, K. WoLF PSORT: Protein localization predictor. Nucleic Acids Res. 2007, 35, W585–W587. [Google Scholar] [CrossRef]
  69. Krogh, A.; Larsson, B.; von Heijne, G.; Sonnhammer, E.L. Predicting transmembrane protein topology with a hidden markov model: Application to complete genomes. J. Mol. Biol. 2001, 305, 567–580. [Google Scholar] [CrossRef]
  70. Letunic, I.; Bork, P. Interactive Tree Of Life (iTOL) v5: An online tool for phylogenetic tree display and annotation. Nucleic Acids Res. 2021, 49, W293–W296. [Google Scholar] [CrossRef]
  71. Nystrom, S.L.; McKay, D.J. Memes: A motif analysis environment in R using tools from the MEME Suite. PLOS Comput. Biol. 2021, 17, e1008991. [Google Scholar] [CrossRef] [PubMed]
  72. Hu, B.; Jin, J.; Guo, A.-Y.; Zhang, H.; Luo, J.; Gao, G. GSDS 2.0: An upgraded gene feature visualization server. Bioinformatics 2015, 31, 1296–1297. [Google Scholar] [CrossRef] [PubMed]
  73. Lescot, M.; Déhais, P.; Thijs, G.; Marchal, K.; Moreau, Y.; Van de Peer, Y.; Rouzé, P.; Rombauts, S. PlantCARE, a database of plant cis-acting regulatory elements and a portal to tools for in silico analysis of promoter sequences. Nucleic Acids Res. 2002, 30, 325–327. [Google Scholar] [CrossRef] [PubMed]
  74. Jin, J.; Tian, F.; Yang, D.-C.; Meng, Y.-Q.; Kong, L.; Luo, J.; Gao, G. PlantTFDB 4.0: Toward a central hub for transcription factors and regulatory interactions in plants. Nucleic Acids Res. 2016, 45, D1040–D1045. [Google Scholar] [CrossRef]
  75. Lin, Y.; Min, J.; Lai, R.; Wu, Z.; Chen, Y.; Yu, L.; Cheng, C.; Jin, Y.; Tian, Q.; Liu, Q.; et al. Genome-wide sequencing of longan (Dimocarpus longan Lour.) provides insights into molecular basis of its polyphenol-rich characteristics. GigaScience 2017, 6, 1–14. [Google Scholar] [CrossRef]
  76. Li, H.; Lyu, Y.; Chen, X.; Wang, C.; Yao, D.; Ni, S.; Lin, Y.; Chen, Y.; Zhang, Z.; Lai, Z. Exploration of the Effect of Blue Light on Functional Metabolite Accumulation in Longan Embryonic Calli via RNA Sequencing. Int. J. Mol. Sci. 2019, 20, 441. [Google Scholar] [CrossRef] [PubMed]
  77. Untergasser, A.; Cutcutache, I.; Koressaar, T.; Ye, J.; Faircloth, B.C.; Remm, M.; Rozen, S.G. Primer3—New capabilities and interfaces. Nucleic Acids Res. 2012, 40, e115. [Google Scholar] [CrossRef] [PubMed]
  78. Vandesompele, J.; De Preter, K.; Pattyn, F.; Poppe, B.; Van Roy, N.; De Paepe, A.; Speleman, F. Accurate normalization of real-time quantitative RT-PCR data by geometric averaging of multiple internal control genes. Genome Biol. 2002, 3, RESEARCH0034. [Google Scholar] [CrossRef] [PubMed]
  79. Zhang, X.; Liang, Z.; Chen, X.; Zhang, S.; Lai, Z.; Lin, Y. Subcellular localization analysis and responses to exogenous ABA and SA in longan callus of DCL4. Chin. J. Trop. Crops 2021, 42, 1514–1519. [Google Scholar] [CrossRef]
  80. Reese, M.G. Application of a time-delay neural network to promoter annotation in the Drosophila melanogaster genome. Comput. Chem. 2001, 26, 51–56. [Google Scholar] [CrossRef]
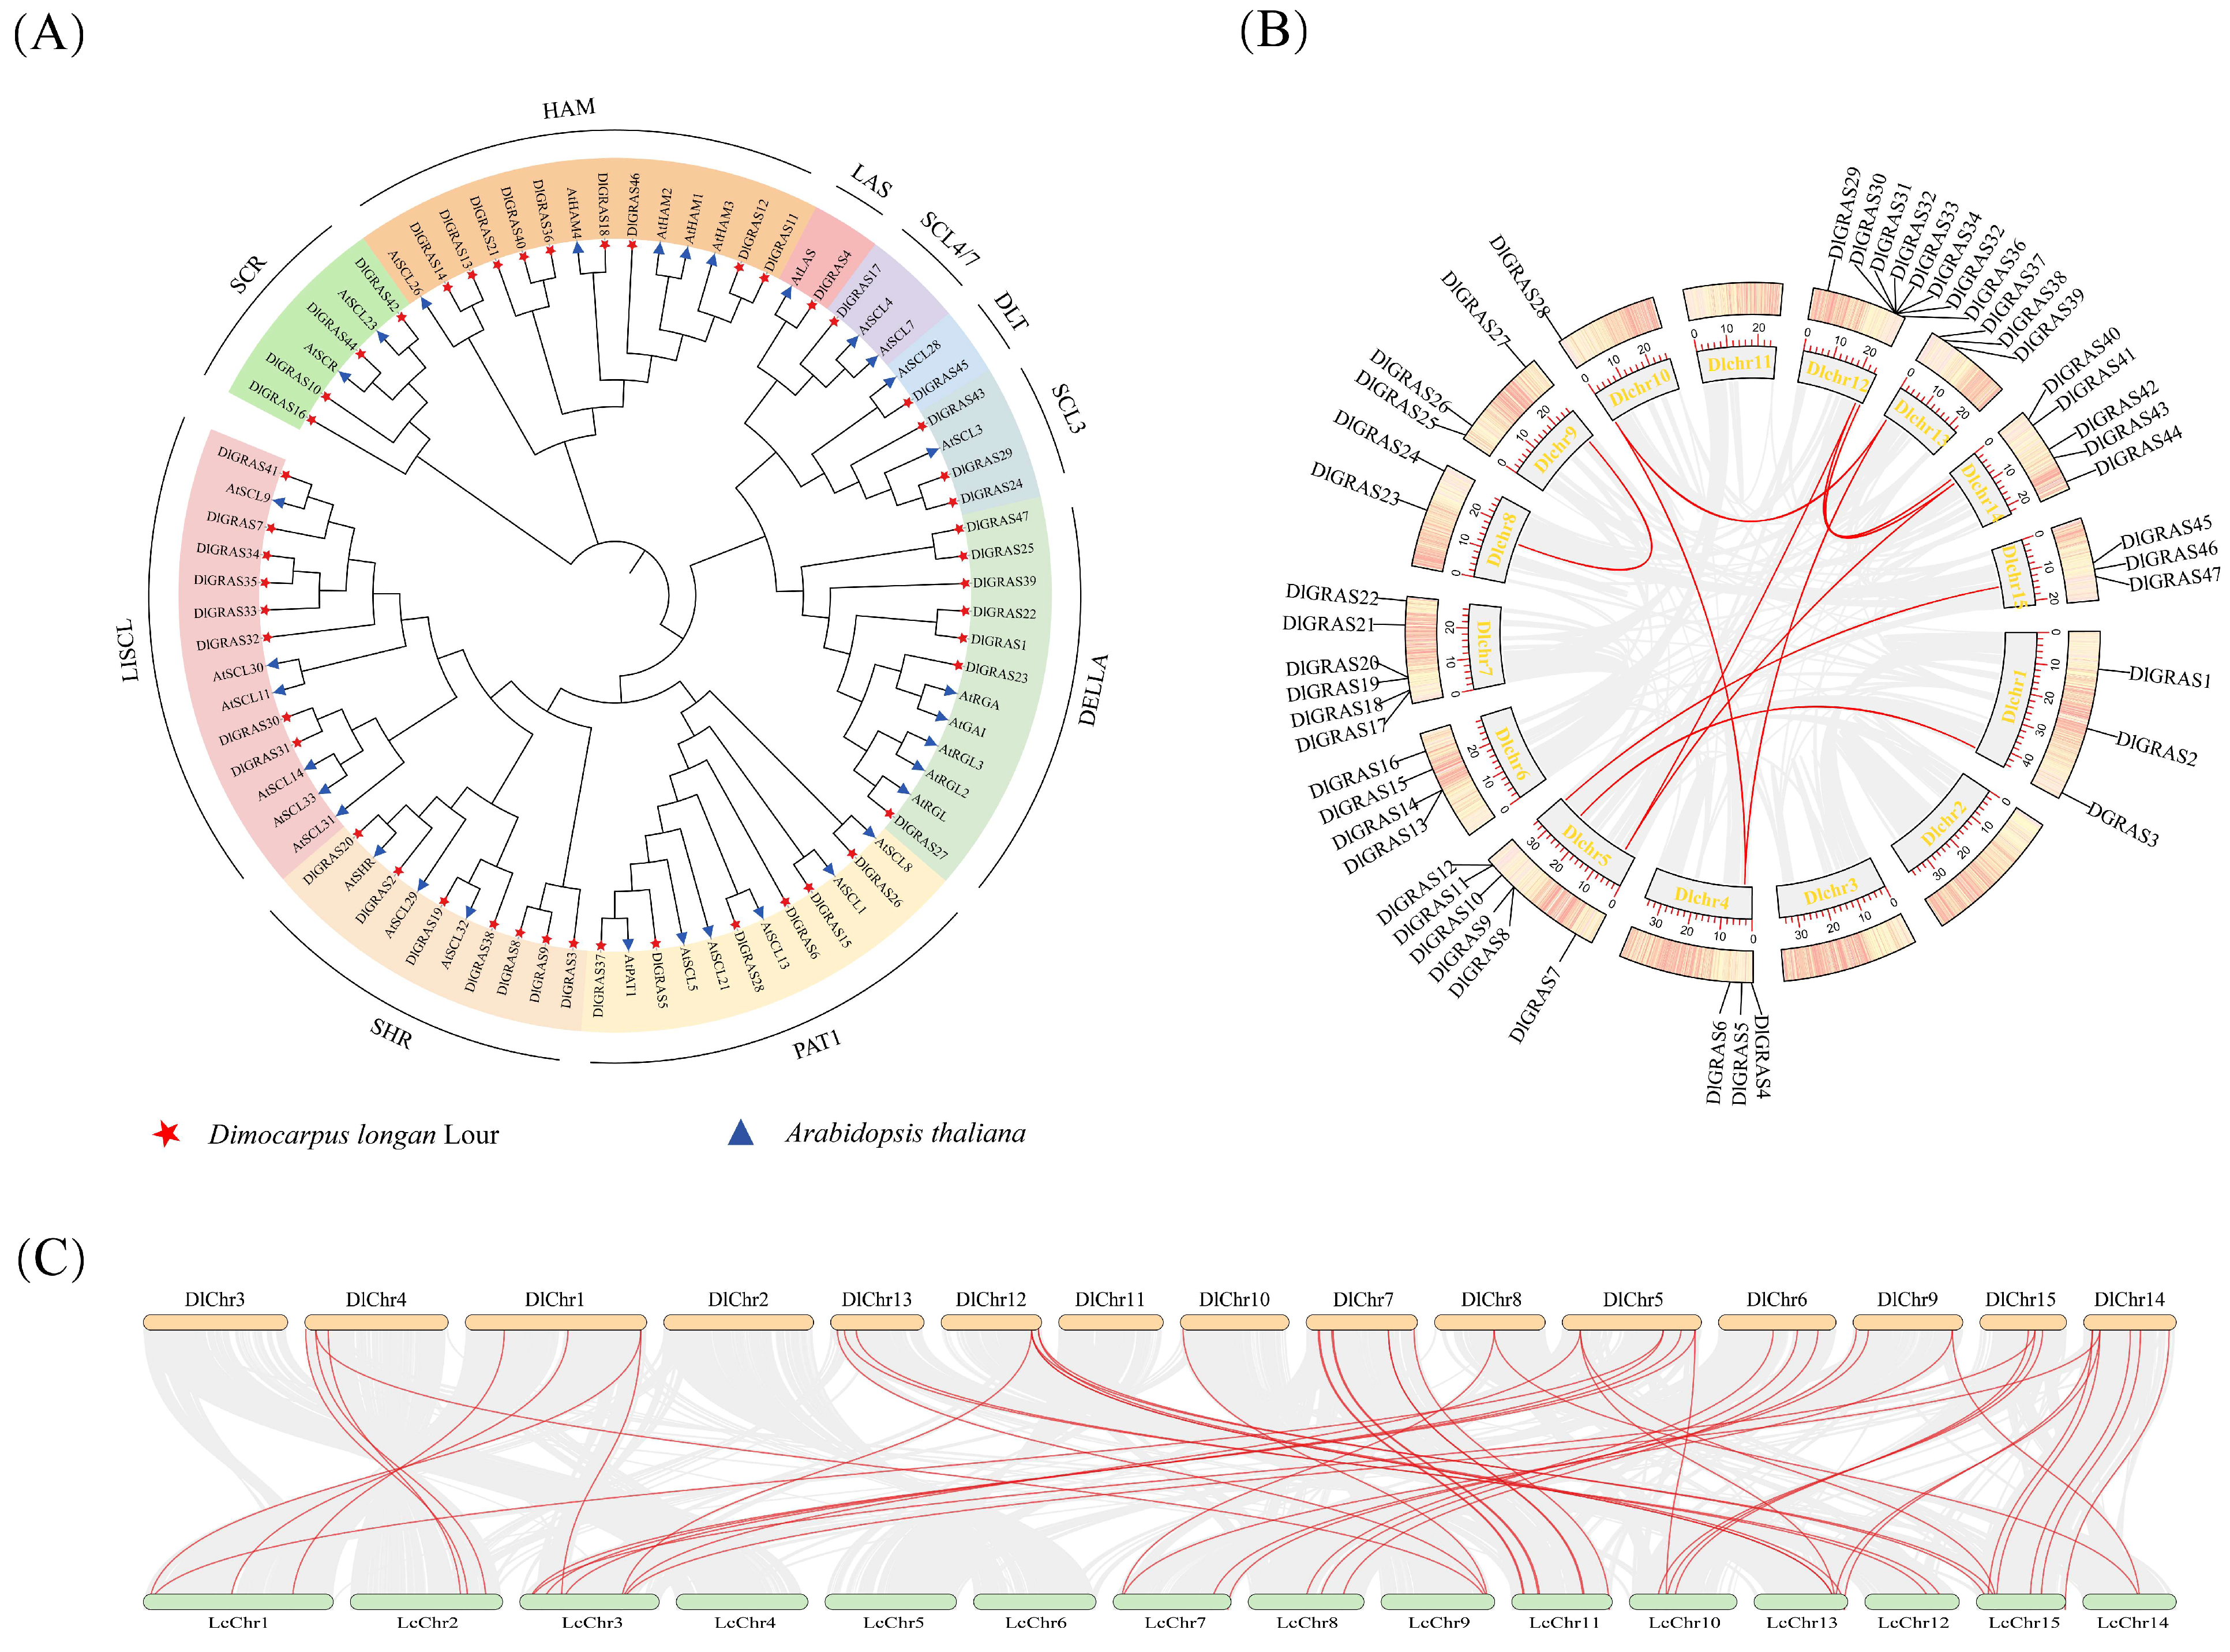
Figure 1. Phylogenetic tree and collinearity analysis of DlGRAS. (A) The phylogenetic tree of DlGRAS proteins in longan (Dl) and A. thaliana (At). (B) The collinearity analysis of DlGRAS genes in longan. (C) The collinearity analysis of DlGRAS between longan (Dl) and litchi (Lc). The genes connected by red arcs exhibit collinearity, and the gray arc regions represent all the collinearity regions in the longan genome.
Ijms 26 10323 g001
Figure 2. Protein conserved motifs, protein conserved domains and gene structure of DlGRAS. The motifs numbered from 1~9 are displayed as boxes in different colors; different colors represent different domains; the green boxes represent exons; the yellow boxes represent UTR; the black lines represent introns.
Ijms 26 10323 g002
Figure 3. Transcription factor binding sites and cis-elements of DlGRAS. (A) The transcription factor binding site of DlGRAS genes. (B) The cis-elements of DlGRAS. The blank spaces represent the absence of elements, the color intensity represents the number of components, and the number in the square represents the number of elements.
Ijms 26 10323 g003
Figure 4. Expression patterns of DlGRAS genes based on FPKM values. (A) The specific expression of DlGRAS genes during different SE stages. (B) The particular expression of DlGRAS in other tissues. (C) The specific expression of DlGRAS under different light qualities. (D) The particular expression of DlGRAS at various temperatures. All plant materials were ‘Honghezi’ longan. Different colors on the scale bar are log2FPKM, which represent different transcript levels.
Ijms 26 10323 g004
Figure 5. The qRT-PCR analysis of DlGRAS during early SE and different developmental stages of zygotic embryos. (A) Morphology during the early stage of SE in longan. The scale bar represents 200 μm. (B) The qRT-PCR analysis of DlGRAS during the early SE. (C) Morphology at different developmental stages of zygotic embryos. The scale bar represents 1 cm. (D) The qRT-PCR analysis of DlGRAS at different developmental stages of zygotic embryos. The internal reference genes were DlACTB, DlEF-la, DlUBQ, three biological replicates, EC: embryogenic callus; ICpEC: Incomplete embryogenic compact structure; GE: globular embryo, different lowercase letters (a, b, c, d, e) show significant differences between treatments (p < 0.05).
Ijms 26 10323 g005
Figure 6. The expression of DlGRAS under different exogenous hormone treatments. (A) The qRT-PCR analysis of DlGRAS under GA3 treatment. (B) The qRT-PCR analysis of DlGRAS under ABA treatment. The internal reference genes were DlACTB, DlEF-la, and DlUBQ, three biological replicates, different lowercase letters (a, b, c, d, e) show significant differences between treatments (p < 0.05).
Ijms 26 10323 g006
Figure 7. Subcellular localization of DlGRAS proteins in onion epidermal cells. TD represents the transmission light channel. The scale bar is 50 μm, and the arrows indicate the localization of GFP and DAPI fluorescence signals within the cells. The excitation wavelength for GFP is 475 nm, and for DAPI, it is 450 nm.
Ijms 26 10323 g007
Figure 8. GUS gene expression level of DlGRAS under ABA and GA3 treatments. (A) The histochemical staining the GUS gene in N. benthamiana leaves, the scale bar represents 200 μm. (B) The schematic diagram of the DlGRAS promoter vector. (C) The expression level of the GUS gene driven by 35S and DlGRAS under ABA and GA3 treatments. The internal reference gene was Nb18S, three biological replicates, and different lowercase letters (a, b, c) show significant differences between treatments (p < 0.05).
Ijms 26 10323 g008
Figure 9. DlGRAS10/22 Transformation of longan EC. (A) GUS histochemical staining, the scale bar is 200 μm. (B) DNA molecular identification of transiently transformed longan EC, M2K represents the length of Maker is 2000 bp. (C) Determination of ABA and GA3. (D) The expression of GUS and SE-related genes in transgenic longan EC. The internal reference gene was DlACTB, three biological replicates, and different lowercase letters (a, b, c) show significant differences between treatments (p < 0.05).
Ijms 26 10323 g009
Disclaimer/Publisher’s Note: The statements, opinions and data contained in all publications are solely those of the individual author(s) and contributor(s) and not of MDPI and/or the editor(s). MDPI and/or the editor(s) disclaim responsibility for any injury to people or property resulting from any ideas, methods, instructions or products referred to in the content.