1. Introduction
Osteosarcoma is the predominant malignant bone tumor affecting mainly children and adolescents and is characterized by a strong propensity for metastasis and recurrence [
1,
2,
3]. Current standard therapies have remained largely unchanged for nearly fifty years, typically combining surgery with multi-agent chemotherapy, most often high-dose doxorubicin, methotrexate, and cisplatin [
4]. Although these regimens have improved outcomes, their effectiveness is limited by severe side effects and the development of drug resistance. Combination therapies have demonstrated enhanced efficacy and remain a promising strategy to overcome these limitations [
5]. However, the survival rates remain suboptimal due to tumor aggressiveness and chemotherapy resistance [
1]. Therefore, there is an urgent need for novel therapeutic approaches that can effectively target tumor heterogeneity and resistance while minimizing undesired side effects.
Boron and boronic acid compounds have long been used in the development of therapies for various diseases, including cancer [
6,
7,
8]. Boron neutron capture therapy (BNCT) has been an emerging strategy in osteosarcoma therapy lately [
9,
10,
11]. Notably, boronic acid used in BNCT significantly reduced osteolysis and the tumor burden in osteosarcoma-bearing rat models, with studies also demonstrating its selective accumulation in tumor tissue [
11].
Halogenated boroxine K
2(B
3O
3F
4OH) (HB), a product of the cyclic anhydride of boric acid, is patented as a substance with potential antitumor and antiproliferative effects on skin lesions [
12,
13,
14]. In a series of in vitro and in vivo studies on the antitumor potential of HB, its tumor-suppressive effects on various types of tumors have been observed across a range of HB concentrations with minimal effects on non-malignant cells [
15,
16,
17,
18,
19,
20,
21,
22]. Results of the research on its effect suggest that it acts as a pro-apoptotic agent in leukemia cells [
19,
20] and modulates metabolic phenotype and autophagy in human bladder carcinoma cells [
21]. Still, its mechanism of action has not been fully elucidated, and its effects on bone tumors have not yet been investigated.
Significant improvements in developing selective tumor-targeting drugs were achieved with the advances in nanotechnology and knowledge of cancer biology [
2]. Several nanomedicine formulations have even been clinically approved in recent decades [
23]. Their growing use is driven by multifunctional capabilities in drug delivery, diagnosis, and imaging, along with advantages such as an extended circulation time, improved tissue accumulation, and reduced toxicity [
23]. Among nanomaterials, cerium oxide nanoparticles (CeNPs) have attracted significant attention due to their unique redox properties, high biocompatibility, and potential biomedical applications. CeNPs exhibit self-regenerative redox activity, enabling dual antioxidant and pro-oxidant effects that regulate ROS levels in biological systems [
24]. By mimicking ROS-related enzymes, CeNPs protect normal cells from oxidative stress while inducing cancer cell death, enhancing tumor sensitization for various therapies. Additionally, CeNPs are used as nanocarriers to improve drug delivery and in combination with other drugs to achieve synergistic anticancer effects [
24].
In the context of osteosarcoma, CeNPs have shown promising anticancer activity, with selective cytotoxicity enhanced under acidic conditions that mimic the tumor microenvironment [
25]. Additionally, there has been a study indicating that higher dextran coating concentrations can improve the therapeutic efficacy of CeNPs while minimizing the toxicity to healthy bone cells [
26]. These properties position dextran-coated CeNPs (Dex-CeNPs) as a potential candidate for targeted osteosarcoma treatment.
The strategy of combining or co-delivering multiple therapeutic agents is increasingly employed in cancer research to maximize efficacy through synergistic, additive, or potentiating effects [
27,
28]. While HB has shown selective antitumor activity in various cancer models, its effectiveness against osteosarcoma remains unknown. On the other hand, as noted above, Dex-CeNPs have also exhibited selective antitumor effects, particularly in the osteosarcoma model. Therefore, the present study aimed to evaluate the cytotoxic and oxidative effects of HB and recently described Dex-CeNPs [
29] on osteosarcoma cells. Additionally, the combined effects of HB and Dex-CeNPs were assessed on osteosarcoma and osteoblast cell lines to explore their potential as a novel combinatorial therapeutic approach. To enhance the physiological relevance of these findings, in addition to standard 2D cultures, 3D tumor spheroid models were employed, as they better represent the tumor microenvironment. Thus, evaluating HB, Dex-CeNPs, and their combination in spheroid cultures provided deeper insight into their therapeutic potential.
3. Discussion
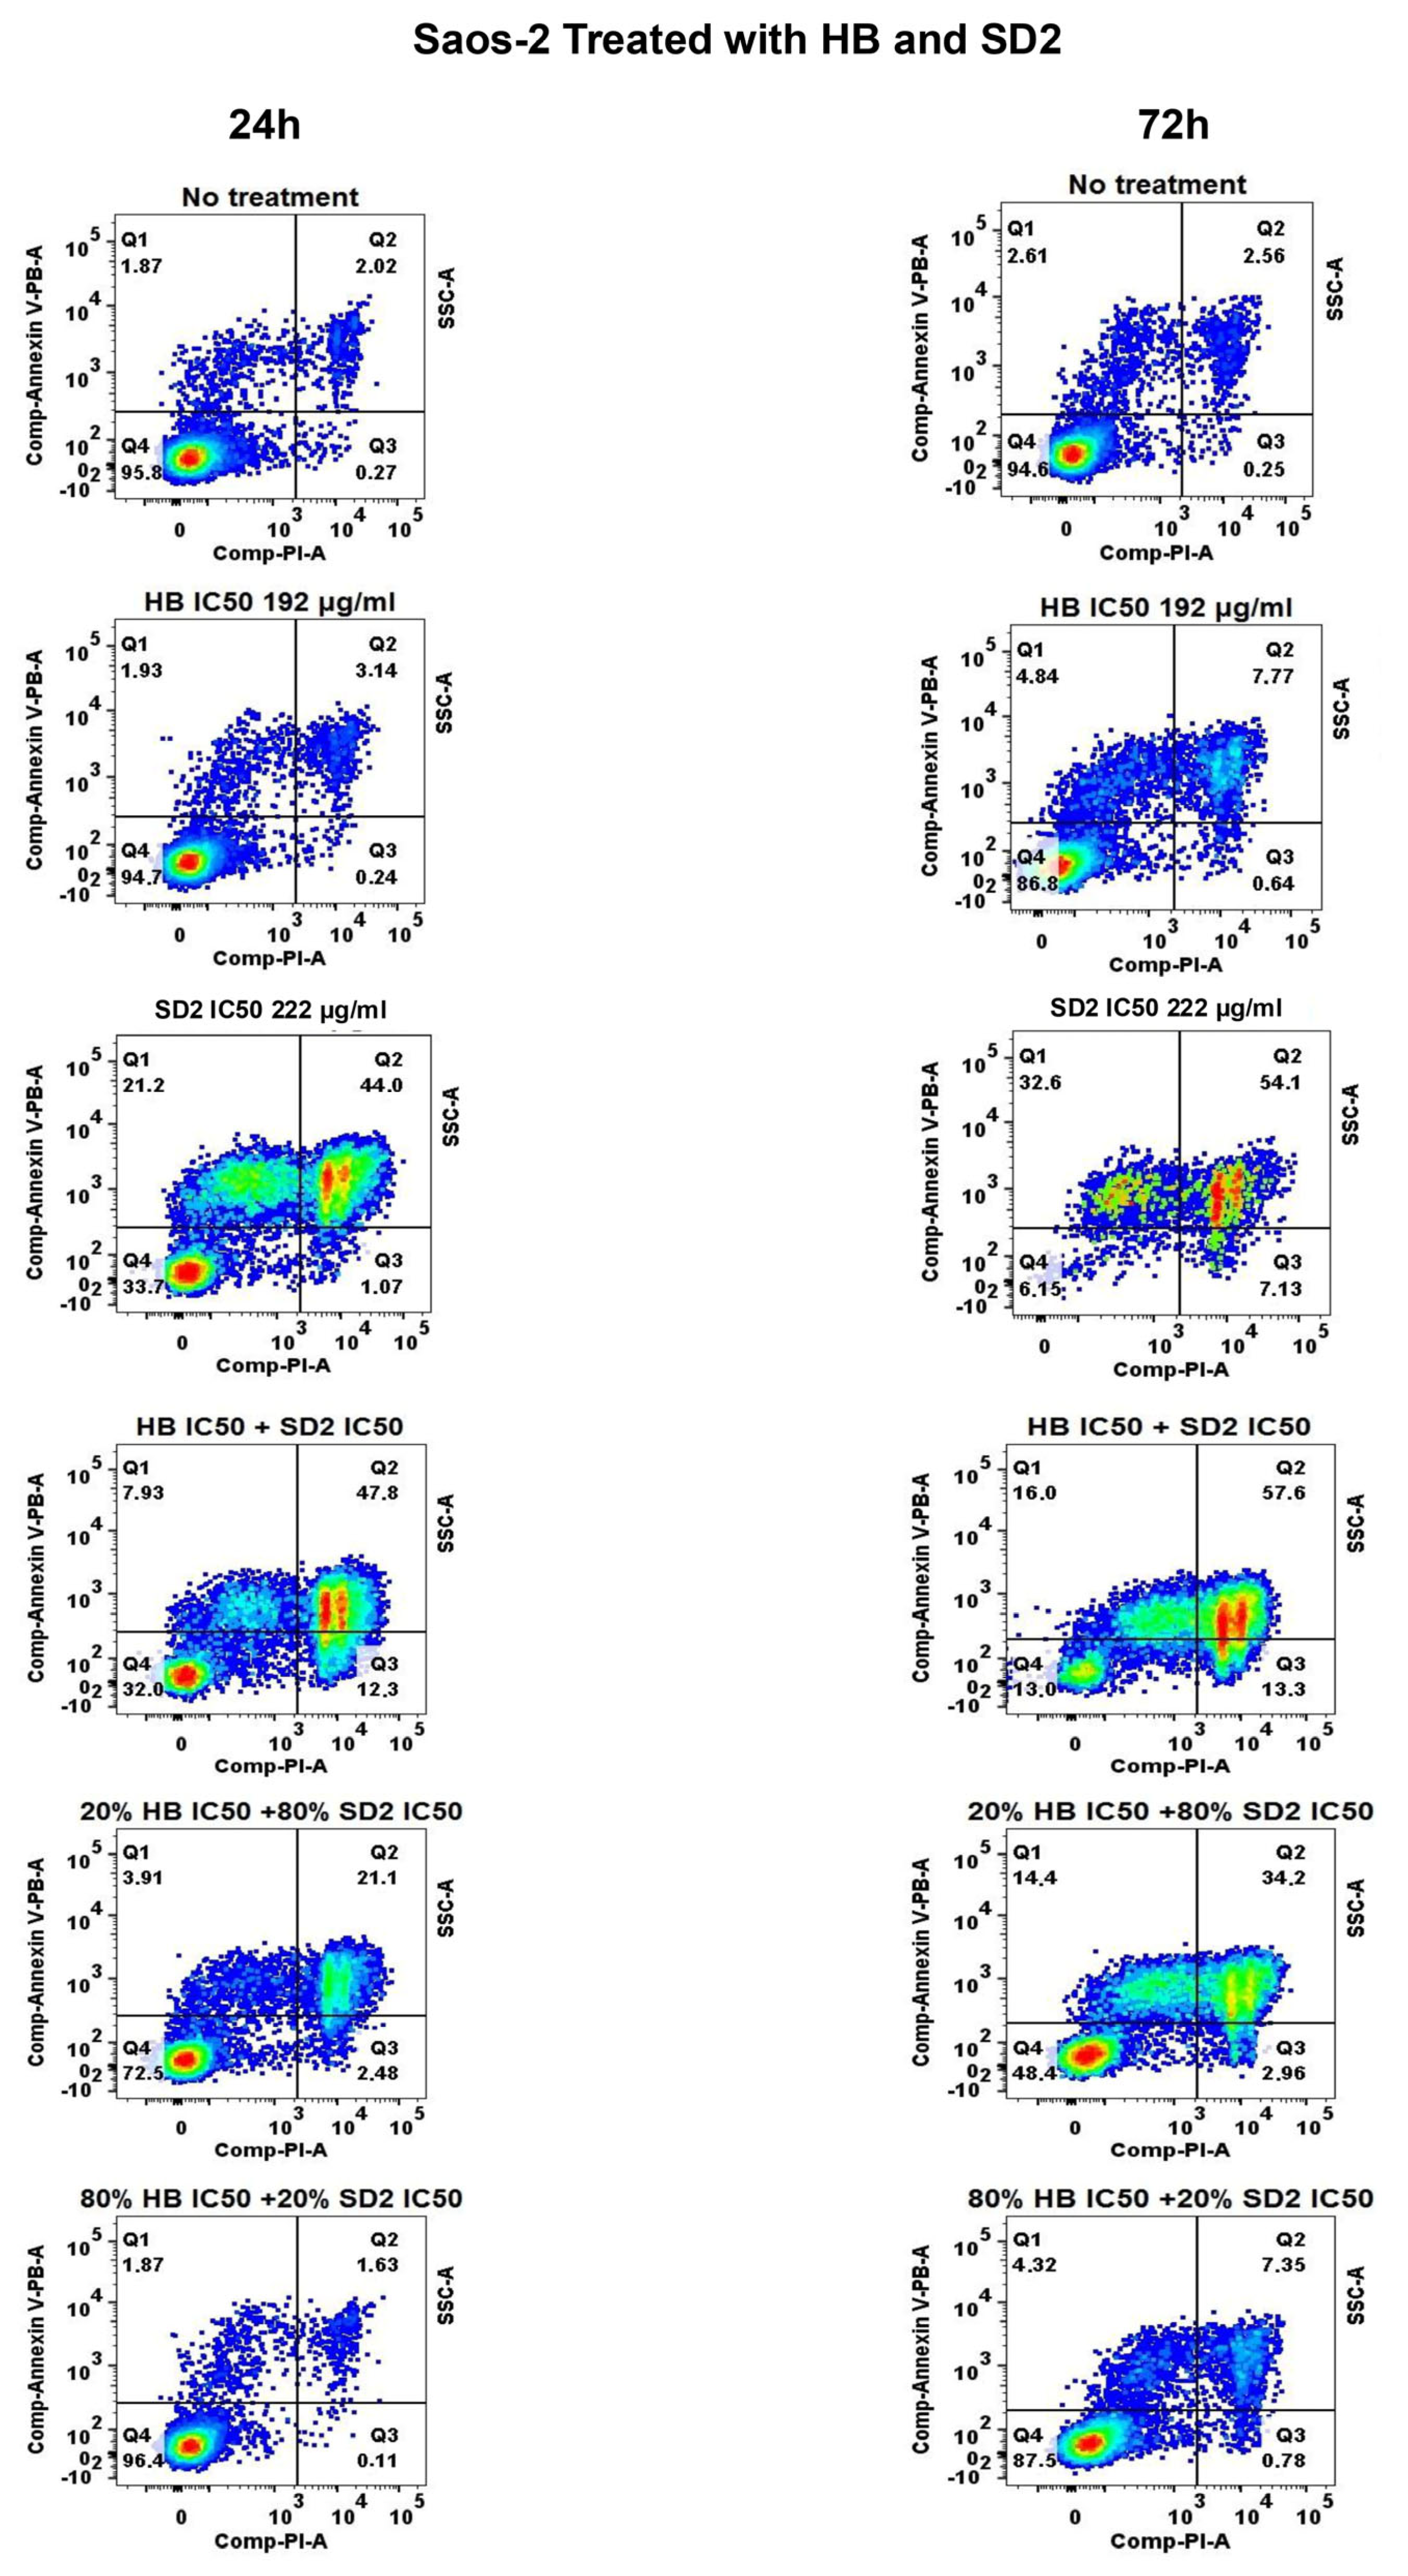
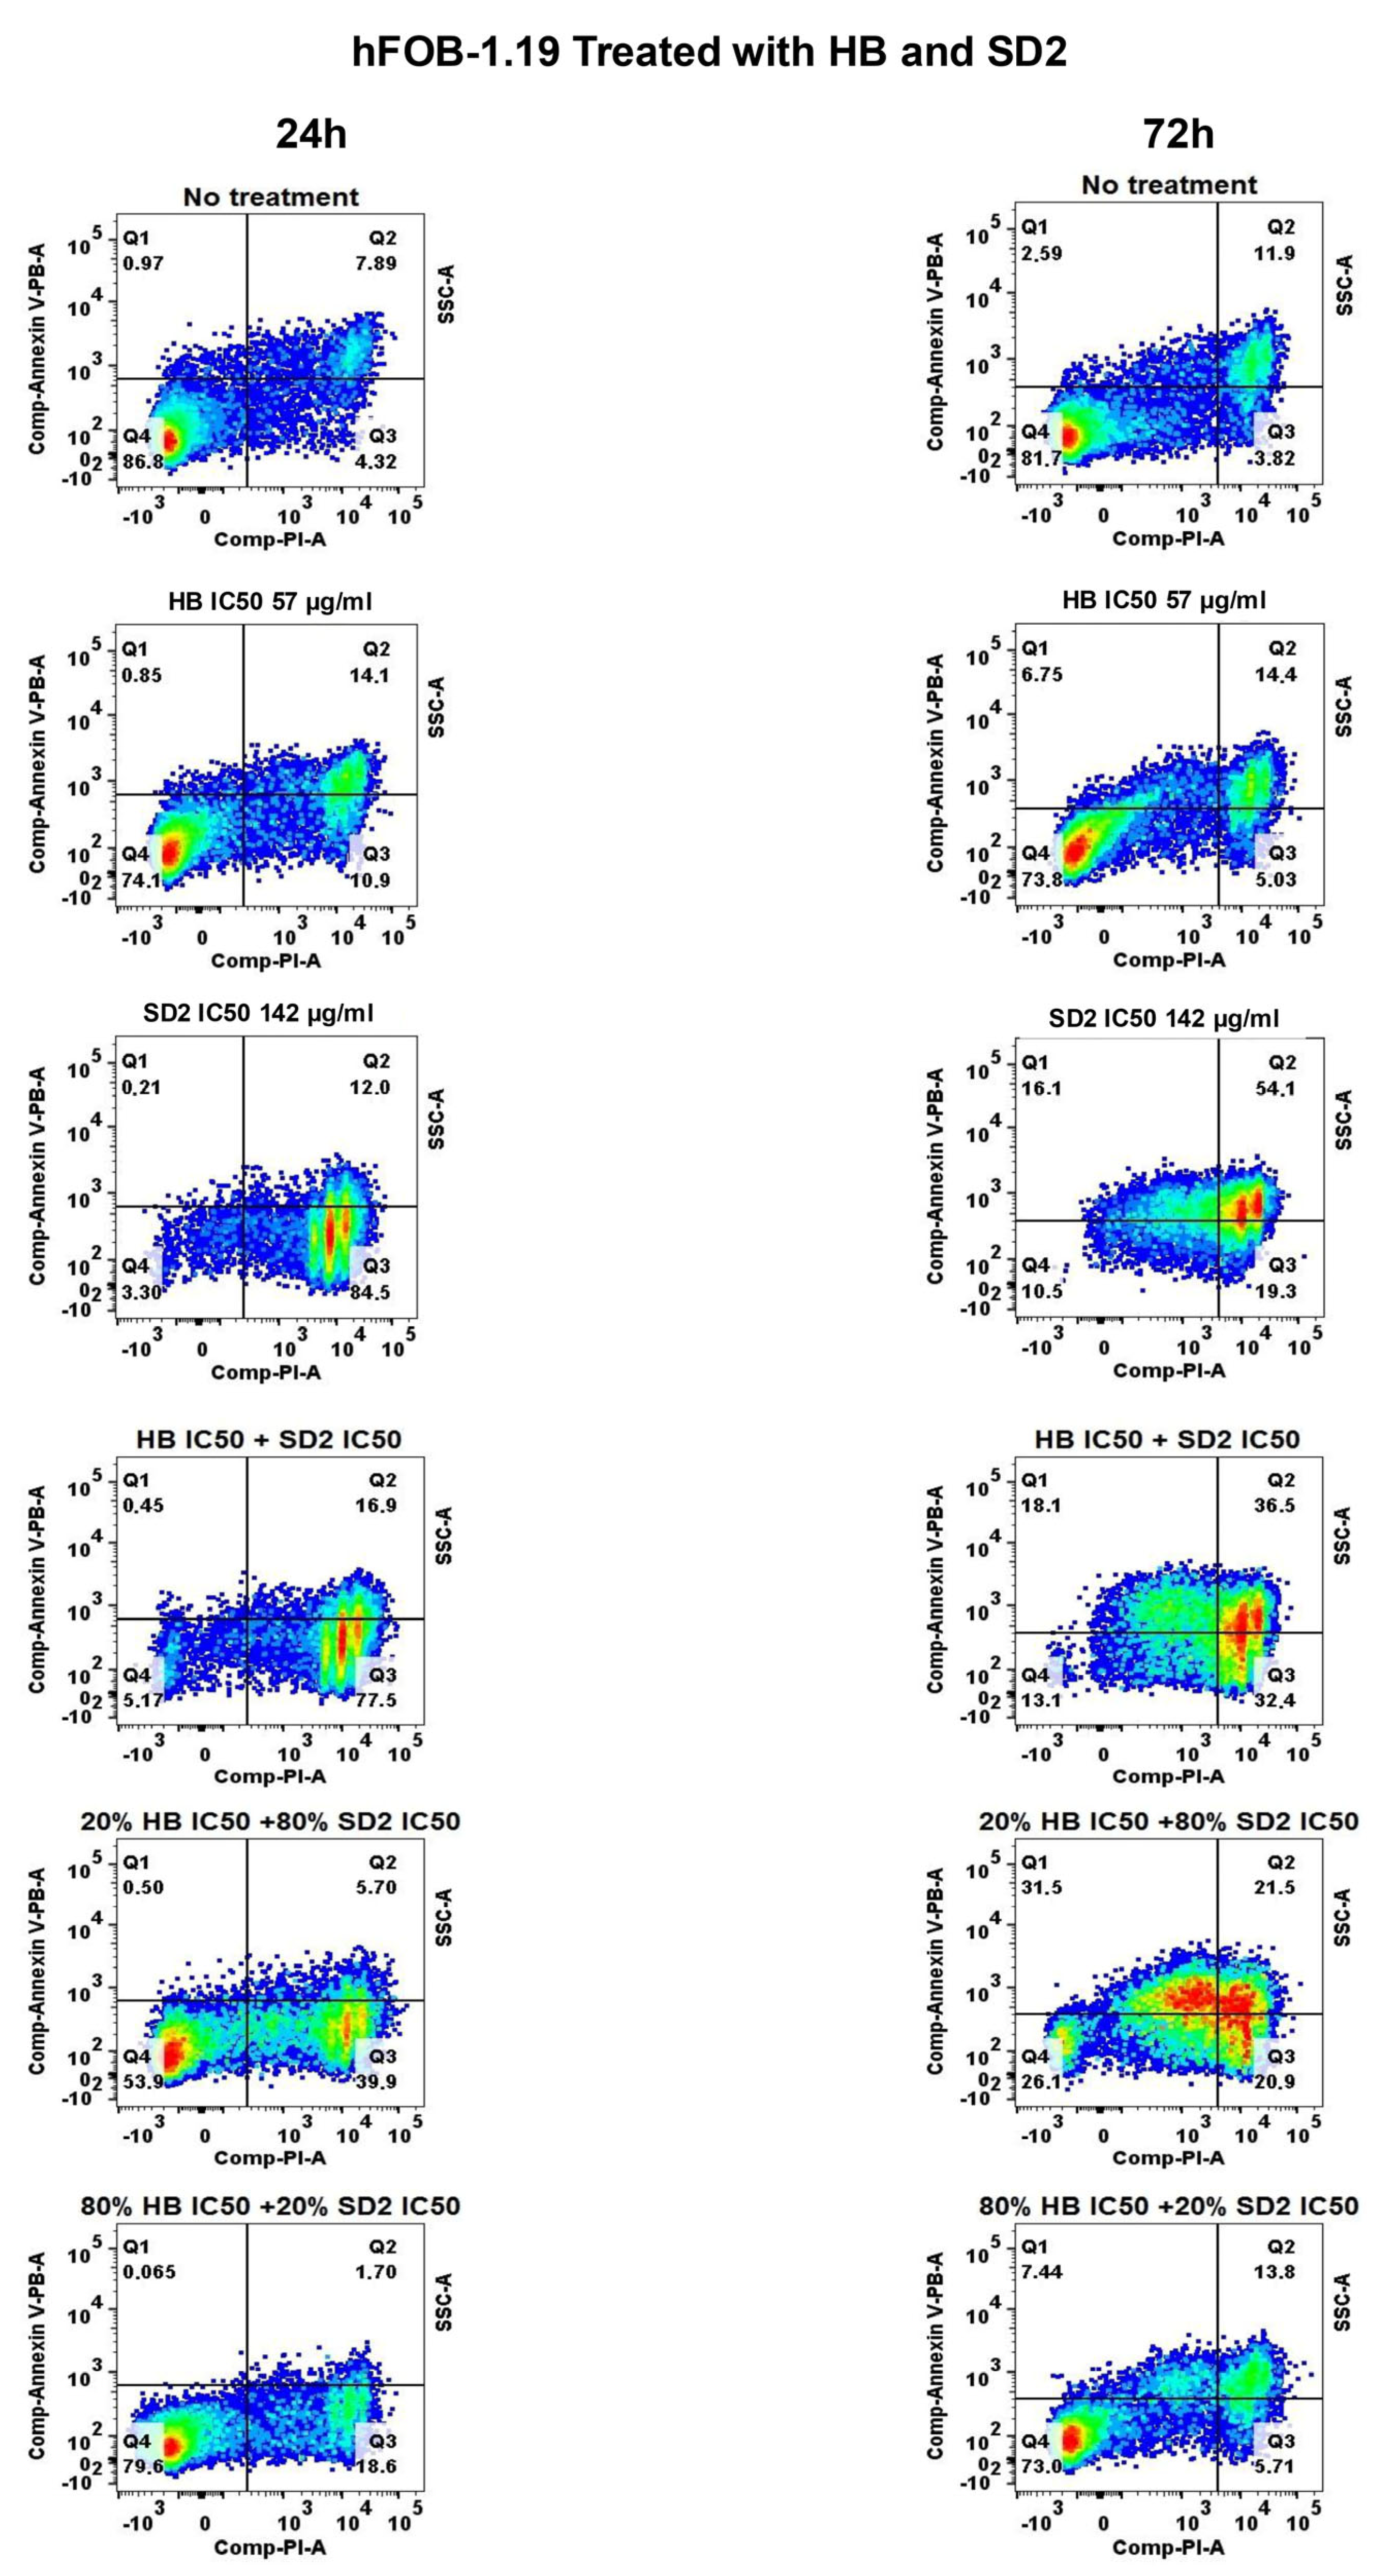
Using various experimental approaches, the results of this study integrate data on the effects of HB, SD2, and their co-treatments in tumorigenic (MG-63 and Saos-2) and non-tumor (hFOB 1.19) cell lines. Observations from individual and combined treatments are contextualized in the following section across multiple levels of analysis—starting with the cytotoxicity and ROS profiles, followed by the apoptotic and necrotic responses, and concluding with the 3D spheroid growth dynamics.
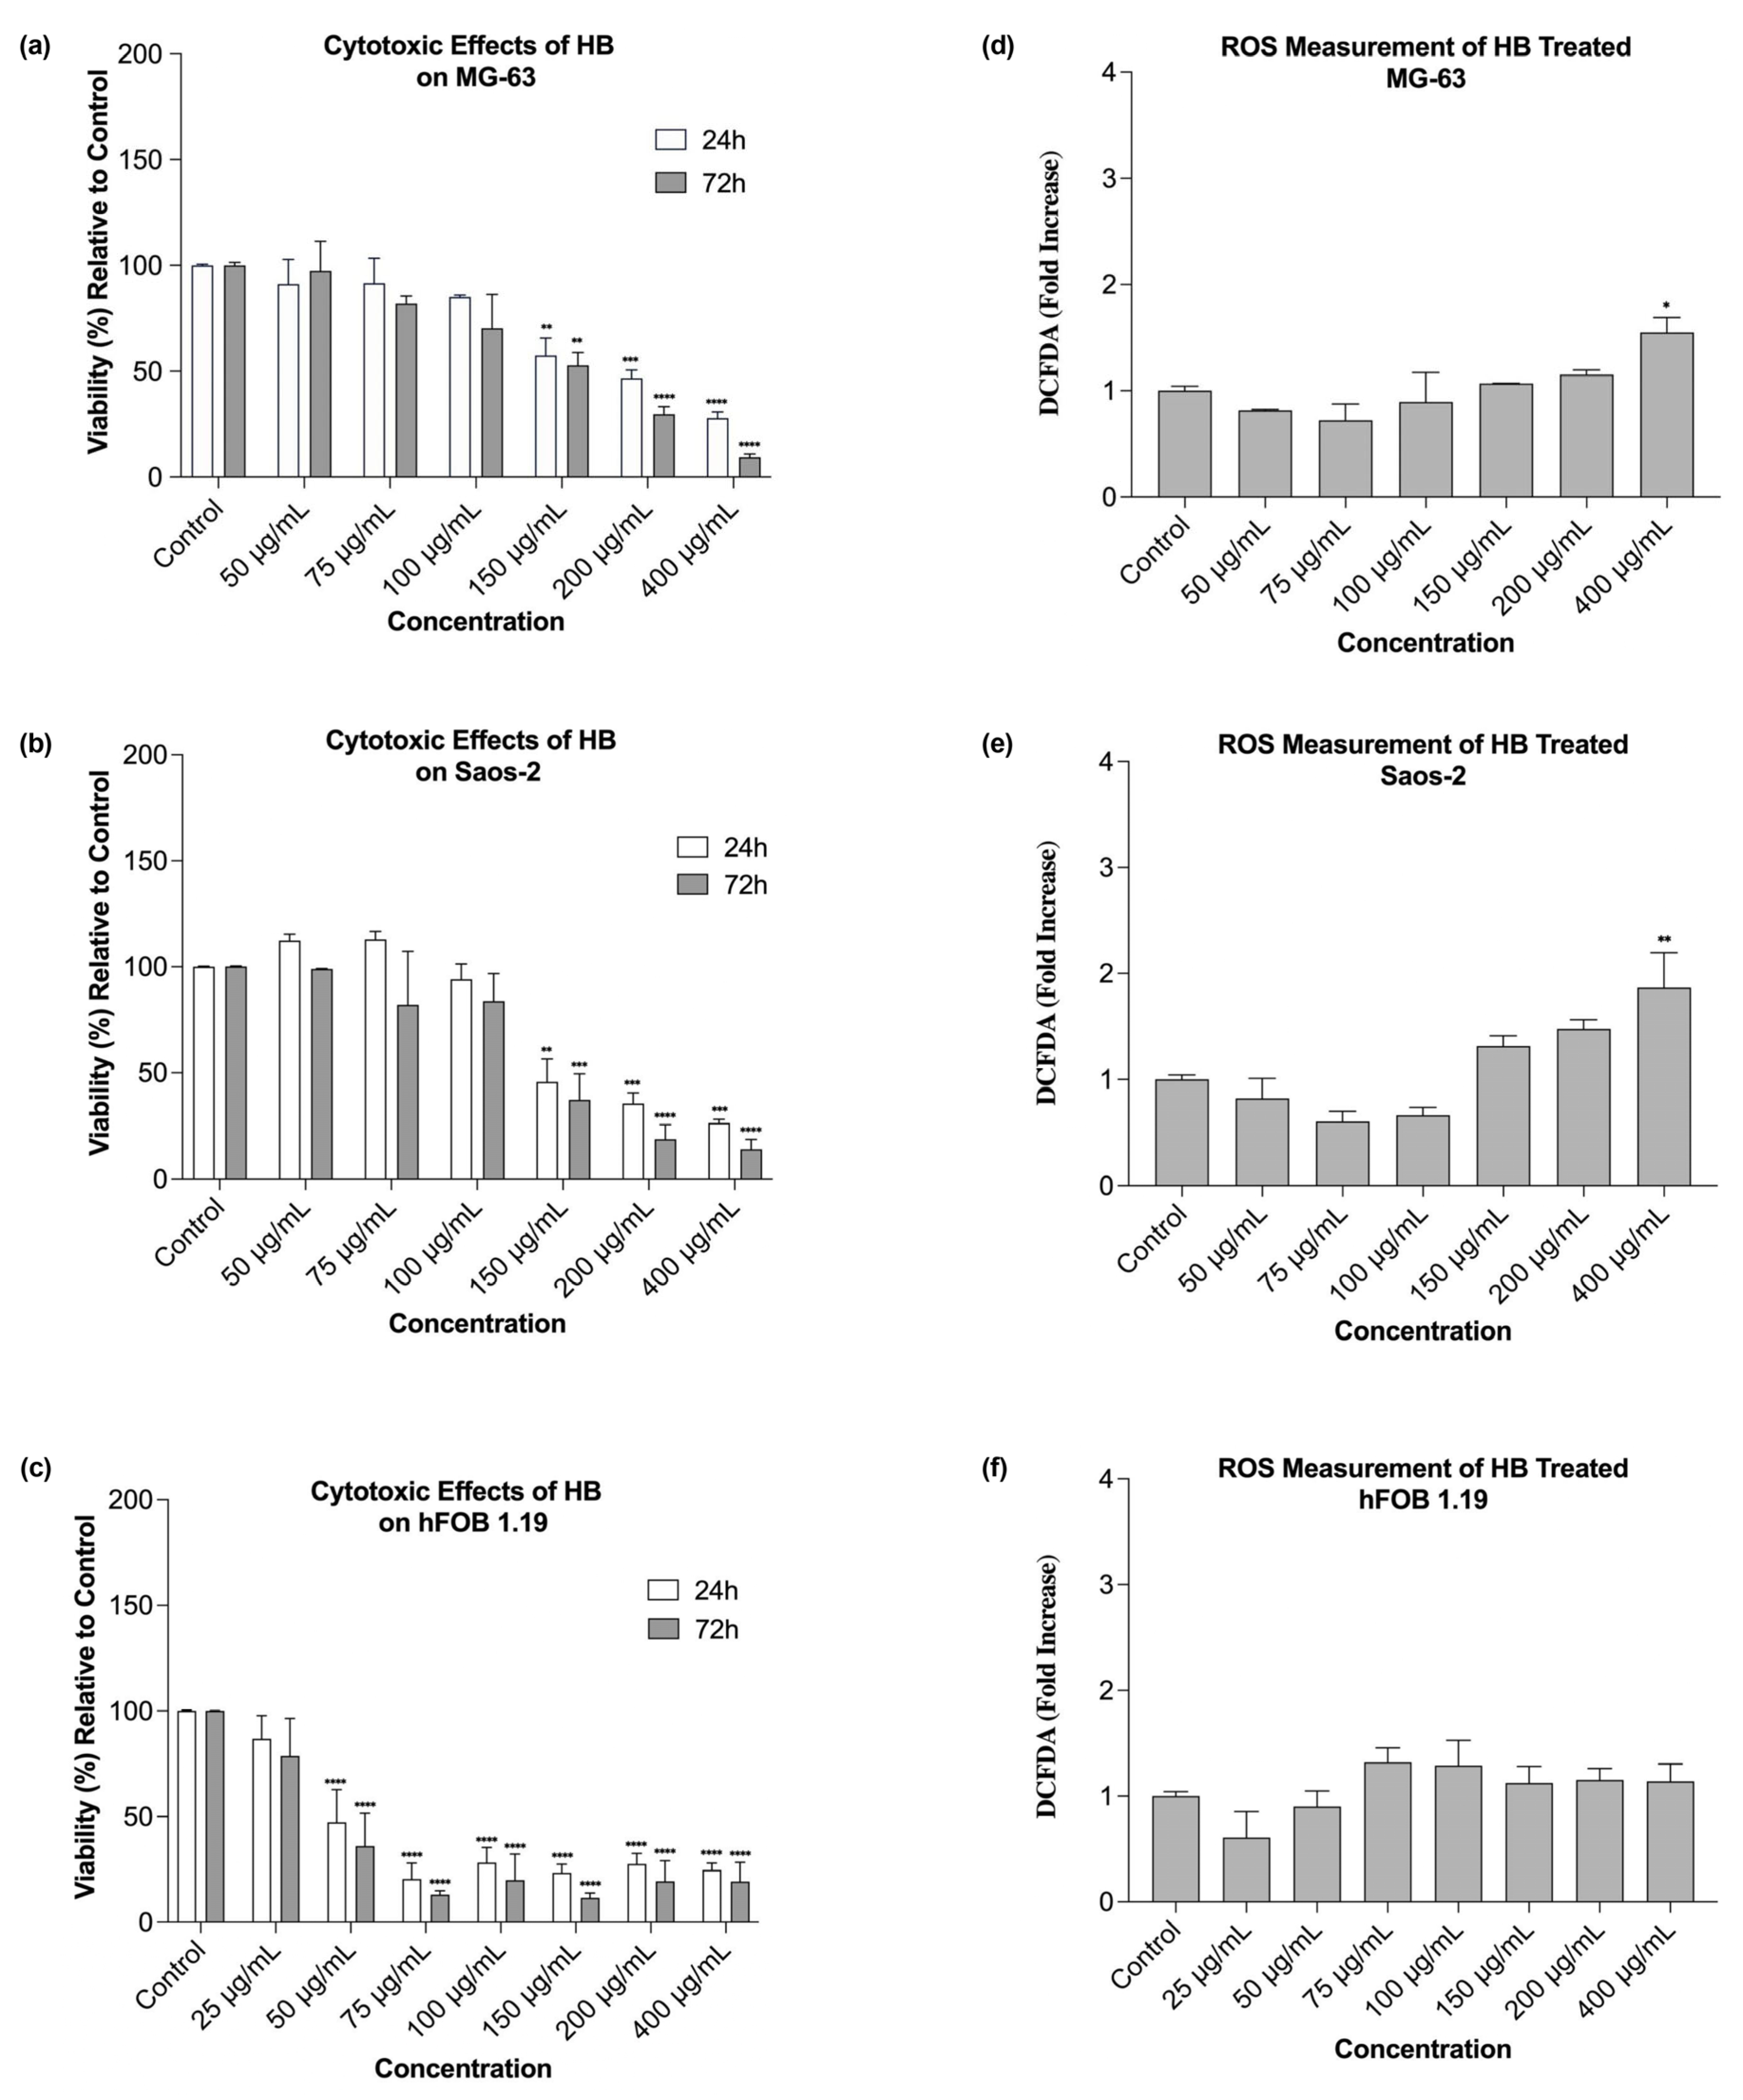
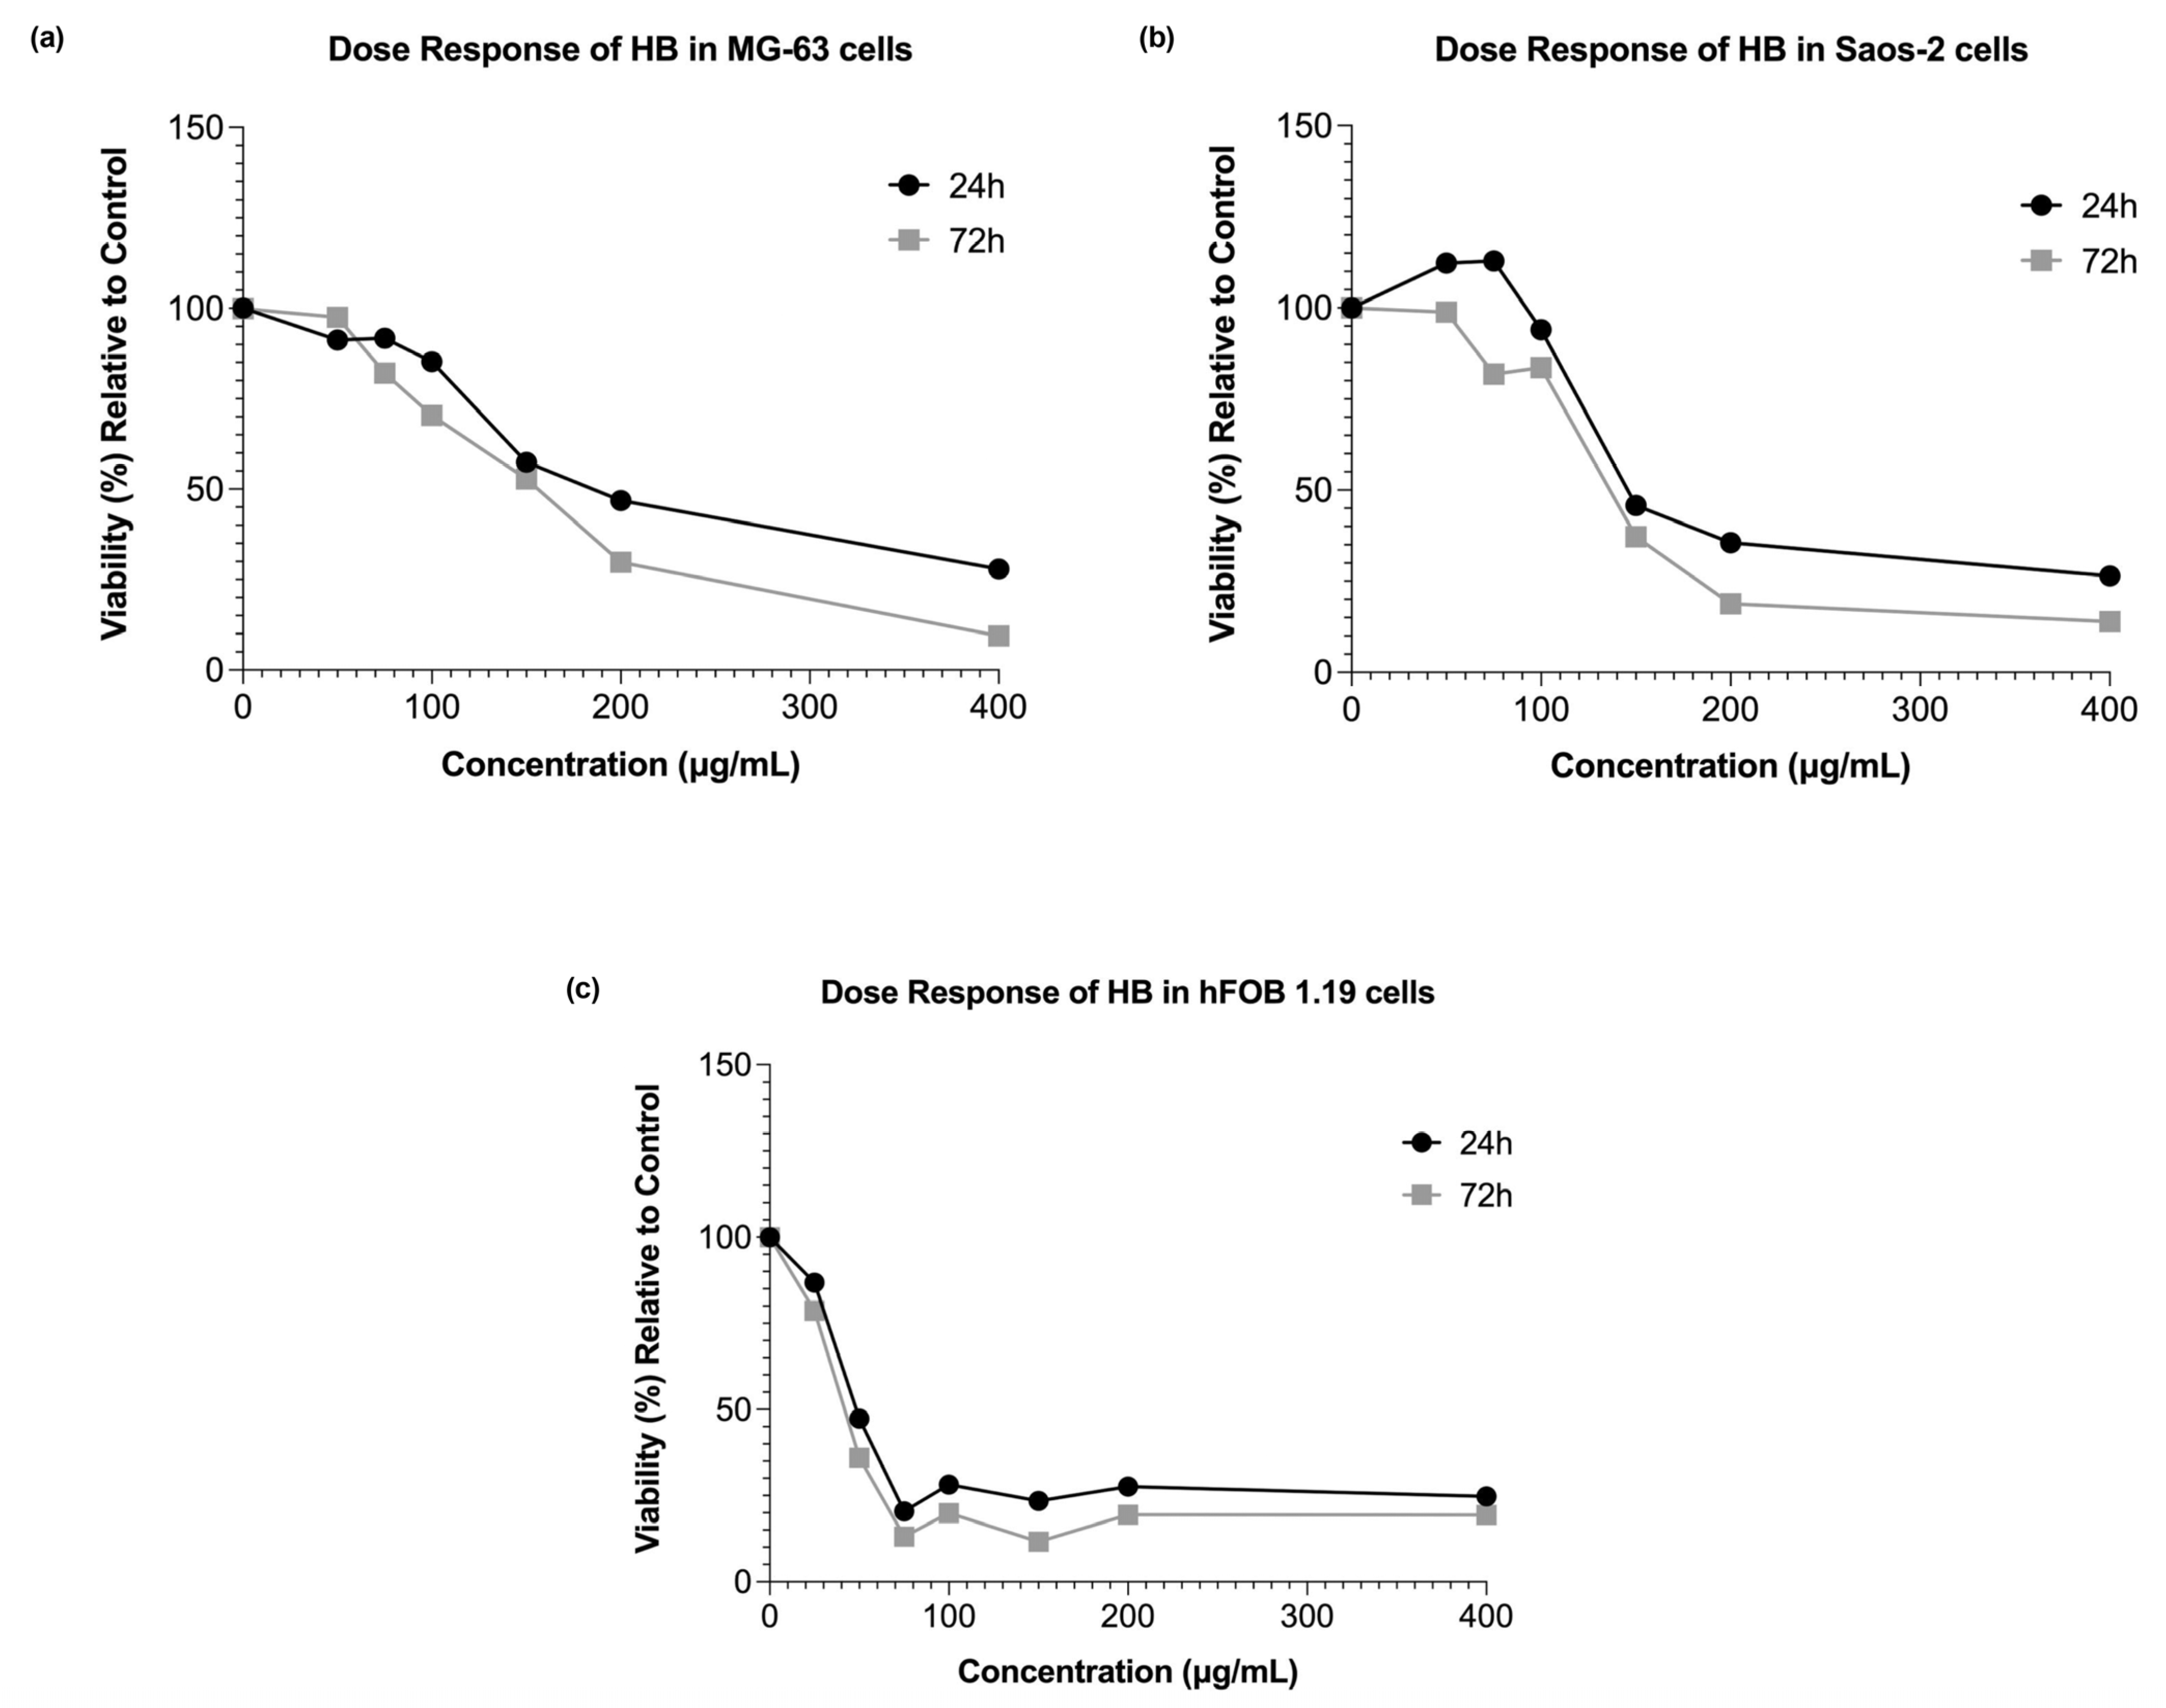
Our research showed that HB exerted dose- and time-dependent cytotoxic effects on both the MG-63 and Saos-2 osteosarcoma cell lines, which is in line with previous studies that established its pro-apoptotic and cytotoxic activities in hematological and solid malignancies [
19,
20,
21]. In particular, the observed reduction in cell viability at higher HB concentrations corroborates findings in UT-7 leukemia cells, where HB triggered apoptosis via caspase activation and the deregulation of pro-survival genes [
19,
20]. Similarly, Elez-Burnjakovic et al. reported HB-induced cytotoxicity and the modulation of autophagy in melanoma and bladder carcinoma cells, implicating oxidative stress and metabolic reprogramming as possible underlying mechanisms [
21,
22].
Interestingly, the lowest concentration of HB (50 µg/mL) resulted in a slight increase in viability at 72 h in the MG-63 cells, suggesting a possible low-dose-induced adaptive response or mild cellular stimulation. This dual effect has been described in other cancer models exposed to boron-based agents, where low doses may activate compensatory survival pathways [
30]. In contrast, the hFOB 1.19 cells exhibited a higher sensitivity to HB, with cytotoxicity apparent even at moderate concentrations. However, the response in this non-tumor line lacked a strict dose-dependent trend, indicating specific responses to HB, which may involve differences in the oxidative resilience, baseline metabolic activity, or other background mechanisms, which should be examined at the molecular level.
The cytotoxicity assessment of SD2 also revealed concentration- and cell-line-dependent responses across the osteosarcoma (MG-63 and Saos-2) and non-tumor osteoblastic (hFOB 1.19) cell models. Notably, the MG-63 cells demonstrated a biphasic, hormetic response, wherein a low concentration of SD2 (100 µg/mL) elicited a modest increase in viability at 24 h, suggesting the potential transient activation of survival pathways, followed by a pronounced reduction in viability at concentrations ≥ 250 µg/mL. This phenomenon is consistent with the hormetic behavior previously described for cerium oxide nanoparticles, wherein low-dose exposure activates cytoprotective antioxidant pathways, while higher concentrations shift the redox balance via Ce
3+/Ce
4+ cycling, generating reactive oxygen species (ROS) that lead to mitochondrial dysfunction and apoptosis [
31,
32].
In contrast, the Saos-2 cells exhibited a relatively chemoresistant phenotype, where they showed less severe viability reduction and partial recovery over 72 h. This attenuated response likely reflects cell-line-specific differences in basal oxidative status, nanoparticle uptake, and redox buffering capacity [
33]. Interestingly, the hFOB 1.19 line displayed the steepest early viability reduction (20–35% at 500–1000 µg/mL, 24 h), yet recovered to 60–70% by 72 h. Although the ROS levels were already suppressed below the control at all doses, the transient viability loss may stem from non-oxidative stresses, such as lysosomal overload or ionic imbalance. The rapid rebound concurs with SD2’s catalase/SOD-mimetic activity that continually scavenges ROS in normal osteoblasts, allowing metabolic adaptation once the acute nanoparticle burden is resolved [
34,
35,
36]. Mechanistically, the redox-switching property of cerium oxide is central to SD2’s biological effects. At lower concentrations, cerium oxide nanoparticles scavenge free radicals and reduce oxidative stress, whereas higher doses promote oxidative damage through ROS accumulation, triggering apoptosis via mitochondrial and caspase-mediated pathways [
35,
36]. The dextran coating of SD2 significantly influences these interactions, possibly by enhancing the colloidal stability, facilitating endocytosis, and modulating the nanoparticle’s intracellular fate through its specific branching configuration, which could alter the protein corona and cellular trafficking dynamics [
37]. This may explain the steeper cytotoxic thresholds observed with SD2 compared with other surface coatings, such as polyethylene glycol (PEG) or polyvinylpyrrolidone (PVP), which have been shown to mitigate cerium-oxide-nanoparticle-induced toxicity [
38].
Moreover, the observed intercellular heterogeneity in response to SD2 underscores the importance of considering tumor-specific oxidative metabolism and nanoparticle processing mechanisms. The heightened sensitivity of the MG-63 cells may reflect an increased nanoparticle uptake and a less competent antioxidant defense system, while the resilience of the hFOB 1.19 cells suggests efficient metabolic adaptation and the possible exploitation of cerium oxide nanoparticles’ catalytic scavenging over time [
39].
Overall, SD2 elicited a concentration-dependent cytotoxic response that was most pronounced in the MG-63 osteosarcoma cells, displayed moderate effects in the Saos-2, and caused only transient impairment in the non-tumor hFOB 1.19 cells. These findings, which are consistent with the redox-switching behavior of dextran-coated cerium oxide nanoparticles reported in the literature, underscore SD2’s potential as a selective nanotherapeutic for osteosarcoma, while highlighting the necessity for dose optimization and mechanistic validation.
The reactive oxygen species (ROS) generation profiles revealed that high HB concentrations significantly increased the oxidative stress in osteosarcoma cells. This supports the hypothesis that HB’s cytotoxicity is mediated, at least in part, by oxidative mechanisms, as previously demonstrated in UT-7 and GR-M cells, where HB altered the expression of redox- and apoptosis-related genes [
19,
20,
21]. Conversely, low HB concentrations reduced ROS production, suggesting a threshold effect or ROS scavenging at sub-cytotoxic levels. In the hFOB 1.19 cells, the ROS induction was modest and not statistically significant across most conditions, which possibly reflected stronger antioxidant defenses in non-malignant osteoblasts.
SD2 caused markedly divergent reactive oxygen species (ROS) responses that tracked both the dose and cellular context. In the MG-63 osteosarcoma cells, the intracellular ROS levels remained near the baseline at 100–250 µg/mL but surged to nearly three-fold above the control levels at 500–1000 µg/mL, which mirrored the steep viability decline observed at these concentrations. This response aligns with previous findings where cerium oxide nanoparticles induced oxidative-stress-mediated cytotoxicity through mitochondrial ROS production and apoptosis [
35,
40].
The Saos-2 cells exhibited an even more pronounced pro-oxidant profile, with significant ROS elevation already detectable at 100 µg/mL and a plateau observed around 250 µg/mL, suggesting earlier saturation of nanoparticle-induced oxidative stress [
39]. These differences likely stemmed from cell-line-specific variations in the basal redox state, nanoparticle internalization kinetics, and antioxidant capacity [
33,
34].
Strikingly, the hFOB 1.19 displayed a consistent reduction in ROS levels across all SD2 concentrations, with the DCFDA signals falling to nearly 30–40% of the control at 250–1000 µg/mL. This observation supports the proposed role of cerium oxide nanoparticles as potent ROS scavengers in normal cells, likely via catalase- and superoxide dismutase (SOD)-mimetic mechanisms that become prominent under physiological pH and normoxic conditions [
32,
36]. Collectively, these findings underscore SD2’s unique redox-modulatory properties, which are pro-oxidative in malignant osteosarcoma cells and antioxidative in non-transformed osteoblastic cells, thus supporting its potential utility as a context-sensitive nanotherapeutic agent in bone oncology [
24,
29].
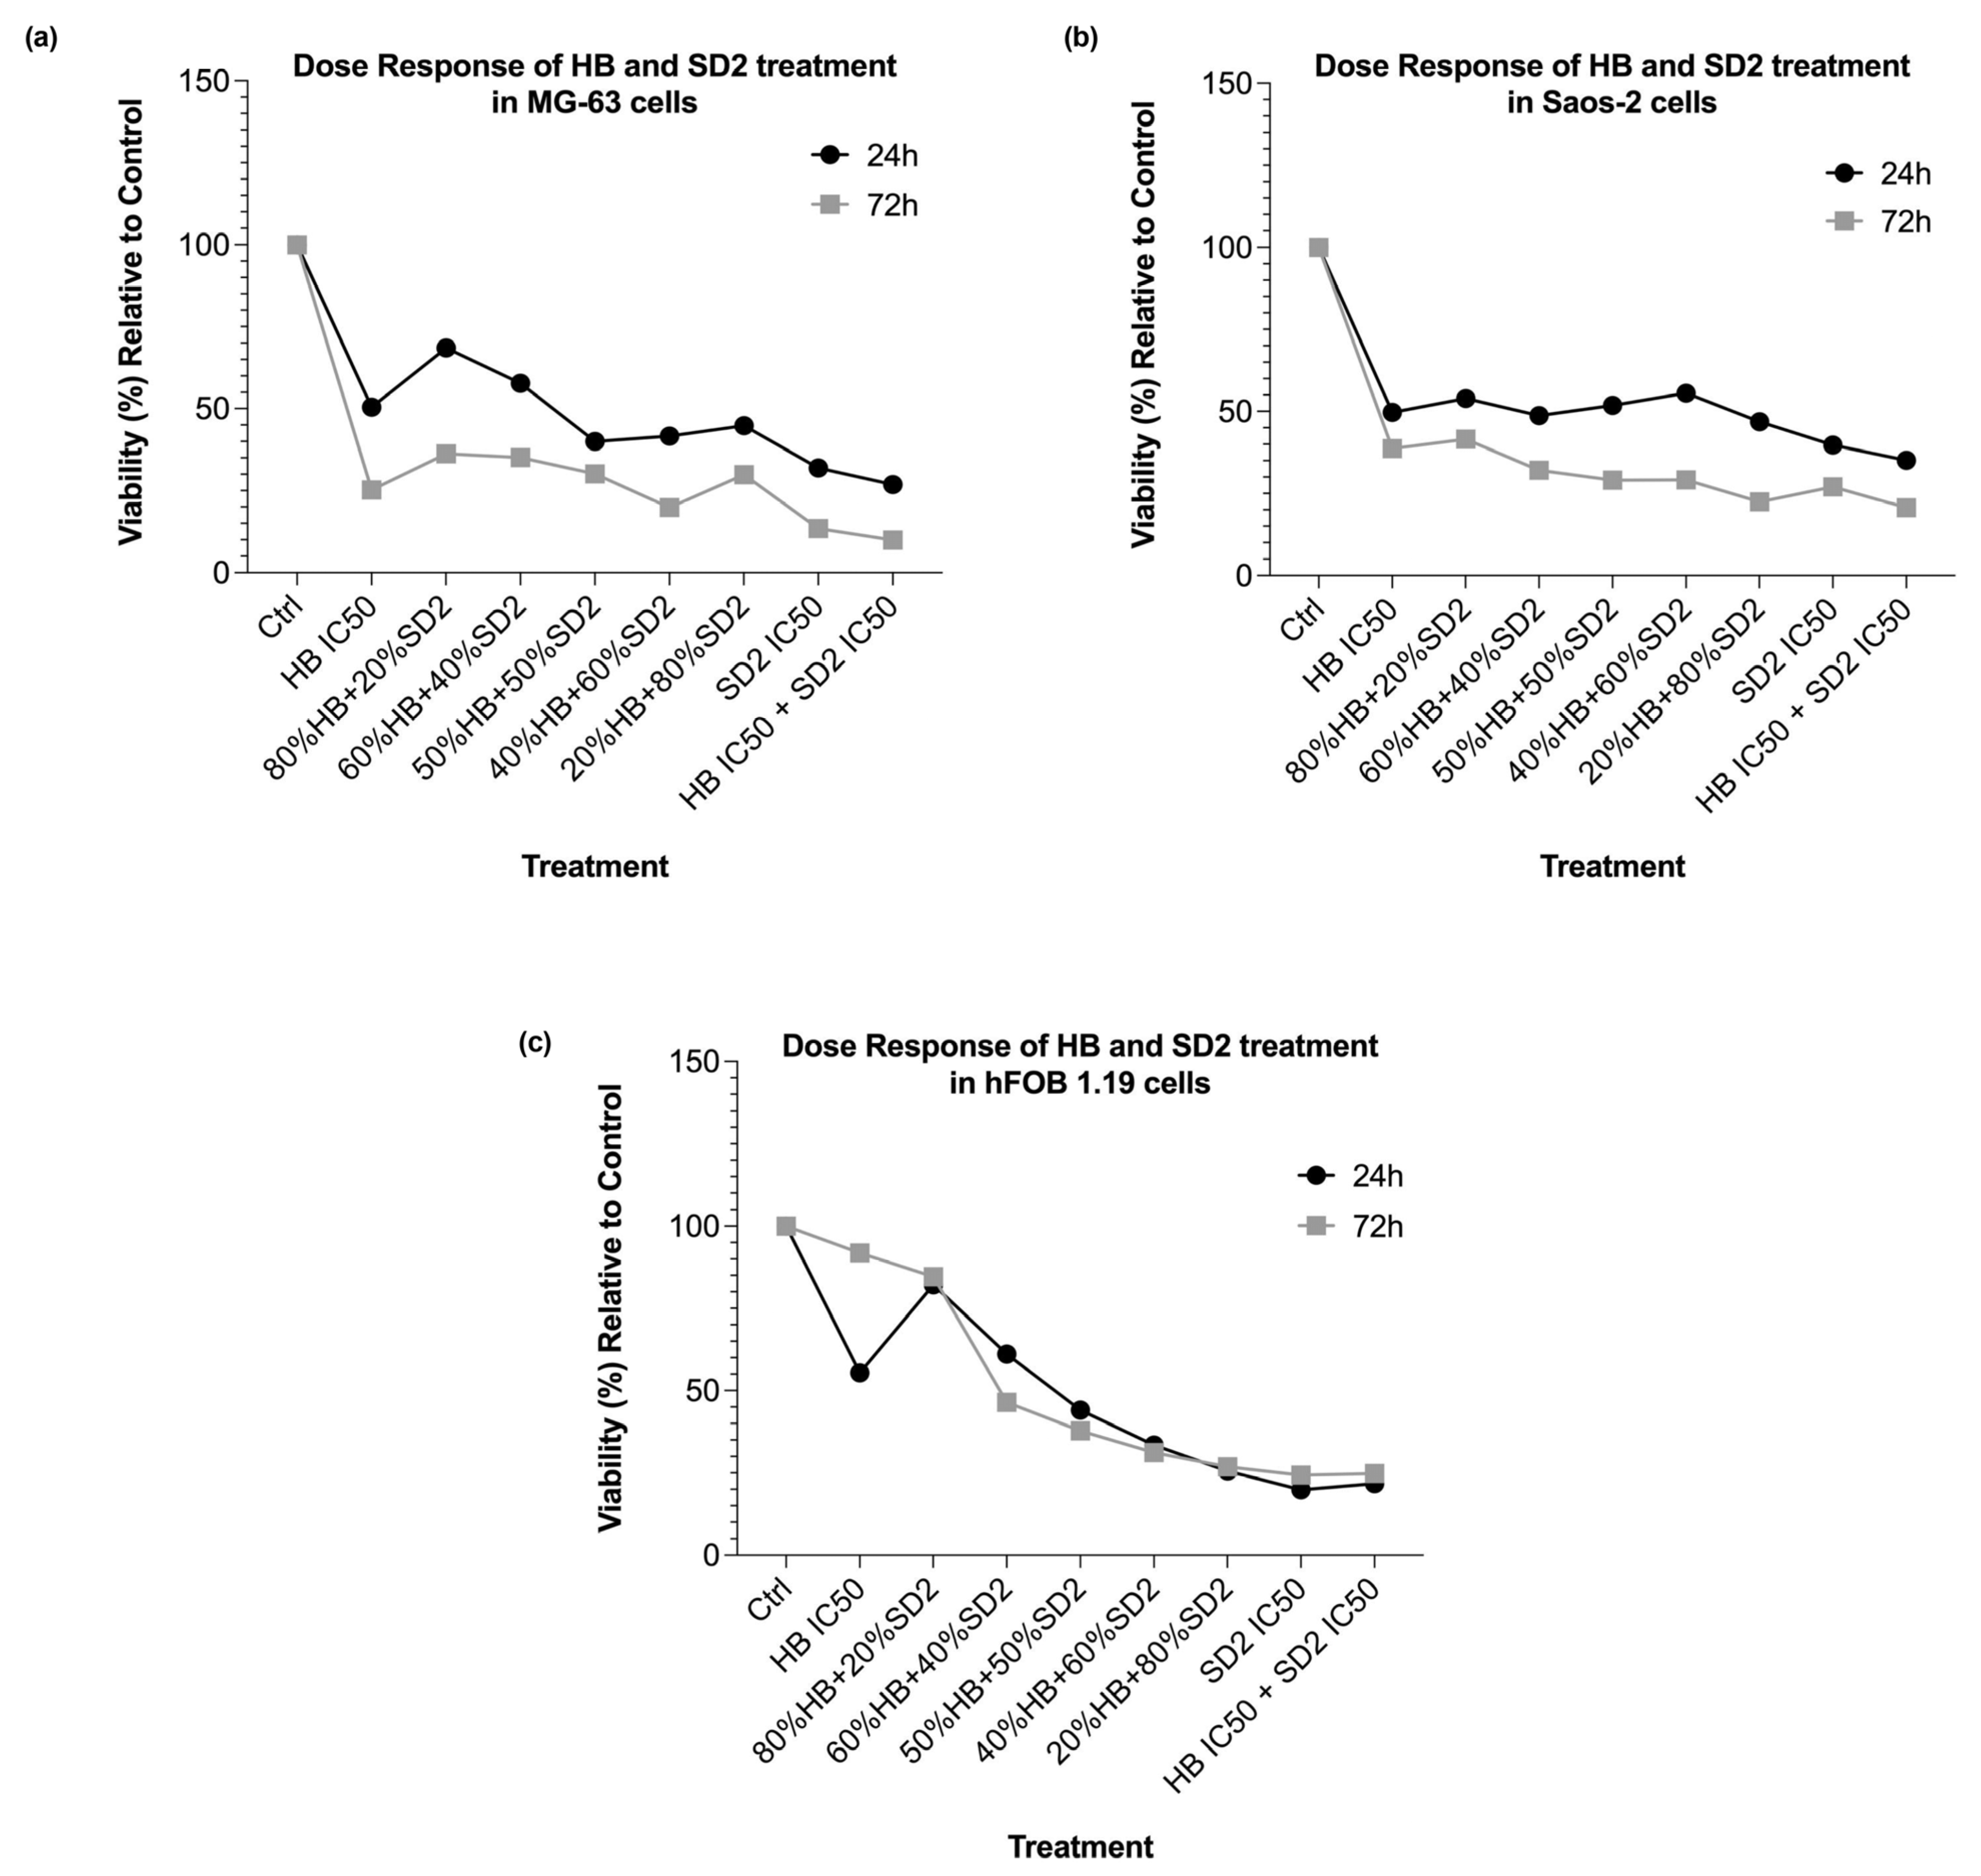
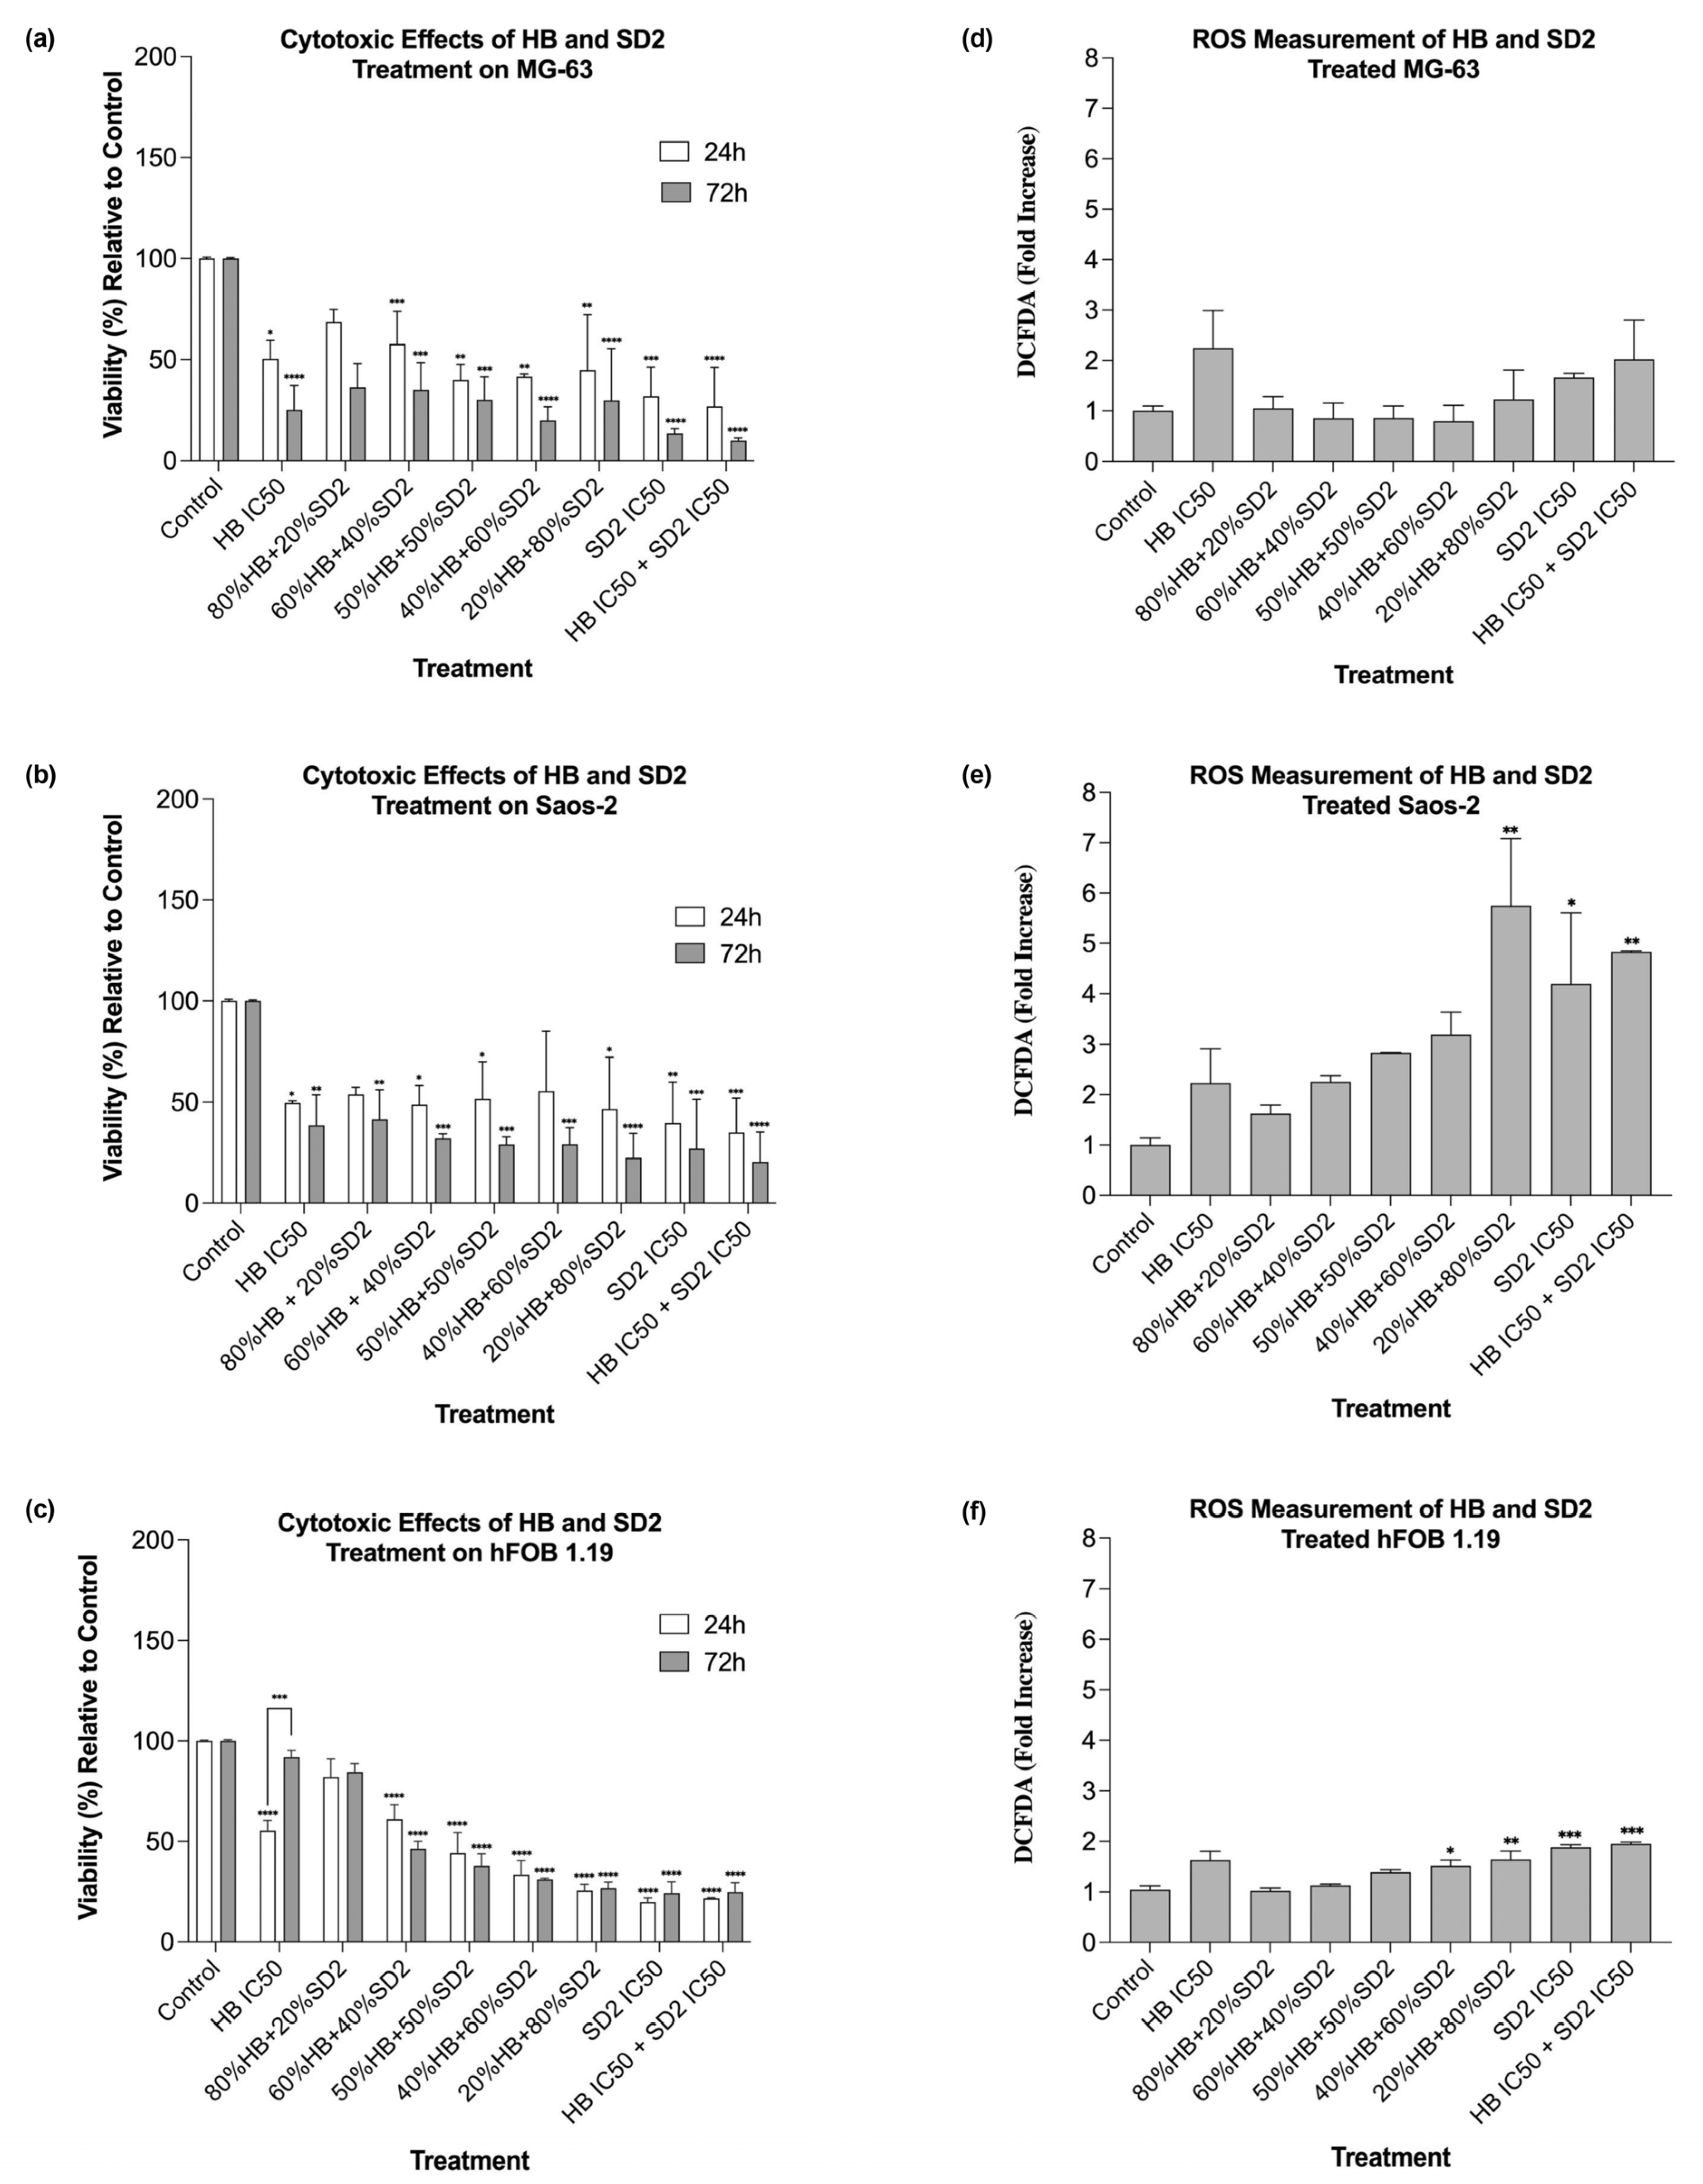
The co-treatment with HB and SD2 produced complex, concentration-ratio-dependent effects on the cell viability and oxidative stress. In the MG-63 and Saos-2 cells, most HB–SD2 combinations induced cytotoxicity, though some combinations (notably 80% HB + 20% SD2 and 60% HB + 40% SD2) were less effective than HB alone. These findings suggest potential antagonistic interactions at certain ratios, possibly due to the ROS-scavenging properties of cerium oxide nanoparticles (CeNPs), which can neutralize the oxidative effects of HB [
29]. In support of this, combined treatments in the MG-63 cells did not increase the ROS production, and in some cases, the ROS levels were lower than in untreated controls. These observations aligned with studies that have shown the dual redox nature of CeNPs, which can act as pro-oxidants in tumor microenvironments while protecting non-malignant cells from oxidative damage [
24,
29].
The Saos-2 cells responded to the co-treatment with elevated ROS levels, particularly for combinations rich in SD2. The increase in oxidative stress suggests that the balance between SD2’s redox activity and the intrinsic oxidative state of the Saos-2 cells may differ from that in the MG-63 cells, potentially reflecting metabolic or mitochondrial differences between the lines. Furthermore, the pronounced ROS response in the Saos-2 cells following the 20% HB + 80% SD2 treatment supports the notion that CeNPs can shift from antioxidative to oxidative behavior depending on the cellular context and nanoparticle dose [
29].
The behavior of the hFOB 1.19 cells under co-treatment conditions was notably different. While most combinations reduced the viability at 24 h, partial recovery was observed at 72 h. This suggests that the hFOB 1.19 cells may have engaged repair or adaptation mechanisms in response to early oxidative or cytotoxic stress, particularly when HB was present at lower ratios. Notably, the HB treatment at its IC50 concentrations alone also showed signs of reduced cytotoxicity over time in the hFOB 1.19 cells, indicating potential cellular resilience or activation of detoxification pathways that mitigate long-term damage. This recovery effect was not observed in the HB screening experiments; however, in those experiments, as mentioned before, the cells did not show a linear response to HB’s cytotoxic effect, implying that healthy osteoblasts show concentration-specific and potentially transient cellular responses, possibly representing a narrow threshold at which normal cells can engage protective mechanisms.
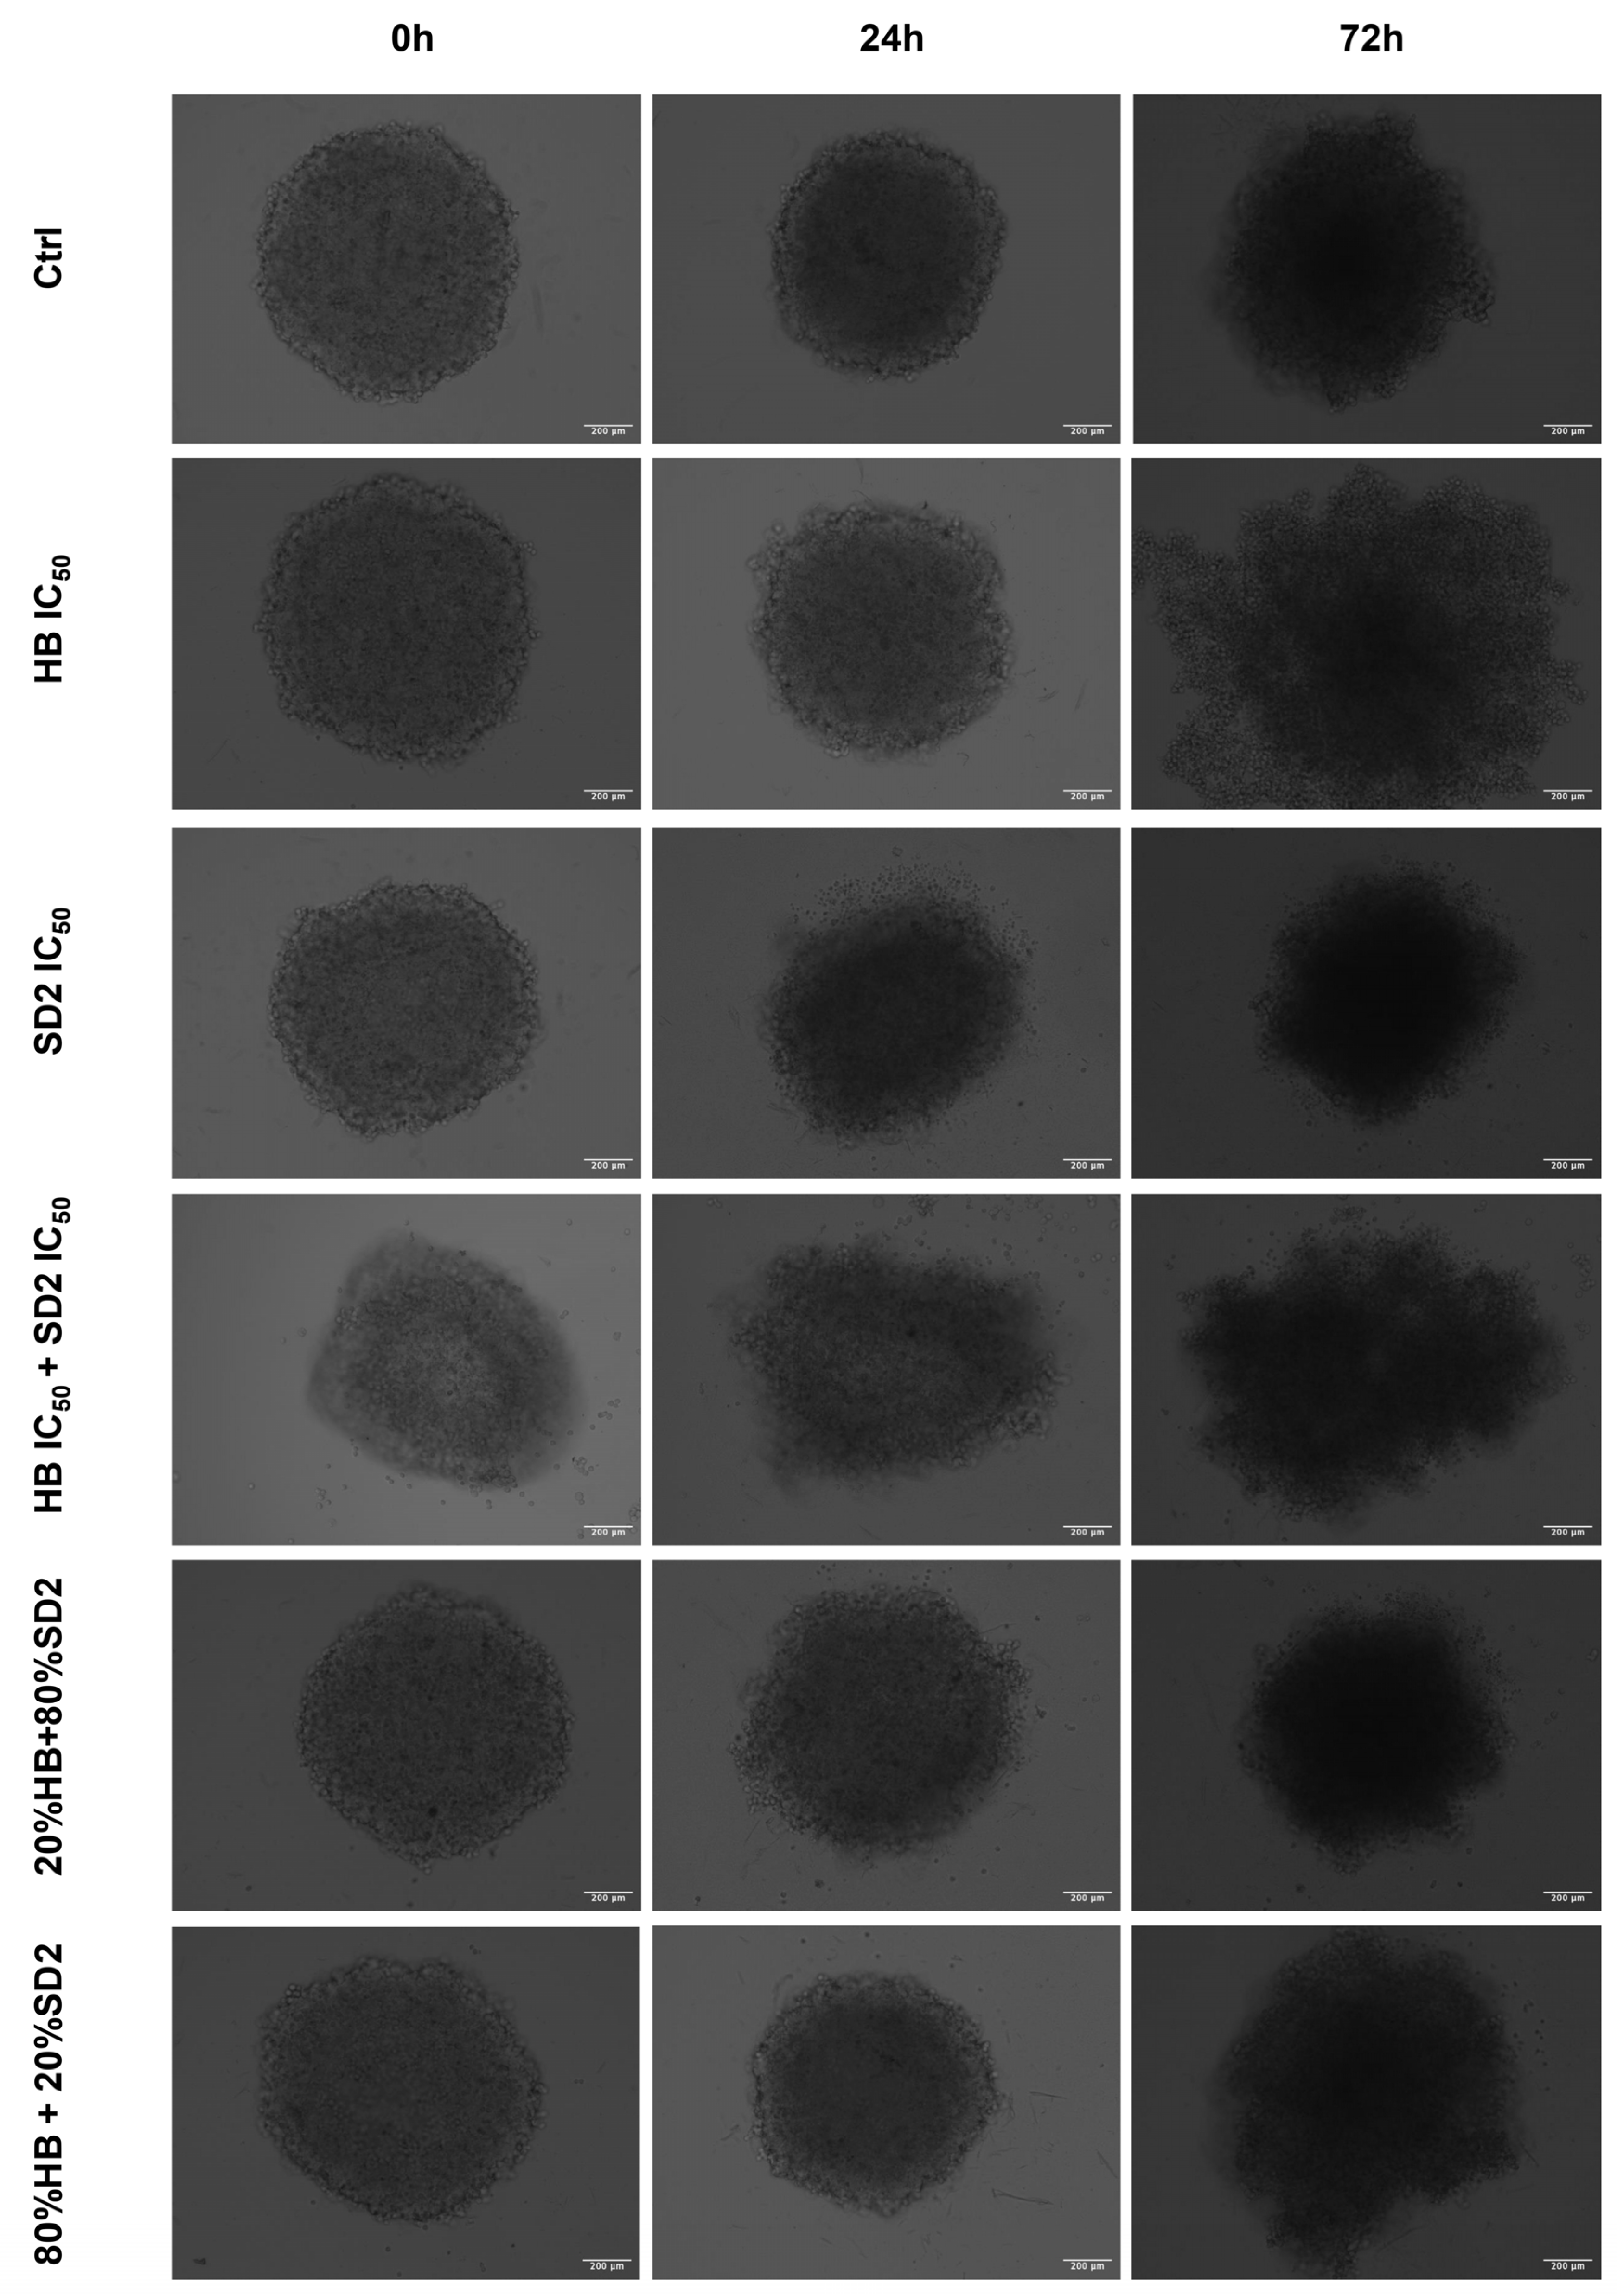
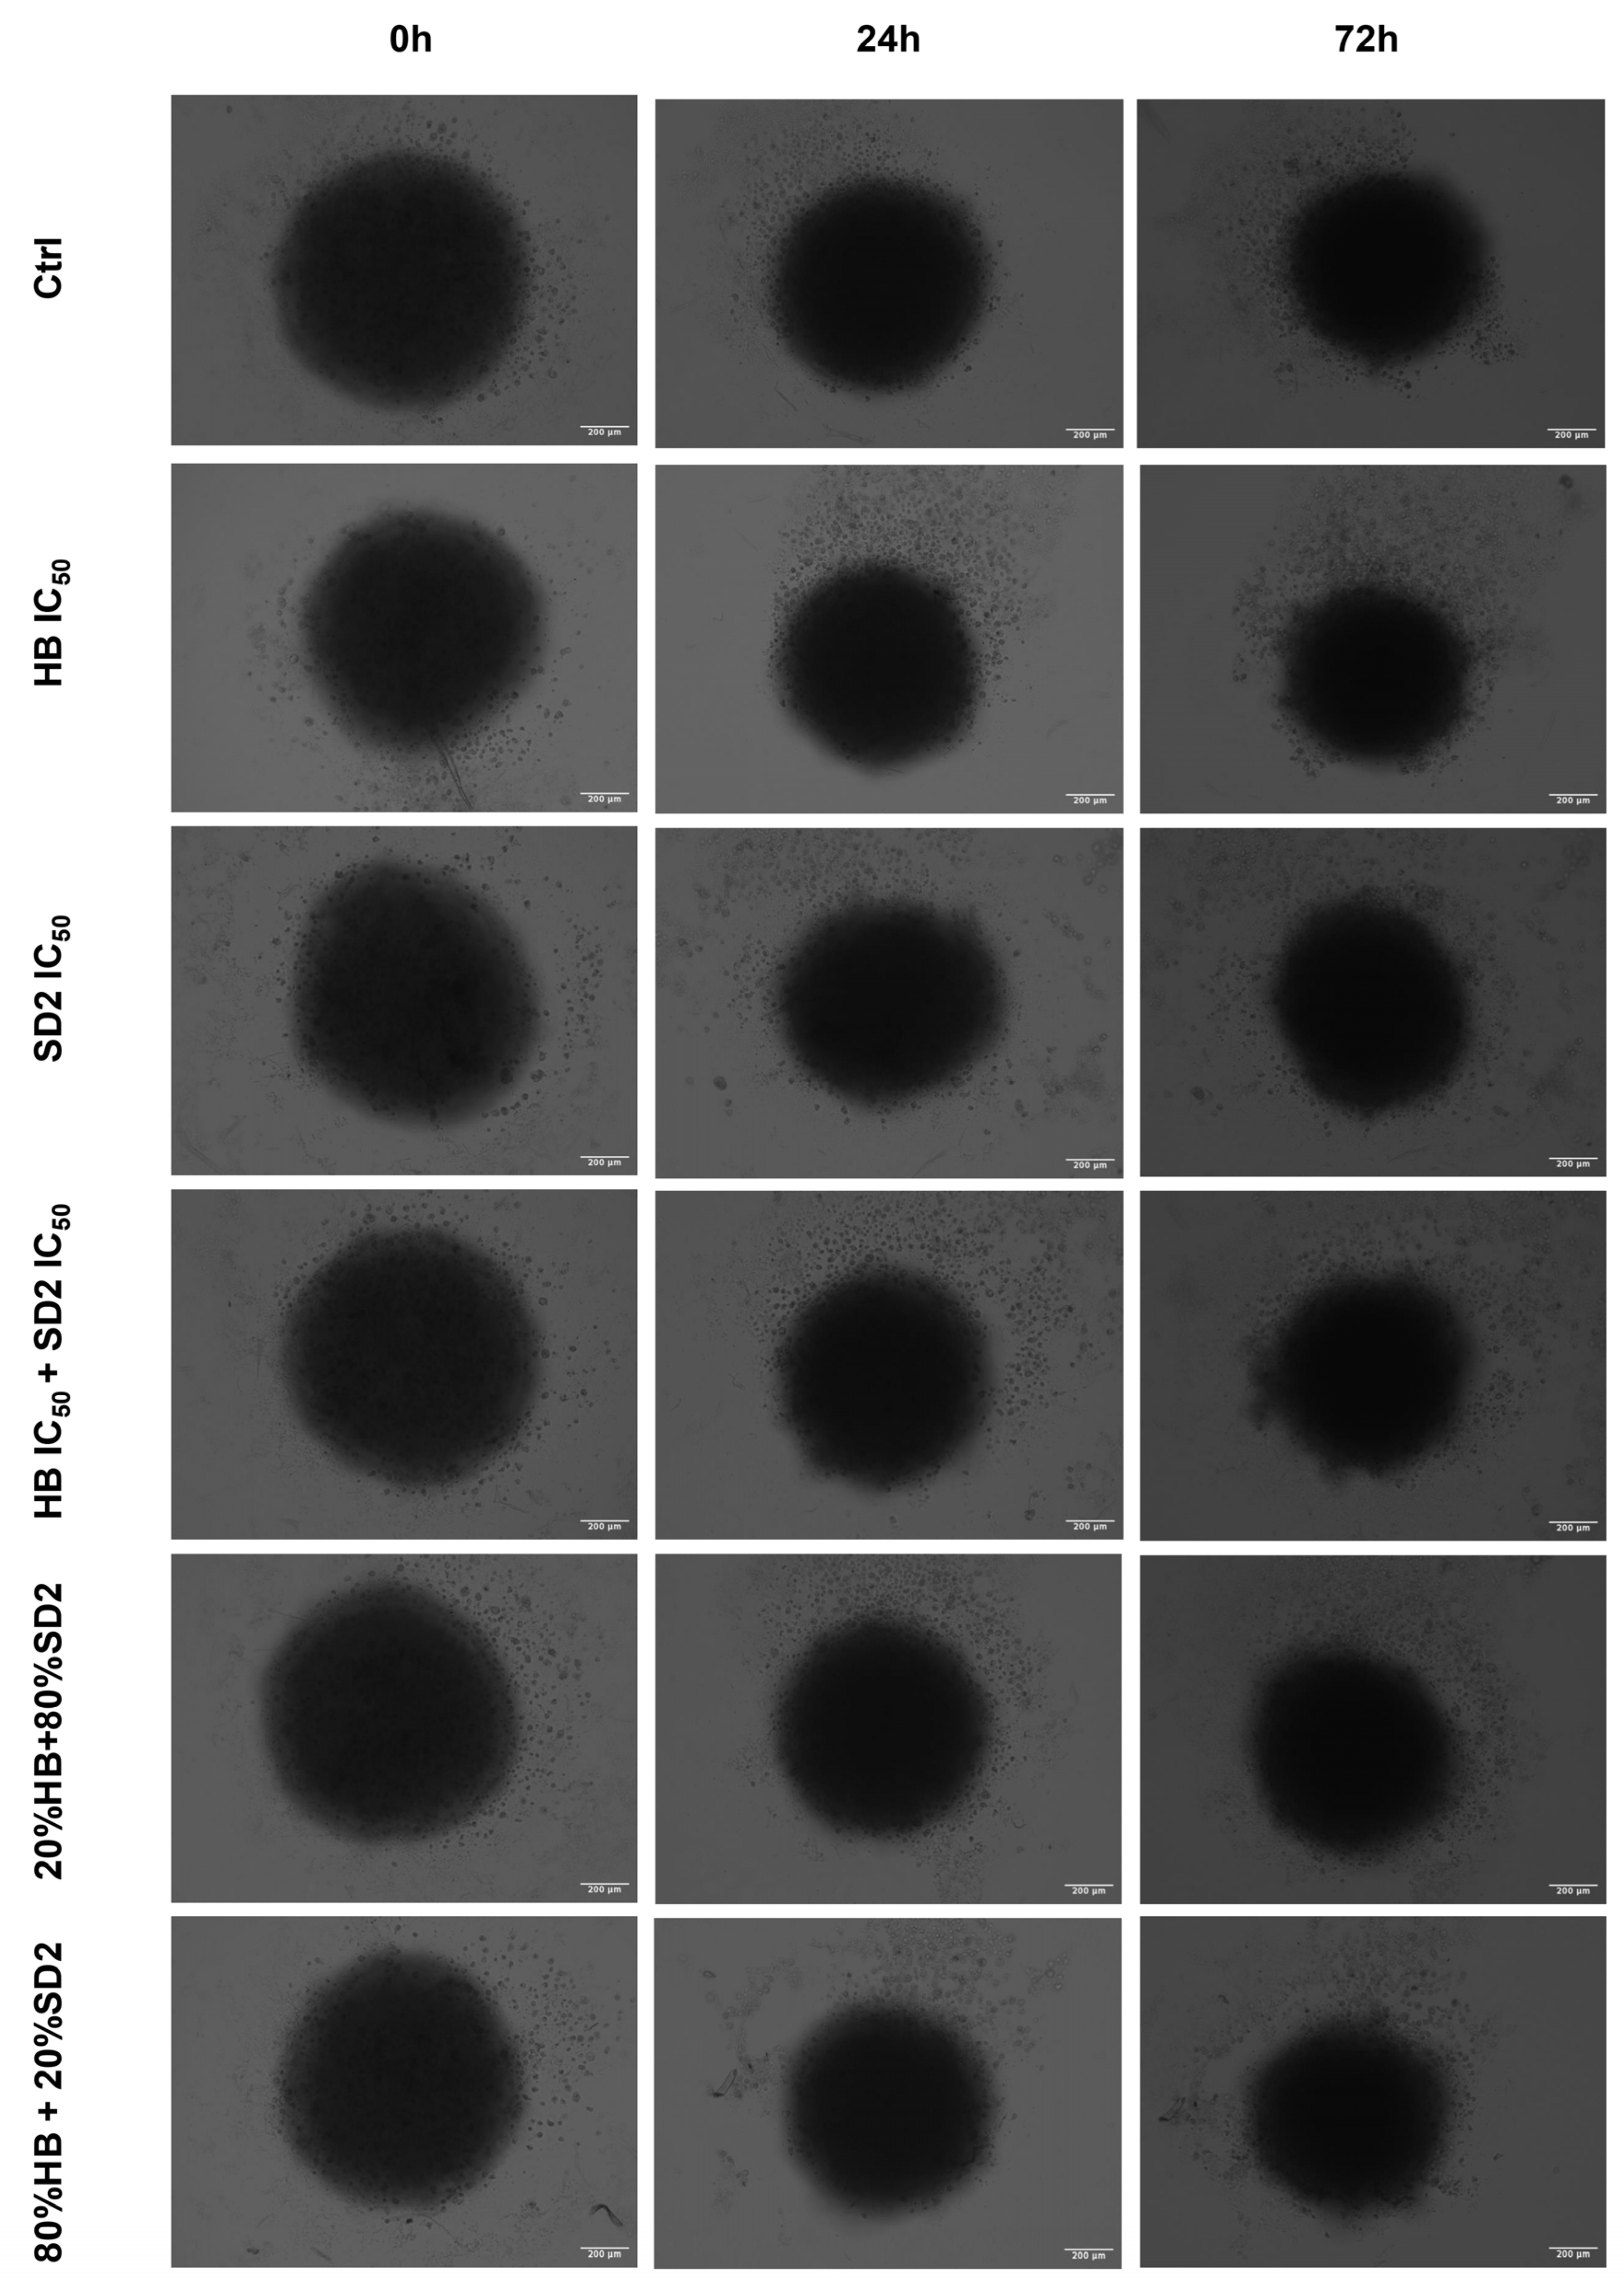
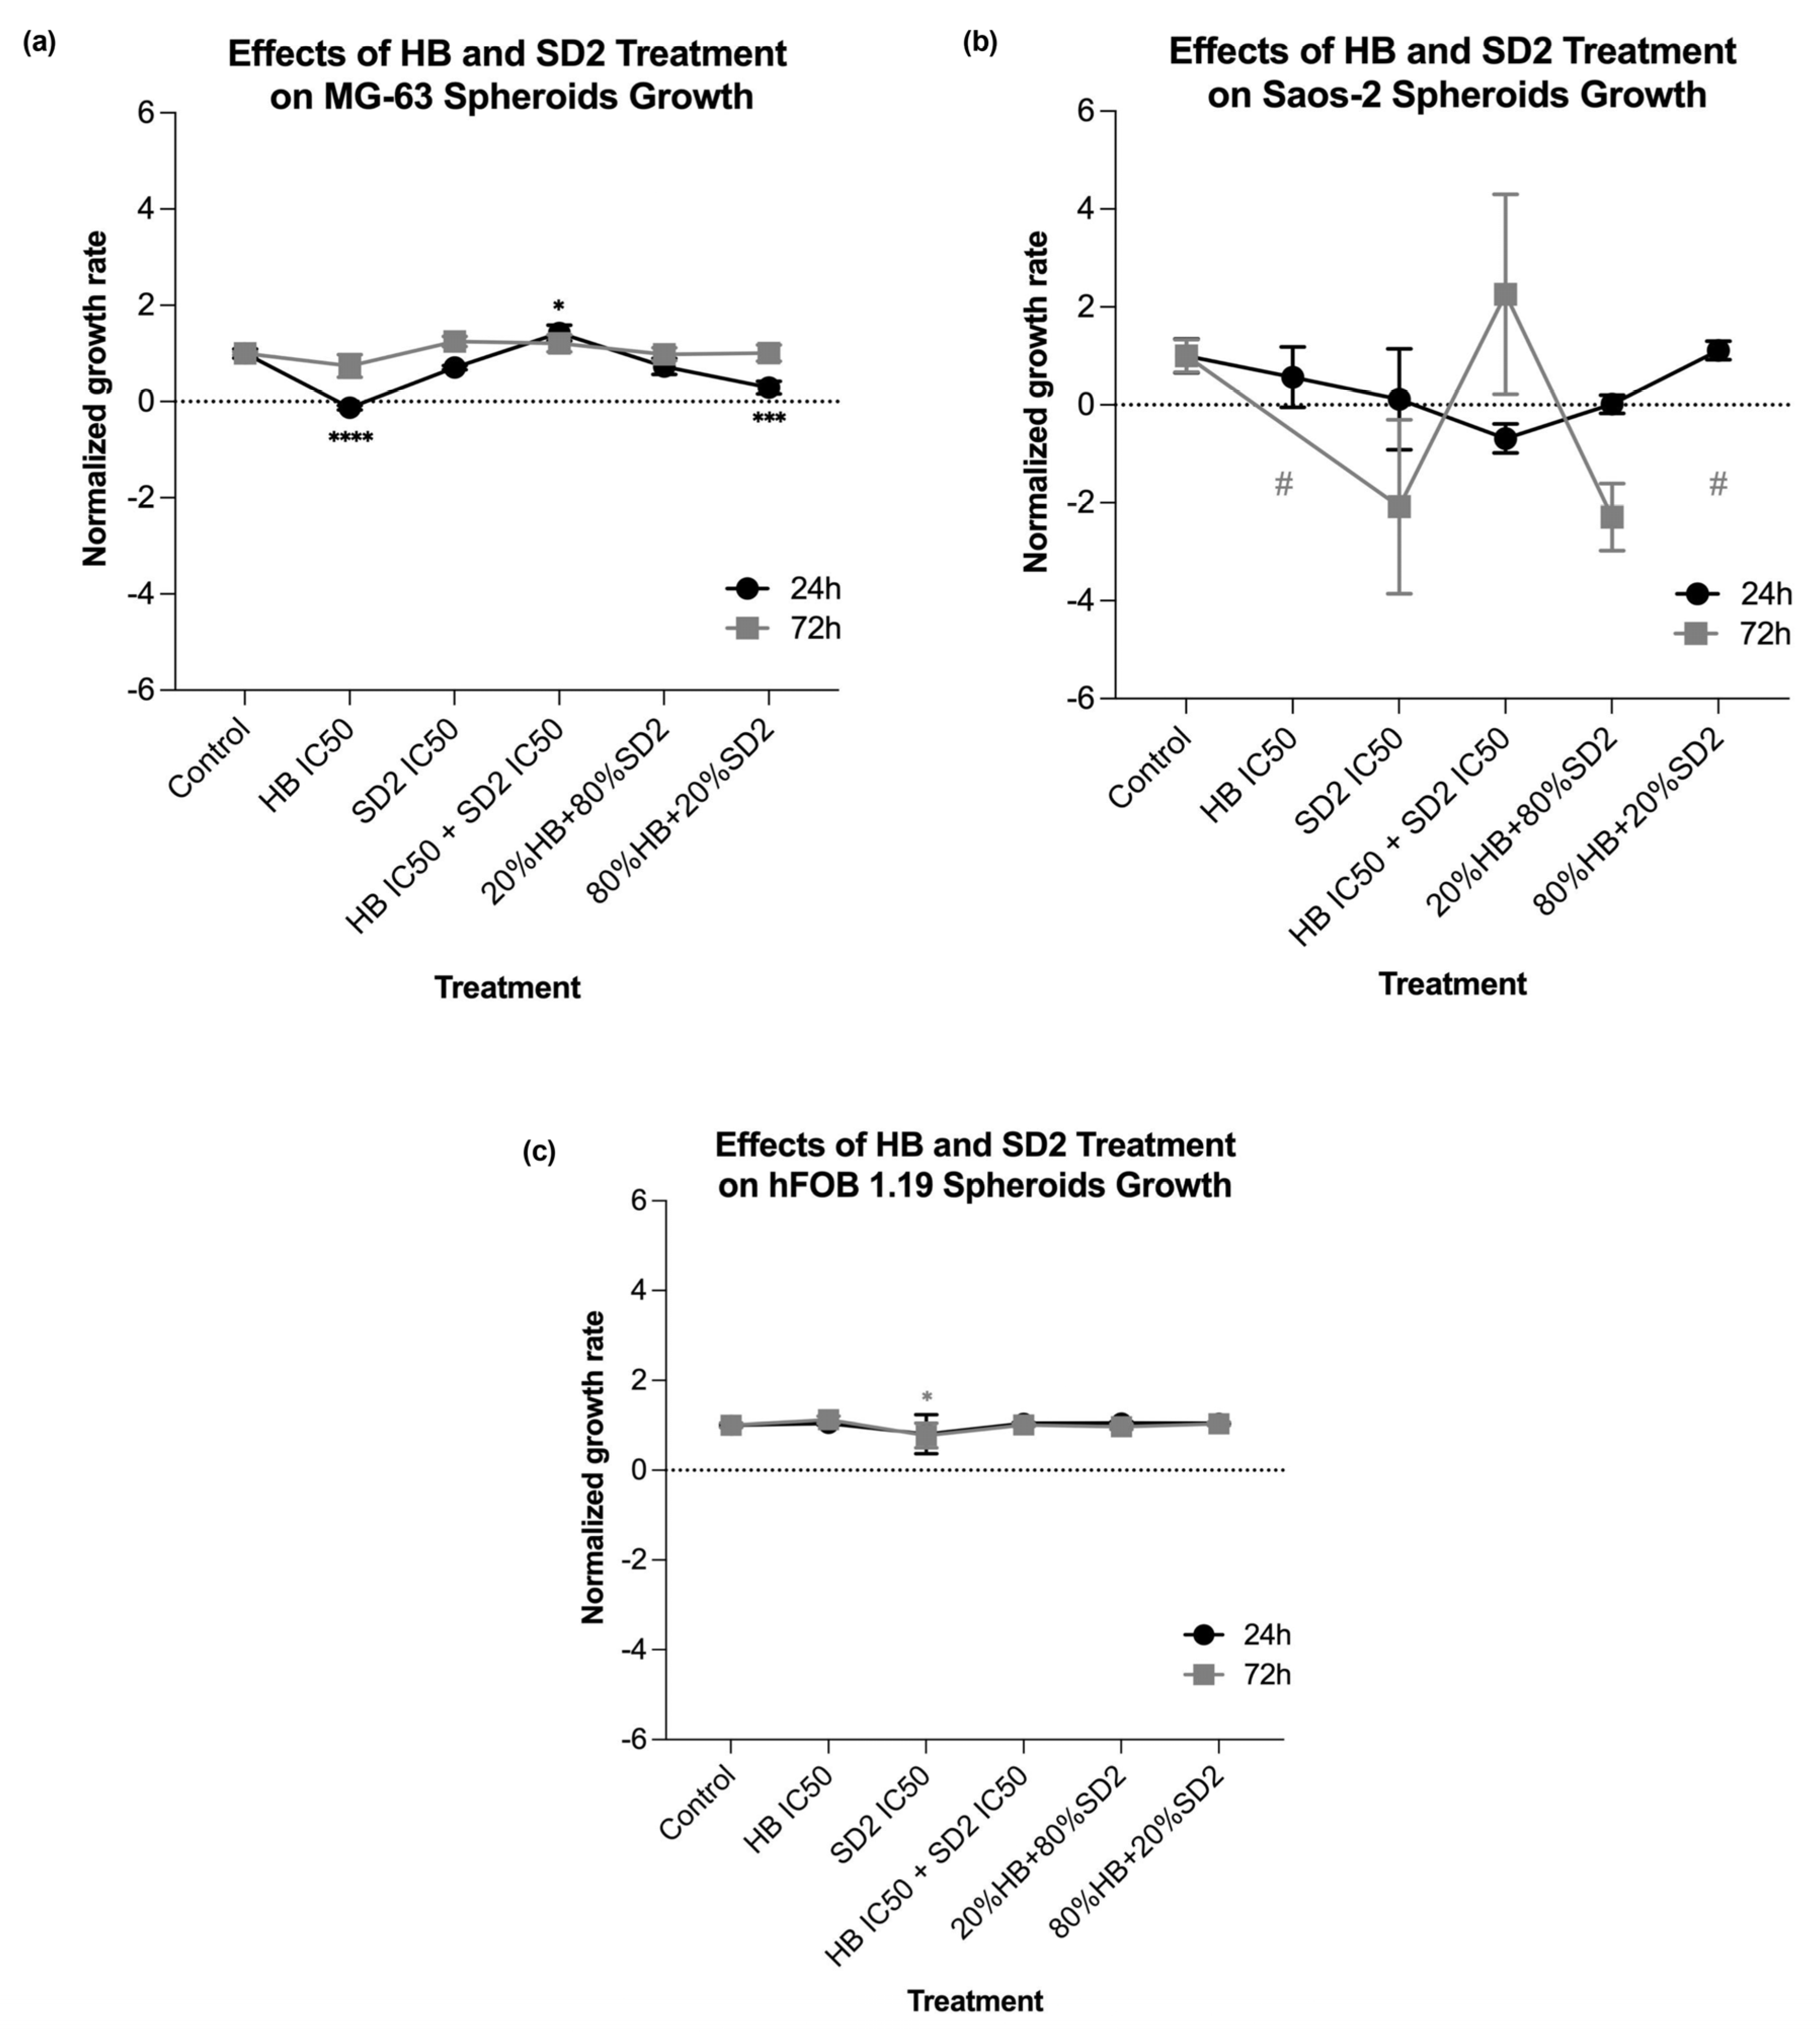
Our findings in the 3D cell cultures revealed differential spheroid responses to HB, SD2, and their combinations across the tested cell lines. In the MG-63 spheroids, both HB alone and the 80% HB + 20% SD2 combination significantly reduced the growth at 24 h, followed by signs of recovery by 72 h. Notably, the IC
50 combination paradoxically increased the growth at 24 h, which may indicate sub-lethal stress-induced proliferation or altered spheroid compactness, warranting further mechanistic investigation. Although the Saos-2 spheroid growth did not show statistically significant differences, the morphological indicators and normalized growth profiles suggested greater sensitivity to treatment, particularly with SD2 alone and the 20% HB + 80% SD2 combination. These treatments elicited a time-dependent decrease in the spheroid growth. The hFOB 1.19 spheroids demonstrated a remarkable resistance to all the treatments, with no significant changes in growth or morphology. This highlights and reconfirmed their relative robustness and corroborated the selective cytotoxicity of HB and SD2 toward malignant cells. Although the effects of HB in 3D culture systems have not yet been explored, its selective cytotoxicity has been extensively documented in 2D models [
18,
19,
20,
21,
22], and our findings in spheroids appear to corroborate this selectivity. Overall, our data emphasize the importance of evaluating spheroid dynamics over multiple time points and integrating both quantitative and qualitative endpoints to comprehensively assess the therapeutic efficacy in 3D models.
4. Materials and Methods
4.1. Synthesis and Preparation of Halogenated Boroxine K2(B3O3F4OH) (HB) and Dextran-Coated Cerium Oxide Nanoparticles (Dex-CeNPs)
HB is a white powder that is soluble in water (7.1% at 20 °C), ethanol, and DMSO. It was synthesized according to a previously described protocol with the slight modification [
41]. The stock solutions were prepared by dissolving 20 mg of K
2(B
3O
3F
4OH) in 1 mL of 1× PBS, and the final concentrations of the solutions to be tested were made in the cell culture medium.
The synthesis of dextran-coated cerium oxide nanoparticles (Dex-CeNPs), here labeled as SD2, was carried out according to the protocol published by Tarakci et al., 2025 [
29]. In that study, the protocol was well optimized, and a detailed physicochemical characterization was conducted. Based on this, in the present study, cerium oxide nanoparticles coated with dextran from
Leuconostoc spp. (Sigma, Cat# 31388, mol wt: ~6 kDa) (SD2) were used [
29]. For each newly synthesized SD2 sample, basic characterization was once again performed, the concentration was determined, and solutions of a defined concentration were prepared in the cell culture medium for testing (
Supplementary Figure S1).
4.2. Cell Lines and Cell Culture Maintenance
Two osteosarcoma cell lines—MG-63 (CRL-1427) and Saos-2 (HTB-85)—and one osteoblast cell line—hFOB 1.19 (CRL-3602)—were obtained from the American Type Culture Collection (ATCC, Manassas, VA, USA). The MG-63 cells were cultured in Eagle’s Minimum Essential Medium (Sigma-Aldrich, Saint Louis, MO, USA), the Saos-2 cells were cultured in McCoy’s 5a Medium Modified (Sigma-Aldrich), and the hFOB 1.19 cells were maintained in Dulbecco’s Modified Eagle’s Medium/Nutrient Mixture F-12 Ham (Sigma-Aldrich). All cell media were supplemented with 10% fetal bovine serum (FBS, Belize City, Belize) and 1% penicillin–streptomycin, and were incubated in a humidified atmosphere of 5% CO2 in air and at a temperature of 37 °C. All were also tested on mycoplasma periodically using MycoAlert test (Lonza, Walkersville, MD, USA). The cell line identity was confirmed using PowerPlex® Fusion System (Promega, Madison, WI, USA) and STR profiles available in the ATCC database.
4.3. HB Treatments
The experiments were carried out in 96-well microtiter plates, with 5000 cells seeded per well. After 24 h, the cell cultures were treated with HB at final concentrations of 50, 75, 100, 150, 200, and 400 µg/mL. Due to the different sensitivity, the hFOB 1.19 cells were additionally treated with HB at a final concentration of 25 µL/mL. Each treatment was carried out in triplicate and experiments were repeated at least twice. Untreated cells were used as controls. The cell viabilities of the MG-63, Saos-2, and hFOB 1.19 cells cultured in the presence of HB were calculated as a percentage of the control cells, and the half-maximal inhibitory concentration (IC50) values were obtained from the dose–response curves plotted for the results obtained after 24 h.
4.4. SD2 Treatments
To evaluate the effects of SD2, the MG-63, Saos-2, and hFOB 1.19 cells were also seeded at a density of 5000 cells per well in 96-well plates. Following a 24 h incubation period, the cells were exposed to SD2 at concentrations of 100, 250, 500, and 1000 µg/mL. All treatments were performed in triplicate and independently repeated at least three times to ensure reproducibility. Untreated cells served as negative controls. The cell viability was assessed relative to the control group, as in the HB screening experiments, and the dose–response curves were generated to determine the IC50 values for each cell line 24 h post-treatment.
4.5. HB and SD2 Co-Treatments
The IC50 values obtained from the single-drug cell viability/cytotoxicity assays were used to design subsequent drug combination experiments for each particular cell type. The following combined/synergistic treatment ratios were defined: 0.8-, 0.6-, 0.5-, 0.4-, and 0.2-fold of the HB IC50 with 0.2-, 0.4-, 0.5-, 0.6-, and 0.8-fold of the SD2 IC50, respectively. In addition, a combination of both compounds’ IC50 concentrations was tested. All treatments were performed in triplicate, with at least three independent experimental replicates.
4.6. Cytotoxicity Assay
The cytotoxic activity was determined using the WST-1 assay and it was performed at two time points: at day 1 (24 h after treatment) and day 3 (72 h after treatment). Upon the incubation of 24 h and 72 h after the treatments of cells, the medium containing the treatments was removed from each well, and 100 μL of a WST-1 reagent (1:10 ratio with cell culture medium) was added to each well and incubated for 2 h. At the end of the incubation, a color change from pink to light brown was observed, and the absorbances of each well were measured at 450 nm and 650 nm using a BioTek Cytation 5 Cell imaging multimode reader. The viability/cytotoxicity percentages were counted, and graphs were plotted by normalizing the data against the untreated control groups.
4.7. Reactive Oxygen Species (ROS) Detection
To assess the reactive oxygen species (ROS), a 2′, 7′- dichlorofluorescein diacetate (DCFDA) assay was used. The ROS levels were measured simultaneously with each cytotoxicity 24 h post-treatment, with the same treatments and controls (untreated cells) applied.
After the end of the incubation period of 24 h, the medium with treatments was removed, and each well was washed twice with 1× PBS. The remaining cells were then incubated with 10 µM DCFDA in the dark for 45 min at 37 °C in a 5% CO2. Following the incubation, the fluorescence intensity was measured in the 485 nm/535 nm range using a BioTek Cytation 5 Cell imaging multi-mode reader. The ROS-related fluorescence intensity fold changes were calculated and normalized based on the cell viability data.
4.8. Flow Cytometry Analysis
The flow cytometry analysis was performed to evaluate the cell viability using the APC Annexin V Apoptosis Detection Kit with PI (BioLegend) specifically designed for the identification of healthy, apoptotic, and necrotic cells. Based on the staining patterns, the cells were classified as follows: healthy—Annexin-V−/PI−, early apoptotic—Annexin-V+/PI−, late apoptotic—Annexin-V+/PI+, and necrotic—Annexin-V−/PI+.
To perform the flow cytometry, 300,000 cells per well were seeded in a 6-well plate and incubated for 24 h. Following the incubation, each cell line was treated with HB at its IC50 concentration and SD2 at its IC50 concentration. Additionally, selected combination treatments were applied: 0.2- and 0.8-fold of the HB IC50 concentration with 0.8- and 0.2-fold of the nanoceria IC50 concentration, respectively. Also, a combination of both compounds at their IC50 concentrations was tested. The untreated cells served as a control.
After 24 or 72 h of treatment, the medium was removed, and the cells were washed with 1× PBS. Following the manufacturer’s instructions, the cells were additionally washed, resuspended in Annexin Buffer and stained with Annexin V and PI at a 1:2 ratio, with the volume adjusted based on the cell count. The samples were then incubated for 15 min in the dark at room temperature, followed by the addition of another 100 µL of Annexin Buffer before measurement on a BD FACS Canto II instrument and analysis using FlowJo v10 software.
4.9. Spheroid Growth Analysis
In addition to the established standard 2D cultivation of the cell lines MG-63, Saos-2, and hFOB 1.19, 3D cultures of each cell line were established to conduct preliminary tests of treatment effects in three-dimensional growth models in the form of spheroids by the liquid layer or floating cells method [
42]. Prior to the cell cultivation, a hot, sterile 1.5% agarose gel was poured in a 96-well plate, followed by cell seeding with a density of 5000 cells/well. Spheroids were usually formed within 24 h after the seeding when bright-field images of all spheroid replicas were acquired with a 10× objective of an EVOS M5000 imaging system. Afterwards, the same treatment regime was performed as previously performed in the 2D cell culture for flow cytometry analysis. Spheroids were imaged again at 24 h and 72 h after the treatment.
The spheroid area, as a morphological descriptor, was analyzed using ImageJ v0.5.7 image-processing software to determine the growth rate. The measurement of the spheroid area from transmitted-light images is described as a classical method to evaluate the activity of antiproliferative compounds in 3D models [
43]. The growth rates at 24 h and 72 h were calculated for each spheroid relative to the spheroid area before the addition of treatments. The average growth rate at the HB and SD2 IC
50 concentrations and combined treatments was normalized to the average growth rate of the untreated spheroids (controls) for each executed experiment.
4.10. Statistical Analysis
Statistical analyses were conducted using GraphPad Prism software (version 10.4.1). The differences between the treatment groups were estimated using one-way and two-way analyses of variance (ANOVA), followed by Tukey’s post hoc test. A p-value of less than 0.05 was considered statistically significant, with significance levels denoted as * p < 0.05, ** p < 0.001, *** p < 0.001, and **** p < 0.0001.
