Using a Novel Consensus-Based Chemoinformatics Approach to Predict ADMET Properties and Druglikeness of Tyrosine Kinase Inhibitors
Abstract
1. Introduction
2. Results and Discussion
- In terms of QED parameter (Quantitative Estimate of Druglikeness) [7];
- In terms of pharmacokinetic parameters (Bioavailability, Distribution, and Excretion);
- In terms of toxicity (carcinogenic potential and organ toxicity).
2.1. The Studied Compounds
2.2. Calculation/Estimation of Molecular and ADMET Descriptors
2.3. Method Validation
2.3.1. Validation Results of Consensus-Based Model
2.3.2. Validation Results of Individual Platforms
2.4. Evaluation of Druglikeness, Medicinal Chemistry, and ADMET Properties
2.5. Molecular Docking Studies
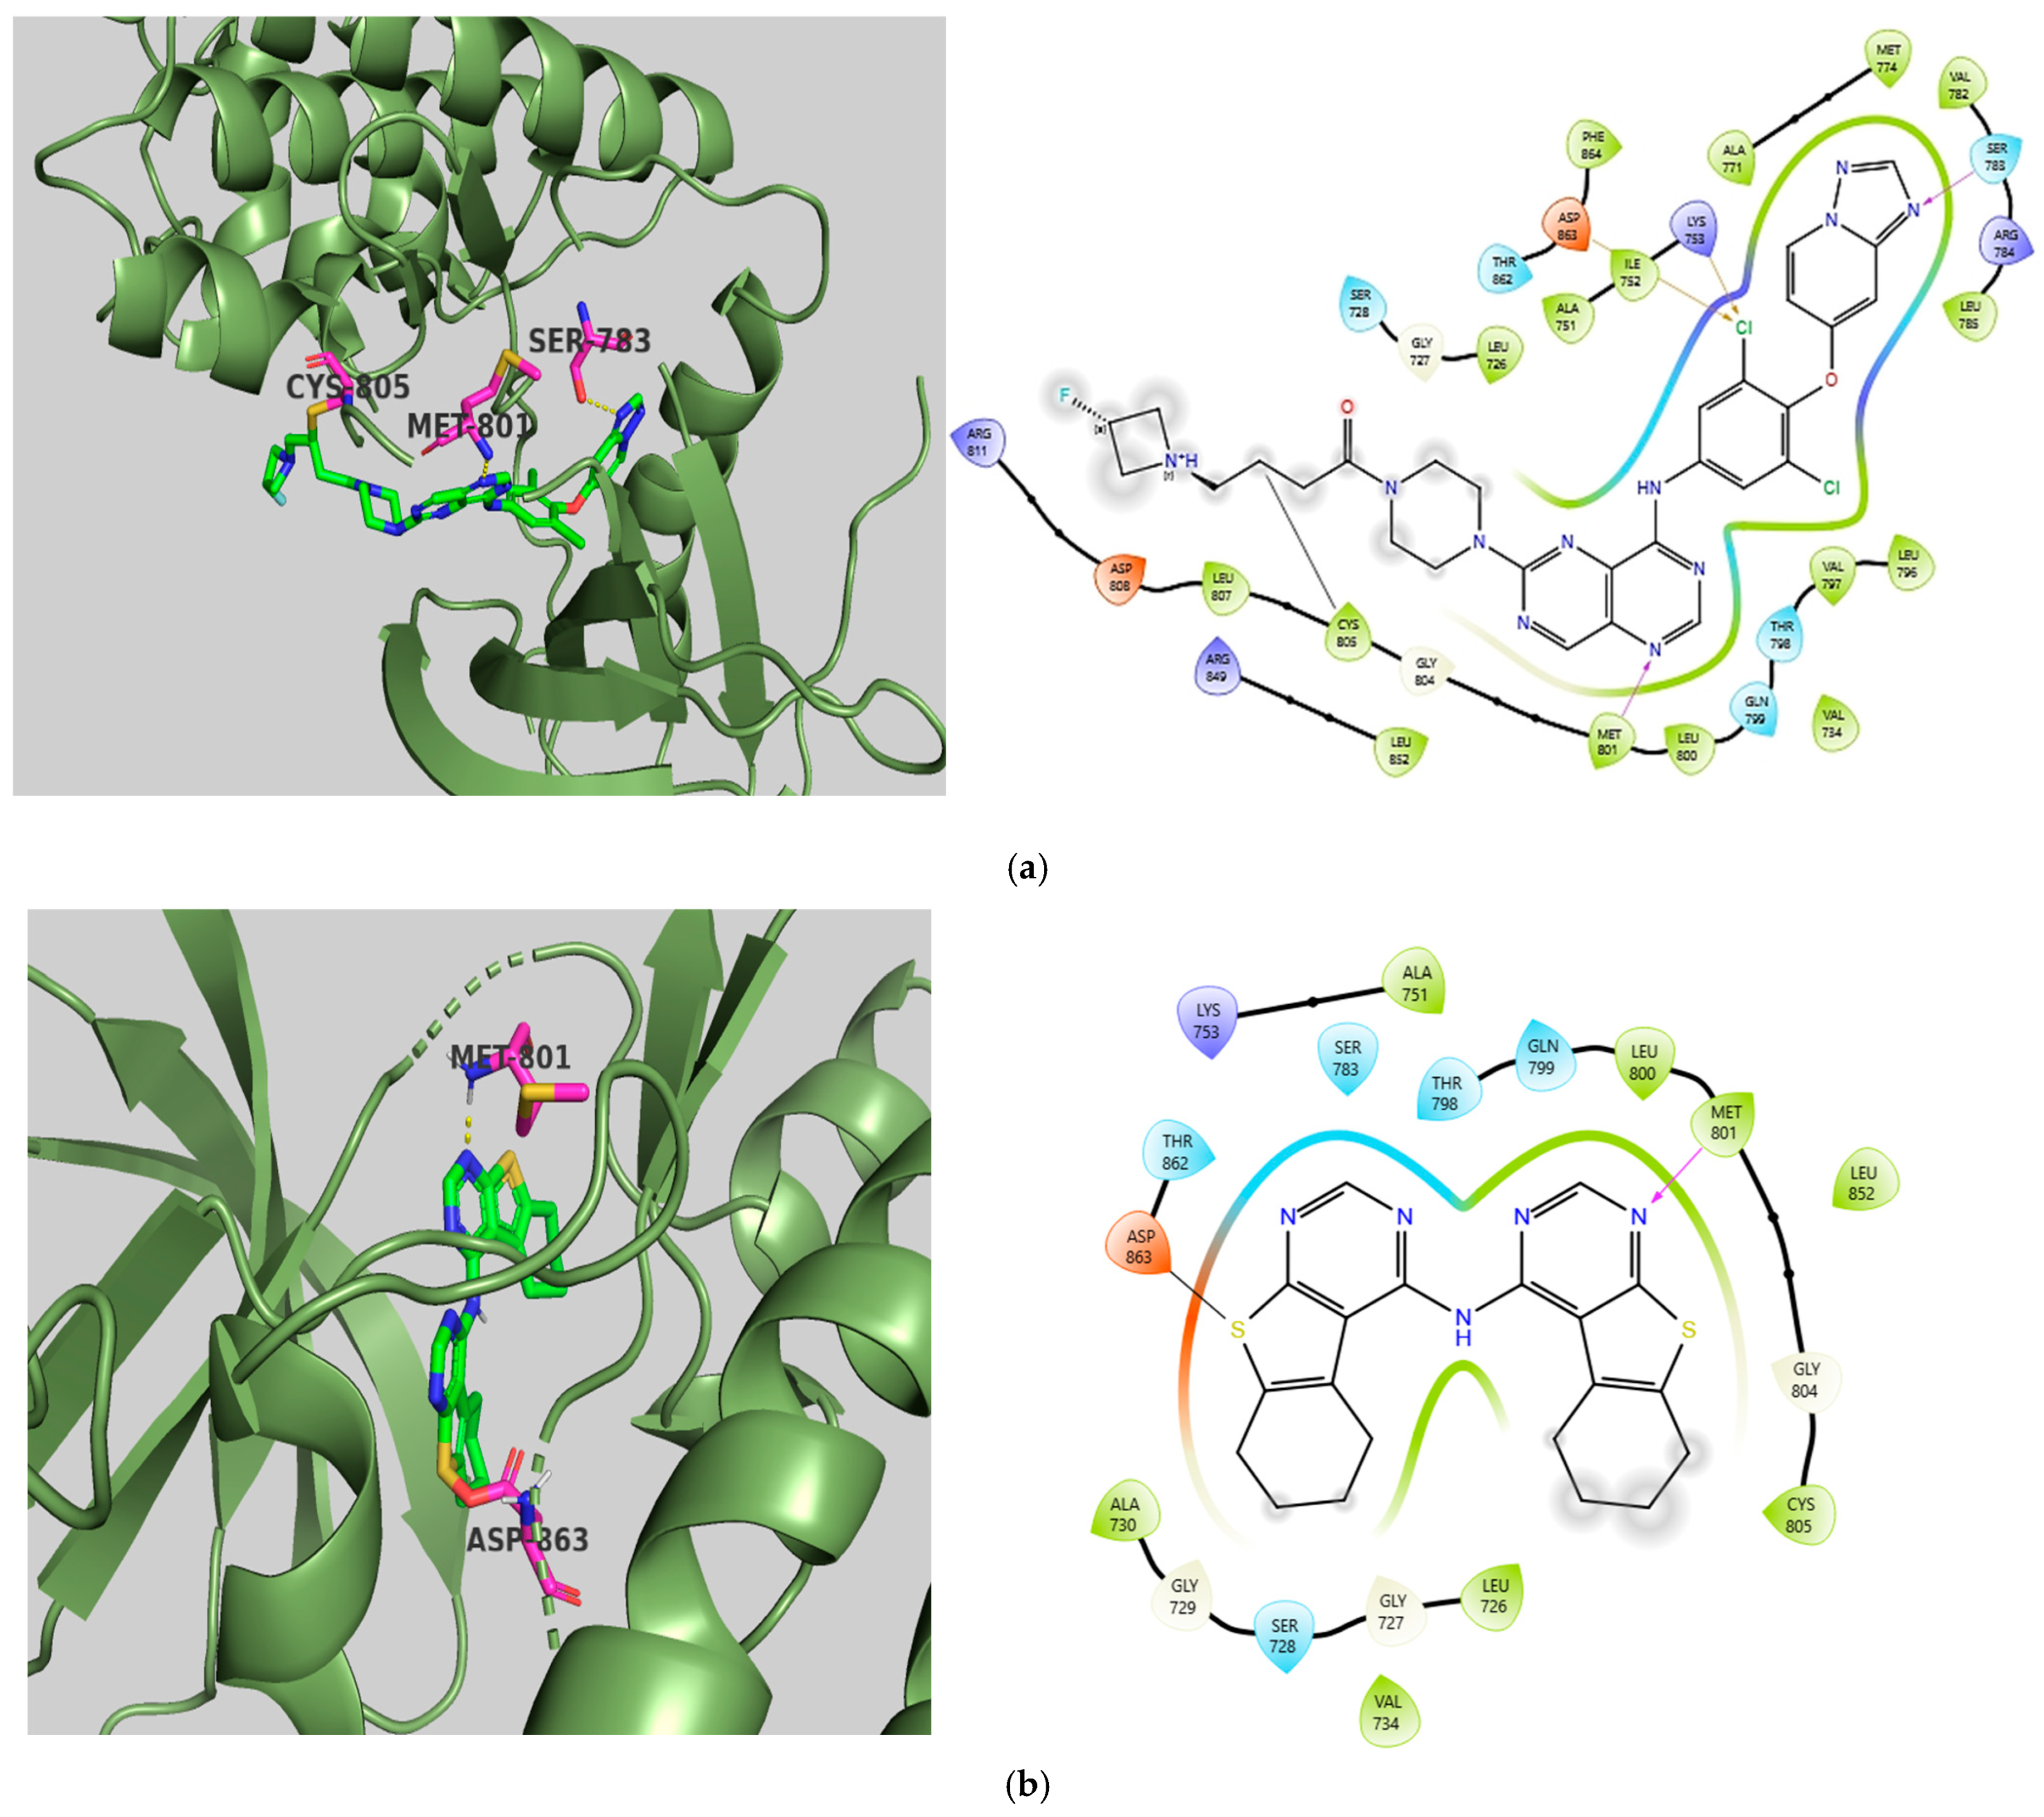
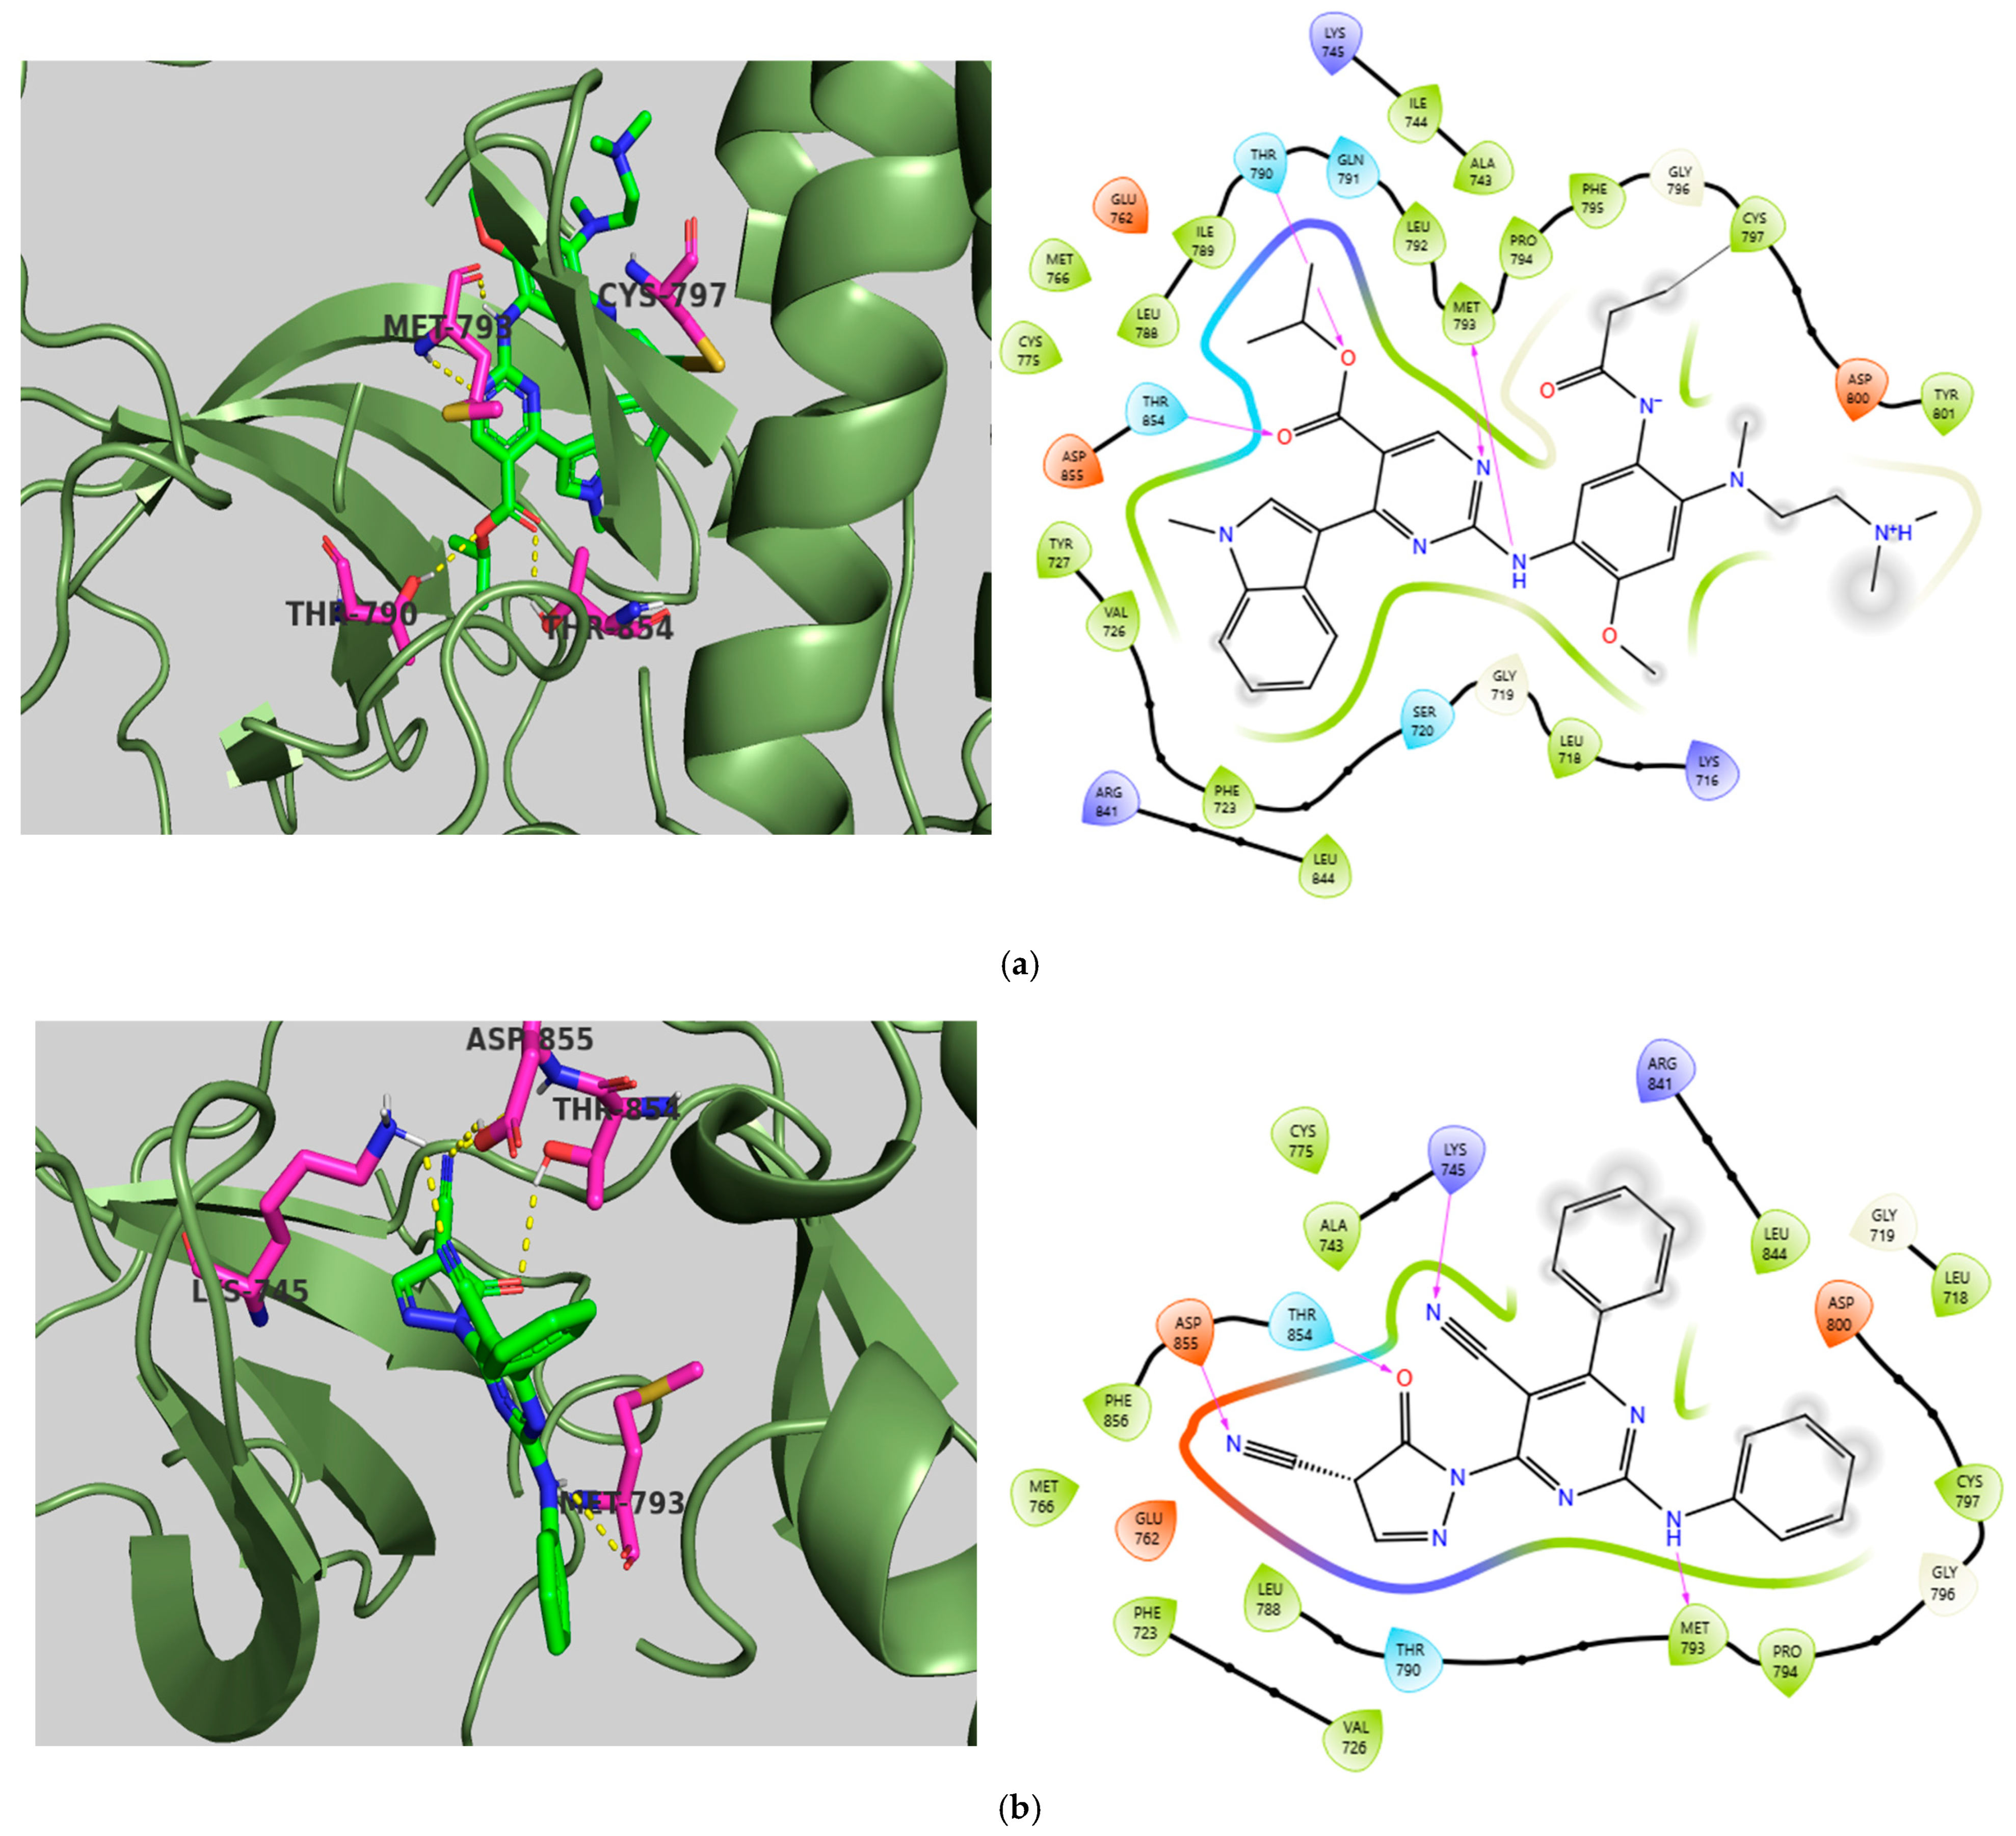
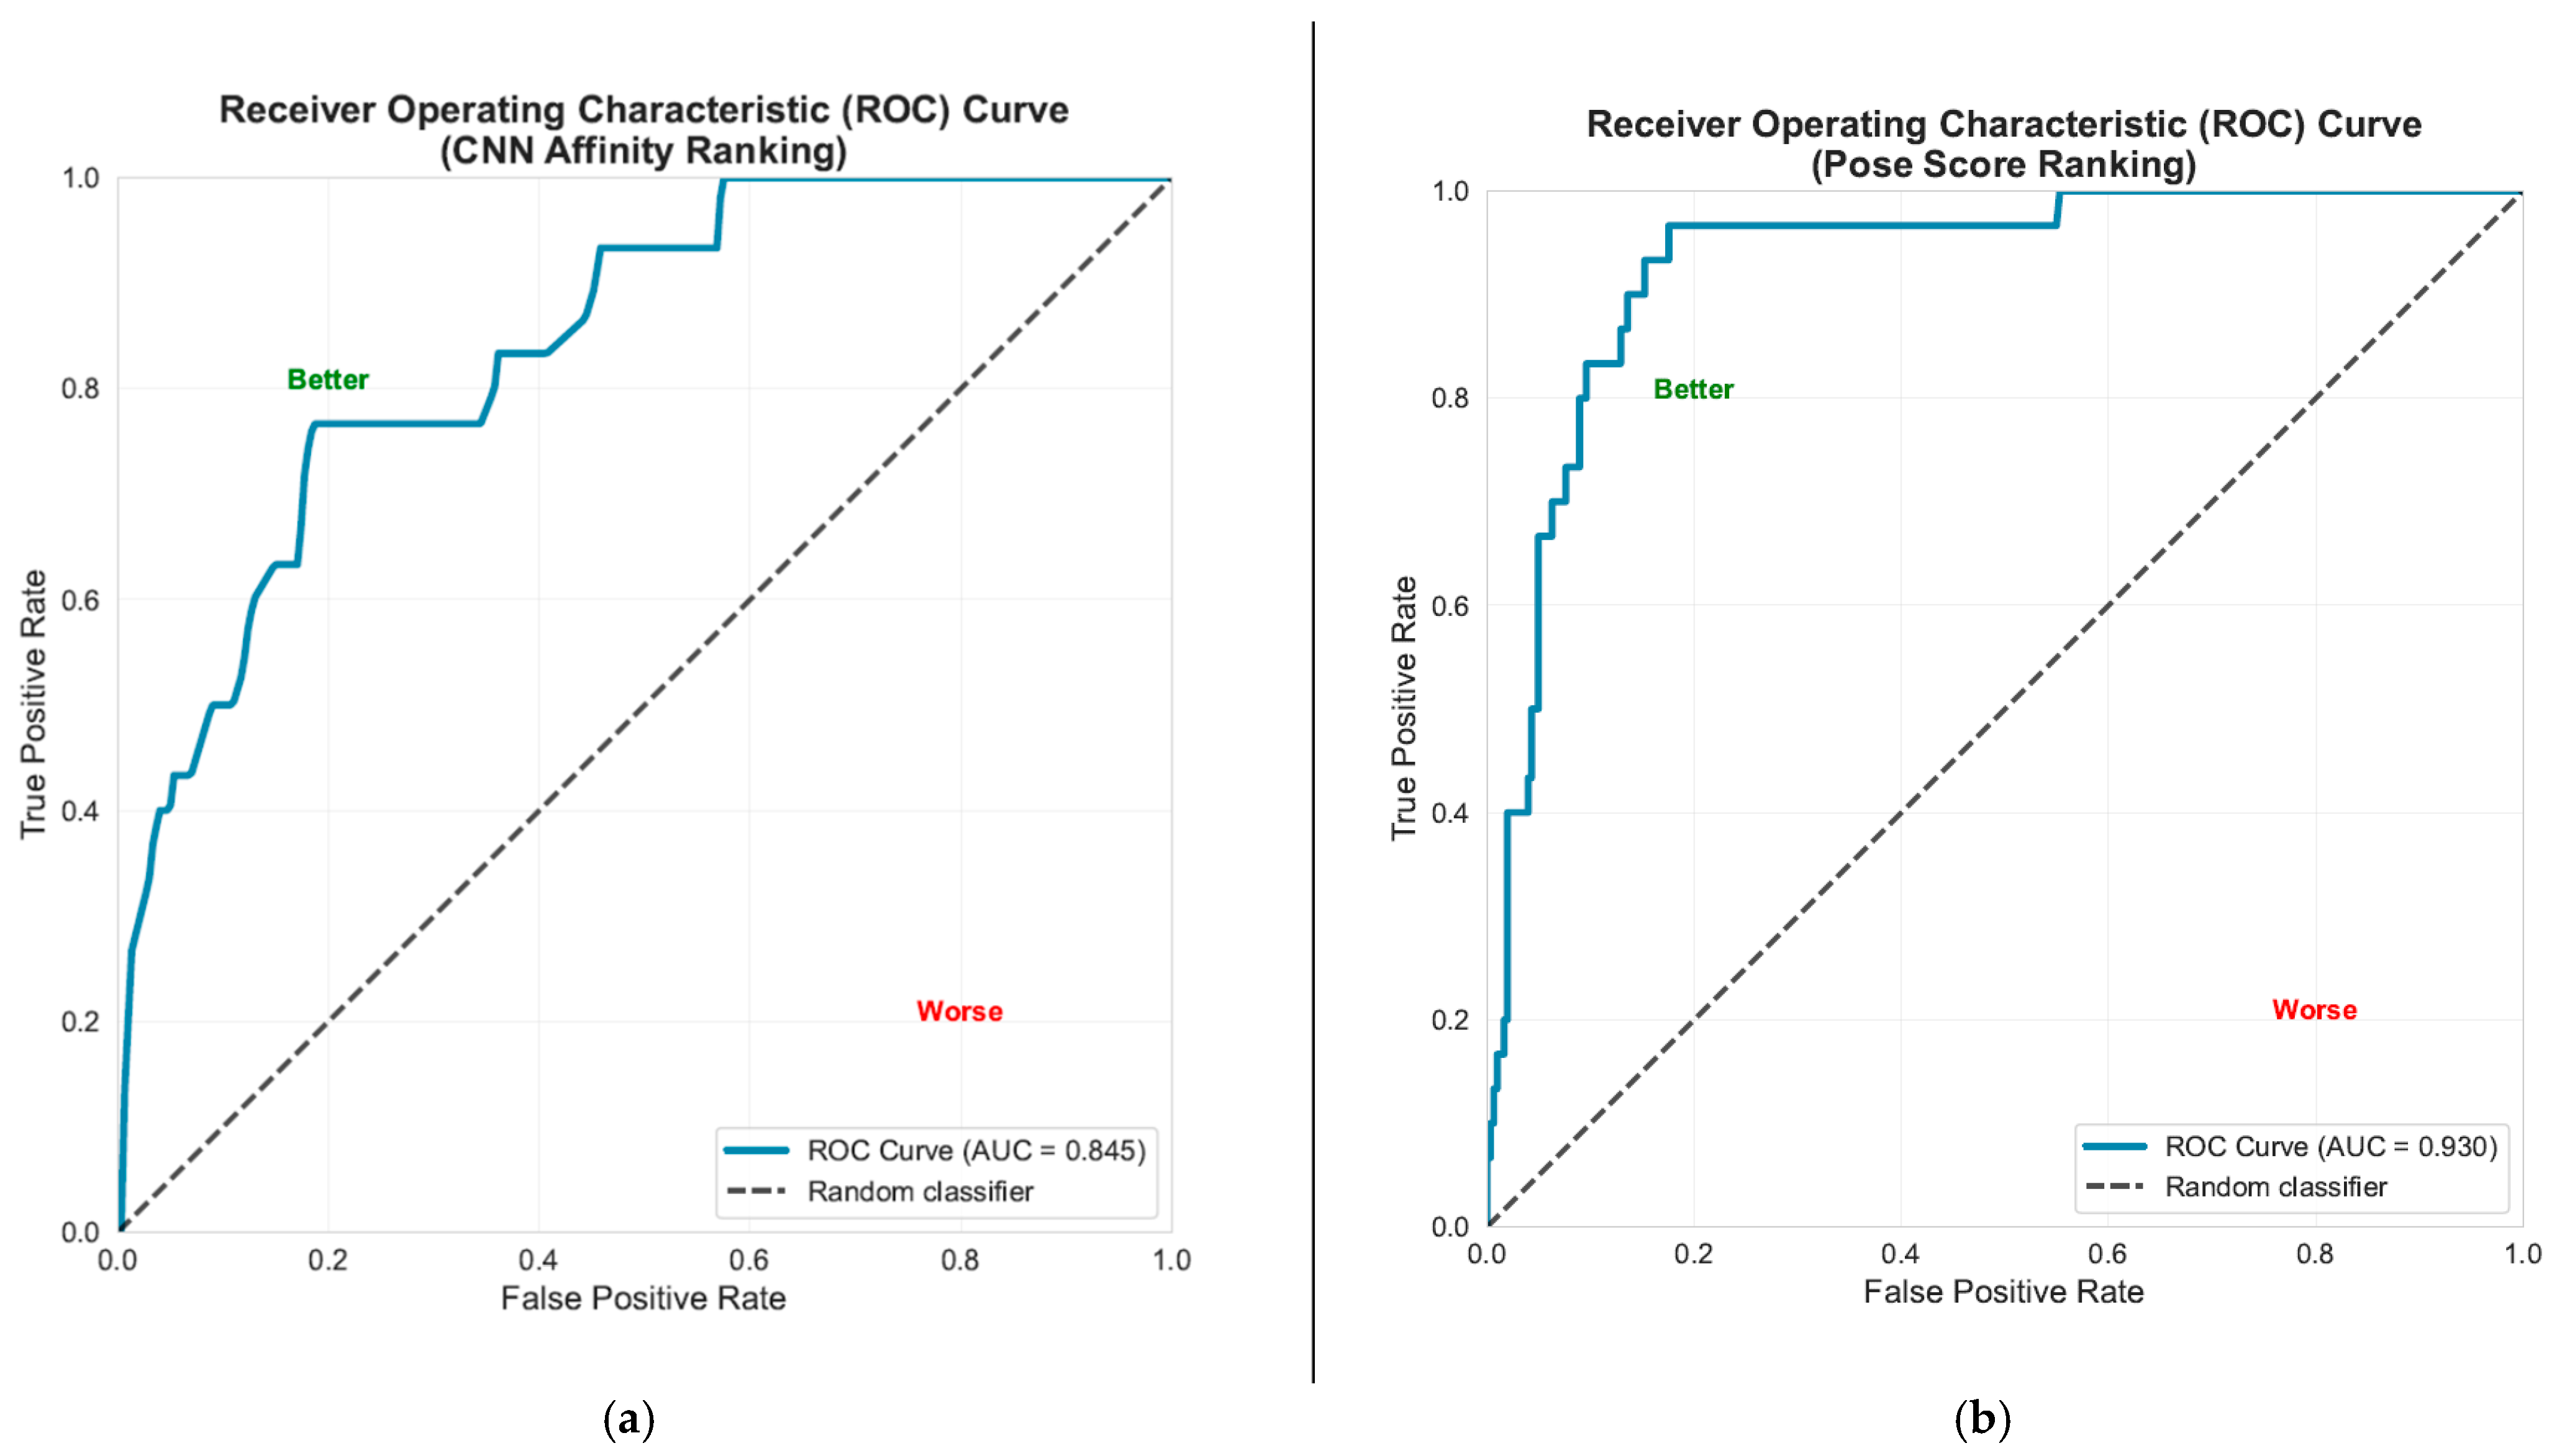
Molecular Docking Validation Results
2.6. Statistical Results
3. Materials and Methods
4. Conclusions
Supplementary Materials
Author Contributions
Funding
Institutional Review Board Statement
Informed Consent Statement
Data Availability Statement
Acknowledgments
Conflicts of Interest
References
- Cheek, S.; Zhang, H.; Grishin, N.V. Sequence and structure classification of kinases. J. Mol. Biol. 2002, 320, 855–881. [Google Scholar] [CrossRef]
- Ferguson, F.M.; Gray, N.S. Kinase inhibitors: The road ahead. Nat. Rev. Drug Discov. 2018, 17, 353–377. [Google Scholar] [CrossRef] [PubMed]
- Arora, A.; Scholar, E.M. Role of tyrosine kinase inhibitors in cancer therapy. J. Pharmacol. Exp. Ther. 2005, 315, 971–979. [Google Scholar] [CrossRef] [PubMed]
- Huang, L.; Jiang, S.; Shi, Y. Tyrosine kinase inhibitors for solid tumors in the past 20 years (2001–2020). J. Hematol. Oncol. 2020, 13, 1–23. [Google Scholar] [CrossRef] [PubMed]
- Egan, W.J.; Merz, K.M.; Baldwin, J.J. Prediction of drug absorption using multivariate statistics. J. Med. Chem. 2000, 43, 3867–3877. [Google Scholar] [CrossRef]
- Sun, D.; Gao, W.; Hu, H.; Zhou, S. Why 90% of clinical drug development fails and how to improve it? Acta Pharm. Sin. B 2022, 12, 3049–3062. [Google Scholar] [CrossRef]
- Bickerton, G.R.; Paolini, G.V.; Besnard, J.; Muresan, S.; Hopkins, A.L. Quantifying the chemical beauty of drugs. Nat. Chem. 2012, 4, 90–98. [Google Scholar] [CrossRef]
- Available online: https://www.molinspiration.com/ (accessed on 24 January 2025).
- Abagyan, R.; Totrov, M.; Kuznetsov, D. ICM—A New Method for Protein Modeling and Design: Applications to Docking and Structure Prediction from the Distorted Native Conformation. J. Comput. Chem. 1994, 15, 488–506. [Google Scholar] [CrossRef]
- Daina, A.; Michielin, O.; Zoete, V. SwissADME: A free web tool to evaluate pharmacokinetics, drug-likeness and medicinal chemistry friendliness of small molecules. Sci. Rep. 2017, 7, 42717. [Google Scholar] [CrossRef]
- Kiss, R.; Sandor, M.; Szalai, F.A. http://Mcule.com: A public web service for drug discovery. J. Cheminform. 2012, 4, P17. [Google Scholar] [CrossRef]
- Dong, J.; Wang, N.-N.; Yao, Z.-J.; Zhang, L.; Cheng, Y.; Ouyang, D.; Lu, A.-P.; Cao, D.-S. ADMETlab: A platform for systematic ADMET evaluation based on a comprehensively collected ADMET database. J. Cheminform. 2018, 10, 29. [Google Scholar] [CrossRef]
- Xiong, G.; Wu, Z.; Yi, J.; Fu, L.; Yang, Z.; Hsieh, C.; Yin, M.; Zeng, X.; Wu, C.; Lu, A.; et al. ADMETlab 2.0: An integrated online platform for accurate and comprehensive predictions of ADMET properties. Nucleic Acids Res. 2021, 49, W5–W14. [Google Scholar] [CrossRef] [PubMed]
- Pires, D.E.V.; Blundell, T.L.; Ascher, D.B. pkCSM: Predicting small-molecule pharmacokinetic and toxicity properties using graph-based signatures. J. Med. Chem. 2015, 58, 4066–4072. [Google Scholar] [CrossRef] [PubMed]
- Available online: https://biosig.lab.uq.edu.au/deeppk/ (accessed on 24 January 2025).
- Yang, H.; Lou, C.; Sun, L.; Li, J.; Cai, Y.; Wang, Z.; Li, W.; Liu, G.; Tang, Y. admetSAR 2.0: Web-service for prediction and optimization of chemical ADMET properties. Bioinformatics 2019, 35, 1067–1069. [Google Scholar] [CrossRef]
- Cheng, F.; Li, W.; Zhou, Y.; Shen, J.; Wu, Z.; Liu, G.; Lee, P.W.; Tang, Y. AdmetSAR: A comprehensive source and free tool for assessment of chemical ADMET properties. J. Chem. Inf. Model. 2012, 52, 3099–3105, Erratum in J. Chem. Inf. Model. 2019, 59, 4959. [Google Scholar] [CrossRef] [PubMed]
- Lee, S.K.; Chang, G.S.; Lee, I.H.; Chung, J.E.; Sung, K.Y.; No, K.T. The PreADME: PC-based program for batch prediction of ADME properties. EuroQSAR 2004, 9, 5–10. [Google Scholar]
- Martin, T.M. Toxicity Estimation Software Tool; Environmental Protection Agency: Washington, DC, USA, 2020.
- Lipinski, C.A.; Dominy, B.W.; Feeney, P.J. Experimental and computational approaches to estimate solubility and permeability in drug discovery and development settings. Adv. Drug Deliv. Rev. 1997, 23, 3–25. [Google Scholar] [CrossRef]
- Ghose, A.K.; Viswanadhan, V.N.; Wendoloski, J.J. A knowledge-based approach in designing combinatorial or medicinal chemistry libraries for drug discovery. 1. A qualitative and quantitative characterization of known drug databases. J. Comb. Chem. 1999, 1, 55–68. [Google Scholar] [CrossRef]
- Veber, D.F.; Johnson, S.R.; Cheng, H.-Y.; Smith, B.R.; Ward, K.W.; Kopple, K.D. Molecular properties that influence the oral bioavailability of drug candidates. J. Med. Chem. 2002, 45, 2615–2623. [Google Scholar] [CrossRef]
- Muegge, I.; Heald, S.L.; Brittelli, D. Simple selection criteria for drug-like chemical matter. J. Med. Chem. 2001, 44, 1841–1846. [Google Scholar] [CrossRef]
- Oprea, T.I. Property distribution of drug-related chemical databases. J. Comput.-Aided Mol. Des. 2000, 14, 251–264. [Google Scholar] [CrossRef]
- Teague, S.J.; Davis, A.M.; Leeson, P.D.; Oprea, T. The design of leadlike combinatorial libraries. Angew. Chem.—Int. Ed. 1999, 38, 3743–3748. [Google Scholar] [CrossRef]
- Gleeson, M.P. Generation of a set of simple, interpretable ADMET rules of thumb. J. Med. Chem. 2008, 51, 817–834. [Google Scholar] [CrossRef]
- Baell, J.B.; Nissink, J.W.M. Seven Year Itch: Pan-Assay Interference Compounds (PAINS) in 2017—Utility and Limitations. ACS Chem. Biol. 2018, 13, 36–44. [Google Scholar] [CrossRef]
- Brenk, R.; Schipani, A.; James, D.; Krasowski, A.; Gilbert, I.H.; Frearson, J.; Wyatt, P.G. Lessons learnt from assembling screening libraries for drug discovery for neglected diseases. ChemMedChem 2008, 3, 435–444. [Google Scholar] [CrossRef] [PubMed]
- Newton, R.; Bowler, K.A.; Burns, E.M.; Chapman, P.J.; Fairweather, E.E.; Fritzl, S.J.; Goldberg, K.M.; Hamilton, N.M.; Holt, S.V.; Hopkins, G.V.; et al. The discovery of 2-substituted phenol quinazolines as potent RET kinase inhibitors with improved KDR selectivity. Eur. J. Med. Chem. 2016, 112, 20–32. [Google Scholar] [CrossRef] [PubMed]
- Adel, M.; Serya, R.A.; Lasheen, D.S.; Abouzid, K.A. Identification of new pyrrolo [2,3-d]pyrimidines as potent VEGFR-2 tyrosine kinase inhibitors: Design, synthesis, biological evaluation and molecular modeling. Bioorg. Chem. 2018, 81, 612–629. [Google Scholar] [CrossRef] [PubMed]
- El-Metwally, S.A.; Abou-El-Regal, M.M.; Eissa, I.H.; Mehany, A.B.; Mahdy, H.A.; Elkady, H.; Elwan, A.; Elkaeed, E.B. Discovery of thieno [2,3-d]pyrimidine-based derivatives as potent VEGFR-2 kinase inhibitors and anti-cancer agents. Bioorg. Chem. 2021, 112, 104947. [Google Scholar] [CrossRef]
- Dorsch, D.; Schadt, O.; Stieber, F.; Meyring, M.; Grädler, U.; Bladt, F.; Friese-Hamim, M.; Knühl, C.; Pehl, U.; Blaukat, A. Identification and optimization of pyridazinones as potent and selective c-Met kinase inhibitors. Bioorg. Med. Chem. Lett. 2015, 25, 1597–1602. [Google Scholar] [CrossRef]
- Mohamady, S.; Galal, M.; Eldehna, W.M.; Gutierrez, D.C.; Ibrahim, H.S.; Elmazar, M.M.; Ali, H.I. Dual Targeting of VEGFR2 and C-Met Kinases via the Design and Synthesis of Substituted 3-(Triazolo-thiadiazin-3-yl)indolin-2-one Derivatives as Angiogenesis Inhibitors. ACS Omega 2020, 5, 18872–18886. [Google Scholar] [CrossRef]
- Elmetwally, S.A.; Saied, K.F.; Eissa, I.H.; Elkaeed, E.B. Design, synthesis and anticancer evaluation of thieno [2,3-d]pyrimidine derivatives as dual EGFR/HER2 inhibitors and apoptosis inducers. Bioorg. Chem. 2019, 88, 102944. [Google Scholar] [CrossRef] [PubMed]
- Li, X.; Zuo, Y.; Tang, G.; Wang, Y.; Zhou, Y.; Wang, X.; Guo, T.; Xia, M.; Ding, N.; Pan, Z. Discovery of a series of 2,5-diaminopyrimidine covalent irreversible inhibitors of Bruton’s tyrosine kinase with in vivo antitumor activity. J. Med. Chem. 2014, 57, 5112–5128. [Google Scholar] [CrossRef] [PubMed]
- Sherbiny, F.F.; Bayoumi, A.H.; El-Morsy, A.M.; Sobhy, M.; Hagras, M. Design, Synthesis, biological Evaluation, and molecular docking studies of novel Pyrazolo [3,4-d]Pyrimidine derivative scaffolds as potent EGFR inhibitors and cell apoptosis inducers. Bioorg. Chem. 2021, 116, 105325. [Google Scholar] [CrossRef]
- Zheng, N.; Pan, J.; Hao, Q.; Li, Y.; Zhou, W. Design, synthesis and biological evaluation of novel 3-substituted pyrazolopyrimidine derivatives as potent Bruton’s tyrosine kinase (BTK) inhibitors. Bioorg. Med. Chem. 2018, 26, 2165–2172. [Google Scholar] [CrossRef]
- Mahalapbutr, P.; Leechaisit, R.; Thongnum, A.; Todsaporn, D.; Prachayasittikul, V.; Rungrotmongkol, T.; Prachayasittikul, S.; Ruchirawat, S.; Prachayasittikul, V.; Pingaew, R. Discovery of Anilino-1,4-naphthoquinones as Potent EGFR Tyrosine Kinase Inhibitors: Synthesis, Biological Evaluation, and Comprehensive Molecular Modeling. ACS Omega 2022, 7, 17881–17893. [Google Scholar] [CrossRef]
- Ciaffaglione, V.; Consoli, V.; Intagliata, S.; Marrazzo, A.; Romeo, G.; Pittalà, V.; Greish, K.; Vanella, L.; Floresta, G.; Rescifina, A.; et al. Novel Tyrosine Kinase Inhibitors to Target Chronic Myeloid Leukemia. Molecules 2022, 27, 3220. [Google Scholar] [CrossRef]
- Lamie, P.F.; El-Kalaawy, A.M.; Latif, N.S.A.; Rashed, L.A.; Philoppes, J.N. Pyrazolo [3,4-d]pyrimidine-based dual EGFR T790M/HER2 inhibitors: Design, synthesis, structure–activity relationship and biological activity as potential antitumor and anticonvulsant agents. Eur. J. Med. Chem. 2021, 214, 113222. [Google Scholar] [CrossRef]
- Farghaly, A.M.; AboulWafa, O.M.; Baghdadi, H.H.; El Razik, H.A.A.; Sedra, S.M.; Shamaa, M.M. New thieno [3,2-d]pyrimidine-based derivatives: Design, synthesis and biological evaluation as antiproliferative agents, EGFR and ARO inhibitors inducing apoptosis in breast cancer cells. Bioorg. Chem. 2021, 115, 105208. [Google Scholar] [CrossRef]
- El-Adl, K.; Ibrahim, M.; Khedr, F.; Abulkhair, H.S.; Eissa, I.H. N-Substituted-4-phenylphthalazin-1-amine-derived VEGFR-2 inhibitors: Design, synthesis, molecular docking, and anticancer evaluation studies. Arch. Pharm. 2021, 354, e2000219. [Google Scholar] [CrossRef]
- El-Helby, A.A.; Ayyad, R.R.A.; Sakr, H.; El-Adl, K.; Ali, M.M.; Khedr, F. Design, Synthesis, Molecular Docking, and Anticancer Activity of Phthalazine Derivatives as VEGFR-2 Inhibitors. Arch. Pharm. 2017, 350, 1700240. [Google Scholar] [CrossRef] [PubMed]
- Alanazi, M.M.; Mahdy, H.A.; Alsaif, N.A.; Obaidullah, A.J.; Alkahtani, H.M.; Al-Mehizia, A.A.; Alsubaie, S.M.; Dahab, M.A.; Eissa, I.H. New bis([1,2,4]triazolo)[4,3-a:3′,4′-c]quinoxaline derivatives as VEGFR-2 inhibitors and apoptosis inducers: Design, synthesis, in silico studies, and anticancer evaluation. Bioorg. Chem. 2021, 112, 104949. [Google Scholar] [CrossRef]
- Saleh, N.M.; El-Gaby, M.S.; El-Adl, K.; El-Sattar, N.E.A. Design, green synthesis, molecular docking and anticancer evaluations of diazepam bearing sulfonamide moieties as VEGFR-2 inhibitors. Bioorg. Chem. 2020, 104, 104350. [Google Scholar] [CrossRef]
- Ahmed, E.Y.; Latif, N.A.A.; El-Mansy, M.F.; Elserwy, W.S.; Abdelhafez, O.M. VEGFR-2 inhibiting effect and molecular modeling of newly synthesized coumarin derivatives as anti-breast cancer agents. Bioorg. Med. Chem. 2020, 28, 115328. [Google Scholar] [CrossRef] [PubMed]
- Abdel-Mohsen, H.T.; El-Meguid, E.A.A.; El Kerdawy, A.M.; Mahmoud, A.E.E.; Ali, M.M. Design, synthesis, and molecular docking of novel 2-arylbenzothiazole multiangiokinase inhibitors targeting breast cancer. Arch. Pharm. 2020, 353, e1900340. [Google Scholar] [CrossRef]
- AboulWafa, O.M.; Daabees, H.M.; Badawi, W.A. 2-Anilinopyrimidine derivatives: Design, synthesis, in vitro anti-proliferative activity, EGFR and ARO inhibitory activity, cell cycle analysis and molecular docking study. Bioorg. Chem. 2020, 99, 103798. [Google Scholar] [CrossRef] [PubMed]
- Ma, B.; Bohnert, T.; Otipoby, K.L.; Tien, E.; Arefayene, M.; Bai, J.; Bajrami, B.; Bame, E.; Chan, T.R.; Humora, M.; et al. Discovery of BIIB068: A Selective, Potent, Reversible Bruton’s Tyrosine Kinase Inhibitor as an Orally Efficacious Agent for Autoimmune Diseases. J. Med. Chem. 2020, 63, 12526–12541. [Google Scholar] [CrossRef]
- Zhavoronkov, A.; Ivanenkov, Y.A.; Aliper, A.; Veselov, M.S.; Aladinskiy, V.A.; Aladinskaya, A.V.; Terentiev, V.A.; Polykovskiy, D.A.; Kuznetsov, M.D.; Asadulaev, A.; et al. Deep learning enables rapid identification of potent DDR1 kinase inhibitors. Nat. Biotechnol. 2019, 37, 1038–1040. [Google Scholar] [CrossRef] [PubMed]
- Osborne, J.; Birchall, K.; Tsagris, D.J.; Lewis, S.J.; Smiljanic-Hurley, E.; Taylor, D.L.; Levy, A.; Alessi, D.R.; McIver, E.G. Discovery of potent and selective 5-azaindazole inhibitors of leucine-rich repeat kinase 2 (LRRK2)—Part 1. Bioorg. Med. Chem. Lett. 2019, 29, 668–673. [Google Scholar] [CrossRef]
- Roskoski, R. Properties of FDA-approved small molecule protein kinase inhibitors: A 2024 update. Pharmacol. Res. 2024, 200, 107059. [Google Scholar] [CrossRef]
- Shah, R.R.; Morganroth, J.; Shah, D.R. Cardiovascular safety of tyrosine kinase inhibitors: With a special focus on cardiac repolarisation (QT Interval). Drug Saf. 2013, 36, 295–316. [Google Scholar] [CrossRef]
- Dulsat, J.; López-Nieto, B.; Estrada-Tejedor, R.; Borrell, J.I. Evaluation of Free Online ADMET Tools for Academic or Small Biotech Environments. Molecules 2023, 28, 776. [Google Scholar] [CrossRef]
- Viganò, M.; La Milia, M.; Grassini, M.V.; Pugliese, N.; De Giorgio, M.; Fagiuoli, S. Hepatotoxicity of Small Molecule Protein Kinase Inhibitors for Cancer. Cancers 2023, 15, 1766. [Google Scholar] [CrossRef]
- Knox, C.; Wilson, M.; Klinger, C.M.; Franklin, M.; Oler, E.; Wilson, A.; Pon, A.; Cox, J.; Chin, N.E.; Strawbridge, S.A.; et al. DrugBank 6.0: The DrugBank Knowledgebase for 2024. Nucleic Acids Res. 2023, 52, D1265–D1275. [Google Scholar] [CrossRef] [PubMed]
- U.S. Department of Health and Human Services Food and Drug Administration. Available online: https://open.fda.gov/fdalabels/active_ingredient/ (accessed on 15 September 2024).
- Al-Sanea, M.M.; Chilingaryan, G.; Abelyan, N.; Sargsyan, A.; Hovhannisyan, S.; Gasparyan, H.; Gevorgyan, S.; Albogami, S.; Ghoneim, M.M.; Farag, A.K.; et al. Identification of novel potential vegfr-2 inhibitors using a combination of computational methods for drug discovery. Life 2021, 11, 1070. [Google Scholar] [CrossRef] [PubMed]
- Modi, S.J.; Kulkarni, V.M. Exploration of structural requirements for the inhibition of VEGFR-2 tyrosine kinase: Binding site analysis of type II, ‘DFG-out’ inhibitors. J. Biomol. Struct. Dyn. 2022, 40, 5712–5727. [Google Scholar] [CrossRef]
- Wilding, B.; Scharn, D.; Böse, D.; Baum, A.; Santoro, V.; Chetta, P.; Schnitzer, R.; Botesteanu, D.A.; Reiser, C.; Kornigg, S.; et al. Discovery of potent and selective HER2 inhibitors with efficacy against HER2 exon 20 insertion-driven tumors, which preserve wild-type EGFR signaling. Nat. Cancer 2022, 3, 821–836. [Google Scholar] [CrossRef]
- Aertgeerts, K.; Skene, R.; Yano, J.; Sang, B.-C.; Zou, H.; Snell, G.; Jennings, A.; Iwamoto, K.; Habuka, N.; Hirokawa, A.; et al. Structural analysis of the mechanism of inhibition and allosteric activation of the kinase domain of HER2 protein. J. Biol. Chem. 2011, 286, 18756–18765. [Google Scholar] [CrossRef]
- Huang, W.-S.; Li, F.; Gong, Y.; Zhang, Y.; Youngsaye, W.; Xu, Y.; Zhu, X.; Greenfield, M.T.; Kohlmann, A.; Taslimi, P.M.; et al. Discovery of mobocertinib, a potent, oral inhibitor of EGFR exon 20 insertion mutations in non–small cell lung cancer. Bioorg. Med. Chem. Lett. 2023, 80, 129084. [Google Scholar] [CrossRef]
- Wang, J.; Lam, D.; Yang, J.; Hu, L. Discovery of mobocertinib, a new irreversible tyrosine kinase inhibitor indicated for the treatment of non-small-cell lung cancer harboring EGFR exon 20 insertion mutations. Med. Chem. Res. 2022, 31, 1647–1662. [Google Scholar] [CrossRef]
- Mateev, E.; Valkova, I.; Angelov, B.; Georgieva, M. Validation Through Re-Docking, Cross-Docking and Ligand Enrichment in Various Well-Resoluted Mao-B Receptors. Artic. Int. J. Pharm. Sci. Res. 2021, 13, 1000–1007. [Google Scholar] [CrossRef]
- Ramírez, D.; Caballero, J. Is It Reliable to Take the Molecular Docking Top Scoring Position as the Best Solution without Considering Available Structural Data? Molecules 2018, 23, 1038. [Google Scholar] [CrossRef]
- Maltarollo, V.G. (Ed.) Computer-Aided and Machine Learning-Driven Drug Design. From Theory to Applications; Computer-Aided Drug Discovery and Design 3; Springer: Cham, Switzerland, 2024. [Google Scholar]
- Eastman, P.; Galvelis, R.; Peláez, R.P.; Abreu, C.R.A.; Farr, S.E.; Gallicchio, E.; Gorenko, A.; Henry, M.M.; Hu, F.; Huang, J.; et al. OpenMM 8: Molecular Dynamics Simulation with Machine Learning Potentials. J. Phys. Chem. B 2024, 128, 109–116. [Google Scholar] [CrossRef] [PubMed]
- Ropp, P.J.; Spiegel, J.O.; Walker, J.L.; Green, H.; Morales, G.A.; Milliken, K.A.; Ringe, J.J.; Durrant, J.D. Gypsum-DL: An open-source program for preparing small-molecule libraries for structure-based virtual screening. J. Cheminform. 2019, 11, 34. [Google Scholar] [CrossRef] [PubMed]
- McNutt, A.T.; Francoeur, P.; Aggarwal, R.; Masuda, T.; Meli, R.; Ragoza, M.; Sunseri, J.; Koes, D.R. GNINA 1.0: Molecular docking with deep learning. J. Cheminform. 2021, 13, 43. [Google Scholar] [CrossRef] [PubMed]
- The PyMOL Molecular Graphics System, Version 3.0.4; Schrödinger, LLC: New York, NY, USA, 2025.
- Schrödinger Release 2025-3: Maestro, Version 14.5.131; Schrödinger, LLC: New York, NY, USA, 2025.
- Available online: https://github.com/InformaticsMatters/docking-validation/tree/7ca594d166fcf6f59fd9501ef1e39efa71c4cb60/datasets/DEKOIS_2.0 (accessed on 14 September 2025).
- IBM Corp. IBM SPSS Statistics for Windows, Version 29.0.2.0; IBM Corp.: Armonk, NY, USA, 2023.
- Martin, Y.C.; Kofron, J.L.; Traphagen, L.M. Do structurally similar molecules have similar biological activity? J. Med. Chem. 2002, 45, 4350–4358. [Google Scholar] [CrossRef]

| Descriptors | Software/Webservers | ||||||||||
| Molinspiration [8] | Molsoft [9] | SwissADME [10] | Mcule [11] | AdmetLab 3.0 [12,13] | pkSCM [14] | Deep-PK [15] | admetSAR 3.0 [16,17] | PreADMET [18] | T.E.S.T [19] | ||
| Physicochemical Properties | Molecular weight | ✓ | ✓ | ✓ | ✓ | ✓ | ✓ | ✓ | ✓ | ✕ | ✕ |
| TPSA | ✓ | ✓ | ✓ | ✓ | ✓ | ✕ | ✓ | ✓ | ✕ | ✕ | |
| Molar Refractivity | ✕ | ✕ | ✓ | ✓ | ✕ | ✕ | ✕ | ✕ | ✕ | ✕ | |
| Log Po/w | ✓ | ✓ | ✓ | ✓ | ✓ | ✓ | ✓ | ✓ | ✕ | ✕ | |
| Num. rotatable bonds | ✓ | ✕ | ✓ | ✓ | ✓ | ✓ | ✓ | ✓ | ✕ | ✕ | |
| Num. H-bond acceptors | ✓ | ✓ | ✓ | ✓ | ✓ | ✓ | ✓ | ✓ | ✕ | ✕ | |
| Num. H-bond donors | ✓ | ✓ | ✓ | ✓ | ✓ | ✓ | ✓ | ✓ | ✕ | ✕ | |
| Num. Rings | ✕ | ✕ | ✕ | ✓ | ✓ | ✕ | ✕ | ✕ | ✕ | ✕ | |
| Num. Rigid bonds | ✕ | ✕ | ✕ | ✕ | ✓ | ✕ | ✕ | ✕ | ✕ | ✕ | |
| Num. atoms | ✕ | ✕ | ✕ | ✓ | ✕ | ✕ | ✕ | ✕ | ✕ | ✕ | |
| Bioavailability | Caco-2 Permeability | ✕ | ✕ | ✕ | ✕ | ✓ | ✓ | ✓ | ✓ | ✓ | ✕ |
| Human Intestinal Absorption | ✕ | ✕ | ✓ | ✕ | ✓ | ✓ | ✓ | ✓ | ✓ | ✕ | |
| MDCK Permeability | ✕ | ✕ | ✕ | ✕ | ✓ | ✕ | ✓ | ✓ | ✓ | ✕ | |
| Pgp-substrate | ✕ | ✕ | ✓ | ✕ | ✕ | ✓ | ✓ | ✓ | ✕ | ✕ | |
| Pgp-inhibitor | ✕ | ✕ | ✕ | ✕ | ✕ | ✓ | ✓ | ✓ | ✓ | ✕ | |
| Distribution | Plasma Protein Binding (PPB) | ✕ | ✕ | ✕ | ✕ | ✓ | ✕ | ✓ | ✓ | ✓ | ✕ |
| Excretion | Total Clearance | ✕ | ✕ | ✕ | ✕ | ✓ | ✓ | ✓ | ✓ | ✕ | ✕ |
| Toxicity | Mutagenicity (Ames test) | ✕ | ✕ | ✕ | ✕ | ✓ | ✓ | ✓ | ✓ | ✓ | ✓ |
| Carcinogencity (rat) | ✕ | ✕ | ✕ | ✕ | ✓ | ✕ | ✓ | ✓ | ✓ | ✕ | |
| hERG Blockers | ✕ | ✕ | ✕ | ✕ | ✓ | ✓ | ✓ | ✓ | ✓ | ✕ | |
| Hepatotoxicity | ✕ | ✕ | ✕ | ✕ | ✓ | ✓ | ✓ | ✓ | ✕ | ✕ | |
| A/A | Compound | Structure | Reported Biological Target | In Vitro Enzyme Inhibition Assay IC50 (nM) | In Silico Studies | Year of Publication | Reference |
|---|---|---|---|---|---|---|---|
| 1 | TKI.1 | 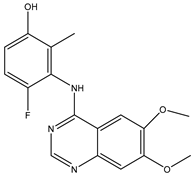 | Ret | 44 | - | 2016 | [29] |
| 2 | TKI.2a | 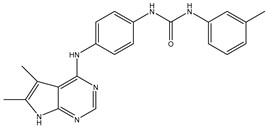 | VEGFR-2 | 11.9 | Docking | 2018 | [30] |
| 3 | TKI.2b | 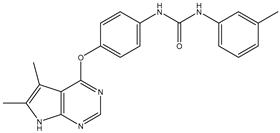 | VEGFR-2 | 13.6 | Docking | 2018 | |
| 4 | TKI.3 |  | VEGFR-2 | 230 | ADMET /Docking | 2021 | [31] |
| 5 | TKI.4 |  | c-Met | <1 | Docking | 2015 | [32] |
| 6 | TKI.5 |  | Dual VEGFR-2/C-Met | 435/ 654 | Docking | 2020 | [33] |
| 7 | TKI.6 | 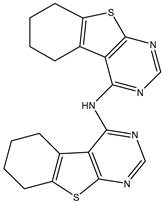 | dual EGFR/HER-2 | 278/ 415 | Docking | 2019 | [34] |
| 8 | TKI.7a | 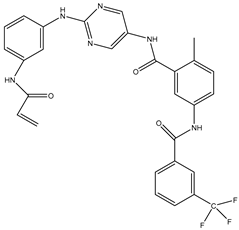 | BTK | 5 | Docking | 2013 | [35] |
| 9 | TKI.7b |  | BTK | 4.4 | Docking | 2013 | |
| 10 | TKI.8 | 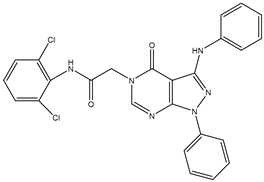 | EGFR | 97 | ADMET /Docking | 2021 | [36] |
| 11 | TKI.9 | 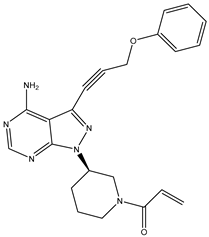 | BTK | 7.95 | Docking | 2018 | [37] |
| 12 | TKI.10 | 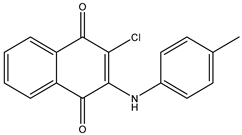 | EGFR | 3.96 | ADMET /Docking | 2022 | [38] |
| 13 | TKI.11 | 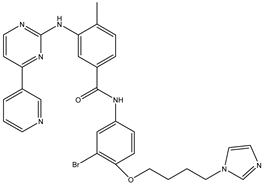 | BCR-ABL | 37 | Docking | 2022 | [39] |
| 14 | TKI.13a | 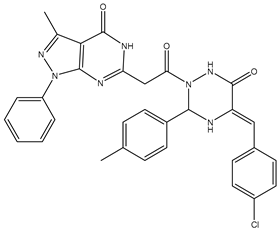 | dual EGFR/HER-2 | 420 | ADMET | 2014 | [40] |
| 15 | TKI.13b | 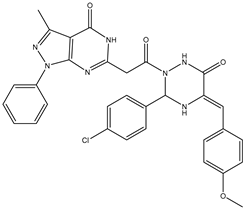 | dual EGFR/HER-2 | 220 | ADMET | 2014 | |
| 16 | TKI.14a | 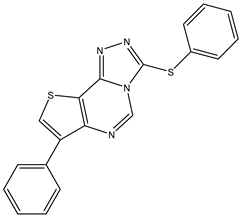 | EGFR | 147 | Docking | 2021 | [41] |
| 17 | TKI.14b | 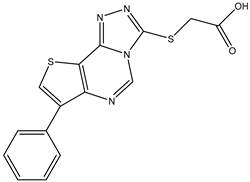 | EGFR | 185 | Docking | 2021 | |
| 18 | TKI.15 | 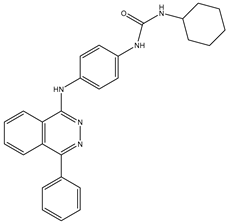 | VEGFR-2 | 140 | Docking | 2020 | [42] |
| 19 | TKI.16 | 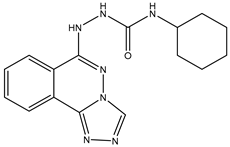 | VEGFR-2 | 110 | Docking | 2017 | [43] |
| 20 | TKI.17 | 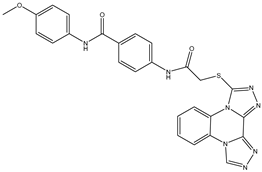 | VEGFR-2 | 3200 | ADMET /Docking | 2021 | [44] |
| 21 | TKI.18 |  | VEGFR-2 | 100 | Docking | 2020 | [45] |
| 22 | TKI.19 |  | VEGFR-2 | 360 | ADMET /Docking | 2020 | [46] |
| 23 | TKI.20a |  | VEGFR-2/FGFR-1/PDGFR-β | 190 | ADMET /Docking | 2020 | [47] |
| 24 | TKI.20b |  | VEGFR-2/FGFR-1/PDGFR-β | 170 | ADMET /Docking | 2020 | |
| 25 | TKI.21a | 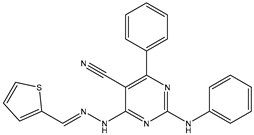 | EGFR | 373 | Docking | 2020 | [48] |
| 26 | TKI.21b | 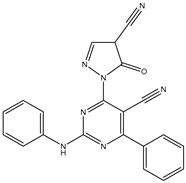 | EGFR | 369 | Docking | 2020 | |
| 27 | AIK.1 |  | BTK | 1 | Docking | 2020 | [49] |
| 28 | AIK.3 | 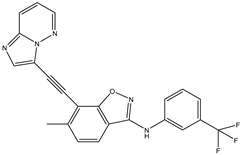 | DDR1 | 13 | Docking | 2019 | [50] |
| 29 | DDK.8 | 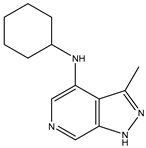 | LRRK2 | 770 | Docking | 2019 | [51] |
| ΤΚΙ.1 | Molinspiration | Molsoft | SwissADME | Mcule | AdmetLab | pkSCM | Deep-PK | admetSAR | MEAN |
|---|---|---|---|---|---|---|---|---|---|
| Molecular weight (MW— gr/mole) | 329.33 | 329.12 | 329.33 | 329.32 | 329.12 | 329.33 | 329.33 | 329.33 | 329.28 |
| Total Polar Surface Area (TPSA—Å2) | 76.51 | 59.73 | 76.50 | 76.50 | 76.50 | nd * | 76.50 | 76.50 | 74.11 |
| Molar Refractivity (MR) | nd | nd | 89.01 | 89.01 | nd | nd | nd | nd | 89.01 |
| Log Po/w | 3.73 | 2.61 | 3.11 | 3.62 | 2.54 | 3.54 | 2.41 | 2.67 | 3.03 |
| Num. rotatable bonds (nRbs) | 4 | nd | 4 | 4 | 4 | 4 | 4 | 4 | 4 |
| Num. Hbond acceptors (nHAc) | 6 | 5 | 6 | 7 | 6 | 6 | 6 | 6 | 6 |
| Num. Hbond donors (nHDr) | 2 | 2 | 2 | 2 | 2 | 2 | 2 | 2 | 2 |
| Num. Rings (nRing) | nd | nd | nd | 3 | 3 | nd | nd | nd | 3 |
| ΤΚΙ.18 | PreADMET | SwissADME | AdmetLab 3.0 | pkSCM | Deep-PK | admetSAR 3.0 | Authors’ Assessment of Overall Evidence |
|---|---|---|---|---|---|---|---|
| Bioavailability | |||||||
| Caco-2 Permeability (LogPapp) | moderate | nd * | high | moderate | moderate | moderate | moderate |
| Human Intestinal Absorption | high | low | high | high | high | high | high |
| MDCK Permeability (Papp) | low | nd | moderate | nd | high | low | low |
| Pgp-substrate | nd | No | nd | Yes | No | No | No |
| Pgp-inhibitor | Yes | nd | nd | Yes | No | Yes | Yes |
| Distribution | |||||||
| Plasma Protein Binding (PPB) | high | nd | high | nd | high | high | high |
| Excretion | |||||||
| Total Clearance | nd | nd | low | moderate | low | low | low |
| ΤΚΙ.20a | PreADMET | T.E.S.T | AdmetLab 3.0 | pkSCM | Deep-PK | admetSAR 3.0 | Authors’ Assessment of Overall Evidence |
|---|---|---|---|---|---|---|---|
| Carcinogenic potential | |||||||
| Mutagenicity (Ames test) | positive | positive | positive | negative | positive | positive | positive |
| Carcinogenicity (rat) | negative | nd * | positive | nd | negative | negative | negative |
| Organ toxicity | |||||||
| hERG Blockers | active | nd | inactive | inactive | inactive | inactive | inactive |
| Hepatotoxicity | nd | nd | positive | positive | positive | positive | positive |
| ID | Druglikeness | |||||||
|---|---|---|---|---|---|---|---|---|
| Lipinski Rule | Ghose/CMC-like Rule | Veber Rule | Egan Rule | Muegge Rule | MMDR-like Rules | QED | Score 1 | |
| Filgotinib | pass | pass | pass | pass | pass | pass | 0.671 | 6.671 |
| Sunitinib | pass | pass | pass | pass | pass | pass | 0.626 | 6.626 |
| Fruquintinib | pass | pass | pass | pass | pass | pass | 0.55 | 6.550 |
| Lenvatinib | pass | pass | pass | pass | pass | pass | 0.549 | 6.549 |
| Vandetanib | pass | pass | pass | pass | pass | pass | 0.542 | 6.542 |
| Axitinib | pass | pass | pass | pass | pass | pass | 0.524 | 6.524 |
| Gefitinib | pass | pass | pass | pass | pass | pass | 0.518 | 6.518 |
| Asciminib | pass | pass | pass | pass | pass | pass | 0.498 | 6.498 |
| Capivasertib | pass | pass | pass | pass | pass | pass | 0.477 | 6.477 |
| Pexidartinib | pass | pass | pass | pass | pass | pass | 0.466 | 6.466 |
| Pirtobrutinib | pass | pass | pass | pass | pass | pass | 0.448 | 6.448 |
| Erlotinib | pass | pass | pass | pass | pass | pass | 0.418 | 6.418 |
| Tivozanib | pass | pass | pass | pass | pass | pass | 0.388 | 6.388 |
| Momelotinib | pass | pass | pass | pass | pass | pass | 0.598 | 6.598 |
| Tofacitinib | pass | pass | pass | pass | pass | mid-structure | 0.928 | 5.928 |
| Ritlecitinib | pass | pass | pass | pass | pass | mid-structure | 0.845 | 5.845 |
| Abrocitinib | pass | pass | pass | pass | pass | mid-structure | 0.835 | 5.835 |
| Ruxolitinib | pass | pass | pass | pass | pass | mid-structure | 0.8 | 5.800 |
| Upadacitinib | pass | pass | pass | pass | pass | mid-structure | 0.733 | 5.733 |
| Baricitinib | pass | pass | pass | pass | pass | mid-structure | 0.717 | 5.717 |
| Larotrectinib | pass | pass | pass | pass | pass | mid-structure | 0.67 | 5.670 |
| Repotrectinib | pass | pass | pass | pass | pass | mid-structure | 0.648 | 5.648 |
| Lorlatinib | pass | pass | pass | pass | pass | mid-structure | 0.615 | 5.615 |
| Pemigatinib | pass | fail | pass | pass | pass | pass | 0.572 | 5.572 |
| Crizotinib | pass | pass | pass | pass | pass | mid-structure | 0.533 | 5.533 |
| Zanubrutinib | pass | fail | pass | pass | pass | pass | 0.524 | 5.524 |
| Futibatinib | pass | pass | pass | pass | pass | mid-structure | 0.508 | 5.508 |
| Deucravacitinib | pass | pass | pass | fail | pass | pass | 0.496 | 5.496 |
| Pazopanib | pass | pass | pass | pass | pass | mid-structure | 0.492 | 5.492 |
| Capmatinib | pass | pass | pass | pass | pass | mid-structure | 0.489 | 5.489 |
| Ibrutinib | pass | fail | pass | pass | pass | pass | 0.467 | 5.467 |
| Dasatinib | pass | fail | pass | pass | pass | pass | 0.466 | 5.466 |
| Dacomitinib | pass | fail | pass | pass | pass | pass | 0.465 | 5.465 |
| Afatinib | pass | fail | pass | pass | pass | pass | 0.457 | 5.457 |
| Erdafitinib | pass | fail | pass | pass | pass | pass | 0.413 | 5.413 |
| Regorafenib | pass | fail | pass | pass | pass | pass | 0.407 | 5.407 |
| Tepotinib | pass | fail | pass | pass | pass | pass | 0.385 | 5.385 |
| Tucatinib | pass | fail | pass | pass | pass | pass | 0.358 | 5.358 |
| Gilteritinib | 1 violation | fail | pass | pass | pass | pass | 0.428 | 4.928 |
| Bosutinib | 1 violation | fail | pass | pass | pass | pass | 0.379 | 4.879 |
| Selpercatinib | 1 violation | fail | pass | pass | pass | pass | 0.37 | 4.870 |
| Brigatinib | 1 violation | fail | pass | pass | pass | pass | 0.352 | 4.852 |
| Nintedanib | 1 violation | fail | pass | pass | pass | pass | 0.35 | 4.850 |
| Cabozantinib | 1 violation | fail | pass | pass | pass | pass | 0.308 | 4.808 |
| Pralsetinib | 1 violation | fail | pass | pass | pass | pass | 0.307 | 4.807 |
| Pacritinib | pass | fail | pass | pass | pass | mid-structure | 0.538 | 4.538 |
| Acalabrutinib | pass | fail | pass | pass | pass | mid-structure | 0.447 | 4.447 |
| Avapritinib | pass | fail | pass | pass | pass | mid-structure | 0.394 | 4.394 |
| Osimertinib | pass | fail | fail | pass | pass | pass | 0.311 | 4.311 |
| Ponatinib | 1 violation | fail | pass | pass | pass | mid-structure | 0.394 | 3.894 |
| Neratinib | 1 violation | fail | fail | pass | pass | pass | 0.218 | 3.718 |
| Mobocertinib | 1 violation | fail | fail | pass | pass | pass | 0.174 | 3.674 |
| Infigratinib | fail | fail | pass | pass | fail | pass | 0.381 | 3.381 |
| Ripretinib | fail | fail | pass | pass | fail | pass | 0.323 | 3.323 |
| Entrectinib | fail | fail | pass | pass | fail | pass | 0.294 | 3.294 |
| Ceritinib | fail | fail | pass | pass | fail | pass | 0.279 | 3.279 |
| Nilotinib | fail | fail | pass | pass | fail | pass | 0.266 | 3.266 |
| Alectinib | 1 violation | fail | pass | pass | fail | mid-structure | 0.582 | 3.082 |
| Midostaurin | 1 violation | fail | pass | pass | fail | mid-structure | 0.287 | 2.787 |
| Fedratinib | fail | fail | fail | pass | fail | pass | 0.346 | 2.346 |
| Quizatinib | fail | fail | pass | fail | fail | pass | 0.257 | 2.257 |
| Lapatinib | fail | fail | fail | pass | fail | pass | 0.179 | 2.179 |
| Fostamatinib | fail | fail | fail | fail | fail | pass | 0.256 | 1.256 |
| ID | Medicinal Chemistry | ||||
|---|---|---|---|---|---|
| Leadlikeness | GSK Rule | PAINS (SwissADME) | Brenk (SwissADME) | Score 1 | |
| Abrocitinib | pass | pass | pass | pass | 4 |
| Ruxolitinib | pass | pass | pass | pass | 4 |
| Tofacitinib | pass | pass | pass | pass | 4 |
| Baricitinib | fail | pass | pass | pass | 3 |
| Fruquintinib | fail | pass | pass | pass | 3 |
| Repotrectinib | fail | pass | pass | pass | 3 |
| Ritlecitinib | pass | pass | pass | fail | 3 |
| Upadacitinib | fail | pass | pass | pass | 3 |
| Alectinib | fail | fail | pass | pass | 2 |
| Avapritinib | fail | fail | pass | pass | 2 |
| Axitinib | fail | fail | pass | pass | 2 |
| Bosutinib | fail | fail | pass | pass | 2 |
| Capivasertib | fail | fail | pass | pass | 2 |
| Capmatinib | fail | fail | pass | pass | 2 |
| Ceritinib | fail | fail | pass | pass | 2 |
| Dasatinib | fail | fail | pass | pass | 2 |
| Deucravacitinib | fail | fail | pass | pass | 2 |
| Entrectinib | fail | fail | pass | pass | 2 |
| Erdafitinib | fail | fail | pass | pass | 2 |
| Erlotinib | fail | pass | pass | fail | 2 |
| Fedratinib | fail | fail | pass | pass | 2 |
| Filgotinib | fail | fail | pass | pass | 2 |
| Gefitinib | fail | fail | pass | pass | 2 |
| Lapatinib | fail | fail | pass | pass | 2 |
| Larotrectinib | fail | fail | pass | pass | 2 |
| Lenvatinib | fail | fail | pass | pass | 2 |
| Lorlatinib | fail | fail | pass | pass | 2 |
| Midostaurin | fail | fail | pass | pass | 2 |
| Nilotinib | fail | fail | pass | pass | 2 |
| Pazopanib | fail | fail | pass | pass | 2 |
| Pemigatinib | fail | fail | pass | pass | 2 |
| Pexidartinib | fail | fail | pass | pass | 2 |
| Pirtobrutinib | fail | fail | pass | pass | 2 |
| Pralsetinib | fail | fail | pass | pass | 2 |
| Quizatinib | fail | fail | pass | pass | 2 |
| Regorafenib | fail | fail | pass | pass | 2 |
| Ripretinib | fail | fail | pass | pass | 2 |
| Selpercatinib | fail | fail | pass | pass | 2 |
| Sunitinib | fail | pass | pass | fail | 2 |
| Tepotinib | fail | fail | pass | pass | 2 |
| Tivozanib | fail | fail | pass | pass | 2 |
| Tucatinib | fail | fail | pass | pass | 2 |
| Vandetanib | fail | fail | pass | pass | 2 |
| Acalabrutinib | fail | fail | pass | fail | 1 |
| Afatinib | fail | fail | pass | fail | 1 |
| Asciminib | fail | fail | pass | fail | 1 |
| Brigatinib | fail | fail | pass | fail | 1 |
| Cabozantinib | fail | fail | pass | fail | 1 |
| Crizotinib | fail | fail | pass | fail | 1 |
| Dacomitinib | fail | fail | pass | fail | 1 |
| Fostamatinib | fail | fail | pass | fail | 1 |
| Futibatinib | fail | fail | pass | fail | 1 |
| Gilteritinib | fail | fail | fail | pass | 1 |
| Ibrutinib | fail | fail | pass | fail | 1 |
| Infigratinib | fail | fail | fail | pass | 1 |
| Mobocertinib | fail | fail | pass | fail | 1 |
| Neratinib | fail | fail | pass | fail | 1 |
| Nintedanib | fail | fail | pass | fail | 1 |
| Osimertinib | fail | fail | pass | fail | 1 |
| Pacritinib | fail | fail | pass | fail | 1 |
| Ponatinib | fail | fail | pass | fail | 1 |
| Zanubrutinib | fail | fail | pass | fail | 1 |
| Momelotinib | fail | fail | fail | fail | 0 |
| ID | Bioavailability | ||||||
|---|---|---|---|---|---|---|---|
| Caco-2 Permeability | Human Intestinal Absorption (HIA) | MDCK Permeability | Pgp-Substrate | Pgp- Inhibitor | Scoring 1 | Authors’ Assessment of Overall Evidence | |
| Lorlatinib | high | high | high | no | no | 5 | high |
| Ruxolitinib | high | high | high | no | no | 5 | high |
| Baricitinib | high | high | moderate | no | no | 4.5 | high |
| Ritlecitinib | high | high | moderate | no | no | 4.5 | high |
| Abrocitinib | moderate | high | moderate | no | no | 4 | high |
| Capmatinib | high | high | high | yes | yes | 4 | high |
| Deucravacitinib | moderate | high | moderate | no | no | 4 | high |
| Filgotinib | moderate | high | moderate | no | no | 4 | high |
| Fruquintinib | high | high | high | no | yes | 4 | high |
| Futibatinib | high | high | high | no | yes | 4 | high |
| Gefitinib | high | high | high | yes | yes | 4 | high |
| Pemigatinib | high | high | high | yes | yes | 4 | high |
| Pexidartinib | high | high | high | yes | yes | 4 | high |
| Tofacitinib | moderate | high | moderate | no | no | 4 | high |
| Vandetanib | high | high | high | yes | yes | 4 | high |
| Cabozantinib | moderate | high | high | yes | yes | 3.5 | high |
| Erlotinib | high | high | moderate | no | yes | 3.5 | high |
| Fostamatinib | moderate | high | low | no | no | 3.5 | high |
| Infigratinib | moderate | high | high | yes | yes | 3.5 | high |
| Larotrectinib | high | high | moderate | yes | yes | 3.5 | high |
| Momelotinib | high | high | moderate | yes | yes | 3.5 | high |
| Pirtobrutinib | moderate | high | high | yes | yes | 3.5 | high |
| Ripretinib | moderate | high | high | no | yes | 3.5 | high |
| Tepotinib | moderate | high | high | yes | yes | 3.5 | high |
| Tivozanib | moderate | high | high | no | yes | 3.5 | high |
| Acalabrutinib | high | high | low | yes | yes | 3 | high |
| Axitinib | high | high | low | yes | yes | 3 | high |
| Brigatinib | moderate | high | moderate | yes | yes | 3 | high |
| Ceritinib | moderate | high | moderate | yes | yes | 3 | high |
| Crizotinib | high | high | low | yes | yes | 3 | high |
| Dacomitinib | high | high | low | yes | yes | 3 | high |
| Fedratinib | moderate | high | moderate | yes | yes | 3 | high |
| Nilotinib | moderate | high | moderate | yes | yes | 3 | high |
| Pacritinib | high | high | low | yes | yes | 3 | high |
| Ponatinib | moderate | high | moderate | yes | yes | 3 | high |
| Pralsetinib | moderate | high | moderate | yes | yes | 3 | high |
| Quizatinib | moderate | high | moderate | yes | yes | 3 | high |
| Sunitinib | moderate | high | moderate | yes | yes | 3 | high |
| Tucatinib | high | high | low | yes | yes | 3 | high |
| Afatinib | moderate | high | low | yes | yes | 2.5 | low |
| Alectinib | moderate | high | low | yes | yes | 2.5 | low |
| Asciminib | moderate | high | low | no | yes | 2.5 | low |
| Avapritinib | moderate | high | low | yes | yes | 2.5 | low |
| Bosutinib | moderate | high | low | yes | yes | 2.5 | low |
| Dasatinib | moderate | high | low | yes | yes | 2.5 | low |
| Entrectinib | moderate | high | low | yes | yes | 2.5 | low |
| Erdafitinib | moderate | high | low | yes | yes | 2.5 | low |
| Gilteritinib | moderate | high | low | yes | yes | 2.5 | low |
| Ibrutinib | moderate | high | low | no | yes | 2.5 | low |
| Lapatinib | moderate | high | low | yes | yes | 2.5 | low |
| Midostaurin | moderate | high | low | yes | yes | 2.5 | low |
| Mobocertinib | moderate | high | low | yes | yes | 2.5 | low |
| Neratinib | moderate | high | low | yes | yes | 2.5 | low |
| Nintedanib | moderate | high | low | yes | yes | 2.5 | low |
| Osimertinib | moderate | high | low | yes | yes | 2.5 | low |
| Pazopanib | moderate | high | low | no | yes | 2.5 | low |
| Regorafenib | moderate | high | low | no | yes | 2.5 | low |
| Selpercatinib | moderate | high | low | yes | yes | 2.5 | low |
| Upadacitinib | moderate | high | high | yes | no | 2.5 | low |
| Zanubrutinib | moderate | high | low | yes | yes | 2.5 | low |
| Capivasertib | moderate | high | moderate | yes | no | 2 | low |
| Lenvatinib | moderate | high | moderate | yes | no | 2 | low |
| Repotrectinib | high | high | low | yes | no | 2 | low |
| ID | Distribution | ID | Excretion |
|---|---|---|---|
| Plasma Protein Binding (PPB) 1 | Total Clearance | ||
| Abrocitinib | low | Abrocitinib | high |
| Avapritinib | low | Acalabrutinib | low |
| Baricitinib | low | Afatinib | low |
| Brigatinib | low | Alectinib | high |
| Capivasertib | low | Asciminib | low |
| Crizotinib | low | Avapritinib | high |
| Deucravacitinib | low | Axitinib | low |
| Erdafitinib | low | Baricitinib | high |
| Filgotinib | low | Bosutinib | low |
| Fruquintinib | low | Brigatinib | low |
| Futibatinib | low | Cabozantinib | low |
| Gefitinib | low | Capmatinib | low |
| Gilteritinib | low | Capivasertib | low |
| Larotrectinib | low | Ceritinib | low |
| Mobocertinib | low | Crizotinib | low |
| Nintedanib | low | Dacomitinib | high |
| Pacritinib | low | Dasatinib | low |
| Pemigatinib | low | Deucravacitinib | low |
| Repotrectinib | low | Entrectinib | low |
| Ritlecitinib | low | Erdafitinib | low |
| Ruxolitinib | low | Erlotinib | low |
| Sunitinib | low | Fedratinib | low |
| Tofacitinib | low | Filgotinib | low |
| Upadacitinib | low | Fostamatinib | low |
| Vandetanib | low | Fruquintinib | low |
| Zanubrutinib | low | Futibatinib | low |
| Acalabrutinib | high | Gefitinib | low |
| Afatinib | high | Gilteritinib | high |
| Alectinib | high | Ibrutinib | low |
| Asciminib | high | Infigratinib | low |
| Axitinib | high | Lapatinib | low |
| Bosutinib | high | Larotrectinib | low |
| Cabozantinib | high | Lenvatinib | low |
| Capmatinib | high | Lorlatinib | low |
| Ceritinib | high | Midostaurin | low |
| Dacomitinib | high | Mobocertinib | low |
| Dasatinib | high | Momelotinib | low |
| Entrectinib | high | Neratinib | low |
| Erlotinib | high | Nilotinib | low |
| Fedratinib | high | Nintedanib | low |
| Fostamatinib | high | Osimertinib | low |
| Ibrutinib | high | Pacritinib | low |
| Infigratinib | high | Pazopanib | low |
| Lapatinib | high | Pemigatinib | high |
| Lenvatinib | high | Pexidartinib | high |
| Lorlatinib | high | Pirtobrutinib | low |
| Midostaurin | high | Ponatinib | low |
| Momelotinib | high | Pralsetinib | low |
| Neratinib | high | Quizatinib | low |
| Nilotinib | high | Regorafenib | low |
| Osimertinib | high | Repotrectinib | low |
| Pazopanib | high | Ripretinib | low |
| Pexidartinib | high | Ritlecitinib | low |
| Pirtobrutinib | high | Ruxolitinib | high |
| Ponatinib | high | Selpercatinib | low |
| Pralsetinib | high | Sunitinib | high |
| Quizatinib | high | Tepotinib | high |
| Regorafenib | high | Tivozanib | low |
| Ripretinib | high | Tofacitinib | high |
| Selpercatinib | high | Tucatinib | low |
| Tepotinib | high | Upadacitinib | low |
| Tivozanib | high | Vandetanib | high |
| Tucatinib | high | Zanubrutinib | low |
| ID | Toxicity | ||||
|---|---|---|---|---|---|
| Carcinogenic Potential | Organ Toxicity | Score 1 | |||
| Ames Test | Carcinogencity (Rat) | hERG Blockers | Hepatotoxicity | ||
| Baricitinib | negative | negative | inactive | negative | 4 |
| Brigatinib | negative | negative | inactive | negative | 4 |
| Dasatinib | negative | negative | inactive | negative | 4 |
| Tofacitinib | negative | negative | inactive | negative | 4 |
| Abrocitinib | negative | negative | inactive | positive | 3 |
| Bosutinib | negative | negative | active | negative | 3 |
| Capivasertib | negative | negative | active | negative | 3 |
| Dacomitinib | negative | negative | active | negative | 3 |
| Deucravacitinib | negative | negative | inactive | positive | 3 |
| Entrectinib | negative | negative | active | negative | 3 |
| Filgotinib | negative | positive | inactive | negative | 3 |
| Fostamatinib | negative | negative | inactive | positive | 3 |
| Neratinib | negative | negative | active | negative | 3 |
| Nilotinib | negative | negative | active | negative | 3 |
| Pemigatinib | negative | positive | inactive | negative | 3 |
| Ponatinib | negative | negative | active | negative | 3 |
| Regorafenib | negative | negative | inactive | positive | 3 |
| Ruxolitinib | negative | positive | inactive | negative | 3 |
| Selpercatinib | positive | negative | inactive | negative | 3 |
| Tepotinib | negative | negative | active | negative | 3 |
| Upadacitinib | negative | positive | inactive | negative | 3 |
| Acalabrutinib | positive | negative | active | negative | 2 |
| Alectinib | negative | positive | active | negative | 2 |
| Avapritinib | negative | positive | active | negative | 2 |
| Axitinib | positive | negative | inactive | positive | 2 |
| Ceritinib | negative | negative | active | positive | 2 |
| Crizotinib | positive | negative | active | negative | 2 |
| Erdafitinib | negative | positive | active | negative | 2 |
| Fedratinib | negative | negative | active | positive | 2 |
| Futibatinib | positive | negative | active | negative | 2 |
| Gefitinib | positive | negative | active | negative | 2 |
| Infigratinib | negative | negative | active | positive | 2 |
| Lapatinib | positive | negative | inactive | positive | 2 |
| Lorlatinib | positive | positive | inactive | negative | 2 |
| Midostaurin | negative | positive | active | negative | 2 |
| Nintedanib | negative | negative | active | positive | 2 |
| Pazopanib | negative | positive | inactive | positive | 2 |
| Pexidartinib | negative | negative | active | positive | 2 |
| Quizatinib | negative | positive | active | negative | 2 |
| Vandetanib | negative | positive | active | negative | 2 |
| Zanubrutinib | positive | negative | active | negative | 2 |
| Afatinib | positive | negative | active | positive | 1 |
| Asciminib | positive | positive | active | negative | 1 |
| Capmatinib | positive | positive | active | negative | 1 |
| Erlotinib | positive | positive | active | negative | 1 |
| Fruquintinib | positive | positive | inactive | positive | 1 |
| Gilteritinib | positive | positive | active | negative | 1 |
| Larotrectinib | positive | positive | inactive | positive | 1 |
| Lenvatinib | positive | positive | active | negative | 1 |
| Mobocertinib | negative | positive | active | positive | 1 |
| Momelotinib | positive | positive | inactive | positive | 1 |
| Pacritinib | negative | positive | active | positive | 1 |
| Pirtobrutinib | positive | positive | active | negative | 1 |
| Pralsetinib | negative | positive | active | positive | 1 |
| Ripretinib | positive | positive | inactive | positive | 1 |
| Ritlecitinib | positive | positive | inactive | positive | 1 |
| Tivozanib | negative | positive | active | positive | 1 |
| Tucatinib | negative | positive | active | positive | 1 |
| Cabozantinib | negative | positive | active | positive | 1 |
| Ibrutinib | positive | positive | active | positive | 0 |
| Osimertinib | positive | positive | active | positive | 0 |
| Repotrectinib | positive | positive | active | positive | 0 |
| Sunitinib | positive | positive | active | positive | 0 |
| Drug | Physicochemical Properties | ||||||||
|---|---|---|---|---|---|---|---|---|---|
| Molecular Weight (g/mol) | TPSA (Å2) | Molar Refractivity | Log Po/w | ||||||
| Calculated DrugBank (yi) | Predicted () | Calculated DrugBank (yi) | Predicted () | Calculated DrugBank (yi) | Predicted () | Experi-mental (yi) | Predicted () | Molinspi-Ration/Molsoft () | |
| Abrocitinib | 323.42 | 323.35 | 90.98 | 91.35 | 86.00 | 86.59 | * | 1.56 | - |
| Acalabrutinib | 465.52 | 465.43 | 118.51 | 114.06 | 135.72 | 136.51 | 0.49 | 3.04 | 2.50 |
| Afatinib | 485.94 | 485.75 | 88.61 | 86.09 | 131.38 | 129.90 | * | 3.95 | - |
| Alectinib | 482.62 | 482.54 | 72.36 | 69.80 | 155.11 | 149.50 | * | 5.00 | - |
| Asciminib | 449.84 | 449.66 | 103.37 | 100.27 | 104.81 | 113.26 | * | 3.20 | - |
| Avapritinib | 498.57 | 498.48 | 106.29 | 102.86 | 164.55 | 144.37 | * | 2.58 | - |
| Axitinib | 386.47 | 386.39 | 70.67 | 76.06 | 115.14 | 112.82 | * | 4.04 | - |
| Baricitinib | 371.42 | 371.35 | 120.56 | 119.33 | 105.55 | 98.51 | * | 0.63 | - |
| Bosutinib | 530.45 | 530.08 | 82.88 | 80.03 | 142.12 | 150.65 | 3.34 | 4.59 | 4.55 |
| Brigatinib | 584.10 | 583.89 | 85.86 | 86.30 | 164.77 | 176.58 | 5.17 | 4.08 | 4.53 |
| Cabozantinib | 501.51 | 501.42 | 98.78 | 95.78 | 136.12 | 136.59 | * | 4.49 | - |
| Capivasertib | 428.92 | 428.73 | 120.16 | 114.08 | 116.97 | 118.97 | * | 1.67 | - |
| Capmatinib | 412.43 | 412.35 | 85.07 | 81.96 | 125.27 | 113.93 | * | 2.94 | - |
| Ceritinib | 558.14 | 557.91 | 105.24 | 104.90 | 153.86 | 158.71 | * | 5.62 | - |
| Crizotinib | 450.34 | 450.04 | 77.99 | 75.79 | 128.43 | 120.72 | 1.83 | 4.27 | 3.43 |
| Dacomitinib | 469.94 | 469.75 | 79.38 | 77.06 | 129.91 | 132.73 | 3.92 | 4.96 | 4.90 |
| Dasatinib | 488.01 | 487.80 | 106.51 | 111.29 | 133.08 | 138.63 | 1.80 | 3.39 | 3.50 |
| Deucravacitinib | 425.47 | 424.64 | 135.95 | 132.40 | 138.38 | 113.15 | * | 1.82 | - |
| Entrectinib | 560.65 | 560.54 | 85.52 | 83.34 | 161.24 | 163.44 | * | 4.88 | - |
| Erdafitinib | 446.56 | 446.47 | 77.33 | 74.91 | 139.32 | 131.48 | * | 4.00 | - |
| Erlotinib | 393.44 | 393.37 | 74.73 | 72.77 | 107.79 | 111.40 | 2.70 | 2.93 | 2.50 |
| Fedratinib | 524.68 | 524.58 | 108.48 | 108.45 | 147.88 | 151.66 | * | 4.97 | - |
| Filgotinib | 425.51 | 425.42 | 96.67 | 96.15 | 126.12 | 118.09 | * | 1.98 | - |
| Fostamatinib | 580.46 | 580.39 | 186.72 | 183.88 | 137.1 | 141.80 | * | 2.30 | - |
| Fruquintinib | 393.40 | 393.33 | 95.71 | 92.80 | 106.25 | 106.77 | * | 2.92 | - |
| Futibatinib | 418.46 | 418.39 | 108.39 | 104.89 | 122.82 | 119.66 | * | 2.22 | - |
| Gefitinib | 446.90 | 446.72 | 68.74 | 66.93 | 117.51 | 121.66 | 3.20 | 4.06 | 3.82 |
| Gilteritinib | 552.72 | 552.63 | 121.11 | 117.42 | 159.84 | 168.43 | 4.35 | 2.67 | 3.04 |
| Ibrutinib | 440.51 | 440.43 | 99.16 | 95.66 | 138.07 | 131.01 | 3.97 | 3.85 | 3.49 |
| Infigratinib | 560.48 | 560.16 | 95.09 | 92.08 | 152.71 | 159.27 | * | 4.85 | - |
| Lapatinib | 581.06 | 580.83 | 106.35 | 105.71 | 152.42 | 153.88 | 5.40 | 5.67 | 5.64 |
| Larotrectinib | 428.44 | 428.38 | 86 | 82.90 | 122.96 | 117.01 | * | 2.57 | - |
| Lenvatinib | 426.86 | 426.67 | 115.57 | 111.99 | 112.21 | 112.86 | 3.30 | 3.24 | 3.14 |
| Lorlatinib | 406.42 | 406.35 | 110.06 | 106.65 | 121.17 | 111.44 | * | 2.15 | - |
| Midostaurin | 570.65 | 571.79 | 77.73 | 74.48 | 162.61 | 169.20 | 5.89 | 4.74 | 4.66 |
| Mobocertinib | 585.71 | 585.61 | 113.85 | 110.30 | 171.52 | 171.32 | * | 4.52 | - |
| Momelotinib | 414.47 | 414.39 | 103.17 | 100.20 | 118.46 | 120.29 | * | 2.61 | - |
| Neratinib | 557.05 | 556.84 | 112.4 | 108.35 | 157.29 | 157.05 | * | 4.80 | - |
| Nilotinib | 529.52 | 529.44 | 97.62 | 94.10 | 152.85 | 141.08 | 5.01 | 5.33 | 5.14 |
| Nintedanib | 539.62 | 539.54 | 94.22 | 92.56 | 159.1 | 167.00 | 3.00 | 3.17 | 3.5 |
| Osimertinib | 499.62 | 499.53 | 87.55 | 84.72 | 150.32 | 150.43 | * | 3.92 | - |
| Pacritinib | 472.59 | 472.50 | 68.74 | 67.92 | 139.43 | 143.91 | * | 4.29 | - |
| Pazopanib | 437.52 | 437.43 | 119.03 | 118.07 | 132.18 | 121.50 | * | 3.29 | - |
| Pemigatinib | 487.51 | 487.43 | 83.16 | 80.71 | 125.32 | 136.22 | * | 2.99 | - |
| Pexidartinib | 417.82 | 417.64 | 66.49 | 63.64 | 105.89 | 104.94 | * | 4.31 | - |
| Pirtobrutinib | 479.44 | 479.36 | 125.26 | 121.68 | 127.89 | 115.16 | * | 3.22 | - |
| Ponatinib | 532.56 | 532.48 | 65.77 | 63.49 | 152.63 | 150.10 | * | 4.45 | - |
| Pralsetinib | 533.61 | 533.52 | 135.53 | 131.05 | 146.12 | 143.26 | * | 3.52 | - |
| Quizatinib | 560.67 | 560.57 | 106.16 | 110.87 | 168.24 | 160.37 | * | 5.70 | - |
| Regorafenib | 482.82 | 482.63 | 92.35 | 89.51 | 114.73 | 112.44 | * | 5.06 | - |
| Repotrectinib | 355.37 | 355.30 | 80.55 | 78.61 | 106.42 | 100.58 | * | 2.28 | - |
| Ripretinib | 510.37 | 510.04 | 86.36 | 85.05 | 133.78 | 133.19 | 5.63 | 4.95 | 5.29 |
| Ritlecitinib | 285.35 | 285.30 | 73.91 | 71.52 | 82.84 | 86.07 | * | 1.52 | - |
| Ruxolitinib | 306.37 | 306.32 | 83.18 | 80.38 | 98.01 | 87.66 | * | 2.41 | - |
| Selpercatinib | 525.61 | 525.52 | 112.04 | 107.85 | 158.75 | 152.98 | * | 3.35 | - |
| Sunitinib | 398.47 | 398.41 | 77.23 | 75.97 | 116.27 | 116.31 | * | 3.00 | - |
| Tepotinib | 492.58 | 492.53 | 94.71 | 93.92 | 154.74 | 145.45 | * | 3.95 | - |
| Tivozanib | 454.86 | 454.68 | 107.74 | 104.42 | 120.85 | 120.00 | 4.31 | 4.60 | 4.28 |
| Tofacitinib | 312.37 | 312.32 | 88.91 | 85.66 | 87.8 | 91.20 | 1.81 | 1.03 | 0.65 |
| Tucatinib | 480.53 | 480.45 | 110.85 | 106.83 | 148.37 | 141.66 | 3.62 | 4.52 | 4.46 |
| Upadacitinib | 380.38 | 380.32 | 78.32 | 74.97 | 93.03 | 96.54 | * | 2.50 | - |
| Vandetanib | 475.35 | 475.05 | 59.51 | 57.76 | 118.63 | 123.26 | 5.00 | 4.63 | 4.67 |
| Zanubrutinib | 471.56 | 471.48 | 102.48 | 99.64 | 146.25 | 141.35 | * | 3.49 | - |
| Average () | 467.46 | - | 96.66 | - | 132.43 | - | 3.69 | - | - |
| Molecular Weight | |||||||||
| Model | Coefficients | Evaluation Metrics | 95.0% Confidence Interval for B | ||||||
| B | r | R2 | RMSE | MAE | RMSEbaseline | Lower Bound | Upper Bound | ||
| 1 | (Constant) | 0.159 | - | - | - | - | - | −0.172 | 0.489 |
| MW predicted | 1.000 | 1.000 | 1.000 | 0.230 | 0.152 | 72.469 | 0.999 | 1.001 | |
| Dependent Variable: MWdrugbank | |||||||||
| y = 1.000 (±0.001) × x + 0.159 (±0.331) | |||||||||
| TPSA | |||||||||
| 1 | (Constant) | 1.057 | - | - | - | - | - | −1.333 | 3.447 |
| TPSA predicted | 1.012 | 0.995 | 0.991 | 2.995 | 2.712 | 21.090 | 0.988 | 1.037 | |
| Dependent Variable: TPSAdrugbank | |||||||||
| y = 1.012 (±0.024) × x + 1.057 (±2.190) | |||||||||
| Molar Refractivity | |||||||||
| 1 | (Constant) | 12.326 | - | - | - | - | - | 2.058 | 22.593 |
| MR predicted | 0.917 | 0.950 | 0.902 | 7.249 | 5.521 | 21.919 | 0.840 | 0.994 | |
| Dependent Variable: MRdrugbank | |||||||||
| y = 0.917 (±0.077) × x + 12.326 (±10.268) | |||||||||
| Log Po/w | |||||||||
| Model | Coefficients | Evaluation Metrics | 95.0% Confidence Interval for B | ||||||
| B | r | R2 | RMSE | MAE | RMSEbaseline | Lower Bound | Upper Bound | ||
| 1 | (Constant) | 2.213 | - | - | - | - | - | 1.098 | 3.327 |
| Experimental | 0.481 | 0.645 | 0.417 | 1.142 | 0.892 | 1.430 | 0.199 | 0.763 | |
| Dependent Variable: Log Po/w Predicted | |||||||||
| y = 0.481 (±0.282) × x + 2.213 (±1.115) | |||||||||
| Log Po/w (Molinspiration–Molsoft) | |||||||||
| 1 | (Constant) | 1.658 | - | - | - | - | - | 0.615 | 2.702 |
| Experimental | 0.603 | 0.750 | 0.562 | 0.970 | 0.786 | 1.430 | 0.339 | 0.867 | |
| Dependent Variable: Molinspiration–Molsoft | |||||||||
| y = 0.603 (±0.264) × x + 1.658 (±1.043) | |||||||||
| Drug | Pharmacokinetic Properties | Toxicity | ||||||||||||
|---|---|---|---|---|---|---|---|---|---|---|---|---|---|---|
| Bioavail-Ability 1 | Plasma Protein Binding (PPB) 1 | Clearance (L/h) 1 | Ames Test 1 | Carcinogenicity 1 | hERG Blockers (Human Ether-à-go-go-Related Gene) 1 | Hepatotoxicity 1 | ||||||||
| Exp | Pred | Exp | Pred | Exp | Pred | Exp | Pred | Exp | Pred | Exp | Pred | Exp | Pred | |
| Abrocitinib | high | high | low | low | * | high | negative | negative | negative | negative | * | negative | negative | positive |
| Acalabrutinib | low | high | high | high | high | low | * | positive | negative | negative | * | positive | positive | negative |
| Afatinib | high | low | high | high | high | low | * | positive | * | negative | * | positive | positive | positive |
| Alectinib | low | low | high | high | high | high | negative | negative | * | positive | * | positive | positive | negative |
| Asciminib | * | low | high | high | low | low | negative | positive | * | positive | * | positive | negative | negative |
| Avapritinib | high | low | high | low | low | high | negative | negative | * | positive | * | positive | negative | negative |
| Axitinib | high | high | high | high | low | low | positive | positive | * | negative | negative | negative | positive | positive |
| Baricitinib | high | high | low | low | low | high | negative | negative | negative | negative | * | negative | negative | negative |
| Bosutinib | low | low | high | high | high | low | negative | negative | negative | negative | negative | positive | positive | negative |
| Brigatinib | low | high | low | low | low | low | negative | negative | * | negative | * | negative | positive | negative |
| Cabozantinib | high | high | high | high | low | low | negative | negative | negative | positive | * | positive | positive | positive |
| Capivasertib | low | low | low | low | low | low | * | negative | negative | negative | * | positive | negative | negative |
| Capmatinib | high | high | high | high | low | low | * | positive | negative | positive | * | positive | positive | negative |
| Ceritinib | * | high | high | high | low | low | negative | negative | * | negative | * | positive | positive | positive |
| Crizotinib | low | high | high | low | high | low | negative | positive | * | negative | positive | positive | positive | negative |
| Dacomitinib | high | high | high | high | low | high | negative | negative | * | negative | * | positive | negative | negative |
| Dasatinib | high | low | high | high | high | low | negative | negative | positive | negative | negative | negative | positive | negative |
| Deucravacitinib | high | high | low | low | low | low | negative | negative | negative | negative | * | negative | negative | positive |
| Entrectinib | * | low | high | high | low | low | negative | negative | * | negative | * | positive | positive | negative |
| Erdafitinib | high | low | high | low | low | low | negative | negative | * | positive | * | positive | negative | negative |
| Erlotinib | high | high | high | high | low | low | negative | positive | positive | positive | negative | positive | positive | negative |
| Fedratinib | * | high | high | high | low | low | negative | negative | negative | negative | * | positive | positive | positive |
| Filgotinib | * | high | * | low | * | low | * | negative | * | positive | * | negative | * | negative |
| Fostamatinib | high | high | high | high | * | low | negative | negative | negative | negative | * | negative | positive | positive |
| Fruquintinib | * | high | high | low | low | low | negative | positive | * | positive | * | negative | positive | positive |
| Futibatinib | * | high | high | low | low | low | negative | positive | * | negative | * | positive | negative | negative |
| Gefitinib | high | high | low | low | * | low | negative | positive | positive | negative | positive | positive | positive | negative |
| Gilteritinib | * | low | high | low | low | high | negative | positive | * | positive | * | positive | negative | negative |
| Ibrutinib | low | low | high | high | high | low | negative | positive | negative | positive | * | positive | positive | positive |
| Infigratinib | * | high | high | high | low | low | negative | negative | * | negative | * | positive | negative | positive |
| Lapatinib | * | low | high | high | * | low | negative | positive | negative | negative | positive | negative | positive | positive |
| Larotrectinib | low | high | low | low | high | low | negative | positive | * | positive | * | negative | positive | positive |
| Lenvatinib | high | low | high | high | * | low | negative | positive | * | positive | * | positive | positive | negative |
| Lorlatinib | high | high | low | high | low | low | negative | positive | * | positive | * | negative | positive | negative |
| Midostaurin | * | low | high | high | * | low | negative | negative | * | positive | * | positive | negative | negative |
| Mobocertinib | low | low | high | low | high | low | negative | negative | * | positive | * | positive | negative | positive |
| Momelotinib | * | high | high | high | high | low | negative | positive | negative | positive | * | negative | positive | positive |
| Neratinib | high | low | high | high | high | low | negative | negative | negative | negative | * | positive | positive | negative |
| Nilotinib | low | high | high | high | low | low | negative | negative | negative | negative | positive | positive | positive | negative |
| Nintedanib | low | low | high | low | high | low | negative | negative | negative | negative | * | positive | positive | positive |
| Osimertinib | low | low | high | high | low | low | negative | positive | positive | positive | * | positive | * | positive |
| Pacritinib | * | high | high | low | low | low | negative | negative | negative | positive | * | positive | negative | positive |
| Pazopanib | low | low | high | high | * | low | negative | negative | positive | positive | negative | negative | positive | positive |
| Pemigatinib | low | high | high | low | low | high | negative | negative | * | positive | * | negative | negative | negative |
| Pexidartinib | * | high | high | high | low | high | negative | negative | negative | negative | * | positive | negative | positive |
| Pirtobrutinib | high | high | high | high | low | low | negative | positive | * | positive | * | positive | positive | negative |
| Ponatinib | * | high | high | high | * | low | negative | negative | positive | negative | * | positive | negative | negative |
| Pralsetinib | * | high | high | high | low | low | negative | negative | * | positive | * | positive | positive | positive |
| Quizatinib | * | high | * | high | * | low | * | negative | * | positive | * | positive | * | negative |
| Regorafenib | high | low | high | high | * | low | * | negative | * | negative | negative | negative | positive | positive |
| Repotrectinib | low | low | high | low | low | low | negative | positive | * | positive | * | positive | positive | positive |
| Ripretinib | high | high | high | high | low | low | negative | positive | * | positive | * | negative | negative | positive |
| Ritlecitinib | high | high | low | low | * | low | negative | positive | positive | positive | * | negative | negative | positive |
| Ruxolitinib | high | high | high | low | low | high | negative | negative | negative | positive | negative | negative | negative | negative |
| Selpercatinib | high | low | high | high | low | low | negative | positive | negative | negative | * | negative | positive | negative |
| Sunitinib | high | high | high | low | low | high | negative | positive | positive | positive | positive | positive | positive | positive |
| Tepotinib | high | high | high | high | low | high | * | negative | * | negative | * | positive | positive | negative |
| Tivozanib | high | high | high | high | low | low | * | negative | * | positive | * | positive | negative | positive |
| Tofacitinib | high | high | low | low | * | high | negative | negative | negative | negative | * | negative | negative | negative |
| Tucatinib | * | high | high | high | high | low | negative | negative | * | positive | * | positive | positive | positive |
| Upadacitinib | * | low | low | low | * | low | negative | negative | negative | positive | * | negative | negative | negative |
| Vandetanib | high | high | high | low | * | high | negative | negative | * | positive | positive | positive | negative | negative |
| Zanubrutinib | * | low | high | low | high | low | negative | positive | * | negative | * | positive | positive | negative |
| Top 24—Druglikeness | Top 16—Med. Chemistry | Top 21—Bioavailability | Top 2—Distribution | Top 9—Overall Toxicity | |
|---|---|---|---|---|---|
| 1 | AIK.1 | TKI.16 | TKI.16 | TKI.16 | TKI.19 |
| 2 | TKI.19 | DDK8 | DDK.8 | AIK.1 | DDK8 |
| 3 | DDK8 | TKI.19 | TKI.19 | TKI.4 | |
| 4 | TKI.21b | TKI.21b | TKI.21b | TKI.21b | |
| 5 | TKI.16 | AIK.1 | TKI.4 | TKI.8 | |
| 6 | TKI.4 | TKI.4 | AIK.1 | TKI.20b | |
| 7 | TKI.20b | TKI.14b | TKI.14a | TKI.18 | |
| 8 | TKI.1 | TKI.8 | TKI.14b | TKI.13b | |
| 9 | TKI.14b | TKI.6 | TKI.6 | TKI.13a | |
| 10 | TKI.14a | TKI.2a | TKI.1 | ||
| 11 | TKI.2b | TKI.2b | TKI.20b | ||
| 12 | TKI.2a | TKI.14a | TKI.2a | ||
| 13 | TKI.8 | TKI.1 | TKI.2b | ||
| 14 | TKI.6 | TKI.17 | TKI.10 | ||
| 15 | TKI.20a | TKI.11 | TKI.5 | ||
| 16 | TKI.10 | TKI.15 | TKI.21a | ||
| 17 | TKI.5 | TKI.9 | |||
| 18 | TKI.9 | TKI.20a | |||
| 19 | TKI.21a | AIK.3 | |||
| 20 | TKI.17 | TKI.3 | |||
| 21 | TKI.18 | TKI.7a | |||
| 22 | TKI.13a | ||||
| 23 | TKI.13b | ||||
| 24 | TKI.11 | ||||
| D-ADMET Screening | |||||
|---|---|---|---|---|---|
| A/A | Compound | Structure | Criteria Meeting (≥60%) | Violation Points | Reported Biological Target |
| 1 | TKI.1 |  | 60 | Distribution, Overall Toxicity | Ret |
| 2 | TKI.2a | 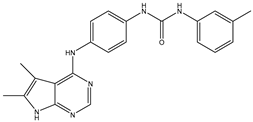 | 60 | Distribution, Overall Toxicity | VEGFR-2 |
| 3 | TKI.2b | 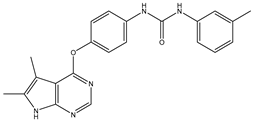 | 60 | Distribution, Overall Toxicity | VEGFR-2 |
| 4 | TKI.4 |  | 80 | Distribution | c-Met |
| 5 | TKI.6 | 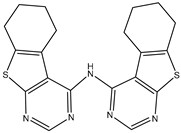 | 60 | Distribution, Overall Toxicity | dual EGFR/HER2 |
| 6 | TKI.8 | 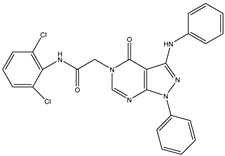 | 60 | Distribution, Bioavailability | EGFR |
| 7 | TKI.14a |  | 60 | Distribution, Overall Toxicity | EGFR |
| 8 | TKI.14b | 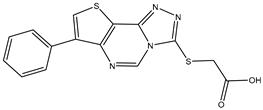 | 60 | Distribution, Overall Toxicity | |
| 9 | TKI.16 | 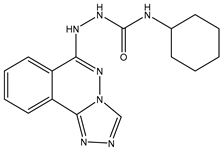 | 80 | Overall Toxicity | VEGFR-2 |
| 10 | TKI.19 | 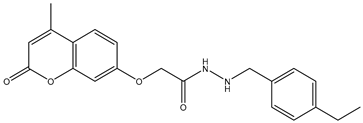 | 80 | Distribution | VEGFR-2 |
| 11 | TKI.20b |  | 60 | Medicinal Chemsistry, Distribution | VEGFR-2/FGFR-1/PDGFR-β |
| 12 | TKI.21b | 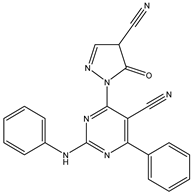 | 80 | Distribution | EGFR |
| 13 | AIK.1 |  | 80 | Overall Toxicity | BTK |
| 14 | DDK.8 |  | 80 | Distribution | LRRK2 |
| Target | Drug | Affinity (kcal/mol) | CNN Pose Score | CNN Affinity | Cross-Docking RMSD (Å) |
|---|---|---|---|---|---|
| VEGFR-2 (PDB ID:4ASE) | Axitinib | −8.53 | 0.842 | 7.634 | 5.500 |
| Cabozatinib | −11.86 | 0.913 | 7.725 | 1.059 | |
| Fruquitinib | −8.74 | 0.906 | 7.672 | 1.499 | |
| Lenvatinib | −11.03 | 0.957 | 8.049 | 2.776 | |
| Pazopanib | −8.69 | 0.856 | 7.407 | 3.730 | |
| Regorafenib | −11.24 | 0.890 | 7.833 | 1.688 | |
| Sorafenib | −11.25 | 0.882 | 7.588 | 2.536 | |
| Sunitinib | −7.35 | 0.728 | 7.312 | 5.250 | |
| Vandetanib | −10.42 | 0.814 | 8.062 | 1.514 | |
| HER2 (PDB ID:7PCD) | Afatinib | −7.61 | 0.925 | 7.381 | 2.906 |
| Capivasertib | −9.71 | 0.898 | 7.45 | 2.537 | |
| Lapatinib | −9.98 | 0.858 | 7.609 | 2.022 | |
| Neratinib | −7.51 | 0.780 | 7.875 | 2.432 | |
| Tucatinib | −10.64 | 0.750 | 7.634 | 1.494 | |
| EGFR (PDB ID:7T4I) | Afatinib | −8.35 | 0.900 | 7.852 | 2.169 |
| Dacomitinib | −8.60 | 0.932 | 8.125 | 2.186 | |
| Gefitinib | −7.93 | 0.983 | 7.986 | 1.862 | |
| Osimertinib | −7.12 | 0.932 | 7.948 | 1.562 |
| Independent Samples Test | |||||||
|---|---|---|---|---|---|---|---|
| Molecular Descriptors | t | df | Significance | Mean Difference | Std. Error Difference | 95% Confidence Interval of the Difference | |
| Two-Sided (p) | Lower | Upper | |||||
| Molecular weight | −0.010 | 47.245 | 0.992 | −0.22 | 21.457 | −43.384 | 42.937 |
| TPSA | 0.962 | 50.804 | 0.341 | 5.31 | 5.520 | −5.774 | 16.392 |
| MR | 0.341 | 51.248 | 0.735 | 2.04 | 5.988 | −9.980 | 14.060 |
| LogPo/w | 3.890 | 64.305 | <0.01 | 1.18 | 0.304 | 0.575 | 1.789 |
| nRB | −0.189 | 51.222 | 0.851 | 0 | 1 | −1.386 | 1.147 |
| nHA | −0.831 | 52.776 | 0.410 | 0 | 0 | −1.114 | 0.462 |
| nHD | 0.520 | 54.216 | 0.605 | 0 | 0 | −0.392 | 0.666 |
| nRings | 0.860 | 60.475 | 0.393 | 0 | 0 | −0.254 | 0.638 |
| nRigidB | 1.420 | 54.802 | 0.161 | 2 | 1 | −0.759 | 4.442 |
| nAtoms | −1.094 | 53.416 | 0.279 | −3 | 3 | −7.969 | 2.344 |
| Independent-Samples Kolmogorov–Smirnov Test | ||||
|---|---|---|---|---|
| Molecular Descriptors | Most Extreme Differences | Significance | ||
| Absolute (D) | Positive | Negative | Two-Sided (p) | |
| Molecular weight | 0.201 | 0.181 | −0.201 | 0.514 |
| TPSA | 0.228 | 0.228 | −0.103 | 0.352 |
| MR | 0.147 | 0.147 | −0.095 | 0.866 |
| LogPo/w | 0.406 | 0.406 | 0.000 | 0.008 |
| nRB | 0.165 | 0.078 | −0.165 | 0.753 |
| nHA | 0.166 | 0.010 | −0.166 | 0.748 |
| nHD | 0.071 | 0.071 | −0.043 | 1.000 |
| nRings | 0.115 | 0.115 | −0.026 | 0.981 |
| nRigidB | 0.210 | 0.210 | −0.043 | 0.453 |
| nAtoms | 0.156 | 0.061 | −0.156 | 0.815 |
Disclaimer/Publisher’s Note: The statements, opinions and data contained in all publications are solely those of the individual author(s) and contributor(s) and not of MDPI and/or the editor(s). MDPI and/or the editor(s) disclaim responsibility for any injury to people or property resulting from any ideas, methods, instructions or products referred to in the content. |
© 2025 by the authors. Licensee MDPI, Basel, Switzerland. This article is an open access article distributed under the terms and conditions of the Creative Commons Attribution (CC BY) license (https://creativecommons.org/licenses/by/4.0/).
Share and Cite
Mavridis, E.; Hadjipavlou-Litina, D. Using a Novel Consensus-Based Chemoinformatics Approach to Predict ADMET Properties and Druglikeness of Tyrosine Kinase Inhibitors. Int. J. Mol. Sci. 2025, 26, 10207. https://doi.org/10.3390/ijms262010207
Mavridis E, Hadjipavlou-Litina D. Using a Novel Consensus-Based Chemoinformatics Approach to Predict ADMET Properties and Druglikeness of Tyrosine Kinase Inhibitors. International Journal of Molecular Sciences. 2025; 26(20):10207. https://doi.org/10.3390/ijms262010207
Chicago/Turabian StyleMavridis, Evangelos, and Dimitra Hadjipavlou-Litina. 2025. "Using a Novel Consensus-Based Chemoinformatics Approach to Predict ADMET Properties and Druglikeness of Tyrosine Kinase Inhibitors" International Journal of Molecular Sciences 26, no. 20: 10207. https://doi.org/10.3390/ijms262010207
APA StyleMavridis, E., & Hadjipavlou-Litina, D. (2025). Using a Novel Consensus-Based Chemoinformatics Approach to Predict ADMET Properties and Druglikeness of Tyrosine Kinase Inhibitors. International Journal of Molecular Sciences, 26(20), 10207. https://doi.org/10.3390/ijms262010207


