Article

Intestinal Ischemia/Reperfusion Injury Influences Hyaluronan Homeostasis in the Rat Brain

1
Department of Medicine and Technological Innovation, University of Insubria, 21100 Varese, Italy
2
Department of Biotechnology and Life Sciences, University of Insubria, 21100 Varese, Italy
3
Department of Medicine and Surgery, University of Insubria, 21100 Varese, Italy
4
Department of Internal Medicine and Therapeutics, University of Pavia, 27100 Pavia, Italy
5
Department of Translational Medicine and Surgery, Catholic University of the Sacred Heart, 00168 Rome, Italy
6
Fondazione Policlinico Universitario A. Gemelli, Istituto di Ricovero e Cura a Carattere Scientifico (IRCCS), Largo Agostino Gemelli 8, 00168 Rome, Italy
7
Neuroscience Center, University of Insubria, 21100 Varese, Italy
*
Author to whom correspondence should be addressed.
These authors contributed equally to this work.
Int. J. Mol. Sci. 2025, 26(20), 10064; https://doi.org/10.3390/ijms262010064
Submission received: 20 June 2025 / Revised: 30 September 2025 / Accepted: 3 October 2025 / Published: 16 October 2025
(This article belongs to the Section Molecular Neurobiology)

Abstract

Intestinal ischemia and reperfusion injury (IRI) can lead to multiple organ dysfunction, including the central nervous system (CNS), where a neuroinflammatory response may develop. Hyaluronan, a glycosaminoglycan component of the extracellular matrix, has been shown to modulate enteric neuronal and immune function during in vivo IRI in the rat small intestine. The aim of this study was to investigate the potential involvement of hyaluronan in the alterations induced by in vivo intestinal IRI in the rat hippocampus and striatum. Mesenteric ischemia was induced in anesthetized adult male rats for 60 min, followed by 24 h of reperfusion. Injured (IRI group), sham-operated (SHAM group), and non-injured (CTR group) animals were treated with the hyaluronan synthesis inhibitor 4-methylumbelliferone (4-MU; 25 mg/kg). In the hippocampus and striatum of the IRI group, levels of both hyaluronan and neurocan, a proteoglycan primarily found in the central nervous system extracellular matrix, as well as the hyaluronan synthesizing enzyme Has2, were significantly downregulated compared to the CTR and SHAM groups. These changes were associated with alterations in the TLR4-NFκB-pIκB pathway, with the effects being more prominent in the hippocampus than in the striatum. Increased levels of IL6, co-localizing with the microglial marker S100β, were observed in both regions and were attenuated by 4-MU only in the hippocampus. Overall, these findings suggest that intestinal IRI may disrupt extracellular matrix homeostasis and induce hyaluronan-mediated enhancement of local proinflammatory signaling, primarily involving IL6 and microglial cells, mainly in the hippocampus. Such changes may contribute to the development of cognitive deficits and memory dysfunction associated with intestinal IRI.

1. Introduction

Intestinal ischemia–reperfusion injury (IRI) is a life-threatening clinical condition that can result from mesenteric artery embolism, intestinal obstruction, sepsis, shock, trauma, and surgery [1]. The initial ischemic insult induces mucosal shedding, barrier dysfunction, and bacterial translocation, accompanied by a prolonged reduction in intestinal blood flow. The subsequent reperfusion phase is critical for rescuing ischemic tissue; however, it also exacerbates cellular injury and vascular and tissue damage [1,2,3]. Intestinal IRI has severe consequences for all the cell types composing the enteric microenvironment, including epithelial and smooth muscle cells, glial cells, and neurons [3,4]. The local production of proinflammatory cytokines, such as Tumor Necrosis Factor-α (TNF-α), Interleukin 6 (IL6), and Interleukin 1β (IL1β), as well as reactive oxygen species (ROS) and nitric oxide (NO), and the increased expression of vascular and intercellular adhesion molecules (such as ICAM-1), are well-established processes that undermine the enteric microenvironment during intestinal IRI [3,4,5,6]. It is now well acknowledged that these inflammatory signaling pathways may also affect distant sites, including the brain, leading to increased blood–brain barrier permeability, permeation of proinflammatory circulating factors, and activation of microglia [7,8,9]. In rat models of intestinal IRI, microglial activation was associated with persistent neuroinflammation and cognitive impairment, despite intestinal recovery [8,9]. These manifestations were linked to alterations in brain levels of proinflammatory factors, increased oxidative stress, apoptosis, and elevated levels of proteins associated with inflammation, including Toll-like receptor 4 (TLR4), the downstream myeloid differentiation factor 88 (MyD88), and phosphorylated nuclear factor kappa B (NF-κB) [9].
Hyaluronan is a ubiquitous extracellular matrix glycosaminoglycan formed by alternating glucuronic acid and N-acetylglucosamine disaccharides by three isoenzymes named hyaluronan synthase 1, 2, and 3 (HAS1, 2, and 3). In the central nervous system (CNS), hyaluronan is widely distributed throughout white matter and also highly concentrated in gray matter, including perineuronal nets [10]. HAS1, HAS2, and HAS3 are located on the plasma membrane of various cell types in the CNS, including glial cells, astrocytes, and more specifically in neurons, exhibiting varying molecular weights and synthesis rates that depend on the specific region of the CNS and developmental stages [11,12,13,14]. Additionally, HAS enzymes are found within the cell, where nascent forms follow the secretory pathway to the membrane, or are recycled from the membrane itself [15,16]. The specific role of each HAS enzyme is still under investigation, but several critical functions of hyaluronan are regulated by HAS2 which is probably the most active enzyme in the body [14]. In the nervous system, hyaluronan, along with chondroitin sulfate proteoglycans (e.g., aggrecan, brevican, neurocan) and link proteins such as the brain-specific link protein (Bral1 and Bral2) and hyaluronan and proteoglycan link protein 1 (HAPLN1), contributes to the formation of perineuronal nets, which are vital for neuronal communication, synaptic function, protein mobility, and protection against oxidative stress [13,17,18]. Additionally, the soft extracellular matrix in the brain, rich in glycosaminoglycans and hyaluronan-associated proteins, is involved in the regulation of cell adhesion, migration, and neurite outgrowth [19,20]. Hyaluronan contributes to the development of the IRI-associated proinflammatory state in the gut by promoting harmful bacterial overgrowth, enhancing neutrophil infiltration, and causing alterations in the architecture and function of myenteric neurons [21,22]. In the enteric nervous system (ENS), alike in the central nervous system, hyaluronan and its interacting molecules contributes to the external architecture of enteric ganglia and also participates in the formation of a perineuronal net surrounding myenteric neurons [21,22,23]. The biological effects of hyaluronan are mediated by a wide range of different hyaluronan cell receptors including cluster differentiation 44 (CD44), receptor for hyaluronan-mediated motility (RHAMM), lymphatic vessel endothelial hyaluronan receptor 1 (LYVE-1), and hyaluronan receptor for endocytosis (HARE). Among these, CD44 is one of the most extensively studied and represents the main hyaluronan receptor expressed in tissues. Furthermore, although TLRs have been extensively studied as pathogen-associated molecular pattern receptors involved in innate immunity, both TLR2 and TLR4 also participate in hyaluronan signaling involving hyaluronan fragments [24]. Interestingly, in the rat gut, IRI-induced enhancement of endogenous hyaluronan levels is involved in the upregulation of TLR2 and TLR4 in the muscularis propria and submucosal layers.
In this context, the aim of this study was to test the hypothesis that intestinal IRI may induce changes in endogenous hyaluronan homeostasis and related proinflammatory pathways in the brain. To this end, we evaluated the effects of temporary occlusion of the superior mesenteric artery in male rats, focusing on the striatum and hippocampus in both the absence and presence of 4-methylumbelliferone (4-MU), which inhibits hyaluronan production in various tissues and cell lines by reducing the cytosolic precursor UDP-glucuronic acid and potentially downregulating the transcription of HAS2 [25,26].

2. Results

2.1. Intestinal IRI Influences Hyaluronan Homeostasis and Perineuronal Net Molecular Components in the Rat Brain

Hyaluronan levels in the striatum and hippocampus were evaluated by using hyaluronan binding protein (HABP). In the hippocampus, HABP stained both neurons and glial cells, as evidenced by the presence of both cytoplasmic and extracellular signal visible in the intercellular region. HABP staining was particularly intense in the CA1 region as shown in Figure 1A,B. Both in the IRI and SHAM groups, HABP staining was significantly reduced with respect to the CTR group, and such reduction was unaffected by 4-MU. In the IRI group, HABP staining was significantly lower than in the SHAM group (Figure 1B). In the IRI and SHAM groups, changes in hyaluronan deposition were associated with a significant reduction in hyaluronan synthase 2 (Has2) mRNA levels, while Has1 and Has3 transcript levels did not change in all experimental conditions compared to CTR values (Figure 2A–C). 4-MU treatment induced a significant reduction in Has2 mRNA levels in CTR, SHAM, and intestinal IRI groups (Figure 2B). No differences in the mRNA levels of hyaluronidase (Hyal) 1,2 and 3, the endoglycosidase enzymes that break down hyaluronan, were observed among all the experimental groups (Figure 2D–F). We next evaluated the transcript expression of two of the major chondroitin sulfate proteoglycan components of the perineuronal nets, aggrecan (Acan) and neurocan (Ncan). In the hippocampus of the different experimental groups, Acan mRNA levels were not significantly different with respect to CTR values (Figure 3A), while Ncan transcript levels showed a trend towards a reduction, which reached significance only in the IRI-4MU group (Figure 3B). NCAN staining in the CA1 region of the hippocampus was observed especially in neurons (Figure 3C,D). In agreement with qRT PCR data, NCAN fluorescence intensity was significantly reduced in the SHAM and IRI groups with respect to CTR values. In all experimental groups, NCAN fluorescence further decreases in the presence of 4-MU (Figure 3C).
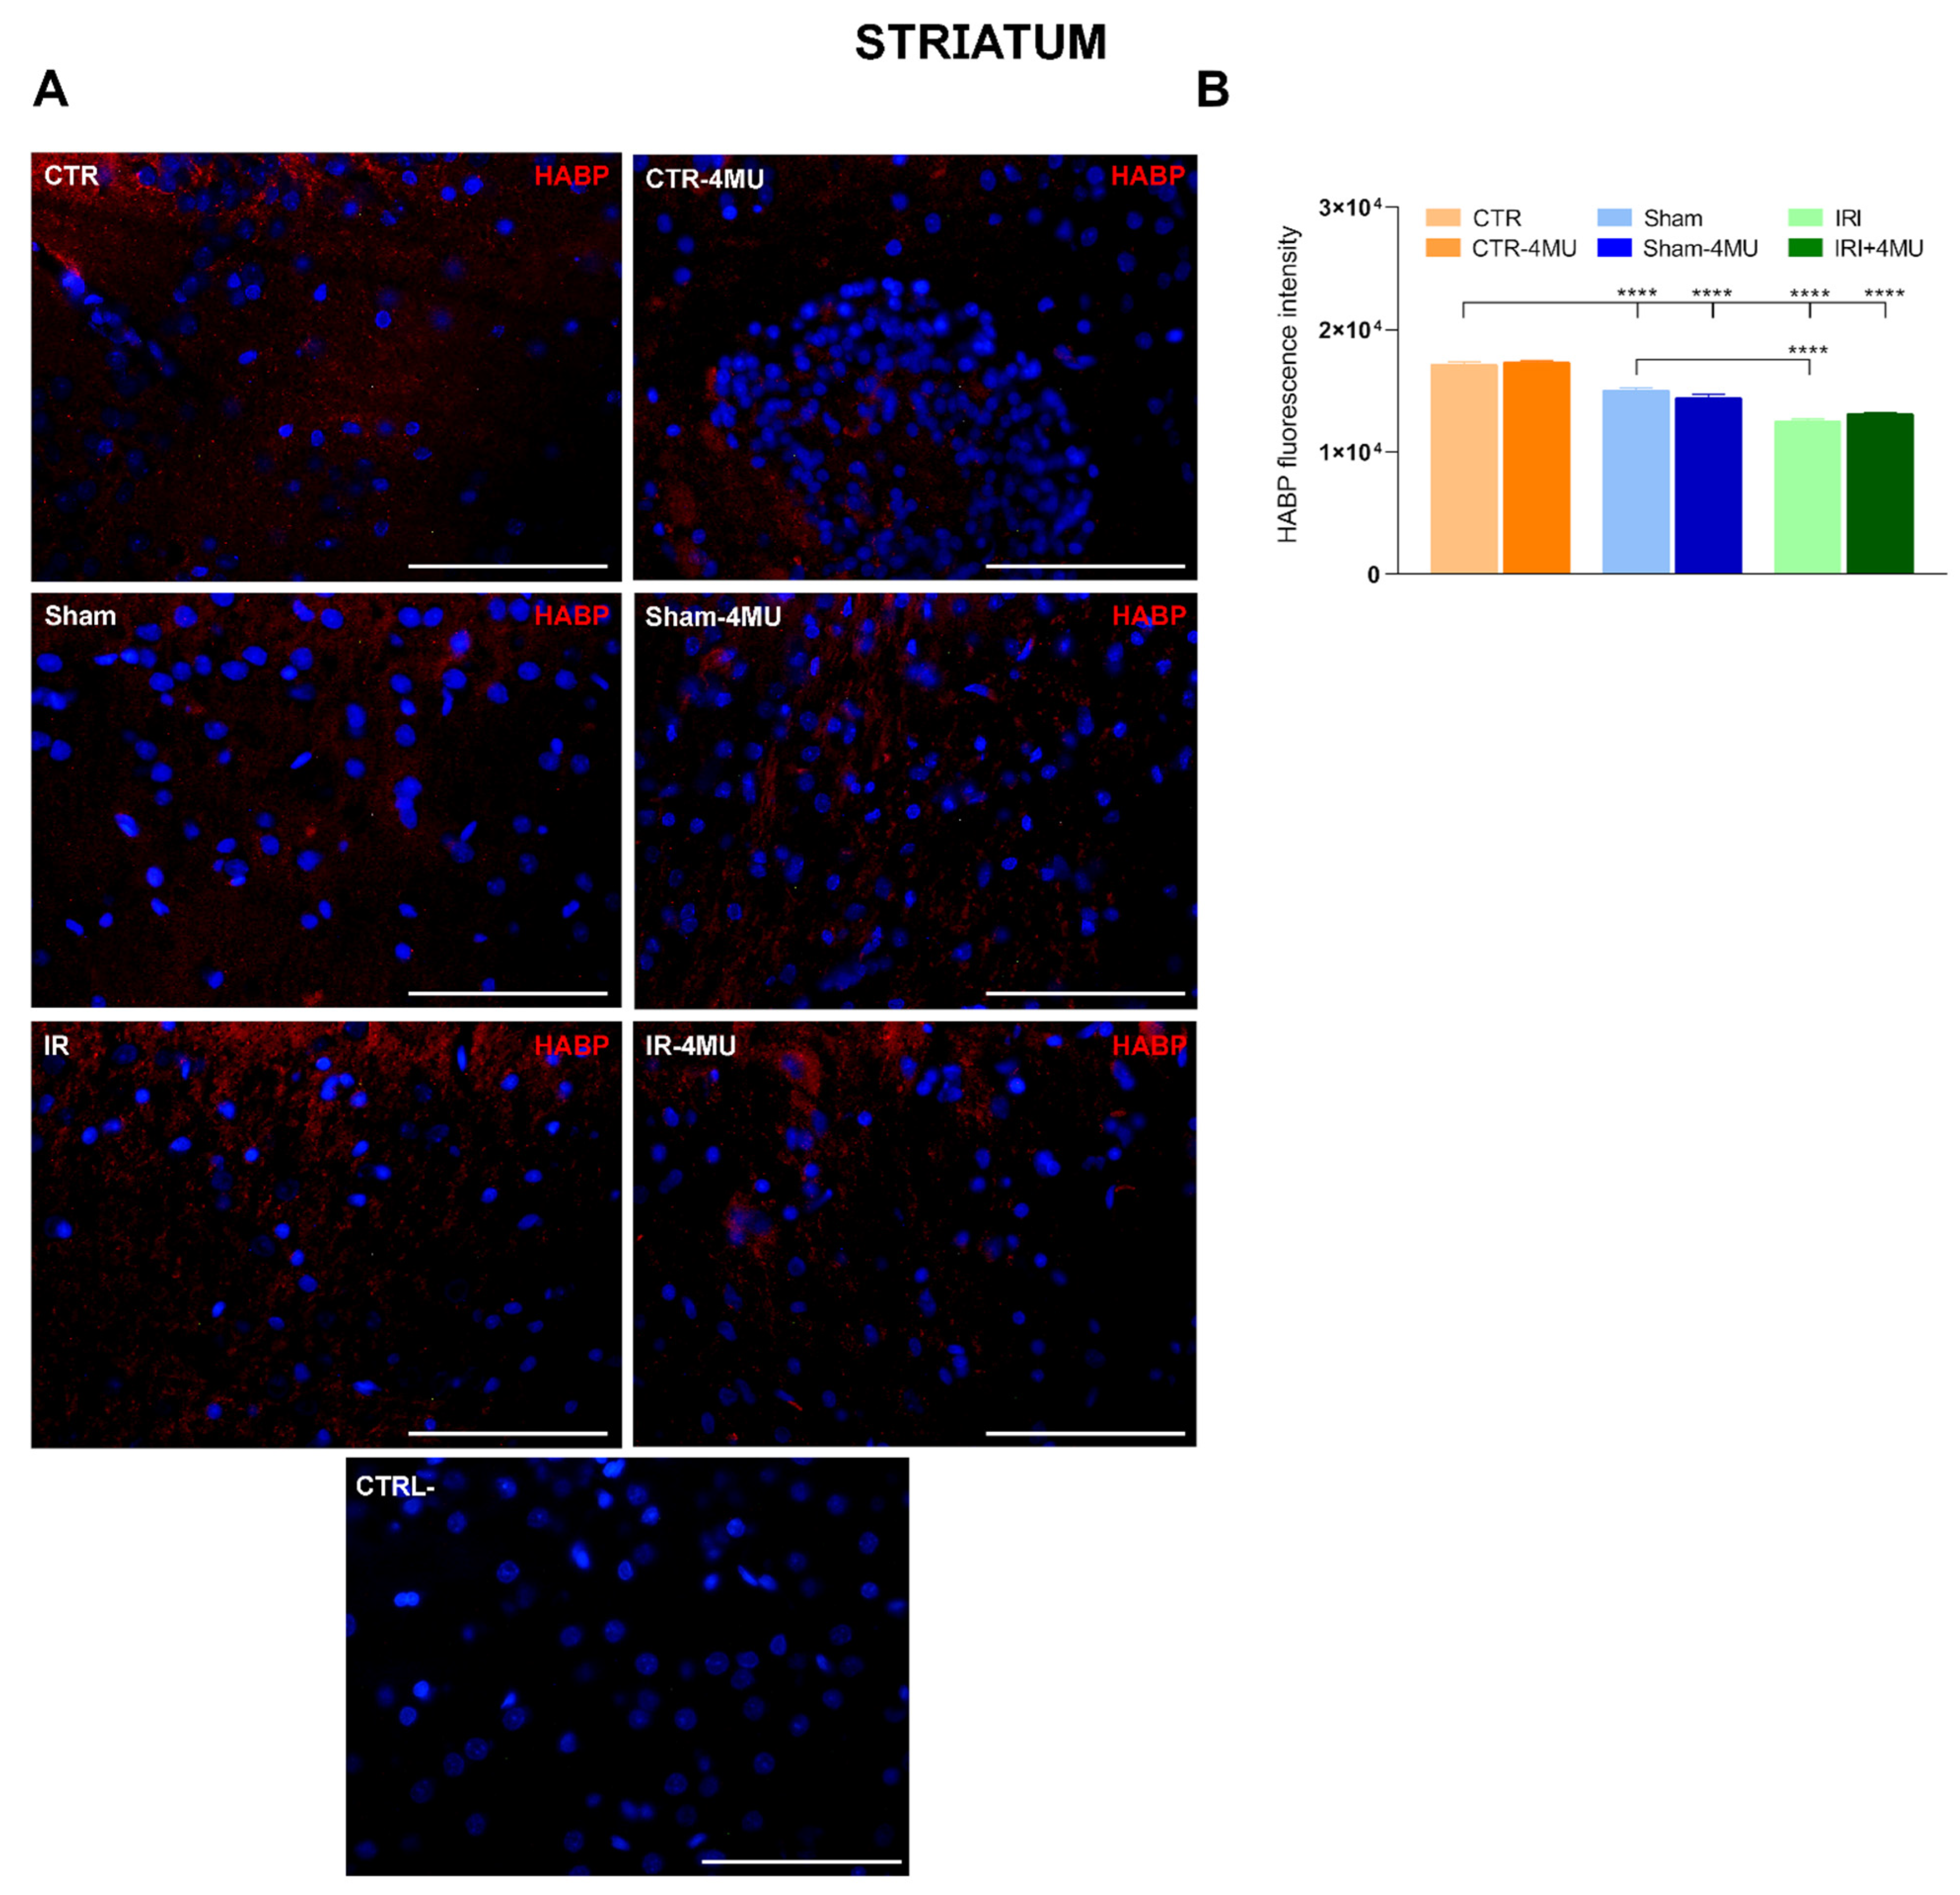
In the striatum, HABP staining was observed in both neurons and glial cells, with a prominent signal that appeared more dispersed within the extracellular matrix (Figure 4A). As observed in the hippocampus, in the striatum of the IRI and SHAM groups the intensity of HABP fluorescence was significantly reduced with respect to CTR values and was unaffected by 4-MU treatment (Figure 4A,B). In the striatum of the IRI group a significant reduction in Has2 mRNA levels was observed with respect to CTR values, while Has1 and Has3 transcript levels did not change significantly in all the experimental conditions (Figure 5A–C). In all experimental groups, 4-MU treatment induced a significant reduction in HAS2 transcript levels with respect to non-treated CTR values (Figure 5B). In all the experimental groups, the expression of Hyal1, Hyal2, and Hyal3 mRNA did not differ significantly (Figure 5D–F).
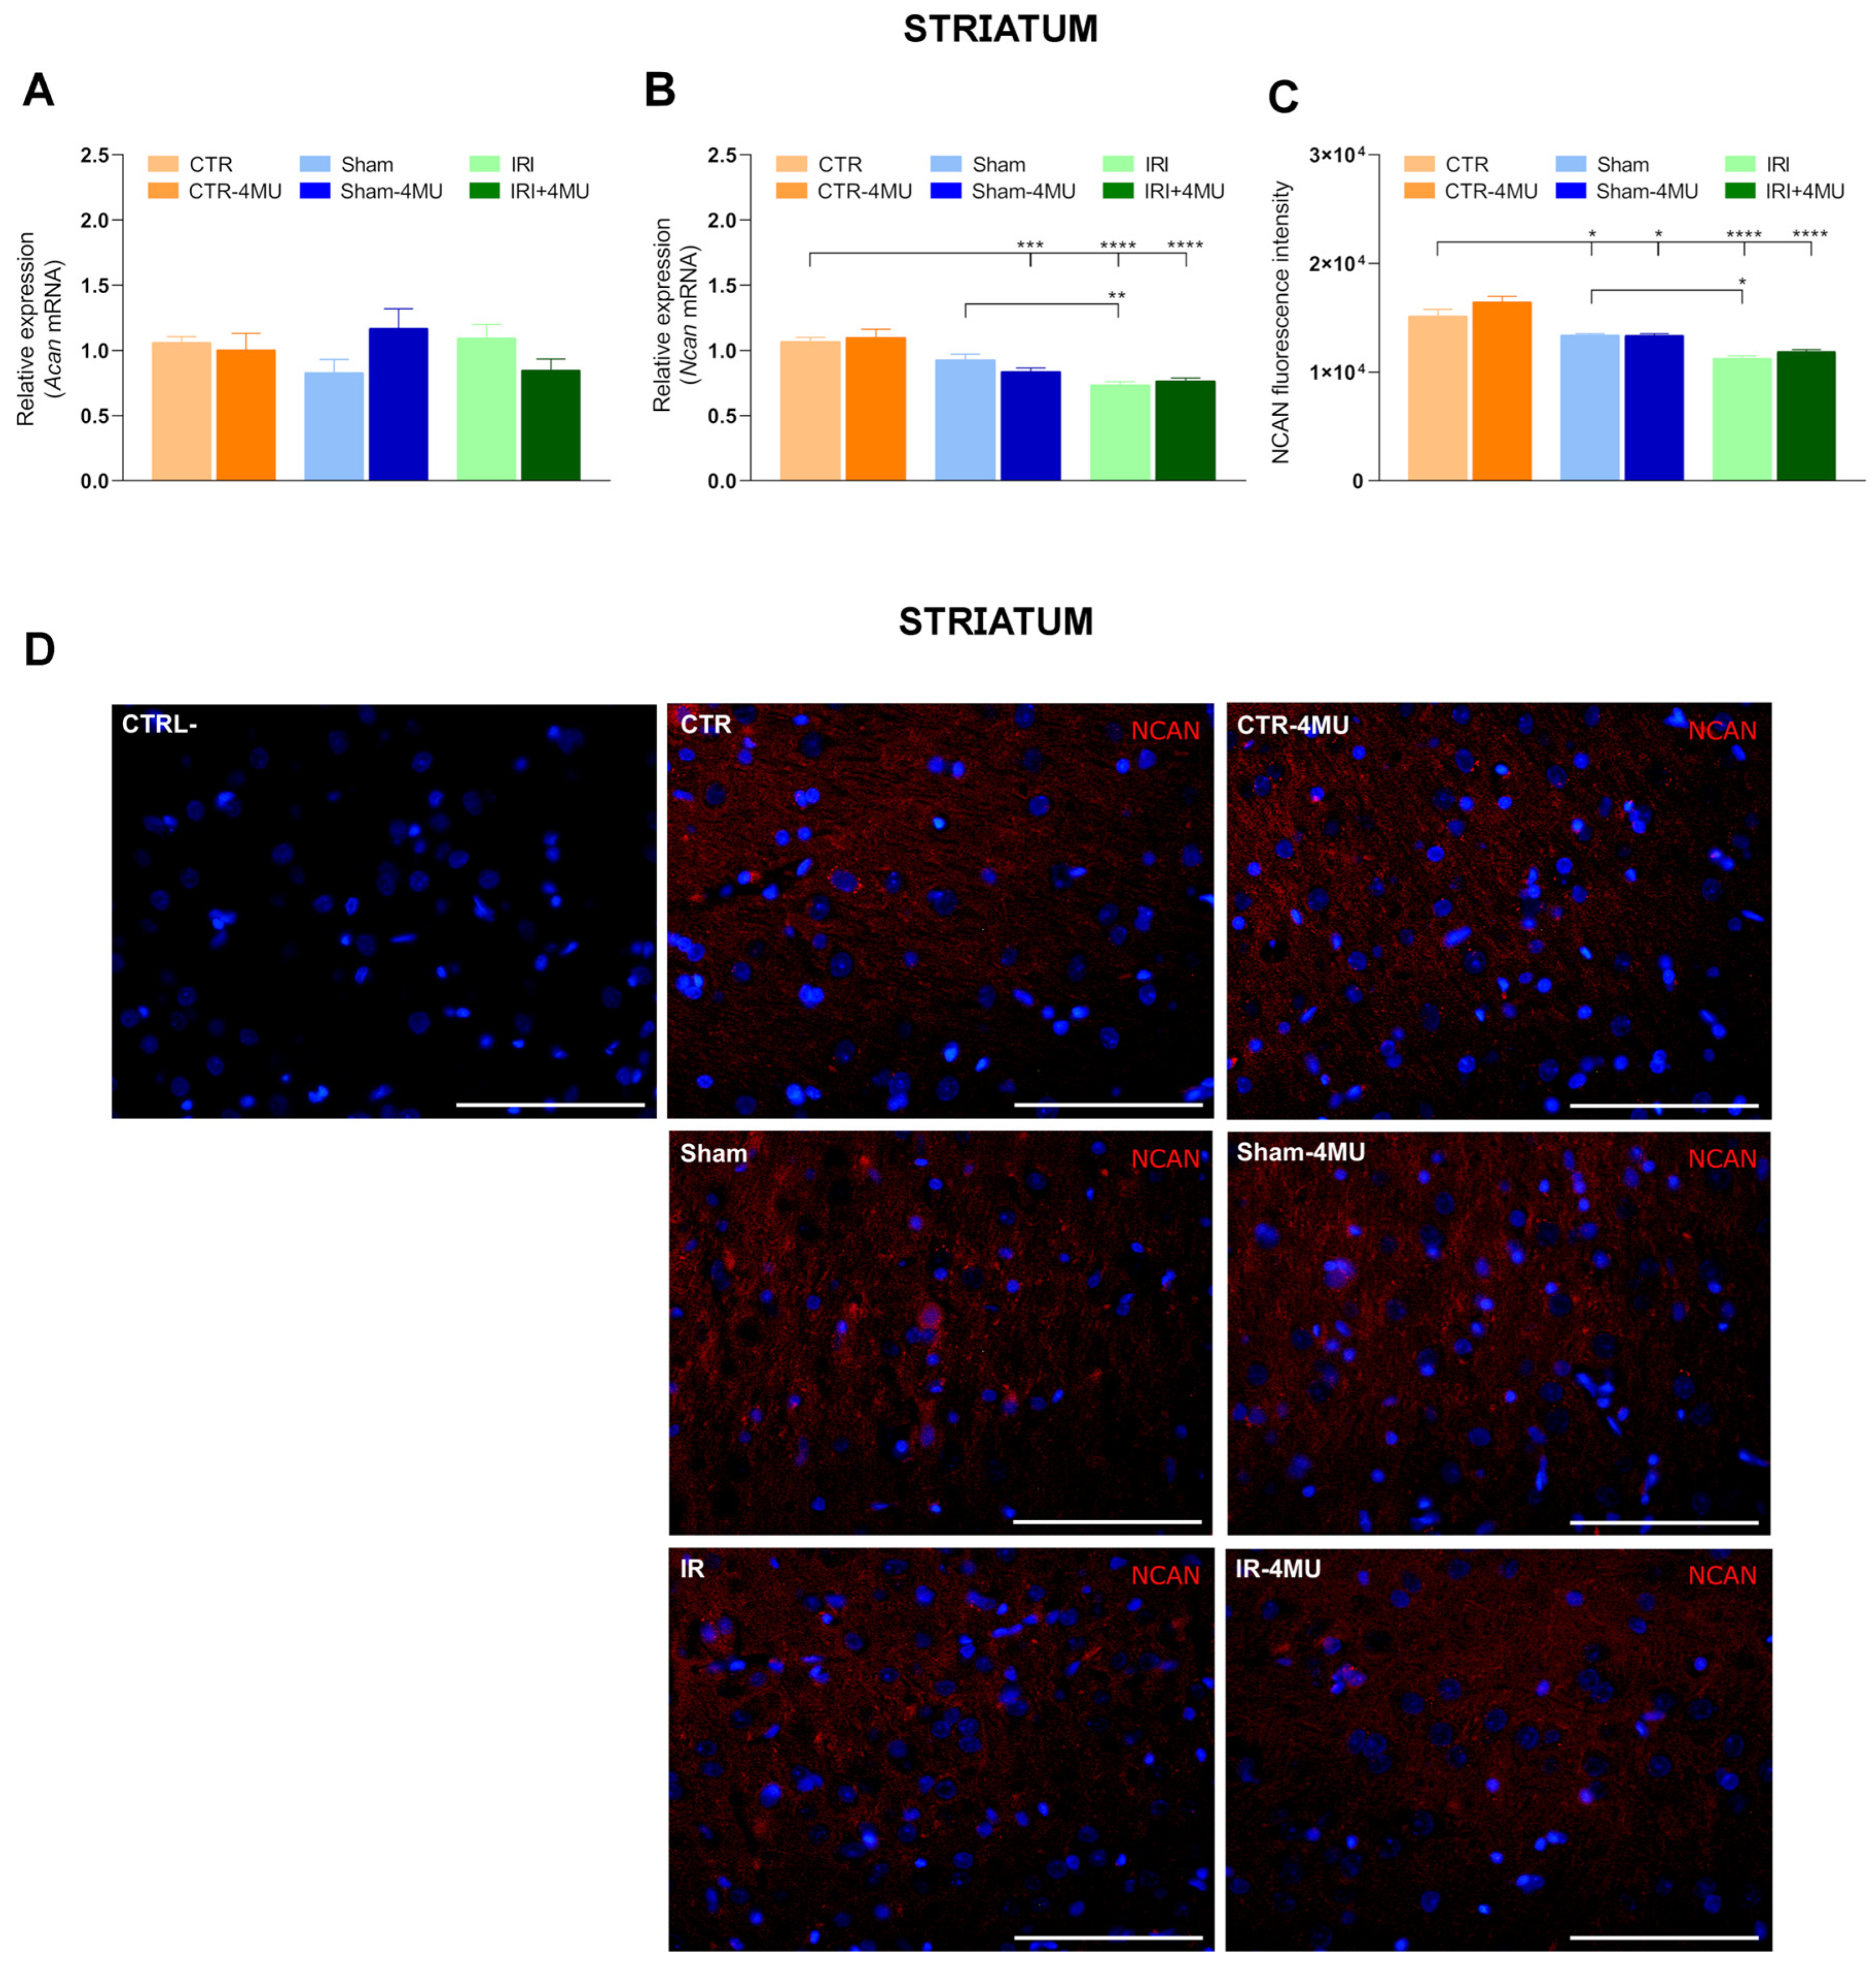
Striatal Acan mRNA levels were also similar to CTR values in all experimental groups, while Ncan transcript levels were significantly reduced in the IRI and IRI-4MU groups with respect to CTR values (Figure 6A,B). In the SHAM group, a trend towards a reduction in Ncan mRNA levels was observed which reached significance after 4-MU treatment (Figure 6B). Analogously to the hippocampus CA1 region, in the striatum, NCAN immunoreactivity was found in neurons (Figure 6C,D). NCAN fluorescent intensity was significantly reduced in SHAM and IRI groups, both in the absence and presence of 4-MU with respect to the CTR group (Figure 6C).

2.2. Effect of 4-MU on Hyaluronan Receptor Expression in the Rat Hippocampus and Striatum After Intestinal IRI

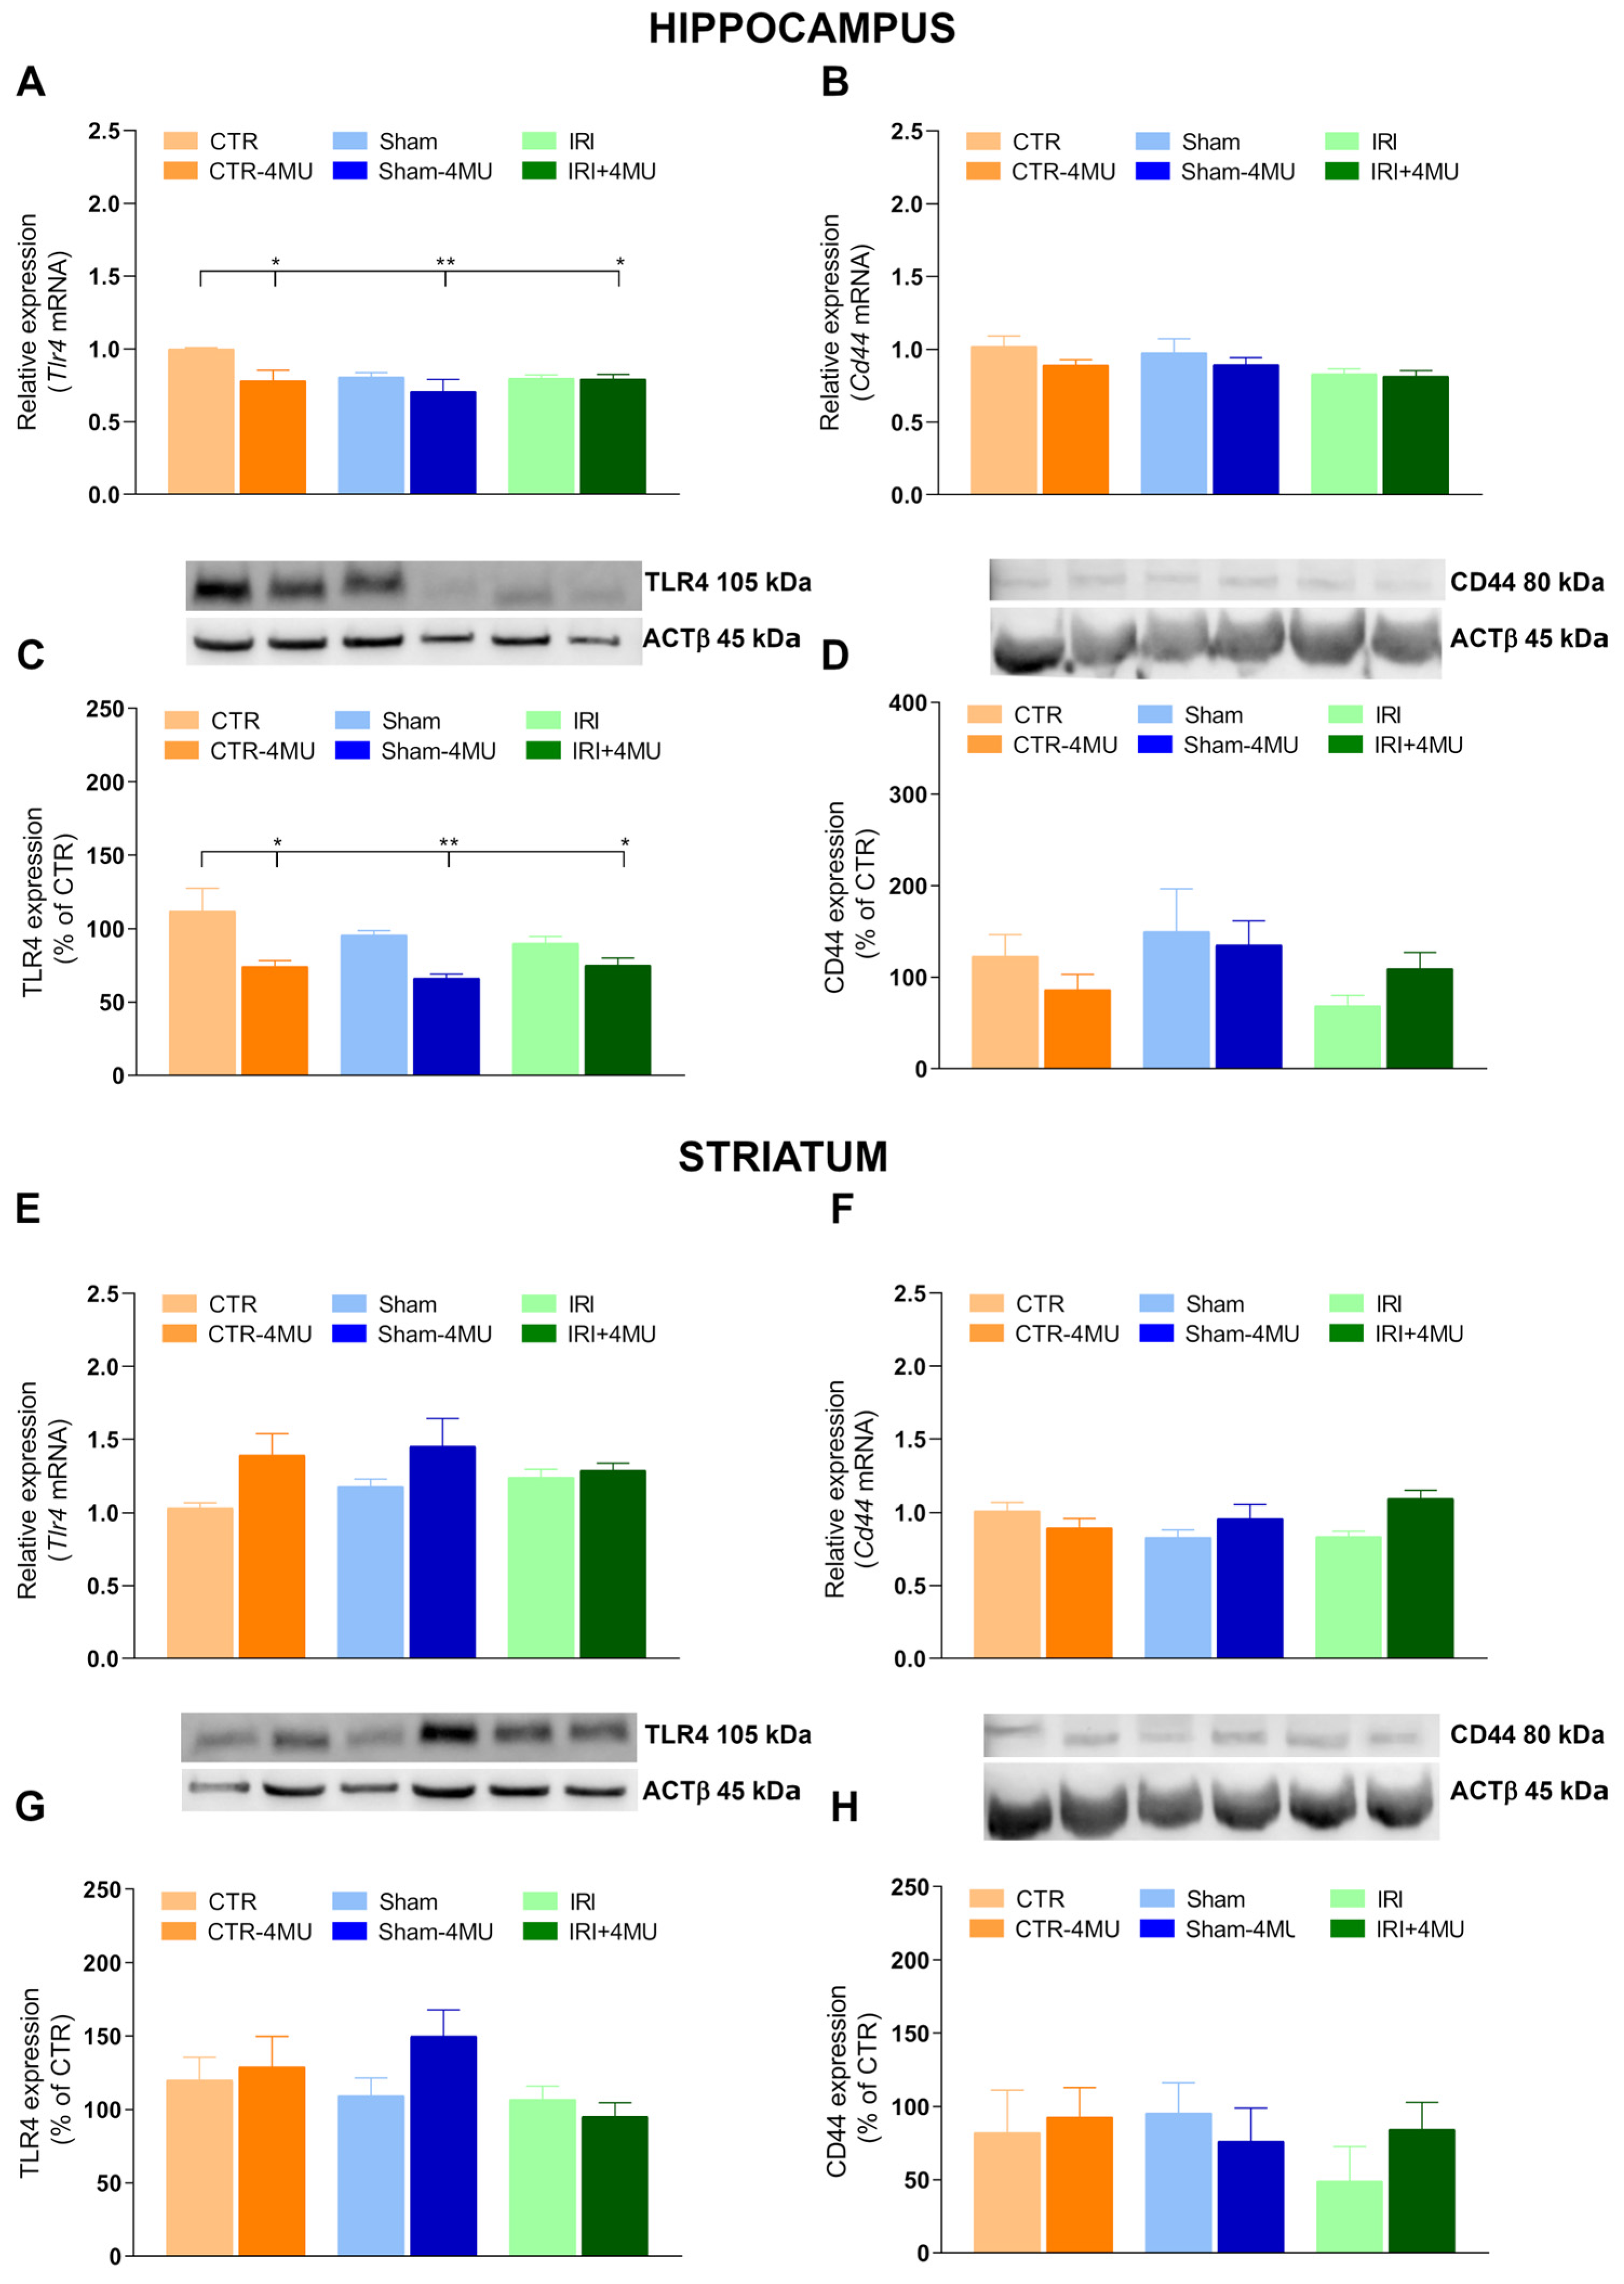
We next assessed the mRNA and protein levels of the two main hyaluronan receptors: TLR4, which is modulated by hyaluronan during inflammatory responses, and CD44, the most abundant hyaluronan receptor in the brain [27]. In the hippocampus, both Tlr4 mRNA and its protein levels were reduced in the IRI and SHAM groups compared to CTR values, and this decrease reached significance in the presence of 4-MU (Figure 7A,C). 4-MU treatment also induced a significant reduction in Tlr4 expression in the CTR group (Figure 7A,C). In contrast, Cd44 transcript and its protein levels were comparable across all experimental groups (Figure 7B,D). In the striatum, both Tlr4 and Cd44 mRNA and their protein levels remained unchanged across groups (Figure 7E–H).
To investigate potential intracellular pathways downstream of hyaluronan receptors, we measured Nfkb mRNA expression and the protein levels of the phosphorylated form of IκBα (pIκBα), a key regulator of the NF-κB signaling cascade, in both brain regions. Indeed, the phosphorylation of the inhibitor of κB (IKB) proteins by IκB Kinase β (IKKβ) leads to IκB degradation and subsequent activation of nuclear factor κB [28]. In the hippocampus, Nfkb mRNA levels were significantly reduced in the IRI and SHAM groups compared to CTR values and remained downregulated after 4-MU treatment (Figure 8A). Protein levels of pIκBα were significantly increased in the IRI group compared to CTR and SHAM but returned to CTR values after 4-MU treatment (Figure 8B). In the SHAM group, pIκBα protein levels were similar to CTR values and 4-MU had no effect on either SHAM or CTR animals (Figure 8B). In the striatum, Nfkb expression did not differ between groups (Figure 8C). However, pIκBα protein levels were significantly increased in the SHAM group compared to CTR, an effect reversed by 4-MU (Figure 8D). In the IRI group, pIκBα levels were similar to those observed in the CTR group and were unaffected by 4-MU treatment (Figure 8D).

2.3. Effect of 4-MU Treatment on Intestinal IRI-Induced Changes in Proinflammatory Cytokines in the Rat Brain

In both the hippocampus and striatum, Il6 mRNA levels were significantly increased compared to CTR animals (Figure 9A,C). This enhancement was not observed in the striatum and hippocampus of the SHAM group, suggesting that the increase is specifically associated with IRI. In both brain regions, 4-MU treatment significantly reduced IRI-induced Il6 mRNA levels; however, in the striatum, these levels remained significantly higher than those in the CTR group (Figure 9A,C). In the hippocampus, Tnfa mRNA levels were similar in the IRI and SHAM compared to the CTR group (Figure 9B). In all experimental groups, 4-MU treatment significantly reduced hippocampal Tnfa mRNA levels (Figure 9B). In the striatum, Tnfa mRNA levels were similar across all experimental groups (Figure 9D).

2.4. 4-MU Modulation of Microglia in the Rat Brain After Intestinal IRI

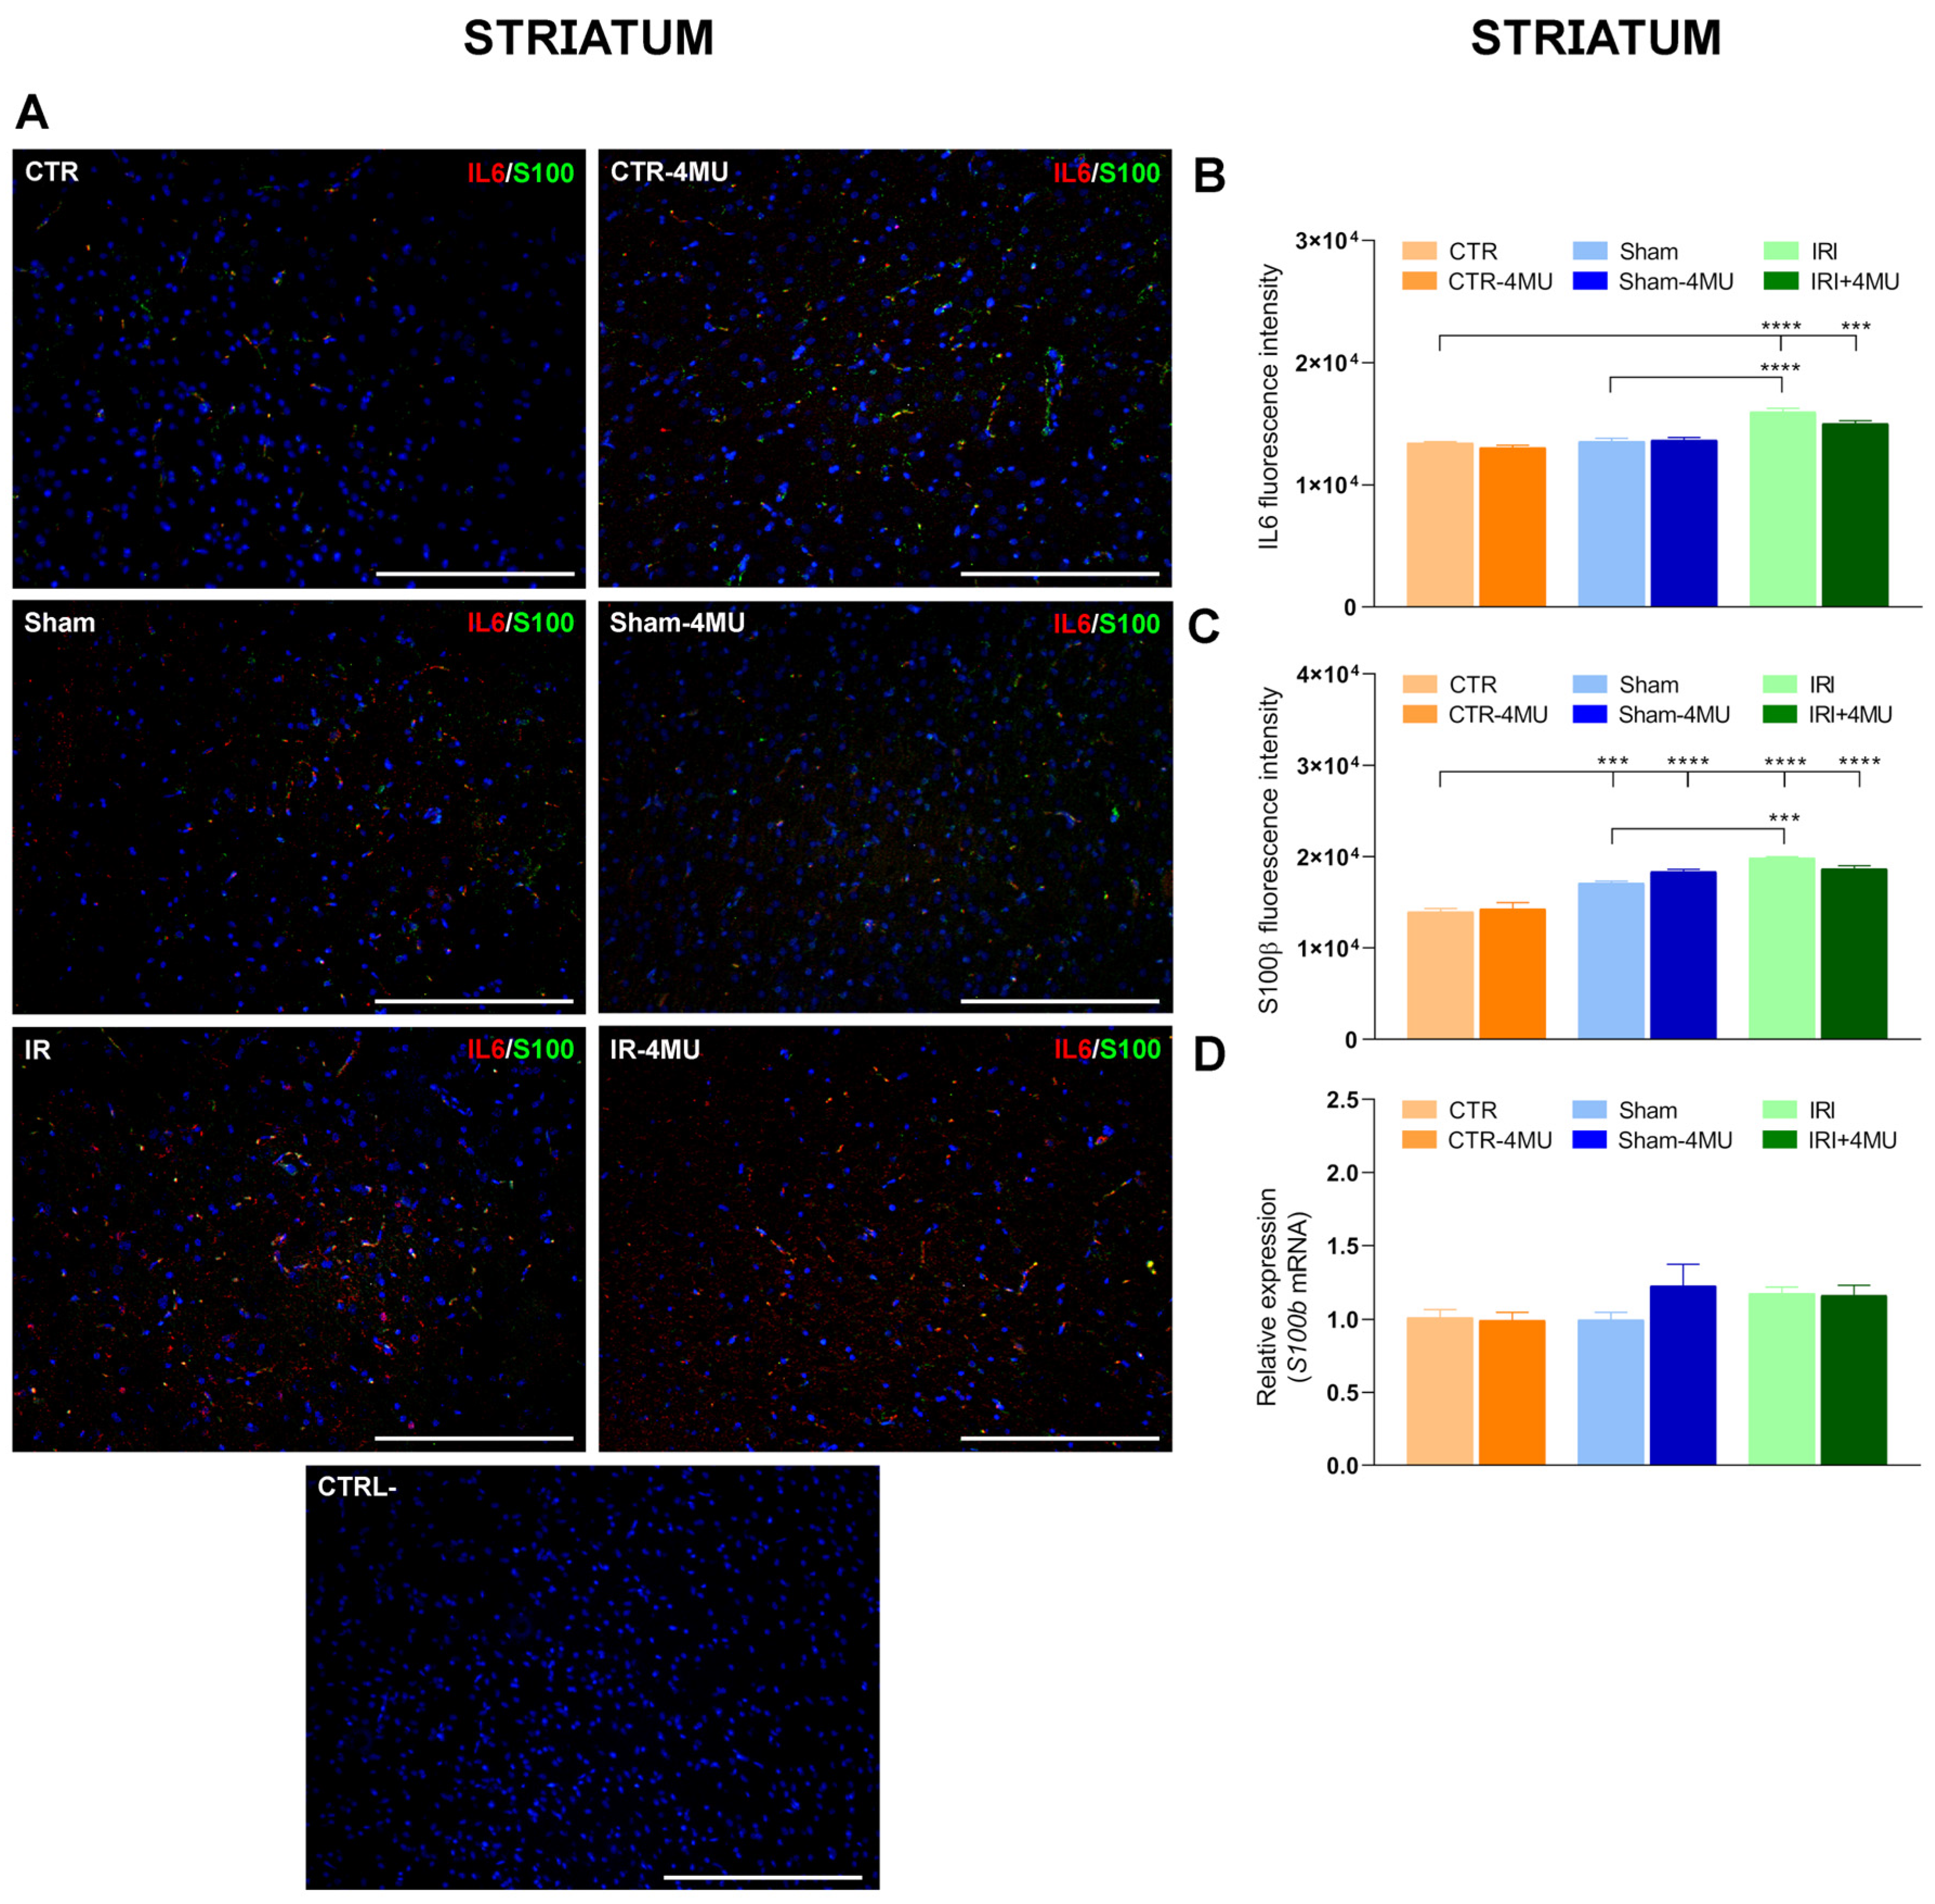
In the CNS, proinflammatory cytokines are produced by astrocytes, microglia, and neurons in response to diverse intrinsic and extrinsic stimuli [29]. We, therefore, evaluated IL6 distribution by immunohistochemistry in both the hippocampus and striatum. In both regions, IL6 staining was localized to glial cells, showing a clear cytoplasmic signal (Figure 10A and Figure 11A). Consistent with q-RT-PCR data, IRI significantly increased IL6 immunoreactivity (IR) in the CA1 hippocampal region and in the striatum, and this effect was reduced by 4-MU treatment (Figure 10A,B and Figure 11A,B). In the hippocampus of the SHAM group, IL6 IR was also increased despite unaltered Il6 mRNA levels, although the enhancement was less pronounced than in the IRI group. In both regions, IL6 staining colocalized with S100β, a member of the multigenic family of Ca2+-binding proteins abundantly expressed in astrocytes and microglial cells [30]. The number of IL6+/S100β+ cells increased in both the CA1 region and in the striatum after IRI, suggesting the possible involvement of microglia in the CA1 region (Figure 10A,B and Figure 11A,B). Interestingly, S100β expression followed different trends in the two regions. In the hippocampal CA1 region, both S100β fluorescence intensity and its mRNA levels were similar across CTR, SHAM, and IRI groups (Figure 10C,D). However, 4-MU significantly reduced S100β IR and its transcript levels in all groups (Figure 10C,D). Conversely, in the striatum, S100β fluorescence intensity was increased in the IRI group compared to the CTR and SHAM, and this effect was not altered by 4-MU treatment (Figure 11C). In the striatum, S100β transcript levels were similar in all experimental groups (Figure 11D).

3. Discussion

Intestinal IRI is a severe clinical condition favoring the development of systemic inflammation, which may extend to the brain. Although the correlation among IRI, neuroinflammation, and cognitive impairment has been assessed in several studies, the underlaying molecular mechanisms are still largely unknown [7,8,9]. In this study, we report the possible involvement of hyaluronic acid in the rat hippocampus and striatum following in vivo IRI in the small intestine.
Hyaluronan is the most abundant matrix polysaccharide in the adult brain and plays crucial roles in modulating neuron and glial cell differentiation, neuron activity, and repair in neurodegenerative diseases and after CNS injuries [17]. In this study, in both the rat hippocampus and striatum, hyaluronan binding protein stained the cytoplasm of both neurons and glial cells, consistent with the well-established evidence that neurons, astrocytes, and microglia are cellular sources of hyaluronan in the brain [17]. Furthermore, a more diffuse extracellular staining was evident in both regions, consistent with the role of hyaluronan as an extracellular matrix component. Following intestinal injury, hyaluronan deposition was significantly reduced in both the CA1 region of the hippocampus and the striatum. In agreement with data obtained in the mouse hippocampus, changes in hyaluronan deposition after intestinal IRI were observed in the CA1 region of the hippocampus, where a deficit of hyaluronan was suggested to underlie alterations in neuronal activity and epilepsy [31]. The decrease in hyaluronan levels in the rat brain after IRI may depend either on a downregulation of hyaluronan synthases or on an enhanced activity of the hyaluronan-degrading enzyme hyaluronidase (HYAL) [19,20]. In good agreement with the decrease in hyaluronan deposition, Has2 mRNA levels decreased in both the hippocampus and striatum of the IRI group. The extent of Has2 mRNA reduction was higher in the CA1 region of the hippocampus than in the striatum, in line with the more obvious reduction of hyaluronan binding protein staining in this region. It is highly probable that HAS2, the main biologically active isoform of HAS enzymes, rather than HAS1 and HAS3, participates in the reduction in hyaluronan deposition in the rat brain following intestinal IRI in both brain regions, since Has1 and Has3 mRNA levels remained unchanged in this condition. Both in the hippocampus and in the striatum of all experimental groups, 4-MU significantly decreased Has2 mRNA levels and did not influence Has1 and Has3 transcript levels, suggesting a higher sensitivity of Has2 to 4-MU modulation as observed in the rat enteric nervous system and in rat astrocytes [21,22,32]. However, in both regions, hyaluronan deposition was not influenced by 4-MU after IRI, possibly due to compensatory activity by other HAS isoforms that may have substituted for HAS2 to sustain hyaluronan production. HAS3, which rapidly produces hyaluronan, even with a minimal amount of substrate [33], may be involved since this isoform plays a fundamental role in the cell packing of the stratum pyramidal in the CA region of the hippocampus [31].
Hyaluronan signaling in the brain is strictly dependent on its molecular weight. While native long hyaluronan polymers, with high molecular weight, can influence a variety of biological processes and reduce the development of pathological states, including neuroinflammation, their cleavage into smaller fragments may promote immune cell activation as well as the production of proinflammatory cytokines, thereby favoring an increased inflammatory response [34]. However, in our study, mRNA levels of the three major hyaluronan-degrading enzymes (Hyal1, Hyal2, and Hyal3) did not shown significant differences both in the hippocampus and striatum, suggesting that alteration of hyaluronan deposition mainly depends upon its synthesis.
In both the hippocampus and striatum of the SHAM group, hyaluronan staining was significantly lower than in CTR animals, suggesting that surgical manipulation and laparotomy may reduce hyaluronan deposition in the brain. The reduction in hyaluronan deposition after sham operation was, however, significantly lower than in the IRI group, indicating that IRI, per se, decreased hyaluronan levels.
As regards the different proteoglycans contributing to the composition of the perineuronal net, immunoreactivity for neurocan, but not for aggrecan, was significantly reduced in the rat brain following intestinal IRI, with a more pronounced reduction in the CA1 region of the hippocampus. The molecular mechanism(s) underlying this change appears to differ between the two regions, as Ncan mRNA levels were only slightly reduced after intestinal IRI, suggesting that post-transcriptional and/or degradation processes may be involved. In contrast, a significant reduction in the Ncan transcript was observed in the striatum. Differences in the mechanisms underlying neurocan deposition in the two regions are also reflected by the sensitivity of hippocampal neurocan-IR to 4-MU, which was not observed in the striatum in all experimental groups. In this context, a recent study has shown that chronic oral treatment with 4-MU may reduce the perineuronal nets formation in the mouse hippocampus by diminishing both hyaluronan and neurocan levels, thus influencing memory retention [35].
Considering the downstream mechanisms of hyaluronan cell signaling, CD44, which plays various roles in both the developing and adult nervous system, appeared unaffected by intestinal IRI, as its mRNA levels remained unchanged in both regions [17]. However, in the hippocampus of the IRI group, but not in the striatum, downregulation of TLR4 mRNA levels corresponded well with the reduced hyaluronan deposition. 4-MU significantly decreased TLR4 mRNA under control conditions, but not after sham operation or IRI, suggesting that the inhibitory effect may act differently depending on tissue conditions. The transcript levels of Nfkb, a transcription factor downstream to TLR4, were reduced only in the hippocampus following intestinal IRI. This reduction was compensated by increased protein levels of the phosphorylated form of NF-κB inhibitory protein IκBα, promoting NF-κB activation [36]. Intestinal IRI-induced pIκBα protein levels in the hippocampus were significantly reduced by 4-MU, suggesting that hyaluronan may positively modulate the multi-subunit IκB kinase (IKK), as previously observed in prostate cancer cells, possibly via hyaluronan receptors alternative to TLR4 [37]. In the CNS, activation of NF-κB, principally occurring in activated glial cells, controls the induction of proinflammatory cytokines and chemokines, sustaining neuroinflammation [38]. Accordingly, in the hippocampus of the IRI, but not of the sham group, Il6 mRNA levels and immunoreactivity significantly increased, indicating an IRI-specific effect on the cytokine transcription. In the striatum of the IRI group, although neither Nfkb transcription nor IκBα were modified with respect to control animals, Il6 transcript levels and IL6-IR were significantly enhanced, suggesting alternative mechanisms underlaying the cytokine upregulation. Interestingly, in both regions, 4-MU significantly reduced Il6 transcript after IRI, suggesting the involvement of hyaluronan. However, we cannot exclude alternative mechanisms since 4-MU may also exert anti-inflammatory effects in a hyaluronan-independent manner, for instance by modulating STAT3 or other signaling pathways [32,39]. pIκBα levels increased, indicating functional activation of the NF-κB pathway. This apparent discrepancy can be explained by the post-transductional regulation of TLR4, as well as by the contribution of alternative hyaluronan receptors. The reversal of pIκBα and IL6 induction by 4-MU further supports the functional link between hyaluronan metabolism and NF-κB activation. Overall, although pIκBα analysis alone does not fully reflect NF-κB activity, our data integrating hyaluronan deposition, TLR4, and Nfkb transcript levels, pIκBα protein, and IL6 induction provide a coherent picture supporting hyaluronan–TLR4–NF-κB signaling in the hippocampus after intestinal IRI. The consistent attenuation by 4-MU further supports the involvement of this pathway. Future studies, including NF-κB nuclear translocation or receptor blockade, would strengthen this mechanistic link.
In contrast to a previous study showing that Tnfa mRNA levels increased in the rat hippocampus and remained unchanged in the striatum after intestinal IRI [7], in our model, the levels of the cytokine remained unchanged in both regions. This discrepancy may be due to differences in our IRI model, which involved 60 min of ischemia and 24 h of reperfusion, potentially allowing cytokine levels to return to normal, as compared to the 30 min of ischemia and 6 h of reperfusion used in the previous study. Several reports suggest that microglia play an important role in the production of proinflammatory cytokines in the brain [40]. Accordingly, in this study, double fluorescence staining in the hippocampus and striatum of the IRI group revealed increased IL6/S100β co-staining in microglial cells, indicating the involvement of microglia in sustaining cytokine upregulation, in good agreement with previous studies [7,8,9]. However, S100β-immunoreactivity (S100β-IR) increased only in the striatum and remained unchanged in the hippocampus, suggesting that different mechanisms may underlie glial activation in the two regions [29]. This hypothesis was further supported by the sensitivity of S100β-IR and mRNA to 4-MU in the hippocampus but not in the striatum, indicating potential regional differences in hyaluronan-mediated modulation of microglia [41]. In this context, we cannot exclude that proinflammatory mediators released by the gut after intestinal IRI may be transferred to the brain, inducing cytokine synthesis in the two brain regions, thereby influencing hyaluronan deposition [42]. Indeed, the existence of a bidirectional gut–brain communication axis, which may contribute to the development of both local and CNS symptoms associated with gut diseases, is now widely acknowledged [43].
Overall, our data suggest that hyaluronan contributes to intestinal IRI-induced damage in the rat hippocampus, more so than in the striatum. Differences in ECM composition and structure, cell types, architecture, and plasticity may explain such a discrepancy. Indeed, since the hippocampus is characterized by a rich laminar ECM, more dynamic PNN structure, and higher plasticity than the striatum, in this region hyaluronan machinery may be more susceptible to injury [44]. Alteration of extracellular matrix components by neuroinflammatory conditions has been suggested to favor the development of neurological and neurodevelopmental disorders. From a translational viewpoint, our model may mimic a mild intestinal ischemic condition, which occurs, for example, during surgical extracorporeal circulation, which is associated with transient cognitive deficits after arousal [45,46]. Since rat tissues have reduced hyaluronan metabolism, we may expect that the abundance of catabolized hyaluronan fragments may be higher in human brain regions after intestinal IRI, further strengthening the development of neuroinflammation [47].
In summary, our data show alterations in hyaluronan homeostasis in the rat brain following intestinal IRI, with more significant consequences in the hippocampus. We cannot exclude that proinflammatory mediators, released by the gut after intestinal IRI, may be transferred to the brain, influencing hyaluronan hyaluronan deposition. A more in-depth assessment of the various mechanisms described in the present study is needed to gain a clearer understanding of the role of hyaluronan in the brain after intestinal IRI, potentially paving the way for new therapeutic strategies.

4. Materials and Methods

4.1. Animals

Male Wistar rats (weight 250–350 g, Envigo, Udine, Italy) were housed under controlled environmental conditions (temperature 22 ± 2 °C; relative humidity 60–70%) with a regular 12/12 h light/dark cycle and free access to standard laboratory chow and tap water ad libitum at the Animal Facility of the University of Insubria.
Rats were assigned into six groups (N = 5 per group): (i) the sham-operated animals (SHAM), undergoing exposure of superior mesenteric artery (SMA), without occlusion, (ii) the intestinal IRI group (IRI), where the SMA was isolated by laparotomy, and a non-invasive clamp was released 60 min after clamping as described in the next paragraph, (iii) normal un-operated rats, which were used as controls (CTR), (iv) 4-methylumbelliferone (4-MU)-treated sham group (SHAM-4MU), (v) 4-MU-treated IRI group (IRI-4MU), and (vi) normal-4MU-treated group (CTR-4-MU). 4-MU was suspended in DMSO/0.9% NaCl (1:4) and one dose (25 mg/kg) was intraperitoneally administered 24 h before euthanization. The dosage was chosen considering its safety and efficacy in downregulating hyaluronan production, as previously demonstrated [48,49,50].
Animal care and experimental protocols were approved by the Animal Care and Use Ethics Committee of the University of Insubria and by the Italian Ministry of Health (authorization number: n°415/2016-PR) and were performed in accordance with national and EU guidelines for the handling and use of experimental animals.

4.2. Intestinal IRI

Animals were anesthetized with thiopental sodium (50 mg/kg diluted 2% w/v in sterile isotonic saline and given i.p.) in a non-fasted state. One or two additional doses, consisting of 10% of the initial dose, were occasionally administered 20 min after the previous dose to maintain the anesthetic state. Intestinal IRI was obtained as previously described [51]. Briefly, after laparotomy a loop of the small intestine was exteriorized and a branch of the superior mesenteric artery (SMA) supplying the segment was temporarily occluded for 60 min with an atraumatic microvascular clamp. The upper and lower margins of the intestinal segment receiving blood from the clamped SMA branch were also clamped for 60 min. Animals were allowed to regain consciousness and were euthanized by decapitation 24 h after reperfusion, when major histopathological, immune, and neuromuscular functional changes at the intestinal level were observed [51]. Brains were immediately removed, and the hippocampus and striatum were rapidly dissected, frozen on dry ice, and stored at −80 °C for Western blot and qRT-PCR analysis. For immunofluorescence staining, the striatum and hippocampus were immediately fixed after collection.

4.3. Immunofluorescence Analysis

Immunofluorescence analysis was performed on paraffin-embedded hippocampus and striatum cross-sections obtained from all six experimental groups according to the method described in Bistoletti et al. (2019) [52]. In brief, after dissection, the hippocampus and striatum were postfixed at 4 °C in 4% paraformaldehyde in phosphate buffer (PBS composition in mM: 0.14 NaCl, 0.003 KCl, 0.015 Na2HPO4, 0.0015 KH2PO4, pH 7.4) for 4 h. Brain regions were treated for 72 h in sucrose 30% w/v in PBS and embedded in paraffin. Cross-sections (7 μm) were treated for 30 min with PBS containing 2% bovine serum albumin (BSA) before overnight incubation with the primary antibody (4 °C). After washing, incubation with an appropriate secondary antibody was performed for 60 min in a dark humid chamber. The details of the primary and secondary antibodies and related optimal dilution are reported in Table 1. PBS buffer used for washing steps and primary antibodies dilutions contained 2% bovine serum albumin (BSA). Control samples were incubated with 2% BSA in PBS. For the double immunolocalization experiments, sections were rehydrated and pre-incubated with a BSA blocking solution to minimize nonspecific binding, as previously described. Subsequently, samples were incubated with rabbit anti-IL6 and anti-S100β primary antibodies for 60 min, followed by a 45 min incubation with FITC- and Cy3-conjugated goat anti-rabbit secondary antibodies, respectively. Since the primary antibodies were generated in the same species, an alternative method was performed. Following the first staining cycle, sections were incubated with anti-rabbit IgG (Sigma) at a dilution of 1:500 for 2 h in order to block the possible binding of the secondary antibody used in the second staining cycle with the primary antibody applied during the initial stage [27]. Nuclei were then stained by incubating for 3 min with 4′,6-diamidino2-phenylindole (DAPI; 0.1 mg/mL in PBS, excitation 340 nm, emission 488 nm). Coverslips were mounted with Citifluor mounting medium and slides were finally examined with a Nikon fluorescence microscope. Images were combined with Adobe Photoshop (Adobe Photoshop version 5.5, 1999, Adobe Systems Inc, San Jose, CA, USA). Hyaluronan was assayed by using biotinylated hyaluronan binding protein as previously described [53].

4.4. RNA Isolation and Quantitative RT PCR

Total RNA was extracted from hippocampus and striatum samples with TRIzol (Invitrogen, Carlsbad, CA, USA) and treated with DNase I (DNase Free) to remove possible traces of contaminating DNA. cDNA was obtained by retrotranscribing 1 µg of total RNA using HiScript III 1st Strand cDNA synthesis Kit (+gDNA wiper, Vazyme, Red Maple Hi-tech Industry Park, Nanjing, China). Quantitative reverse transcription PCR (qRT-PCR) was performed on the QuantStudio 3 Real-Time PCR System (ThermoFisher Scientific, Carlsbad, CA, USA) with AceQ Universal SYBR qPCR Master Mix (Vazyme, Nanjing, China) following the manufacturer’s instructions. Primers were designed using Primer Express software (version 3.0.1 for Windows, 2020, Applied Biosystems, Milan, Italy) and used at a final concentration of 500 nM for each primer. Primers are reported in Table 2 and were designed to have a similar amplicon size and similar amplification efficiency as required for applying the 2−ΔΔCt method to compare gene expression in the different groups subjected to intestinal IRI in the absence and presence of 4-MU treatment and in the CTR group treated with 4-MU with respect to CTR values [22]. ACTβ was used as a housekeeping gene. Experiments were performed at least five times for each experimental group.

4.5. Western Immunoblot Analysis

Hippocampus and striatum were used to analyze phospho-IκΒ (pIκBα), Toll-like receptor 4 (TLR4), and CD44 protein levels. Briefly, protein samples were boiled for 5 min at 95 °C in Laemmli sample buffer (Tris-HCl 300 mM, pH 6.8, glycerol 10%, SDS 2%, β-mercaptoethanol 0.04%) for protein denaturation, processed for electrophoretic separation and then blotting as described elsewhere [22]. Protein quantification was carried out with the Bradford method. Protein separation was carried out on 8% SDS-polyacrylamide gel electrophoresis (SDS-PAGE) and electroblotted to nitrocellulose membranes (Merck Millipore, Milan, Italy). Membranes were analyzed according to the protocol described in Bosi et al. [22], using ACTβ as a loading control. Dilutions and main features of primary and secondary antisera are reported in Table 1. Bands were visualized by chemiluminescence (LiteAblot, Euroclone SpA, Milan, Italy), acquired and quantified with Alliance Q9 Advanced System (version 18.16, 2024, Uvitec Ltd., Cambridge, UK). Experiments were performed at least five times for each experimental group.

4.6. Chemicals

All chemicals were obtained from Sigma–Aldrich (Milan, Italy), unless otherwise specified, and were of the highest commercially available analytical grade, with the lowest grade of 96%.

4.7. Statistical Analysis

All results are reported as mean ± standard error of the mean (SEM) of at least five experiments. Statistical significance was calculated using unpaired Student’s t test or by one-way ANOVA followed by Tukey’s post hoc test, when appropriate. Differences were considered statistically significant when p < 0.05. For statistical analysis the GraphPad Prism software was used (GraphPad Prism version 8.0.2 for Windows, 30 January 2019, GraphPad Software Inc, San Diego, CA, USA).

Author Contributions

Conceptualization, A.B. (Annalisa Bosi), E.K., M.V., D.V., A.B. (Andreina Baj) and C.G.; Data Curation, A.B. (Annalisa Bosi), N.B., A.G. and C.G.; Formal Analysis, A.B. (Annalisa Bosi), N.B., A.P. (Alessandra Ponti), A.G. and C.G.; Methodology, A.B. (Annalisa Bosi), N.B., A.P. (Alessandra Ponti), P.M. and E.M.; Resources, F.C., E.K., M.V., A.P. (Alberto Passi), D.V., A.B. (Andreina Baj), A.G., P.S. and C.G.; Supervision, A.B. (Andreina Baj) and C.G.; Writing—Original Draft, A.B. (Annalisa Bosi), A.P. (Alessandra Ponti), A.B. (Andreina Baj), and C.G.; Writing—Review and Editing, F.C., R.C., E.K., M.V., A.P. (Alberto Passi), D.V., A.B. (Annalisa Bosi), A.G., P.S. and C.G. All authors have read and agreed to the published version of the manuscript.

Funding

This work was supported with grants from the Italian Ministry of University and Research to Andreina Baj, AG, CG, DV, AP (Alberto Passi), PS. Assegno di Ricerca Junior 2020 from the University of Insubria to CG.

Institutional Review Board Statement

Animal care and handling procedures complied with the ARRIVE guidelines and the European Union Council Directive 2010/63, as implemented by the Italian Government through Decree No. 26/2014. The experimental protocol was approved by the Animal Care and Use Ethics Committee of the University of Insubria and by the Italian Ministry of Health (authorization no. 415/2016-PR) on 24 June 2016, prior to the initiation of the study.

Data Availability Statement

The data presented in this study are available on request from the corresponding author.

Acknowledgments

APo is a PhD student of the “Experimental and Translational Medicine” Course at the University of Insubria.

Conflicts of Interest

The authors declare no conflicts of interest.

Abbreviations

The following abbreviations are used in this manuscript:
IRIIntestinal Ischemia and Reperfusion Injury
CNSCentral Nervous System
4-MU4-Methylumbelliferone
HASHyaluronan Synthase
ROSReactive Oxygen Species
NONitric Oxide
TLR4Toll-Like Receptor 4
MyD88Myeloid Differentiation Factor 88
TNF-αTumor Necrosis Factor α
IL6Interleukin 6
IL1βInterleukin 1β
ACANAggrecan
NCANNeurocan
ICAM-1Intercellular Adhesion Molecule 1
NF-κBNuclear Factor κB
HAPLN1Hyaluronan and Proteoglycan Link Protein 1
BralBrain-Specific Link Protein
ENSEnteric Nervous System
CD44Cluster Differentiation 44
RHAMMReceptor for Hyaluronan-Mediated Motility
LYVE-1Lymphatic Vessel Endothelial Hyaluronan Receptor 1
HAREHyaluronan Receptor for Endocytosis
HABPHyaluronan Binding Protein
HYALHyaluronidase
pIκBPhosphorylated Inhibitor of κB
IRImmunoreactivity

References

  1. Mallick, I.H.; Yang, W.; Winslet, M.C.; Seifalian, A.M. Ischemia-Reperfusion Injury of the Intestine and Protective Strategies against Injury. Dig. Dis. Sci. 2004, 49, 1359–1377. [Google Scholar] [CrossRef]
  2. Hierholzer, C.; Kalff, J.C.; Audolfsson, G.; Billiar, T.R.; Tweardy, D.J.; Bauer, A.J. Molecular and Functional Contractile Sequelae of Rat Intestinal Ischemia/Reperfusion Injury. Transplantation 1999, 68, 1244–1254. [Google Scholar] [CrossRef]
  3. Bielefeldt, K.; Whiteis, C.A.; Sharma, R.V.; Abboud, F.M.; Conklin, J.L. Reactive Oxygen Species and Calcium Homeostasis in Cultured Human Intestinal Smooth Muscle Cells. Am. J. Physiol. Gastrointest. Liver Physiol. 1997, 272, G1439–G1450. [Google Scholar] [CrossRef]
  4. Giaroni, C.; Zanetti, E.; Giuliani, D.; Oldrini, R.; Marchet, S.; Moro, E.; Borroni, P.; Trinchera, M.; Crema, F.; Lecchini, S.; et al. Protein Kinase c Modulates NMDA Receptors in the Myenteric Plexus of the Guinea Pig Ileum during in Vitro Ischemia and Reperfusion. Neurogastroenterol. Motil. 2011, 23, e91–e103. [Google Scholar] [CrossRef]
  5. Giaroni, C.; Marchet, S.; Carpanese, E.; Prandoni, V.; Oldrini, R.; Bartolini, B.; Moro, E.; Vigetti, D.; Crema, F.; Lecchini, S.; et al. Role of Neuronal and Inducible Nitric Oxide Synthases in the Guinea Pig Ileum Myenteric Plexus during in Vitro Ischemia and Reperfusion. Neurogastroenterol. Motil. 2013, 25, e114–e126. [Google Scholar] [CrossRef]
  6. Olanders, K.; Sun, Z.; Börjesson, A.; Dib, M.; Andersson, E.; Lasson, Å.; Ohlsson, T.; Andersson, R. The Effect of Intestinal Ischemia and Reperfusion Injury on ICAM-1 Expression, Endothelial Barrier Function, Neutrophil Tissue Influx, and Protease Inhibitor Levels in Rats. Shock 2002, 18, 86–92. [Google Scholar] [CrossRef]
  7. Hsieh, Y.H.; McCartney, K.; Moore, T.A.; Thundyil, J.; Gelderblom, M.; Manzanero, S.; Arumugam, T.V. Intestinal Ischemia-Reperfusion Injury Leads to Inflammatory Changes in the Brain. Shock 2011, 36, 424–430. [Google Scholar] [CrossRef]
  8. Zhou, J.; Huang, W.Q.; Li, C.; Wu, G.Y.; Li, Y.S.; Wen, S.H.; Lei, W.L.; Liu, K.X. Intestinal Ischemia/Reperfusion Enhances Microglial Activation and Induces Cerebral Injury and Memory Dysfunction in Rats. Crit. Care Med. 2012, 40, 2438–2448. [Google Scholar] [CrossRef] [PubMed]
  9. Yang, B.; Zhang, L.Y.; Chen, Y.; Bai, Y.P.; Jia, J.; Feng, J.G.; Liu, K.X.; Zhou, J. Melatonin Alleviates Intestinal Injury, Neuroinflammation and Cognitive Dysfunction Caused by Intestinal Ischemia/Reperfusion. Int. Immunopharmacol. 2020, 85, 106596. [Google Scholar] [CrossRef] [PubMed]
  10. Sherman, L.S.; Matsumoto, S.; Su, W.; Srivastava, T.; Back, S.A. Hyaluronan Synthesis, Catabolism, and Signaling in Neurodegenerative Diseases. Int. J. Cell Biol. 2015, 2015, 368584. [Google Scholar] [CrossRef] [PubMed]
  11. Mansour, H.; Asher, R.; Dahl, D.; Labkovsky, B.; Perides, G.; Bignami, A. Permissive and Non-permissive Reactive Astrocytes: Immunofluorescence Study with Antibodies to the Glial Hyaluronate-binding Protein. J. Neurosci. Res. 1990, 25, 300–311. [Google Scholar] [CrossRef] [PubMed]
  12. Xing, G.; Ren, M.; Verma, A. Divergent Temporal Expression of Hyaluronan Metabolizing Enzymes and Receptors with Craniotomy vs. Controlled-Cortical Impact Injury in Rat Brain: A Pilot Study. Front. Neurol. 2014, 5, 173. [Google Scholar] [CrossRef]
  13. Oohashi, T.; Edamatsu, M.; Bekku, Y.; Carulli, D. The Hyaluronan and Proteoglycan Link Proteins: Organizers of the Brain Extracellular Matrix and Key Molecules for Neuronal Function and Plasticity. Exp. Neurol. 2015, 274, 134–144. [Google Scholar] [CrossRef] [PubMed]
  14. Vigetti, D.; Viola, M.; Karousou, E.; De Luca, G.; Passi, A. Metabolic Control of Hyaluronan Synthases. Matrix Biol. 2014, 35, 8–13. [Google Scholar] [CrossRef]
  15. Melero-Fernandez de Mera, R.M.; Arasu, U.T.; Kärnä, R.; Oikari, S.; Rilla, K.; Vigetti, D.; Passi, A.; Heldin, P.; Tammi, M.I.; Deen, A.J. Effects of Mutations in the Post-Translational Modification Sites on the Trafficking of Hyaluronan Synthase 2 (HAS2). Matrix Biol. 2019, 80, 85–103. [Google Scholar] [CrossRef]
  16. Vigetti, D.; Genasetti, A.; Karousou, E.; Viola, M.; Clerici, M.; Bartolini, B.; Moretto, P.; De Luca, G.; Hascall, V.C.; Passi, A. Modulation of Hyaluronan Synthase Activity in Cellular Membrane Fractions. J. Biol. Chem. 2009, 284, 30684–30694. [Google Scholar] [CrossRef] [PubMed]
  17. Peters, A.; Sherman, L.S. Diverse Roles for Hyaluronan and Hyaluronan Receptors in the Developing and Adult Nervous System. Int. J. Mol. Sci. 2020, 21, 5988. [Google Scholar] [CrossRef]
  18. Van’t Spijker, H.M.; Kwok, J.C.F. A Sweet Talk: The Molecular Systems of Perineuronal Nets in Controlling Neuronal Communication. Front. Integr. Neurosci. 2017, 11, 33. [Google Scholar] [CrossRef]
  19. Galtrey, C.M.; Kwok, J.C.F.; Carulli, D.; Rhodes, K.E.; Fawcett, J.W. Distribution and Synthesis of Extracellular Matrix Proteoglycans, Hyaluronan, Link Proteins and Tenascin-R in the Rat Spinal Cord. Eur. J. Neurosci. 2008, 27, 1373–1390. [Google Scholar] [CrossRef]
  20. Costa, C.; Tortosa, R.; Domènech, A.; Vidal, E.; Pumarola, M.; Bassols, A. Mapping of Aggrecan, Hyaluronic Acid, Heparan Sulphate Proteoglycans and Aquaporin 4 in the Central Nervous System of the Mouse. J. Chem. Neuroanat. 2007, 33, 111–123. [Google Scholar] [CrossRef] [PubMed]
  21. Bistoletti, M.; Bosi, A.; Caon, I.; Chiaravalli, A.M.; Moretto, P.; Genoni, A.; Moro, E.; Karousou, E.; Viola, M.; Crema, F.; et al. Involvement of Hyaluronan in the Adaptive Changes of the Rat Small Intestine Neuromuscular Function after Ischemia/Reperfusion Injury. Sci. Rep. 2020, 10, 11521. [Google Scholar] [CrossRef] [PubMed]
  22. Bosi, A.; Banfi, D.; Bistoletti, M.; Catizzone, L.M.; Chiaravalli, A.M.; Moretto, P.; Moro, E.; Karousou, E.; Viola, M.; Giron, M.C.; et al. Hyaluronan Regulates Neuronal and Immune Function in the Rat Small Intestine and Colonic Microbiota after Ischemic/Reperfusion Injury. Cells 2022, 11, 3370. [Google Scholar] [CrossRef] [PubMed]
  23. Filpa, V.; Bistoletti, M.; Caon, I.; Moro, E.; Grimaldi, A.; Moretto, P.; Baj, A.; Giron, M.C.; Karousou, E.; Viola, M.; et al. Changes in Hyaluronan Deposition in the Rat Myenteric Plexus after Experimentally-Induced Colitis. Sci. Rep. 2017, 7, 4021–4044. [Google Scholar] [CrossRef]
  24. Jiang, D.; Liang, J.; Noble, P.W. Hyaluronan as an Immune Regulator in Human Diseases. Physiol. Rev. 2011, 91, 221–264. [Google Scholar] [CrossRef] [PubMed]
  25. Kakizaki, I.; Kojima, K.; Takagaki, K.; Endo, M.; Kannagi, R.; Ito, M.; Maruo, Y.; Sato, H.; Yasuda, T.; Mita, S.; et al. A Novel Mechanism for the Inhibition of Hyaluronan Biosynthesis by 4-Methylumbelliferone. J. Biol. Chem. 2004, 279, 33281–33289. [Google Scholar] [CrossRef]
  26. Vigetti, D.; Rizzi, M.; Viola, M.; Karousou, E.; Genasetti, A.; Clerici, M.; Bartolini, B.; Hascall, V.C.; De Luca, G.; Passi, A. The Effects of 4-Methylumbelliferone on Hyaluronan Synthesis, MMP2 Activity, Proliferation, and Motility of Human Aortic Smooth Muscle Cells. Glycobiology 2009, 19, 537–546. [Google Scholar] [CrossRef]
  27. Girardello, R.; Baranzini, N.; Molteni, M.; Rossetti, C.; Tettamanti, G.; de Eguileor, M.; Grimaldi, A. The Medicinal Leech as a Valuable Model for Better Understanding the Role of a TLR4-like Receptor in the Inflammatory Process. Cell Tissue Res. 2019, 377, 245–257. [Google Scholar] [CrossRef]
  28. Hinz, M.; Scheidereit, C. The IκB Kinase Complex in NF-κB Regulation and Beyond. EMBO Rep. 2013, 15, 46–61. [Google Scholar] [CrossRef]
  29. Bourgognon, J.-M.; Cavanagh, J. The Role of Cytokines in Modulating Learning and Memory and Brain Plasticity. Brain Neurosci. Adv. 2020, 4, 239821282097980. [Google Scholar] [CrossRef]
  30. Adami, C.; Sorci, G.; Blasi, E.; Agneletti, A.L.; Bistoni, F.; Donato, R. S100b Expression in and Effects on Microglia. Glia 2001, 33, 131–142. [Google Scholar] [CrossRef]
  31. Arranz, A.M.; Perkins, K.L.; Irie, F.; Lewis, D.P.; Hrabe, J.; Xiao, F.; Itano, N.; Kimata, K.; Hrabetova, S.; Yamaguchi, Y. Hyaluronan Deficiency Due to Has3 Knock-out Causes Altered Neuronal Activity and Seizures via Reduction in Brain Extracellular Space. J. Neurosci. 2014, 34, 6164–6176. [Google Scholar] [CrossRef]
  32. Chistyakov, D.V.; Nikolskaya, A.I.; Goriainov, S.V.; Astakhova, A.A.; Sergeeva, M.G. Inhibitor of Hyaluronic Acid Synthesis 4-Methylumbelliferone as an Anti-Inflammatory Modulator of Lps-Mediated Astrocyte Responses. Int. J. Mol. Sci. 2020, 21, 8203. [Google Scholar] [CrossRef]
  33. Rilla, K.; Pasonen-Seppänen, S.; Deen, A.J.; Koistinen, V.V.T.; Wojciechowski, S.; Oikari, S.; Kärnä, R.; Bart, G.; Törrönen, K.; Tammi, R.H.; et al. Hyaluronan Production Enhances Shedding of Plasma Membrane-Derived Microvesicles. Exp. Cell Res. 2013, 319, 2006–2018. [Google Scholar] [CrossRef]
  34. Tavianatou, A.G.; Caon, I.; Franchi, M.; Piperigkou, Z.; Galesso, D.; Karamanos, N.K. Hyaluronan: Molecular Size-Dependent Signaling and Biological Functions in Inflammation and Cancer. FEBS J. 2019, 286, 2883–2908. [Google Scholar] [CrossRef] [PubMed]
  35. Dubisova, J.; Burianova, J.S.; Svobodova, L.; Makovicky, P.; Martinez-Varea, N.; Cimpean, A.; Fawcett, J.W.; Kwok, J.C.F.; Kubinova, S. Oral Treatment of 4-Methylumbelliferone Reduced Perineuronal Nets and Improved Recognition Memory in Mice. Brain Res. Bull. 2022, 181, 144–156. [Google Scholar] [CrossRef]
  36. Liu, T.; Zhang, L.; Joo, D.; Sun, S.C. NF-ΚB Signaling in Inflammation. Signal Transduct. Target. Ther. 2017, 2, 17023. [Google Scholar] [CrossRef] [PubMed]
  37. Lokeshwar, V.B.; Lopez, L.E.; Munoz, D.; Chi, A.; Shirodkar, S.P.; Lokeshwar, S.D.; Escudero, D.O.; Dhir, N.; Altman, N. Antitumor Activity of Hyaluronic Acid Synthesis Inhibitor 4-Methylumbelliferone in Prostate Cancer Cells. Cancer Res. 2010, 70, 2613–2623. [Google Scholar] [CrossRef]
  38. Dresselhaus, E.C.; Meffert, M.K. Cellular Specificity of NF-ΚB Function in the Nervous System. Front. Immunol. 2019, 10, 1043. [Google Scholar] [CrossRef]
  39. Zhang, G.; Guo, L.; Yang, C.; Liu, Y.; He, Y.; Du, Y.; Wang, W.; Gao, F. A Novel Role of Breast Cancer-Derived Hyaluronan on Inducement of M2-like Tumor-Associated Macrophages Formation. Oncoimmunology 2016, 5, e1172154. [Google Scholar] [CrossRef]
  40. Frank, M.G.; Baratta, M.V.; Sprunger, D.B.; Watkins, L.R.; Maier, S.F. Microglia Serve as a Neuroimmune Substrate for Stress-Induced Potentiation of CNS pro-Inflammatory Cytokine Responses. Brain. Behav. Immun. 2007, 21, 47–59. [Google Scholar] [CrossRef] [PubMed]
  41. Austin, J.W.; Gilchrist, C.; Fehlings, M.G. High Molecular Weight Hyaluronan Reduces Lipopolysaccharide Mediated Microglial Activation. J. Neurochem. 2012, 122, 344–355. [Google Scholar] [CrossRef]
  42. Teeling, J.L.; Perry, V.H. Systemic Infection and Inflammation in Acute CNS Injury and Chronic Neurodegeneration: Underlying Mechanisms. Neuroscience 2009, 158, 1062–1073. [Google Scholar] [CrossRef]
  43. Banfi, D.; Moro, E.; Bosi, A.; Bistoletti, M.; Cerantola, S.; Crema, F.; Maggi, F.; Giron, M.C.; Giaroni, C.; Baj, A. Impact of Microbial Metabolites on Microbiota–Gut–Brain Axis in Inflammatory Bowel Disease. Int. J. Mol. Sci. 2021, 22, 1623. [Google Scholar] [CrossRef]
  44. Tewari, B.P.; Chaunsali, L.; Prim, C.E.; Sontheimer, H. A Glial Perspective on the Extracellular Matrix and Perineuronal Net Remodeling in the Central Nervous System. Front. Cell. Neurosci. 2022, 16, 1022754. [Google Scholar] [CrossRef]
  45. Keschenau, P.R.; Ribbe, S.; Tamm, M.; Hanssen, S.J.; Tolba, R.; Jacobs, M.J.; Kalder, J. Extracorporeal Circulation Increases Proliferation in the Intestinal Mucosa in a Large Animal Model. J. Vasc. Surg. 2016, 64, 1121–1133. [Google Scholar] [CrossRef] [PubMed]
  46. Smith, W.S.; Mapstone, M. Does Extracorporeal Circulation Harm the Brain? Neurology 2005, 65, 978–979. [Google Scholar] [CrossRef]
  47. Tian, X.; Azpurua, J.; Hine, C.; Vaidya, A.; Myakishev-Rempel, M.; Ablaeva, J.; Mao, Z.; Nevo, E.; Gorbunova, V.; Seluanov, A. High-Molecular-Mass Hyaluronan Mediates the Cancer Resistance of the Naked Mole Rat. Nature 2013, 499, 346–349. [Google Scholar] [CrossRef] [PubMed]
  48. Olivares, C.N.; Alaniz, L.D.; Menger, M.D.; Barañao, R.I.; Laschke, M.W.; Meresman, G.F. Inhibition of Hyaluronic Acid Synthesis Suppresses Angiogenesis in Developing Endometriotic Lesions. PLoS ONE 2016, 11, e0152302. [Google Scholar] [CrossRef] [PubMed]
  49. Yang, Y.M.; Noureddin, M.; Liu, C.; Ohashi, K.; Kim, S.Y.; Ramnath, D.; Powell, E.E.; Sweet, M.J.; Roh, Y.S.; Hsin, I.F.; et al. Hyaluronan Synthase 2-Mediated Hyaluronan Production Mediates Notch1 Activation and Liver Fibrosis. Sci. Transl. Med. 2019, 11, eaat9284. [Google Scholar] [CrossRef]
  50. Yates, T.J.; Lopez, L.E.; Lokeshwar, S.D.; Ortiz, N.; Kallifatidis, G.; Jordan, A.; Hoye, K.; Altman, N.; Lokeshwar, V.B. Dietary Supplement 4-Methylumbelliferone: An Effective Chemopreventive and Therapeutic Agent for Prostate Cancer. J. Natl. Cancer Inst. 2015, 107, djv085. [Google Scholar] [CrossRef]
  51. Filpa, V.; Carpanese, E.; Marchet, S.; Pirrone, C.; Conti, A.; Rainero, A.; Moro, E.; Chiaravalli, A.M.; Zucchi, I.; Moriondo, A.; et al. Nitric Oxide Regulates Homeoprotein OTX1 and OTX2 Expression in the Rat Myenteric Plexus after Intestinal Ischemia-Reperfusion Injury. Am. J. Physiol. Gastrointest. Liver Physiol. 2017, 312, G374–G389. [Google Scholar] [CrossRef] [PubMed]
  52. Bistoletti, M.; Caputi, V.; Baranzini, N.; Marchesi, N.; Filpa, V.; Marsilio, I.; Cerantola, S.; Terova, G.; Baj, A.; Grimaldi, A.; et al. Antibiotic Treatment-Induced Dysbiosis Differently Affects BDNF and TrkB Expression in the Brain and in the Gut of Juvenile Mice. PLoS ONE 2019, 14, e0212856. [Google Scholar] [CrossRef]
  53. Yoshida, H.; Nagaoka, A.; Kusaka-Kikushima, A.; Tobiishi, M.; Kawabata, K.; Sayo, T.; Sakai, S.; Sugiyama, Y.; Enomoto, H.; Okada, Y.; et al. KIAA1199, a Deafness Gene of Unknown Function, Is a New Hyaluronan Binding Protein Involved in Hyaluronan Depolymerization. Proc. Natl. Acad. Sci. USA 2013, 110, 5612–5617. [Google Scholar] [CrossRef]
  54. Fukui, Y.; Morihara, R.; Hu, X.; Nakano, Y.; Yunoki, T.; Takemoto, M.; Abe, K.; Yamashita, T. Suppression of PTBP1 in Hippocampal Astrocytes Promotes Neurogenesis and Ameliorates Recognition Memory in Mice with Cerebral Ischemia. Sci. Rep. 2024, 14, 20521. [Google Scholar] [CrossRef] [PubMed]
  55. Wu, J.-S.; Lõhelaid, H.; Shih, C.-C.; Liew, H.-K.; Wang, V.; Hu, W.-F.; Chen, Y.-H.; Saarma, M.; Airavaara, M.; Tseng, K.-Y. Targeting Rap1b Signaling Cascades with CDNF: Modulating Platelet Activation, Regulating Plasma Oxylipins and Mitigating Reperfusion Injury in Stroke. Mol. Ther. 2024, 32, 4021–4044. [Google Scholar] [CrossRef]
  56. Prajapati, K.S.; Kumar, S. Loss of MiR-6844 Alters Stemness/Self-Renewal and Cancer Hallmark(s) Markers through CD44-JAK2-STAT3 Signaling Axis in Breast Cancer Stem-like Cells. J. Cell. Biochem. 2023, 124, 1186–1202. [Google Scholar] [CrossRef] [PubMed]
  57. Zhang, Z.D.; Li, H.X.; Gan, H.; Tang, Z.; Guo, Y.Y.; Yao, S.Q.; Liuyu, T.; Zhong, B.; Lin, D. RNF115 Inhibits the Post-ER Trafficking of TLRs and TLRs-Mediated Immune Responses by Catalyzing K11-Linked Ubiquitination of RAB1A and RAB13. Adv. Sci. 2022, 9, e2105391. [Google Scholar] [CrossRef]
  58. Wang, H.C.; Lee, W. Sen Progesterone-Induced Migration Inhibition in Male Rat Aortic Smooth Muscle Cells through the CSrc/AKT/ERK 2/P38 Pathway-Mediated Up-Regulation of P27. Endocrinology 2014, 155, 1428–1435. [Google Scholar] [CrossRef]
  59. Cha, M.; Lee, K.H.; Lee, B.H. Astroglial Changes in the Zona Incerta in Response to Motor Cortex Stimulation in a Rat Model of Chronic Neuropathy. Sci. Rep. 2020, 10, 943. [Google Scholar] [CrossRef]
Figure 1. Hyaluronan immunofluorescence in the rat hippocampus after intestinal IRI: modulation by 4-MU. (A) Fluorescence microscopy images showing in red HABP immunostaining in the CA1 region of the hippocampus from the different experimental groups in the absence or presence of 4-MU treatment (25 mg/kg i.p.) as indicated on each panel and counterstained with DAPI (blue) (bars: 50 µm). The upper panel on the left represents a panoramic image of the hippocampus (bar: 500 µm), the upper panel on the right is a negative control (bar: 50 µm). (B) HABP fluorescent intensity obtained from the different experimental groups. N = 5 rat/group. Data are reported as mean ± SEM **** p < 0.0001, by one-way ANOVA with Tukey’s post hoc test.
Ijms 26 10064 g001
Figure 2. Hippocampal expression profiles of hyaluronan synthases and hyaluronidases after intestinal IRI. (AC) Has1, Has2, Has3 and (DF) Hyal1, Hyal2, Hyal3 mRNA levels obtained from the different experimental groups. Graphs show Hases and Hyales relative gene expression to ACTβ. N = 5 rat/group. Data are reported as mean ± SEM **** p < 0.0001, ** p < 0.01, * p < 0.05 by one-way ANOVA with Tukey’s post hoc test.
Ijms 26 10064 g002
Figure 3. Influence of intestinal IRI on chondroitin sulfate proteoglycans, aggrecan (ACAN), and neurocan (NCAN) expression in the rat hippocampus after IRI and modulation by 4-MU. (A) Acan and (B) Ncan mRNA levels in the rat hippocampus obtained from the different experimental groups in the absence or presence of 4-MU treatment (25 mg/kg i.p.). Graphs show aggrecan and neurocan relative gene expression determined by calculating 2−ΔΔCt and normalized to ACTβ. (C) NCAN fluorescent intensity obtained from the different experimental groups. (D) Fluorescence microscopy images showing in red NCAN immunostaining in the CA1 region of the hippocampus from the different experimental groups, as indicated on each panel and counterstained with DAPI (blue) (bars: 50 µm). The upper panel on the left represents a panoramic image (bar: 500 µm), while the lower panel on the left is a negative control (bar: 50 µm). N = 5 rat/group. Data are reported as mean ± SEM **** p < 0.0001, ** p < 0.01, *** p < 0.001, one-way ANOVA with Tukey’s post hoc test.
Ijms 26 10064 g003
Figure 4. Hyaluronan immunofluorescence in the rat striatum after intestinal IRI: modulation by 4-MU. (A) Fluorescence microscopy images showing in red HABP immunostaining in the rat striatum from the different experimental groups in the absence or presence of 4-MU treatment (25 mg/kg i.p.) as indicated on each panel and counterstained with DAPI (blue) (bars: 50 µm). The lower panel represents a negative control (bars: 50 µm). (B) HABP fluorescent intensity obtained from the different experimental groups. N = 5 rat/group. Data are reported as mean ± SEM; **** p < 0.0001 by one-way ANOVA with Tukey’s post hoc test.
Ijms 26 10064 g004
Figure 5. Striatal expression profiles of hyaluronan synthases and hyaluronidases after intestinal IRI. (AC) Has1, Has2, Has3 and (DF) Hyal1, Hyal2, Hyal3 mRNA levels obtained from the different experimental groups. Graphs show Hases and Hyales relative gene expression to ACTβ. N = 5 rat/group. Data are reported as mean ± SEM *** p < 0.001, ** p < 0.01, by one-way ANOVA with Tukey’s post hoc test.
Ijms 26 10064 g005
Figure 6. Influence of intestinal IRI on chondroitin sulfate proteoglycans, aggrecan (ACAN), and neurocan (NCAN) expression in the rat striatum after intestinal IRI and modulation by 4-MU. (A) Acan and (B) Ncan mRNA levels in the rat striatum obtained from the different experimental groups in the absence or presence of 4-MU treatment (25 mg/kg i.p.). Graphs show Acan and Ncan relative gene expression determined by calculating 2−ΔΔCt and normalized to ACTβ. (C) Neurocan fluorescent intensity obtained from the different experimental groups. (D) Fluorescence microscopy images showing in red NCAN immunostaining in the rat striatum from the different experimental groups, as indicated on each panel and counterstained with DAPI (blue) (bars: 50 µm). The upper panel on the left represents a negative control (bars: 50 µm). N = 5 rat/group. Data are reported as mean ± SEM; **** p < 0.0001, *** p < 0.001, ** p < 0.01, * p < 0.05 one-way ANOVA with Tukey’s post hoc test.
Ijms 26 10064 g006
Figure 7. Effect of 4-MU on TLR4 and CD44 expressions in the rat brain after intestinal IRI. Tlr4 and Cd44 mRNA levels in the hippocampus (A,B) and striatum (E,F) obtained from the different experimental groups in the absence or presence of 4-MU treatment (25 mg/kg i.p.). Graphs show Tlr4 and Cd44 relative gene expression determined by calculating 2−ΔΔCt normalized to ACTβ. TLR4 (C,G) and CD44 (D,H) protein levels in the hippocampus (C,D) and striatum (G,H) of the different experimental conditions. Blots representative of immunoreactive bands for TLR4, CD44 and ACTβ. Samples (80 µg) were electrophoresed in SDS-8% polyacrylamide gels. Numbers at the margins of the blots indicate relative molecular weights of the respective protein in kDa. Data are expressed as the optical density (O.D.) ratio of TLR4 and CD44 vs. ACTβ and normalized as a percentage relative to the CTR group. N = 5 rat/group. Data are reported as mean ± SEM; ** p < 0.01, * p < 0.05 by one-way ANOVA with Tukey’s post hoc test.
Ijms 26 10064 g007
Figure 8. Effect of 4-MU on NF-κB and pIκBα in the rat brain after intestinal IRI. (A,C) Nfkb mRNA levels in the (A) hippocampus and (C) striatum obtained from the different experimental groups in the absence or presence of 4-MU treatment (25 mg/kg i.p.). Graphs show Nfkb relative gene expression determined by calculating 2−ΔΔCt values normalized to ACTβ. (B,D) pIκBα protein levels in the (B) hippocampus and (D) striatum in the different experimental conditions. Blots representative of immunoreactive bands for pIκBα and ACTβ. Samples (80 µg) were electrophoresed in SDS-8% polyacrylamide gels. Numbers at the margins of the blots indicate relative molecular weights of the respective protein in kDa. Data are expressed as the optical density (O.D.) ratio of pIκBα vs. ACTβ and normalized as a percentage relative to the CTR group. N = 5 rat/group. Data are reported as mean ± SEM; **** p < 0.0001, *** p < 0.001, ** p < 0.01, * p < 0.05 by one-way ANOVA with Tukey’s post hoc test.
Ijms 26 10064 g008
Figure 9. Effect of 4-MU on inflammatory cytokine mRNA levels in the rat hippocampus and striatum after intestinal IRI. (AD) Il6 and Tnfa mRNA levels in the hippocampus (A,B) and striatum (C,D) obtained from the different experimental groups in the absence or presence of 4-MU treatment (25 mg/kg i.p.). Graphs show Il6 and Tnfa relative gene expression determined by calculating 2−ΔΔCt and normalized to ACTβ. N = 5 rat/group. Data are reported as mean ± SEM **** p < 0.0001, *** p < 0.001, ** p < 0.01, * p < 0.05 by one-way ANOVA with Tukey’s post hoc test.
Ijms 26 10064 g009
Figure 10. Influence of 4-MU on intestinal IRI-induced changes in IL6 and the microglial marker, S100β, in the hippocampus. (A) Fluorescence microscopy images showing green S100β and red IL6 immunostaining in the CA1 region of the rat hippocampus from the different experimental groups in the absence or presence of 4-MU treatment (25 mg/kg i.p.) as indicated on each panel and counterstained with DAPI (blue) (bars: 100 µm). The upper panel on the left represents a panoramic image (bars: 500 µm); the upper panel on the right is a negative control (bars: 100 µm). (B) IL6 and (C) S100β fluorescent intensity obtained from the different experimental groups. (D) S100β relative gene expression determined by calculating 2−ΔΔCt and normalized to ACTβ. N = 5 rat/group. Data are reported as mean ± SEM **** p < 0.0001, *** p < 0.01, ** p < 0.01, * p < 0.05 by one-way ANOVA with Tukey’s post hoc test.
Ijms 26 10064 g010
Figure 11. Influence of 4-MU on intestinal IRI-induced changes in IL6 and the microglial marker, S100β, in the striatum. (A) Fluorescence microscopy images showing green S100β and red IL6 immunostaining in the rat striatum from the different experimental groups in the absence or presence of 4-MU treatment (25 mg/kg i.p.) as indicated on each panel and counterstained with DAPI (blue) (bars: 100 µm). The lower panel represents a negative control (bars: 100 µm). (B) IL6 and (C) S100β fluorescent intensity obtained from the different experimental groups. (D) S100β relative gene expression to ACTβ. N = 5 rat/group. Data are reported as mean ± SEM **** p < 0.0001, *** p < 0.01 by one-way ANOVA with Tukey’s post hoc test.
Ijms 26 10064 g011
Table 1. Primary and secondary antisera and their respective dilutions used for immunohistochemistry (HC), hyaluronan localization, and Western blot (WB) assay.
Primary
Antibody
Host SpeciesDilution
(HC)
Dilution
(WB)
SpecificitySource
HABP-1:100-Hyaluronan [53]Hokudo (BC41)
S100βRabbit1:100-S100β [54]GeneTex (GTX129573)
IL6Mouse-1:200IL6 [55]Santa Cruz (sc-57315)
IL6Rabbit1:150-IL6 [55]Sigma Aldrich
(I2143)
CD44Rabbit 1:1000CD44 [56]Invitrogen (PA5-21419)
TLR4Rabbit 1:1000TLR4 [57] ABclonal (A5258)
pIκBαMouse-1:400pIκΒ−α [58]Santa Cruz (sc-8404)
ACTβMouse-1:1000Housekeeping [59] Cell Signaling
(#3700)
Secondary Antibody
& Streptavidin complex
Anti-rabbit Cy3-conjugatedGoat1:200- Jackson
(AB_2338006)
Anti-rabbit FITC-conjugatedGoat1:200- Jackson
(AB_2337972)
Streptavidin-Cy3-1:500- Amersham (PA43001)
Anti-rabbit IgG,HRP-linkedDonkey 1:2000 Amersham (NA934)
Anti-mouse IgG,HRP-linkedHorse-1:2000 Cell Signaling (#7076)
Supplying companies: Hokudo Co., Ltd., Sapporo, Japan; GeneTex, Alton Pkwy Irvine, CA, USA; Merk Life Science S.r.l., Milan, Italy; Santa Cruz Biotechnology Inc., Heidelberg Germany; Cell Signaling Technology, Danvers, MA, USA; Immunostar Inc., Hudson, WI, USA; Amersham, GE Healthcare, Buckinghamshire, UK; Jackson ImmunoResearch Cambridgeshire, UK; ABclonal, Wuhan, China.
Table 2. Sequence of primers used in the study for the qRT-PCR analysis.
GeneSequence
ACTβF 5′-CAGGGTGTGATGGTGGGTATGG-3′
R 5′-AGTTGGTGACAATGCCGTGTTC-3′
TnfaF 5′-CCCAGACCCTCACACTCAGAT-3′
R 5′-TTGTCCCTTGAAGAGAACCTG-3′
Il6F 5′-GTGCAATGGCAATTCTGATTGTA-3′
R 5′-CTAGGGTTTCAGTATTGCTCTGA-3′
NfkbF 5′-CCTTTCTCTACTACCCCGAAATC-3′
R 5′-GAAGTTGGGCATGAGCTTCT-3′
S100βF 5′-GGGTGACAAGCACAAGCTGAA-3′
R 5′-AGCGTCTCCATCACTTTGTCCA-3′
Cd44F 5′-AAGACATCGATGCCTCAAAC-3′
R 5′-CTCCAGTAGGCTGTGAAGTG-3′
Tlr4F 5′-TGAGATTGCTCAAACATGGC-3′
R 5′-CGAGGCTTTTCCATCCAATA-3′
Has1F 5′-AGTATACCTCGCGCTCCAGA-3′
R 5′-ACCACAGGGCGTTGTATAGC-3′
Has2F 5′-TTGGCCGGTCGTCTCAA-3′
R 5′-CGTCCTCCGCCTGTCTGT-3′
Has3F 5′-CCTCATCGCCACAGTCATACAA-3′
R 5′-CCACCAGCTGCACCGTTAGT-3′
Hyal1F 5′-GCCCATAATGCCCTACGTCCA-3′
R 5′-TGGCTTGGCATGACTCCTTG-3′
Hyal2F 5′-GGAGCGGGCTTAGCTGGTA-3′
R 5′-GGGCTACAGGAAGTGTCACC-3′
Hyal3F 5′-CACCAGATCCTCCACAACCT-3′
R 5′-GAGGCTGCCTGGTAGACTTG-3′
AcanF 5′-TCCACATCAGAAGAGCCATAC-3′
R 5′-AGTCAAGGTCGCCAGAGG-3′
NcanF 5′-TTTCAGTCCACAGCGATCAG-3′
R 5′-AGGAGAGGGATACAGCAGCA-3′
Disclaimer/Publisher’s Note: The statements, opinions and data contained in all publications are solely those of the individual author(s) and contributor(s) and not of MDPI and/or the editor(s). MDPI and/or the editor(s) disclaim responsibility for any injury to people or property resulting from any ideas, methods, instructions or products referred to in the content.