Article

Genome-Wide Identification of CONSTANS-like (COL) Gene Family and the Potential Function of ApCOL08 Under Salt Stress in Andrographis paniculata

1
Zhejiang Province Key Laboratory of Plant Secondary Metabolism and Regulation, College of Life Sciences and Medicine, Zhejiang Sci-Tech University, Hangzhou 310018, China
2
The UWA Institute of Agriculture, UWA School of Agriculture and Environment, Faculty of Science, The University of Western Australia, Crawley, WA 6009, Australia
*
Authors to whom correspondence should be addressed.
Int. J. Mol. Sci. 2025, 26(2), 724; https://doi.org/10.3390/ijms26020724
Submission received: 17 December 2024 / Revised: 5 January 2025 / Accepted: 14 January 2025 / Published: 16 January 2025
(This article belongs to the Section Molecular Plant Sciences)

Abstract

:
Andrographis paniculata is an important medicinal herb known as a “natural antibiotic”, which has been used in Southeast Asia for thousands of years. The CONSTANS-like (COL) gene is an important regulatory factor for plant photoperiod flowering and stress response. However, there is currently no detailed research on the COL genes of A. paniculata. In our study, we performed a genome-wide analysis of A. paniculata COL (ApCOL) family members using bioinformatics tools and identified nine ApCOL genes. Based on phylogenetic analysis, ApCOLs were categorized into three groups, with members of the same group having similar structures. Gene duplication events indicated that only one pair of duplicated genes was identified, possibly caused by segmental duplication. In terms of evolutionary relationships, the COL proteins of A. paniculata and Sesamum indicum were closely related, showing that they are highly similar in the phylogenetic tree. In addition, ApCOL genes showed tissue specificity and were specifically highly expressed mainly in leaves and flowers. Based on the cis-regulatory element prediction results, we examined the expression levels of ApCOLs under hormone and salt stress, and ApCOL08 was significantly induced. With subcellular localization results consistent with the prediction, we transformed ApCOL08 into yeast and showed significant resistance to salt stress. Our study suggests that ApCOL genes have important roles in response to abiotic stress and plant development and initially identifies key genes for future molecular regulation studies.

1. Introduction

Flowering is a vital part of the plant reproductive process, marking a shift from trophic to reproductive growth [1,2]. Flowering time is regulated by a combination of internal and external factors, such as photoperiod, hormones, environmental changes, and self-development, enabling plants to better adapt to different environmental conditions [3,4]. The CONSTANS-like (COL) gene is a pivotal regulator of the plant’s photoperiodic response by activating the flowering locus T (FT) transcription and transferring the FT protein from the leaf phloem to the apical meristematic tissue of the stem to promote plant flowering [5,6,7]. COL is a zinc-finger transcription factor characterized by two conserved structural domains, the N-terminal B-box domain and the C-terminal CCT (CO, CO-like, and TOC1) domain [8]. The B-box domain primarily serves as a protein-interacting module, while the CCT domain is responsible for nuclear localization and DNA binding [9,10]. These structurally conserved domains, the B-box and CCT, harbor crucial amino acid residues essential for the functionality of COL genes, and mutations within the B-box domain can potentially disrupt COL gene function [11]. In Arabidopsis, 17 COLs were divided into three subgroups based on different domains [8,12]. Group I has CO and COL1COL5, characterized by two B-box domains and one CCT domain. Group II includes COL6COL8 and COL16, featuring a single B-box domain and one CCT domain. Group III consists of COL9COL15 and contains a zinc-finger domain in addition to the B-box domain and the CCT domain [8,13].
Up to now, researches on the COL gene family have shown that it has many members in both dicots and monocots, for example, 17 in Arabidopsis [11], 16 in rice [13], 33 in Brassica napus [14], 22 in sunflower [15], 11 in Medicago [16], 26 in soybean [17], 42 in cotton [18], and 25 in banana [19]. Functional investigations have demonstrated the significant involvement of COL genes in regulating plant flowering time, various developmental stages, and stress response. In Arabidopsis, AtCOL3 is a positive regulator of photomorphogenesis and stimulates lateral root growth, shoot meristemization, and anthocyanin accumulation [20]. Arabidopsis with AtCOL5 overexpression results in earlier flowering under short-day (SD) conditions [12]. Overexpression of AtCOL8 and AtCOL9 delays flowering in Arabidopsis [21,22]. In rice, the AtCO homologous gene OsHd1 (Heading date 1) induces flowering under short-day (SD) conditions and inhibits flowering under long-day (LD) conditions [23,24]. Overexpression of OsCOL9 shortened flowering time by repressing the Ehd1 pathway [25]. According to reports on stress responses, AtCOL4 enhances tolerance to abiotic stresses such as acid, salt, and osmotic stress through abscisic acid (ABA) signaling pathways [26]. Ghd2 (COL gene) mediates drought tolerance in rice by regulating senescence [27]. Soybean (Glycine max) GmCOL1a enhances salt and drought resistance by promoting the accumulation of GmP5CS protein in transgenic soybean hairy roots [28]. In addition, the transcriptional activator MaCOL1 in bananas is implicated in fruit ripening and stress response [29].
Andrographis paniculata is an annual herb in the family of Acanthaceae, which has the effects of clearing away heat and detoxification, anti-inflammation and swelling, and is widely used in the treatment of many kinds of infectious diseases and venomous snake bites [30,31]. Modern pharmacological research shows that A. paniculata also has a variety of medicinal functions, such as anti-cancer, anti-virus, anti-tumor, antioxidant, hypoglycemic, and hepatoprotective, so it is known as the “natural antibiotic” and has become one of the most important herbs in Asia [32,33,34]. The main active ingredients of A. paniculata are diterpene lactones, including andrographolide (AD), neoandrographolide (NAD), 14-deoxyandrographolide (14DAP), and dehydroandrographolide (DDAD), which vary greatly in different organs, with the largest content in leaves [35]. Among them, the pharmacological effects of andrographolide are the most extensive, with its specific efficacy against bacterial upper respiratory tract infections, and it has been demonstrated to have a significant effect against COVID-19 [36]. It has been reported that the best time to harvest A. paniculata is at the bud stage, when its content of andrographolide reaches its highest; so, the flowering time of A. paniculata has a great influence on the yield [37].
With the continuous expansion of the clinical application of A. paniculata, there is a need to study high-quality and high-yield A. paniculata. A. paniculata has been documented to exhibit high sensitivity to salt stress [38], which affects the synthesis of the key secondary metabolite of A. paniculata, diterpene lactones, thereby affecting its growth and yield [39]. Furthermore, the modulation of plant growth regulators and hormones can influence plant development and physiological processes, consequently affecting crop yield, quality, and stress resilience through comparable biological and physiological mechanisms [40,41]. As stimulants, phytohormones are involved in signaling networks that regulate the synthesis of secondary metabolites. It has been reported that phytohormones can increase the level of andrographolide in A. paniculata by upregulating the expression of genes related to terpene metabolism [42,43,44,45]. Hence, understanding the plant’s stress response mechanisms and identifying genes involved in hormone regulation can facilitate the investigation and selection of stress-tolerant, high-yielding variants of A. paniculata.
The current complete assembly of the A. panicuulata genome provides a resource for studying the molecular mechanisms and key genes involved in A. paniculata biosynthesis [37,46]. Although the COL gene family is well-studied in many species, focusing mainly on light regulation and circadian rhythms in plants, its important role in growth and development and stress responses has not been extensively studied, and there is currently no systematic analysis and study of COL transcription factors in A. panicuulata. Therefore, in this study, we identified nine COLs by bioinformatics methods based on the whole genome sequence information of A. paniculata and analyzed in depth their genetic structures, cis-regulatory elements within promoters, evolutionary relationships, and expression profiles. In addition, combining transcriptomic analysis, yeast heterologous expression, and qRT-PCR techniques, we investigated the ApCOL gene family, revealing its pivotal roles in responding to abiotic stress (specifically salt stress) and hormone regulation. These findings provide novel insights and candidate genes for the enhancement of A. paniculata through breeding programs.

2. Results

2.1. Distribution, Characterization, and Expansion of the Nine Identified ApCOL Genes

We identified nine COL genes in the A. paniculata genome and predicted and analyzed their physical location and physicochemical properties. Detailed information is listed in Table 1, including gene name, gene ID, chromosomal location, gene length, protein length, molecular weight (MW), isoelectric point (pI), and subcellular localization prediction. In addition, the classification, location, exon number, and BBOX and CCT structural domains of ApCOL members were added to Table S1. ApCOLs were renamed from ApCOL01 to ApCOL09, depending on the location of the gene on the chromosome. The gene length of ApCOLs ranged from 1212 bp (ApCOL07) to 5067 bp (ApCOL03), while the length of its corresponding protein ranges from 329 aa (ApCOL03) to 433 aa (ApCOL08). The online program predicted the MWs of COL proteins in the range of 35.32 kDa (ApCOL03) to 48.41 kDa (ApCOL08), with theoretical pIs ranging from 5.1 (ApCOL02 and ApCOL05) to 6.81 (ApCOL07). In addition, the subcellular localization predicted that the majority of COL proteins were located in the nucleus (77.7%), with the remainder (ApCOL02 and ApCOL07) being located in the chloroplast (Table 1).
In addition, nine ApCOL genes were localized on six chromosomes and were unevenly distributed. They were mainly concentrated on Chr1(2) and Chr2(3), and the remaining ApCOLs were mono-distributed on Chr13, -15, -19, and -21, respectively. Due to the low number of identified ApCOL genes, we analyzed the COL gene duplication events in the A. paniculata genome to understand the amplification mechanism of the ApCOL gene family. The results showed that only one pair of duplicated genes (ApCOL01/ApCOL04) was identified, and it might have been generated by segmental duplication or whole genome duplication (WGD) (Figure 1).

2.2. Phylogenetic Analysis and Well-Defined Classification of Andrographis paniculata COL Genes

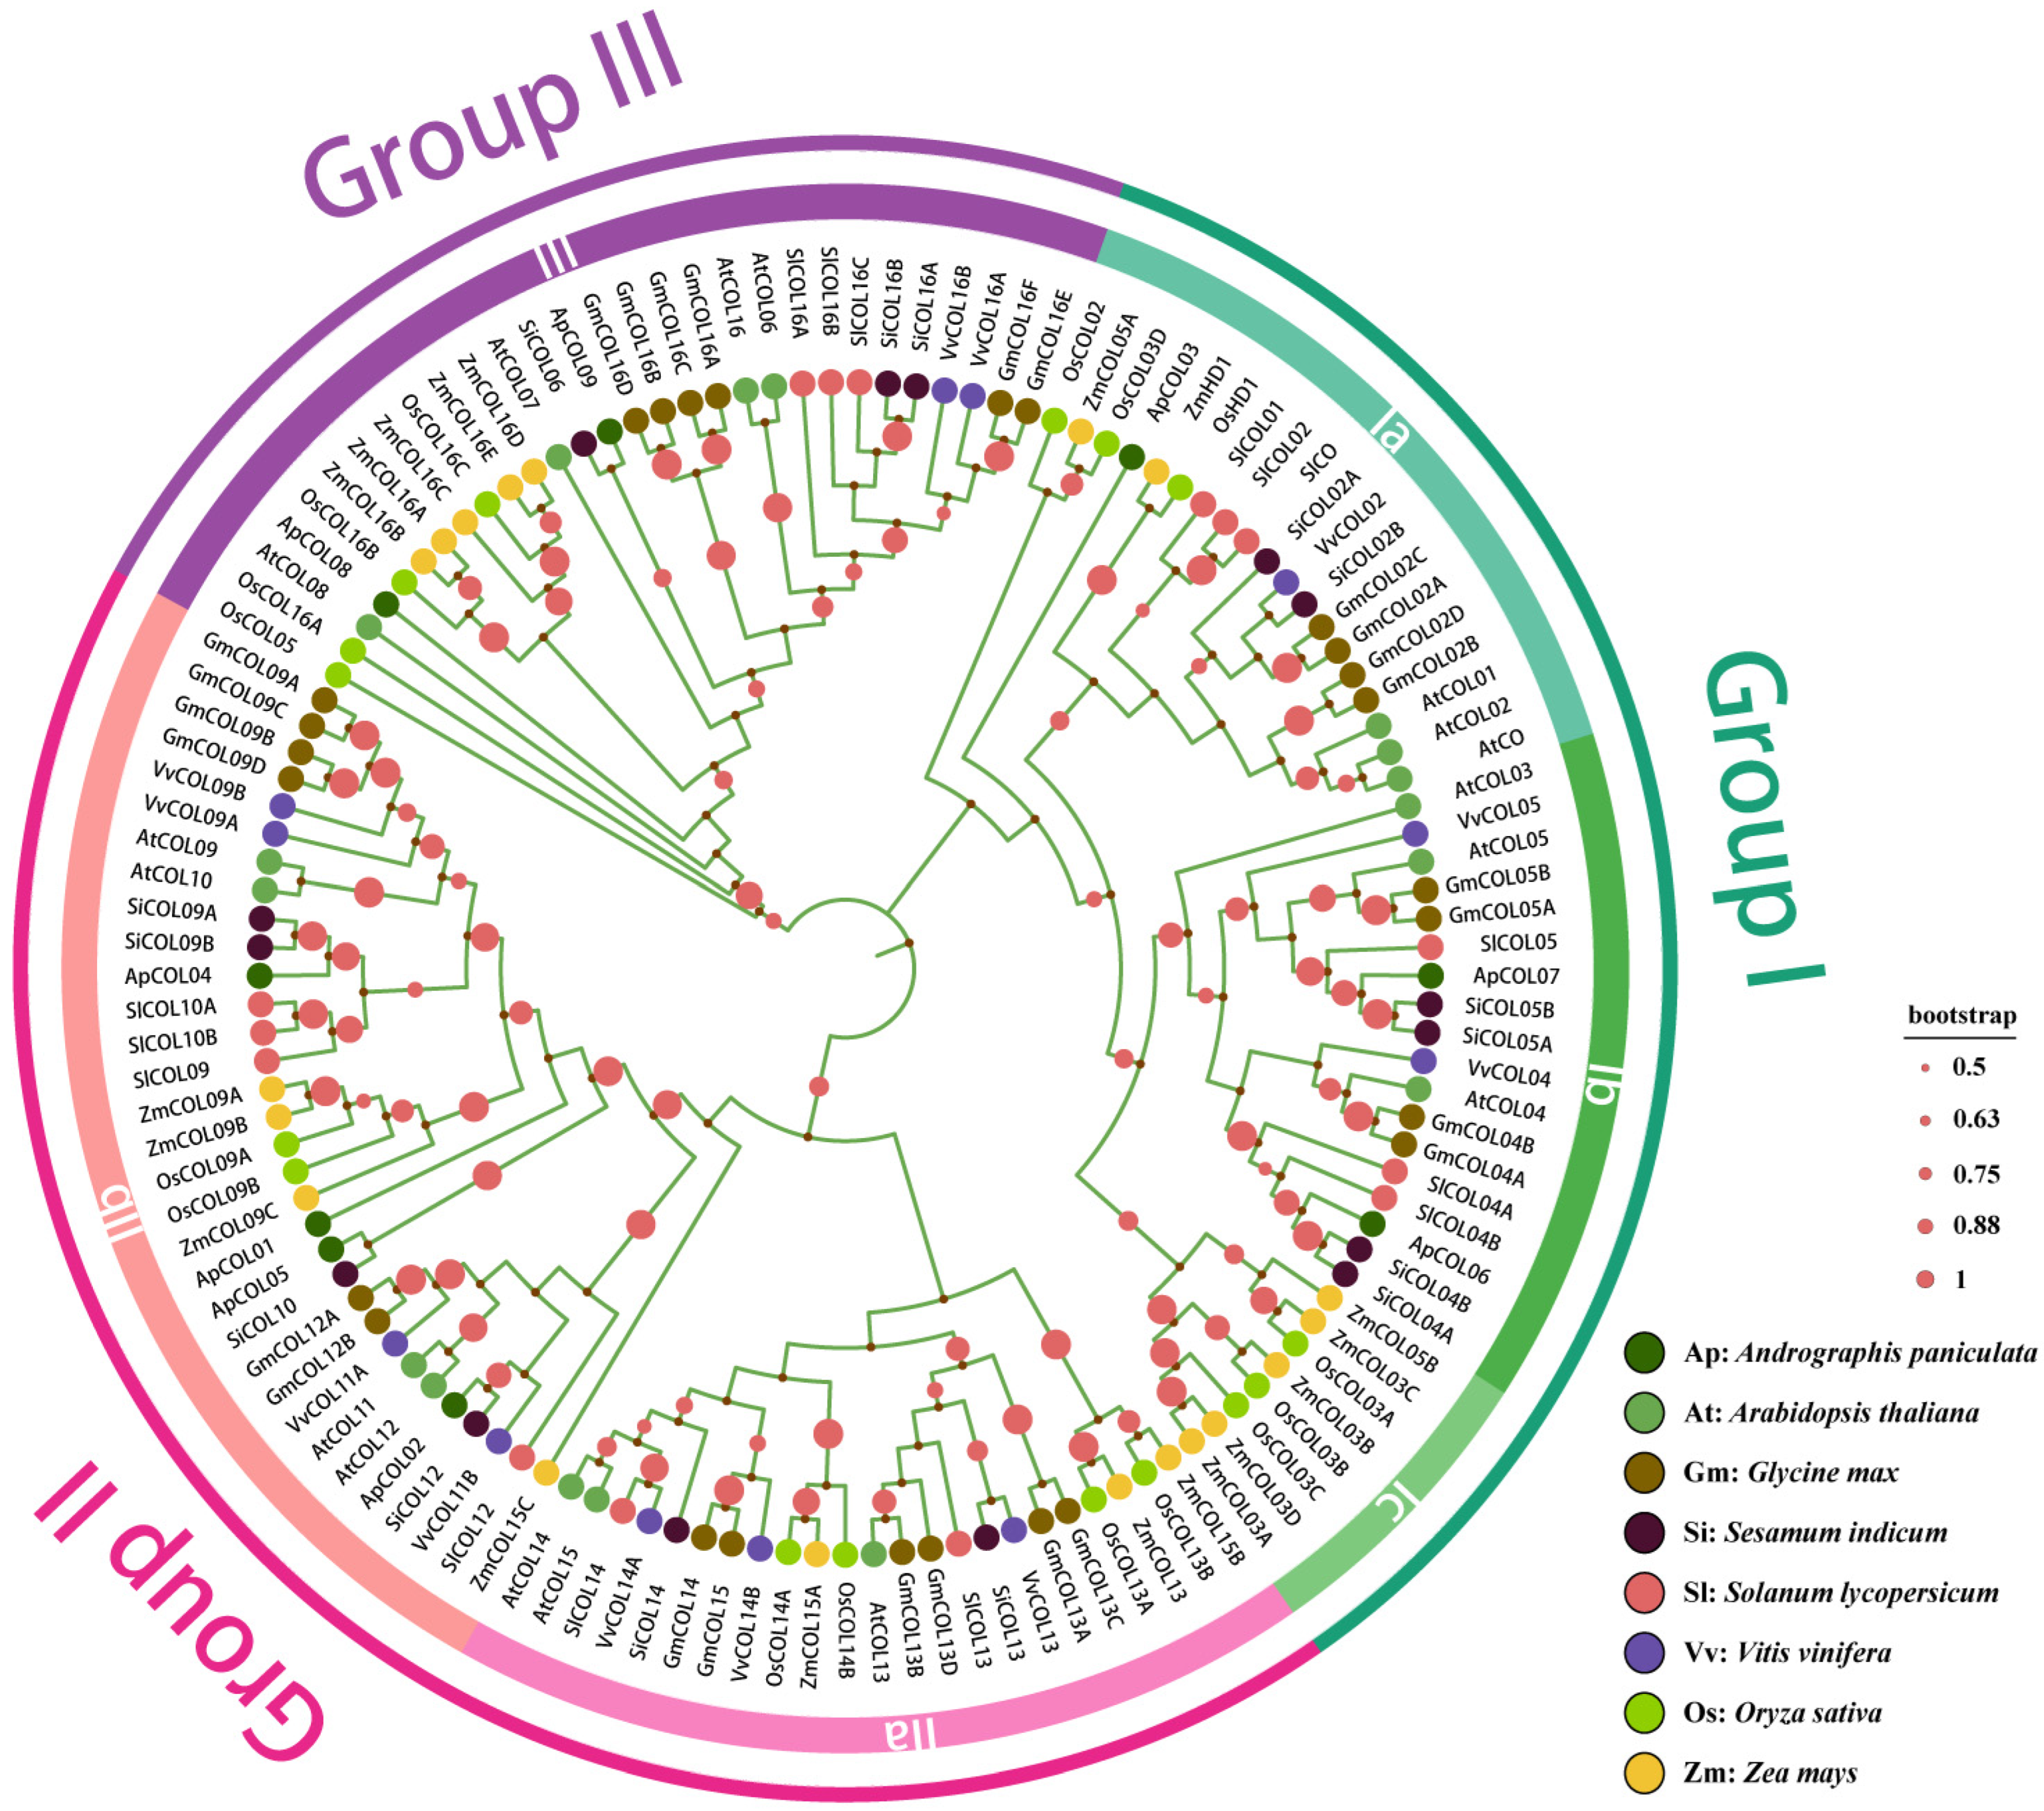
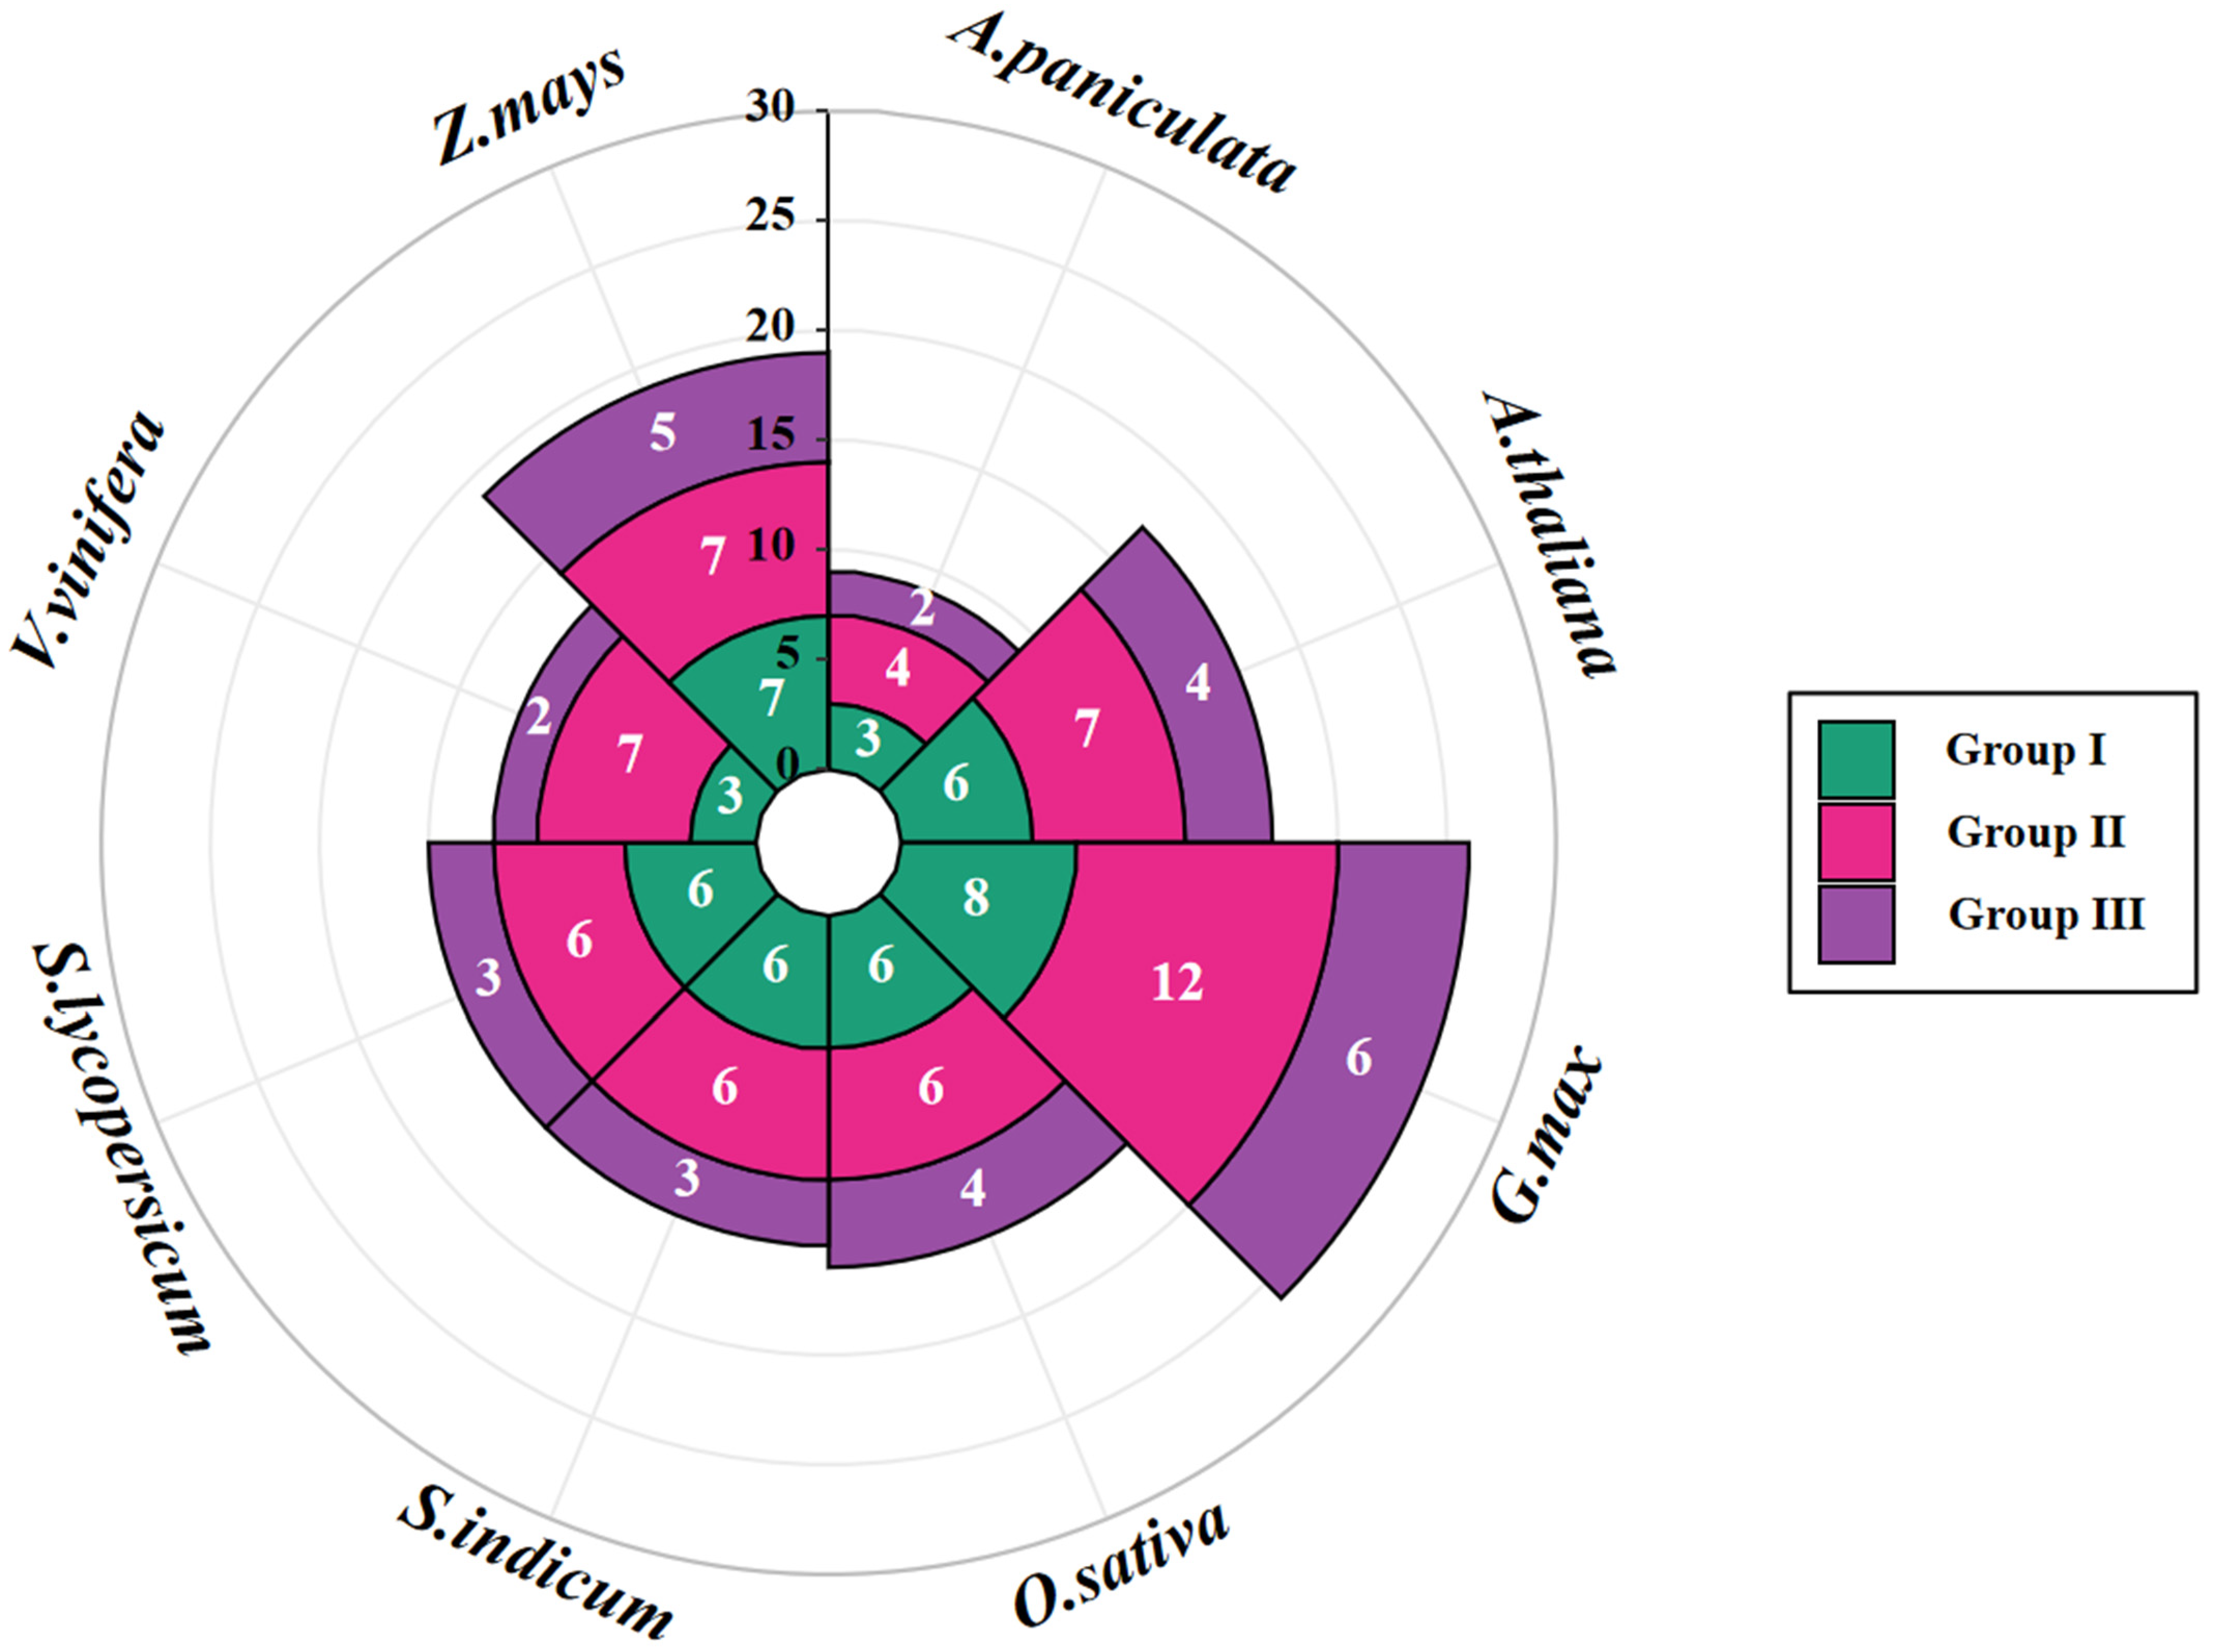
To understand the evolutionary relationships of COL gene families among different species, we constructed a multi-species phylogenetic tree by the neighbor-joining method, which included both dicotyledons (A. paniculata, 9; Arabidopsis, 17; soybean, 26; sesame, 15; tomato, 15; grape, 12) and monocotyledons (rice, 16; maize, 19). Phylogenetic analyses showed that during evolution, COL genes strongly clustered into three clusters: groups I, II, and III (Figure 2). This is consistent with previous reports [13]. According to the characteristics of each clade, groups I (Ia, Ib, and Ic) and II (IIa and IIb) were further subdivided into subgroups, while group III remained unaltered. The distribution of ApCOL proteins across the three groups was uneven, with group III exhibiting the fewest ApCOL members. Each subgroup, with the exception of subgroups Ic and IIa, contained at least one ApCOL member. Subsequently, we counted the number of COL members for the eight species in each group and found that the group III also had the lowest number of COL proteins among the eight plants (Figure 3).
From the phylogenetic tree, it can be seen that the COL genes of the two monocotyledonous plants (rice and maize) were tightly clustered, particularly the Ib and Ic subgroups, which exclusively harbor COL family genes from dicotyledonous and monocotyledonous plants, respectively. This suggests independent evolution of COL genes in dicotyledonous plants and raises the possibility of independent amplification of the Ib and Ic subgroups post-divergence. Moreover, ApCOL genes consistently showed close clustering with COL genes of Sesamum indicum, which may be due to the fact that both have a recent common ancestor or have experienced similar selective pressures and possess a large number of homologous genes, thus showing significant similarity (Figure 2).

2.3. Gene Structure and Conserved Motifs Analysis of ApCOLs

To validate the phylogenetic analysis grouping results, we utilized the MEME program to predict the structural characteristics of ApCOL protein sequences, identifying 10 conserved motifs ranging in length from 11 to 49 amino acids (Figure 1 and Figure 4B, Figure S1). All COL members of A. paniculata contain two conserved structural domains: the N-terminal B-box structural domain (motif 2) and the CCT structural domain near the C-terminus (motif 1). In addition to these two representative conserved structural domains, motifs from the same group tend to be highly conserved. For instance, all members of group I contain motifs 1, 2, and 10, with motif 10 exclusive to this group. Group III members share four motifs, with motif 7 being specific to group II. Most group II members feature six motifs, with motifs 1, 2, 3, and 4 shared by four members, and motifs 3, 5, and 9 unique to this group. However, we also found some differences within the same group. The closest ApCOL03 and ApCOL06 in group I contain consistent motif distributions and lengths, whereas ApCOL07 and ApCOL09 in group III contain motifs that are different from the other members of the same group. It is noteworthy that all four members of group III are slightly different.
According to the results of multiple sequence alignments, all ApCOL proteins were found to possess at least one B-box and CCT structural domain (Figure 4C). In group I, only ApCOL07 contained two B-box structural domains and one CCT structural domain. Group II members uniformly displayed two B-boxes and one CCT domain, with the exception of ApCOL02, which featured one of each domain. Group III members were characterized by two B-boxes and one CCT structural domain. These results are broadly in line with previous findings that COL genes are classified into three groups based on the number and type of B-box structural domains [13], but there are some differences in group membership, which may be due to complex evolutionary mechanisms that result in the gain or loss of structural domains that promote functional specialization. Notably, ApCOL06 contained four PPR structural domains, known to be a prominent protein family in flowering plants, with significant roles in plant growth and development. The biological functions of PPR proteins within A. paniculata COL members warrant further investigation [47].
We also analyzed the intron–exon structures of ApCOLs and showed a high degree of variation among the nine members (Figure 4D). The majority of genes exhibited between one to six introns and two to six exons, with ApCOL06 displaying the highest count of ten introns and seven exons. Nonetheless, the length and quantity of exons and introns were observed to be more similar within the same subgroup compared to across different subgroups.

2.4. Cis-Regulatory Elements and Functional Analysis of the ApCOL Promoter Regions

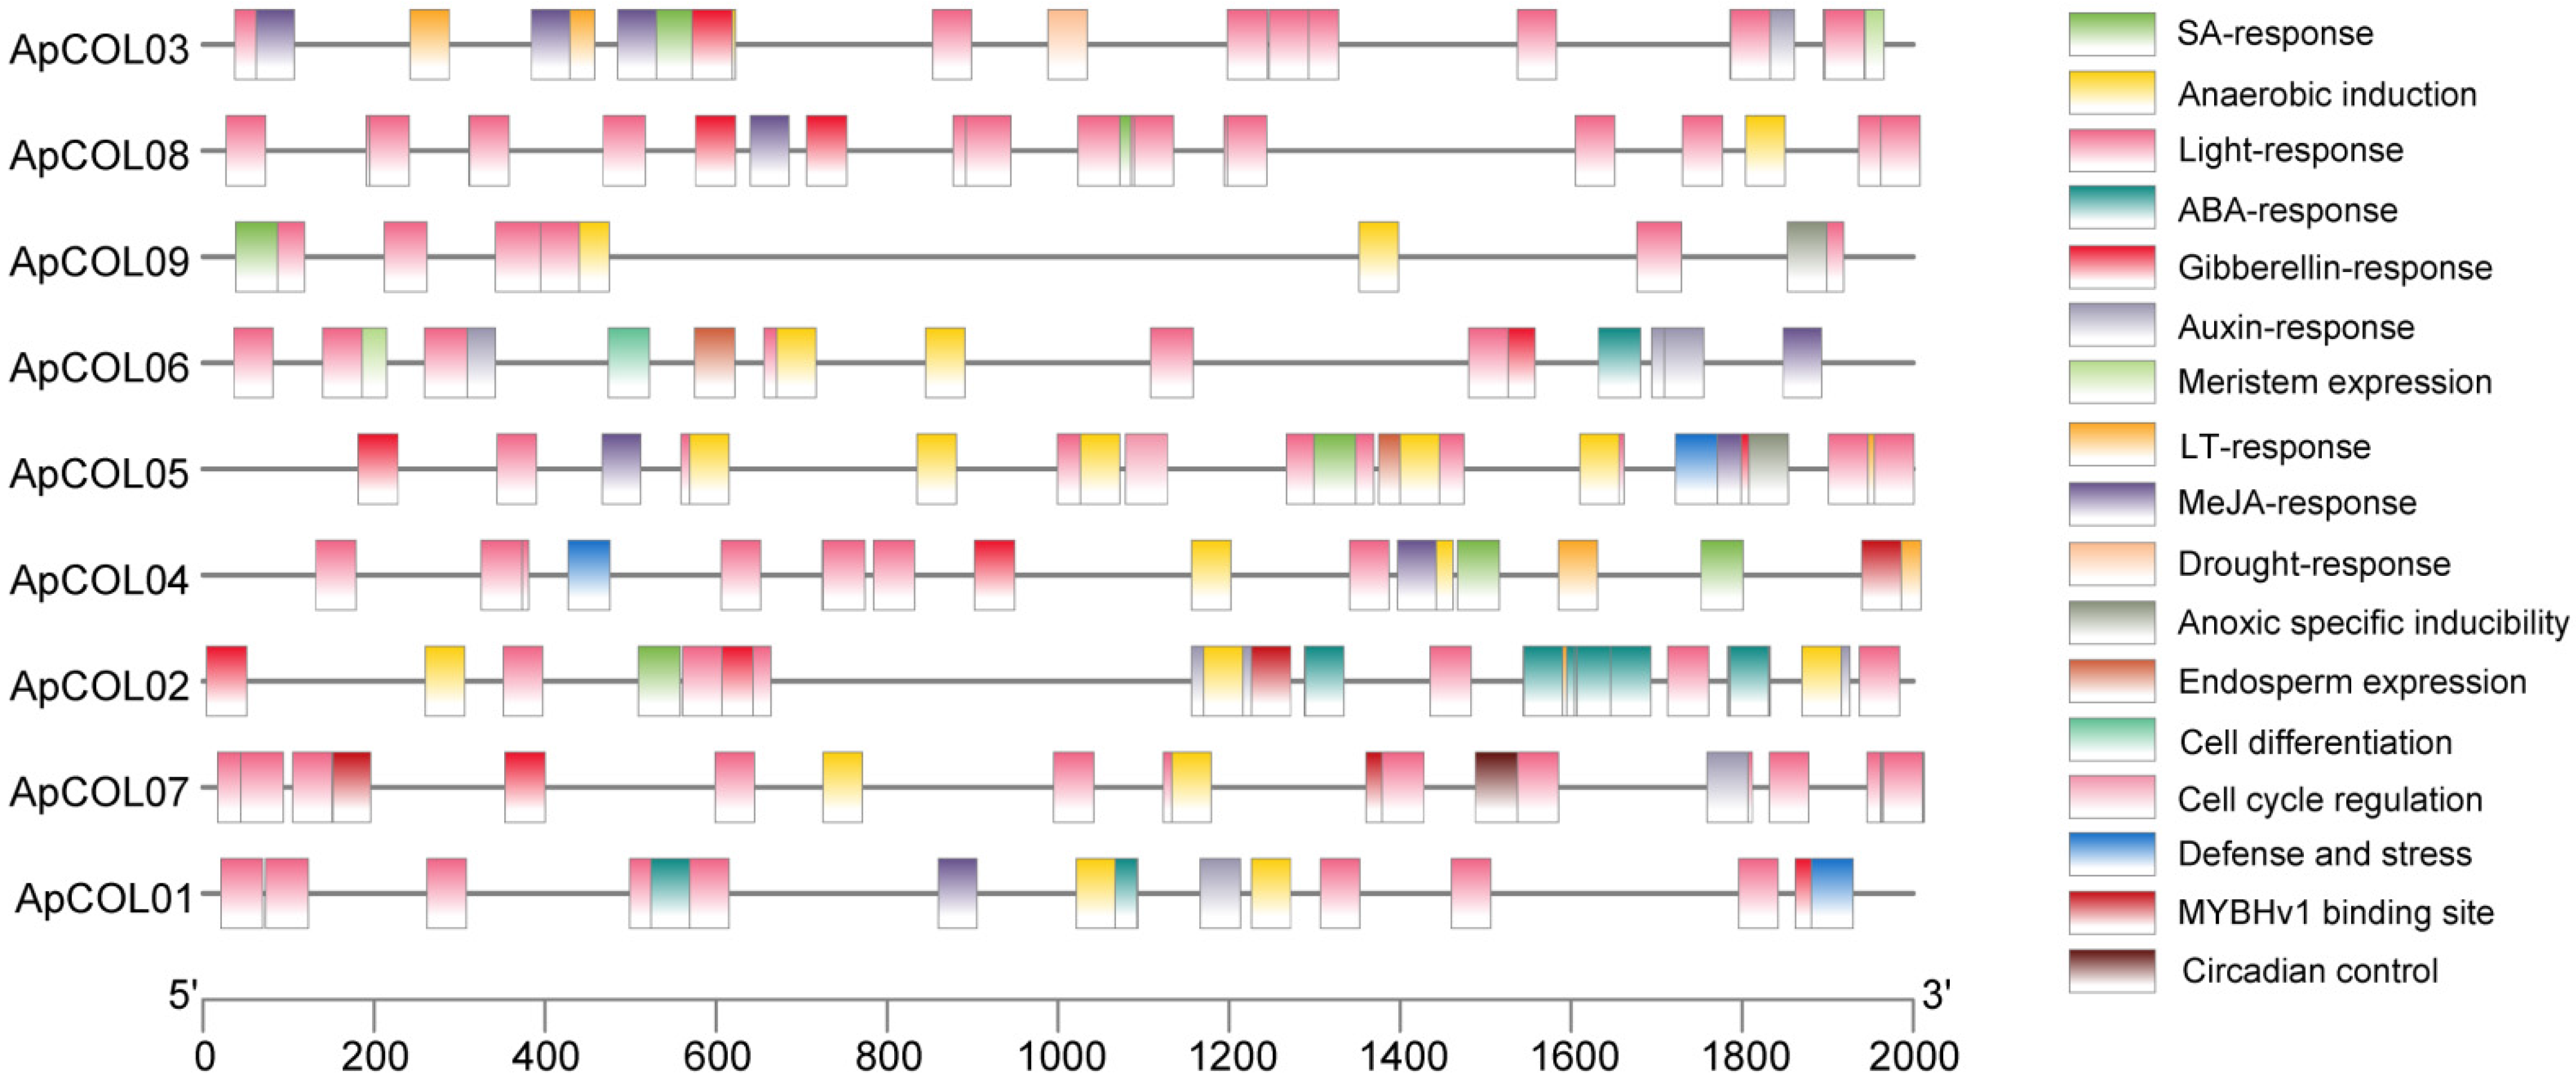
In order to explore the potential functions of the ApCOL gene and its expression regulation under abiotic stresses, the cis-regulatory elements (CREs) within the 2000 bp promoter sequence upstream of ApCOL were identified, and 17 elements associated with specific functions were selected for analysis (Figure 5). These CREs were broadly categorized into four groups: light responses, abiotic stress responses, hormone responses, and growth regulation. This is consistent with predictions in other species, all of which contain predominantly these four CREs [14,15]. The promoters of all ApCOL genes were found to be enriched in light-responsive elements, with a range from 6 (ApCOL06) to 18 (ApCOL02/08), indicating a potential role of ApCOL genes in regulating light responses in flowering plants (Table S3. The phytohormone response elements identified included auxin (IAA), gibberellin (GA), salicylic acid (SA), abscisic acid (ABA), and methyl jasmonate (MeJA). Among the eight ApCOLs analyzed, all exhibited a minimum of three hormone response elements, with the exception of ApCOL09, which possessed only one element related to salicylic acid response. In addition, multiple CREs involved in abiotic stress responses were detected. Notably, ApCOLs (ApCOL02, -04, and -07) were found to interact with MYBHv1, suggesting their involvement in drought response modulation. (Table S3). Growth regulatory elements, such as meristematic tissue expression, cell cycle regulation, and endosperm expression, were relatively few, particularly in relation to ApCOL07. Circadian control elements detected in ApCOL07 corresponded to the expression pattern of the COL gene.
Combined with the results of the above analyses, the ApCOL genes were subjected to Gene Ontology (GO) enrichment analysis to further understand their functions and regulatory mechanisms. The biological functions were classified into three categories: biological processes (BPs), molecular functions (MFs), and cellular components (CCs) (Table S4, Figure S2). Biological processes (BPs) included DNA binding and ions and organic cyclic compounds binding, as well as transcriptional regulatory activity photoperiod regulation, long-day regulation, flowering regulation, circadian rhythms, and responses to various stimuli, including light and abiotic stress. Molecular function (MF) included DNA binding and ions and organic cyclic compounds binding, as well as transcriptional regulatory activity. Cellular component (CC) annotations indicated that all gene products were localized in the nucleus and organelles, which is in full agreement with our earlier prediction of subcellular localization. These findings are in agreement with the cis-regulatory element analysis conducted.

2.5. Interspecies Syntenic Analysis

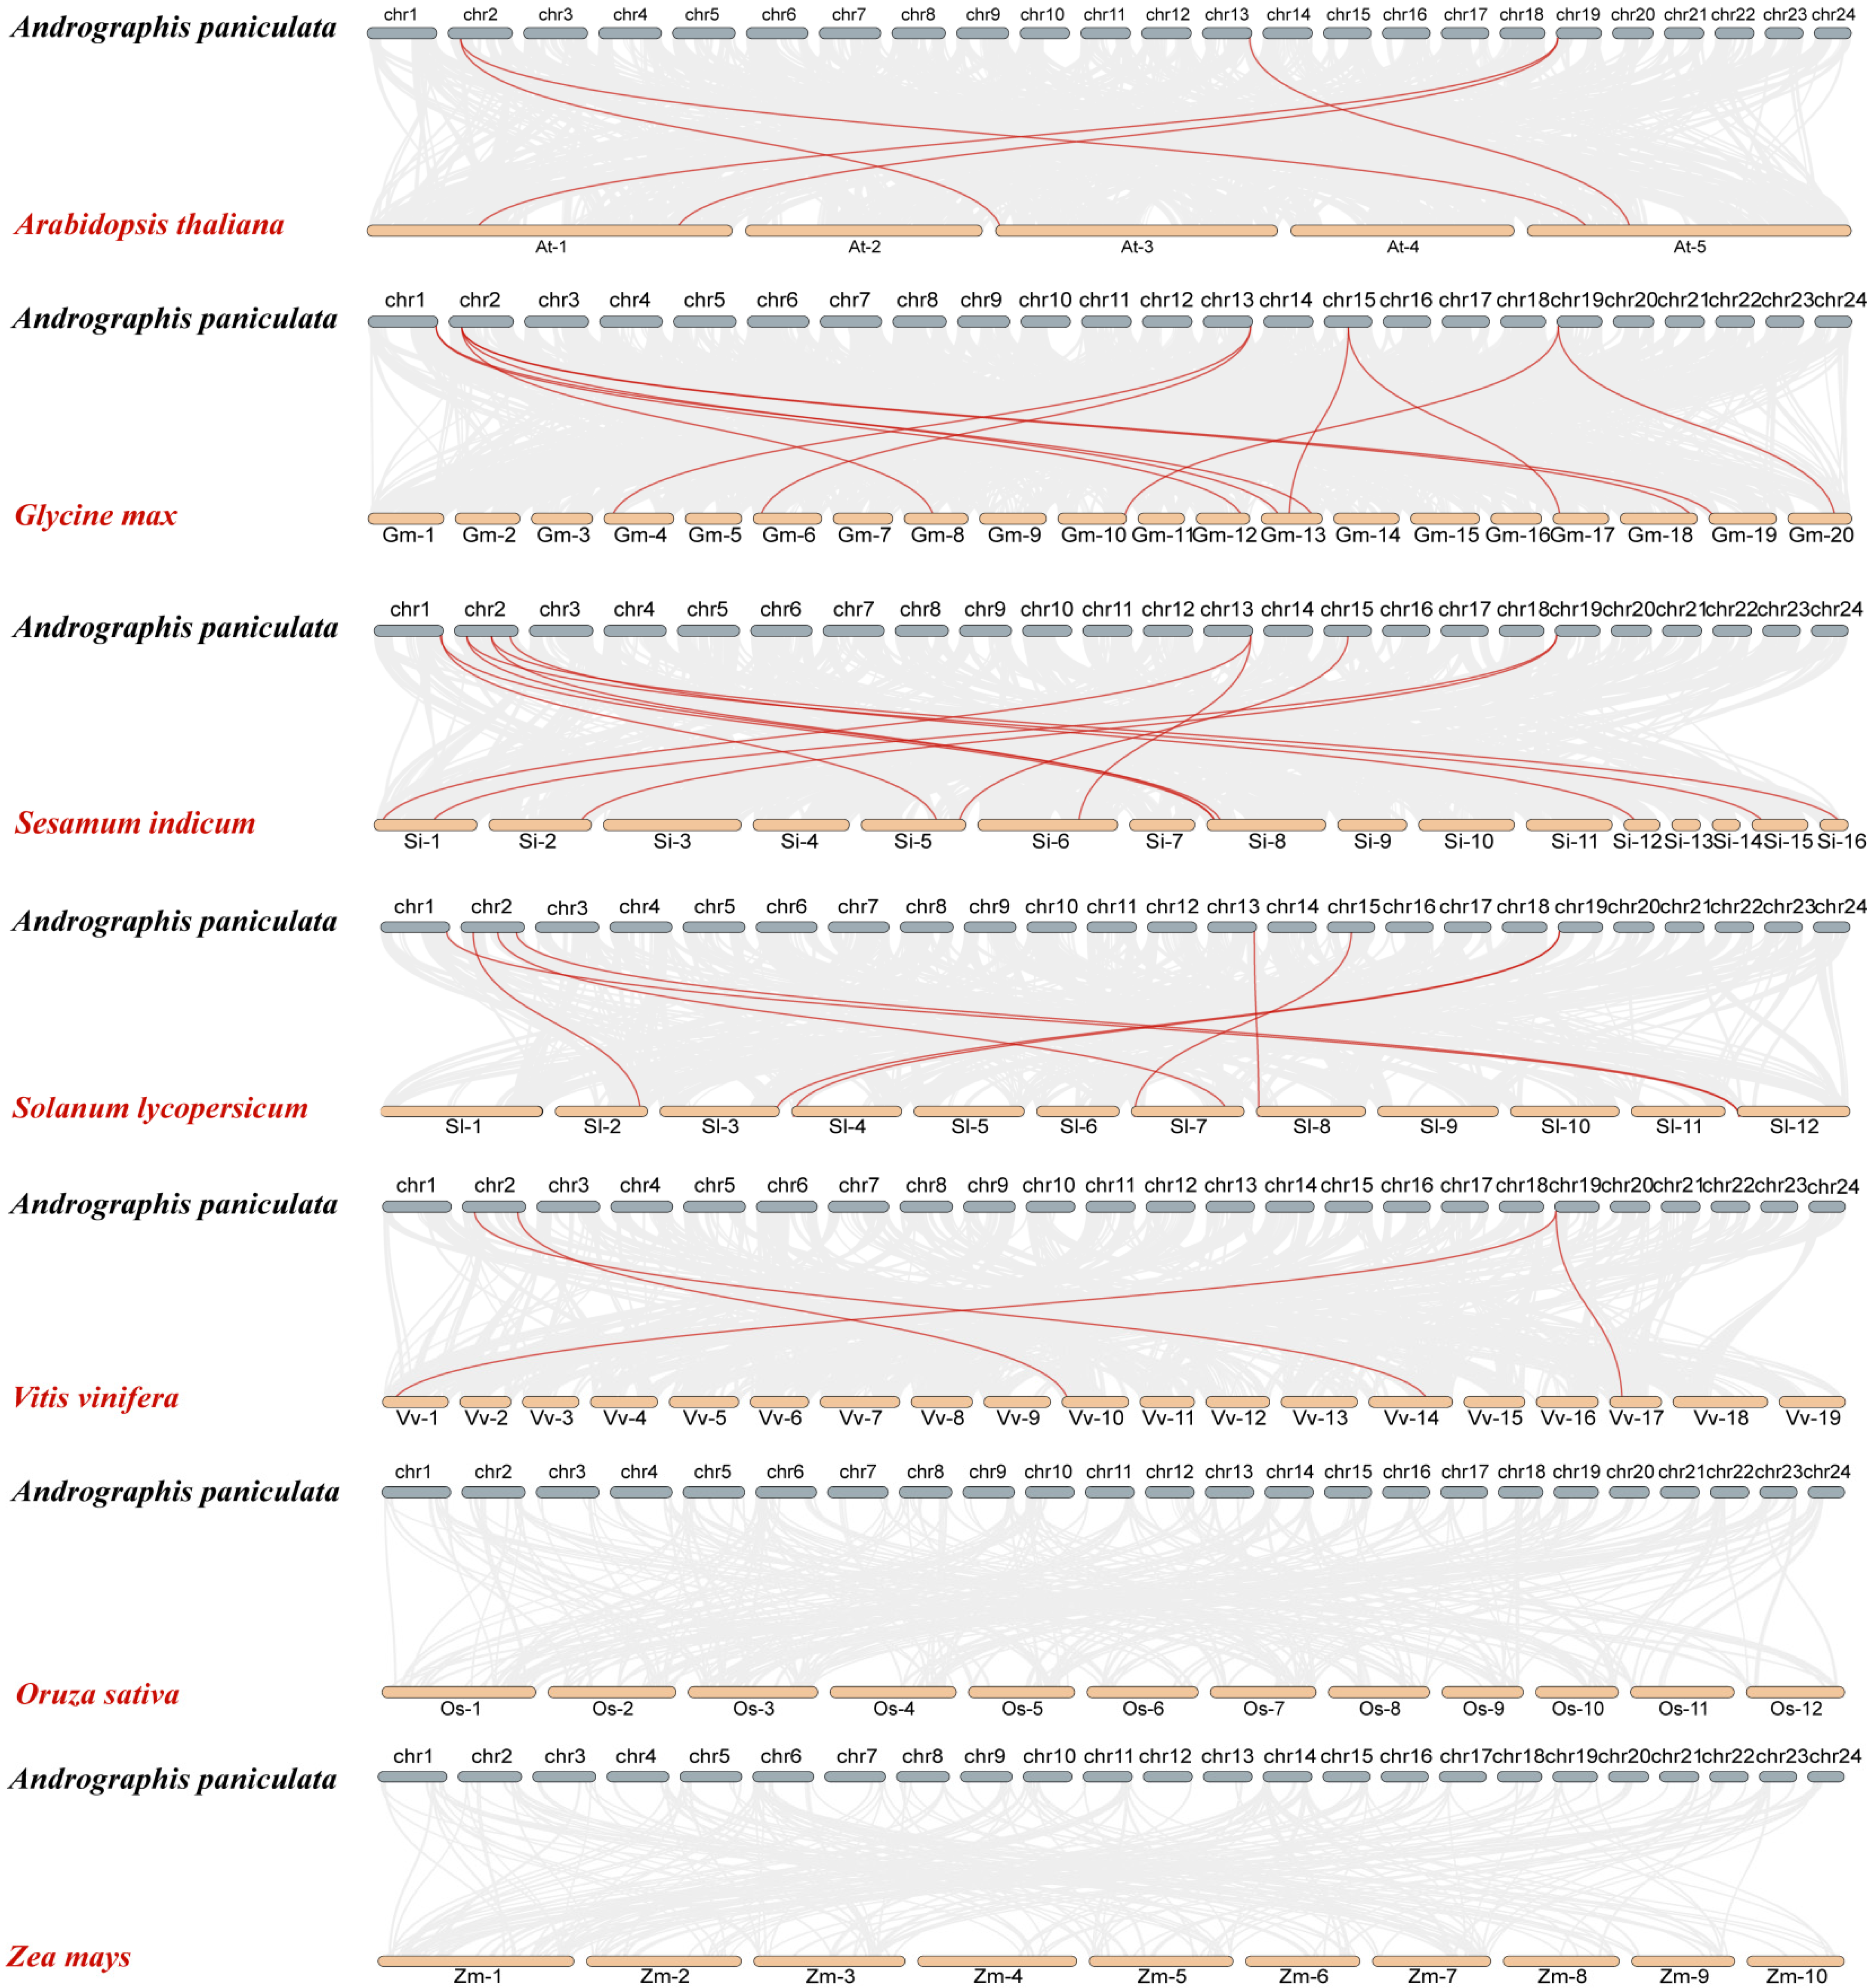
Interspecies syntenic analysis enhances the study of gene family evolutionary relationships. Therefore, we analyzed the synteny of A. paniculata with seven other plant species, including five dicotyledons (Arabidopsis, soybean, sesame, tomato, and grape) and two monocotyledons (rice and maize) (Figure 6). The results showed that ApCOLs had 5, 12, 12, 8, and 4 pairs of homologous genes with Arabidopsis, soybean, sesame, tomato, and grape, respectively (Table S5). Among them, the number of homologous genes between A. paniculata and S. indicum was the relative highest, which is consistent with our previous speculation. However, there were no homologous gene pairs between ApCOLs and rice and maize. These results suggest that the ApCOL gene family likely emerged post the dicotyledon-monocotyledon divergence, showcasing close ties to dicotyledon evolution. Syntenic analysis of A. paniculata alongside five dicotyledons (excluding Arabidopsis) disclosed that COL genes in groups I, II, and III participated in collinear gene pair formations. Particularly, the collinearity of ApCOL08 in group III was in the form of a pair of multiple pairs, implying a high conservation level across diverse dicotyledonous plant species and potentially pivotal evolutionary roles. In particular, A. paniculata displayed a one-to-many expression pattern of homologous genes with soybean, notably exemplified by ApCOL03, which exhibited homology with four soybean COL genes and covaried with the other four species, emphasizing its significance in COL gene family evolution (Table S5). These results have important implications for predicting gene function.

2.6. Expression Profiles of ApCOL Genes in Different Tissues

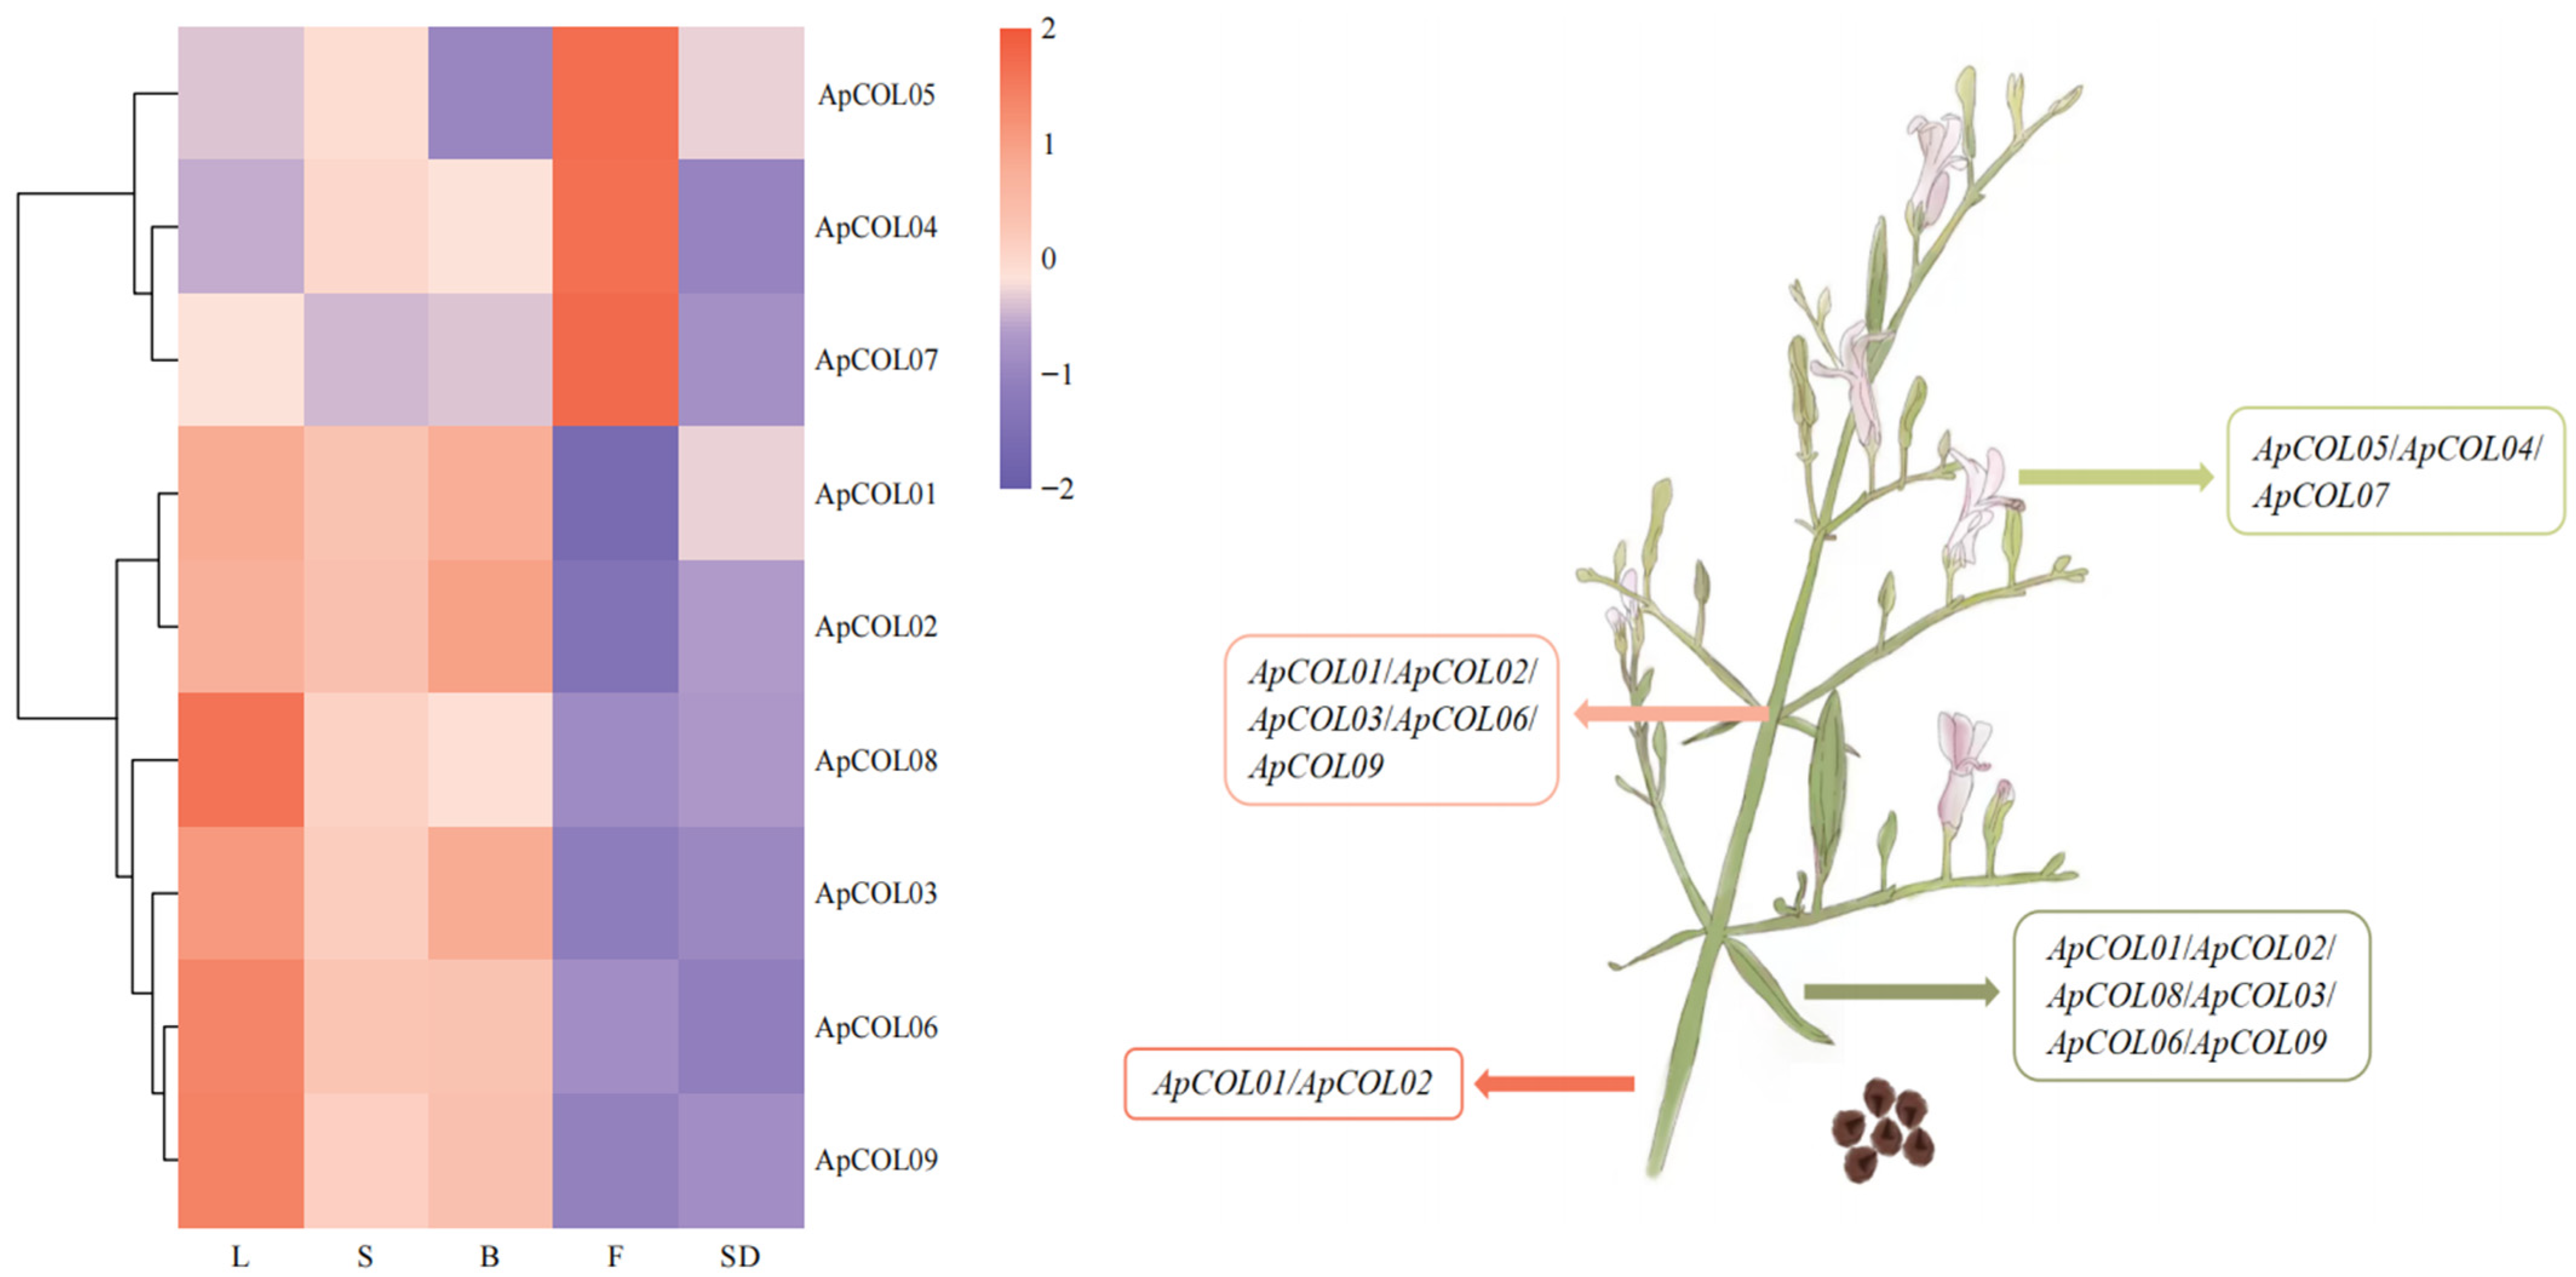
To explore the potential role of ApCOL genes in the growth and development of A. paniculata, RNA-seq data from five distinct tissues, including leaves, stems, flowers, branches, and seeds, were sequenced using the Illumina high-throughput sequencing platform. Analysis revealed differential expression patterns of ApCOLs across various tissues, while hierarchical clustering analysis indicated similar expression profiles within the same cluster (Figure 7). Firstly, ApCOL04, ApCOL05, and ApCOL07 were significantly expressed only in flowers but not in other tissues, with certain specific expression characteristics. Conversely, ApCOL01 and ApCOL02 were expressed in leaves, stems, and branches, but not in flowers and seeds. Moreover, ApCOL03, ApCOL06, and ApCOL09 were highly expressed in leaves, barely expressed in stems, less expressed in branches, and not expressed in flowers and seeds. In particular, ApCOL08 demonstrated strong expression in leaves and minimal expression in other tissues, while all nine ApCOLs were found to have negligible expression in seeds. These findings suggest the involvement of ApCOLs in diverse growth and developmental processes, excluding seed development, with pivotal roles in leaf and flower development. This finding is consistent with that with other species, where most COL genes are highly expressed in plant leaves [14,48,49]. Additionally, ApCOL members sharing similar expression patterns likely possess analogous functionalities.

2.7. Expression Profiles of ApCOL Genes Under Hormone Treatment

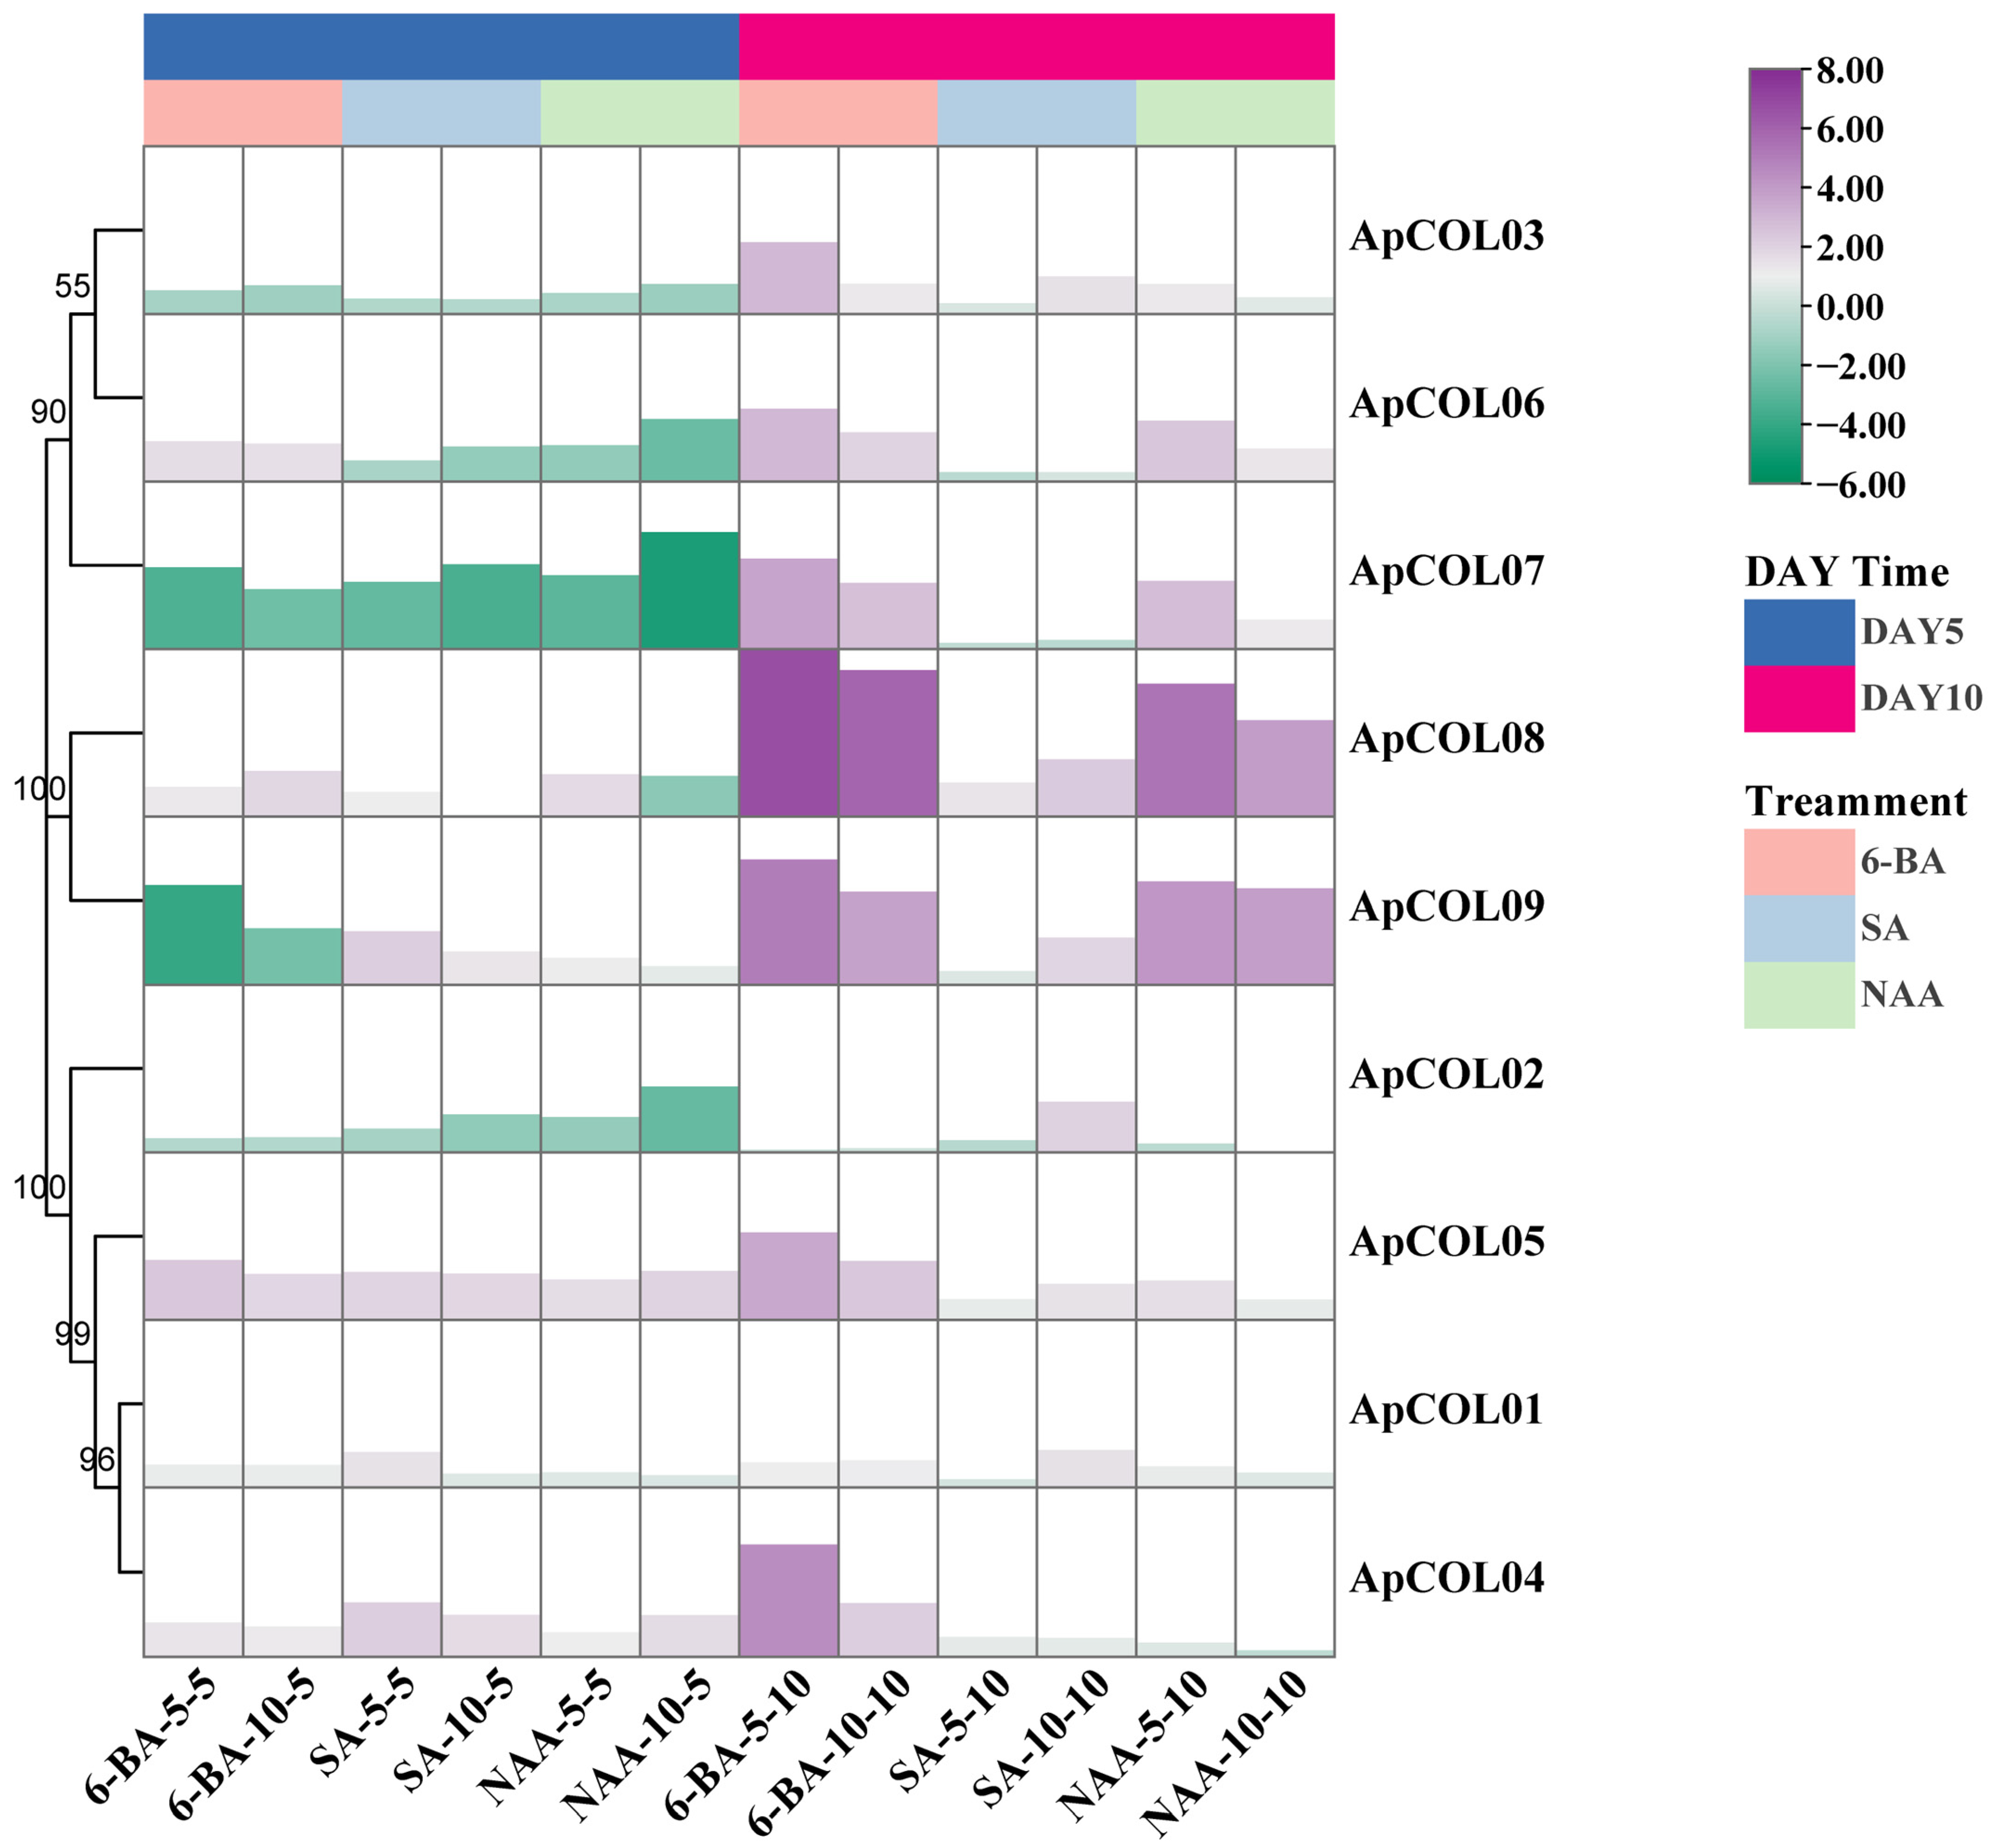
Subsequent to our previous analysis, it was observed that the promoter region of the ApCOL gene harbored a significant number of phytohormone response elements (Figure 5). Consequently, we investigated the expression profiles of ApCOLs under the influence of various plant growth regulators (PGRs)—6-benzylaminopurine (6-BA), salicylic acid (SA), and α-naphthaleneacetic acid (NAA)—and at different concentrations for 5 and 10 days using qRT-PCR (Figure 8, Table S7). Preliminary results indicate that changes in the three PGR concentrations had little effect on the genes, except for seven ApCOL genes under SA treatment on day 10, where most showed slight downregulation at high concentrations. Notably, the expression of ApCOL08 decreased by more than threefold at high concentrations compared to low concentrations. Nevertheless, notable variations were observed in the response of ApCOL genes to PGRs at different treatment durations. Specifically, in both concentrations of the 6-BA solution, a substantial increase in gene expression was evident after a 10-day treatment compared to a 5-day treatment, with all but ApCOL01 and ApCOL02 showing significant upregulation (log2 ≥ 2). Among these, ApCOL08 exhibited the highest expression levels (log2 ≥ 6). In addition, ApCOL06, -07, -08, and -09 displayed significant upregulation following 10 days of treatment with varying concentrations of NAA. However, ApCOL07 experienced substantial downregulation (log2 ≤ −2) within the first 5 days of treatment across all three PGRs. ApCOL01, -04, and -05 demonstrated upregulation in all 12 treatment conditions, while ApCOL02 predominantly exhibited downregulation. Overall, a prevailing trend of upregulation in gene expression changes was observed, suggesting that exogenous hormones had a discernible impact on the expression of ApCOLs in A. paniculata.

2.8. Expression Profiles of ApCOL Genes Under Salt Stresses

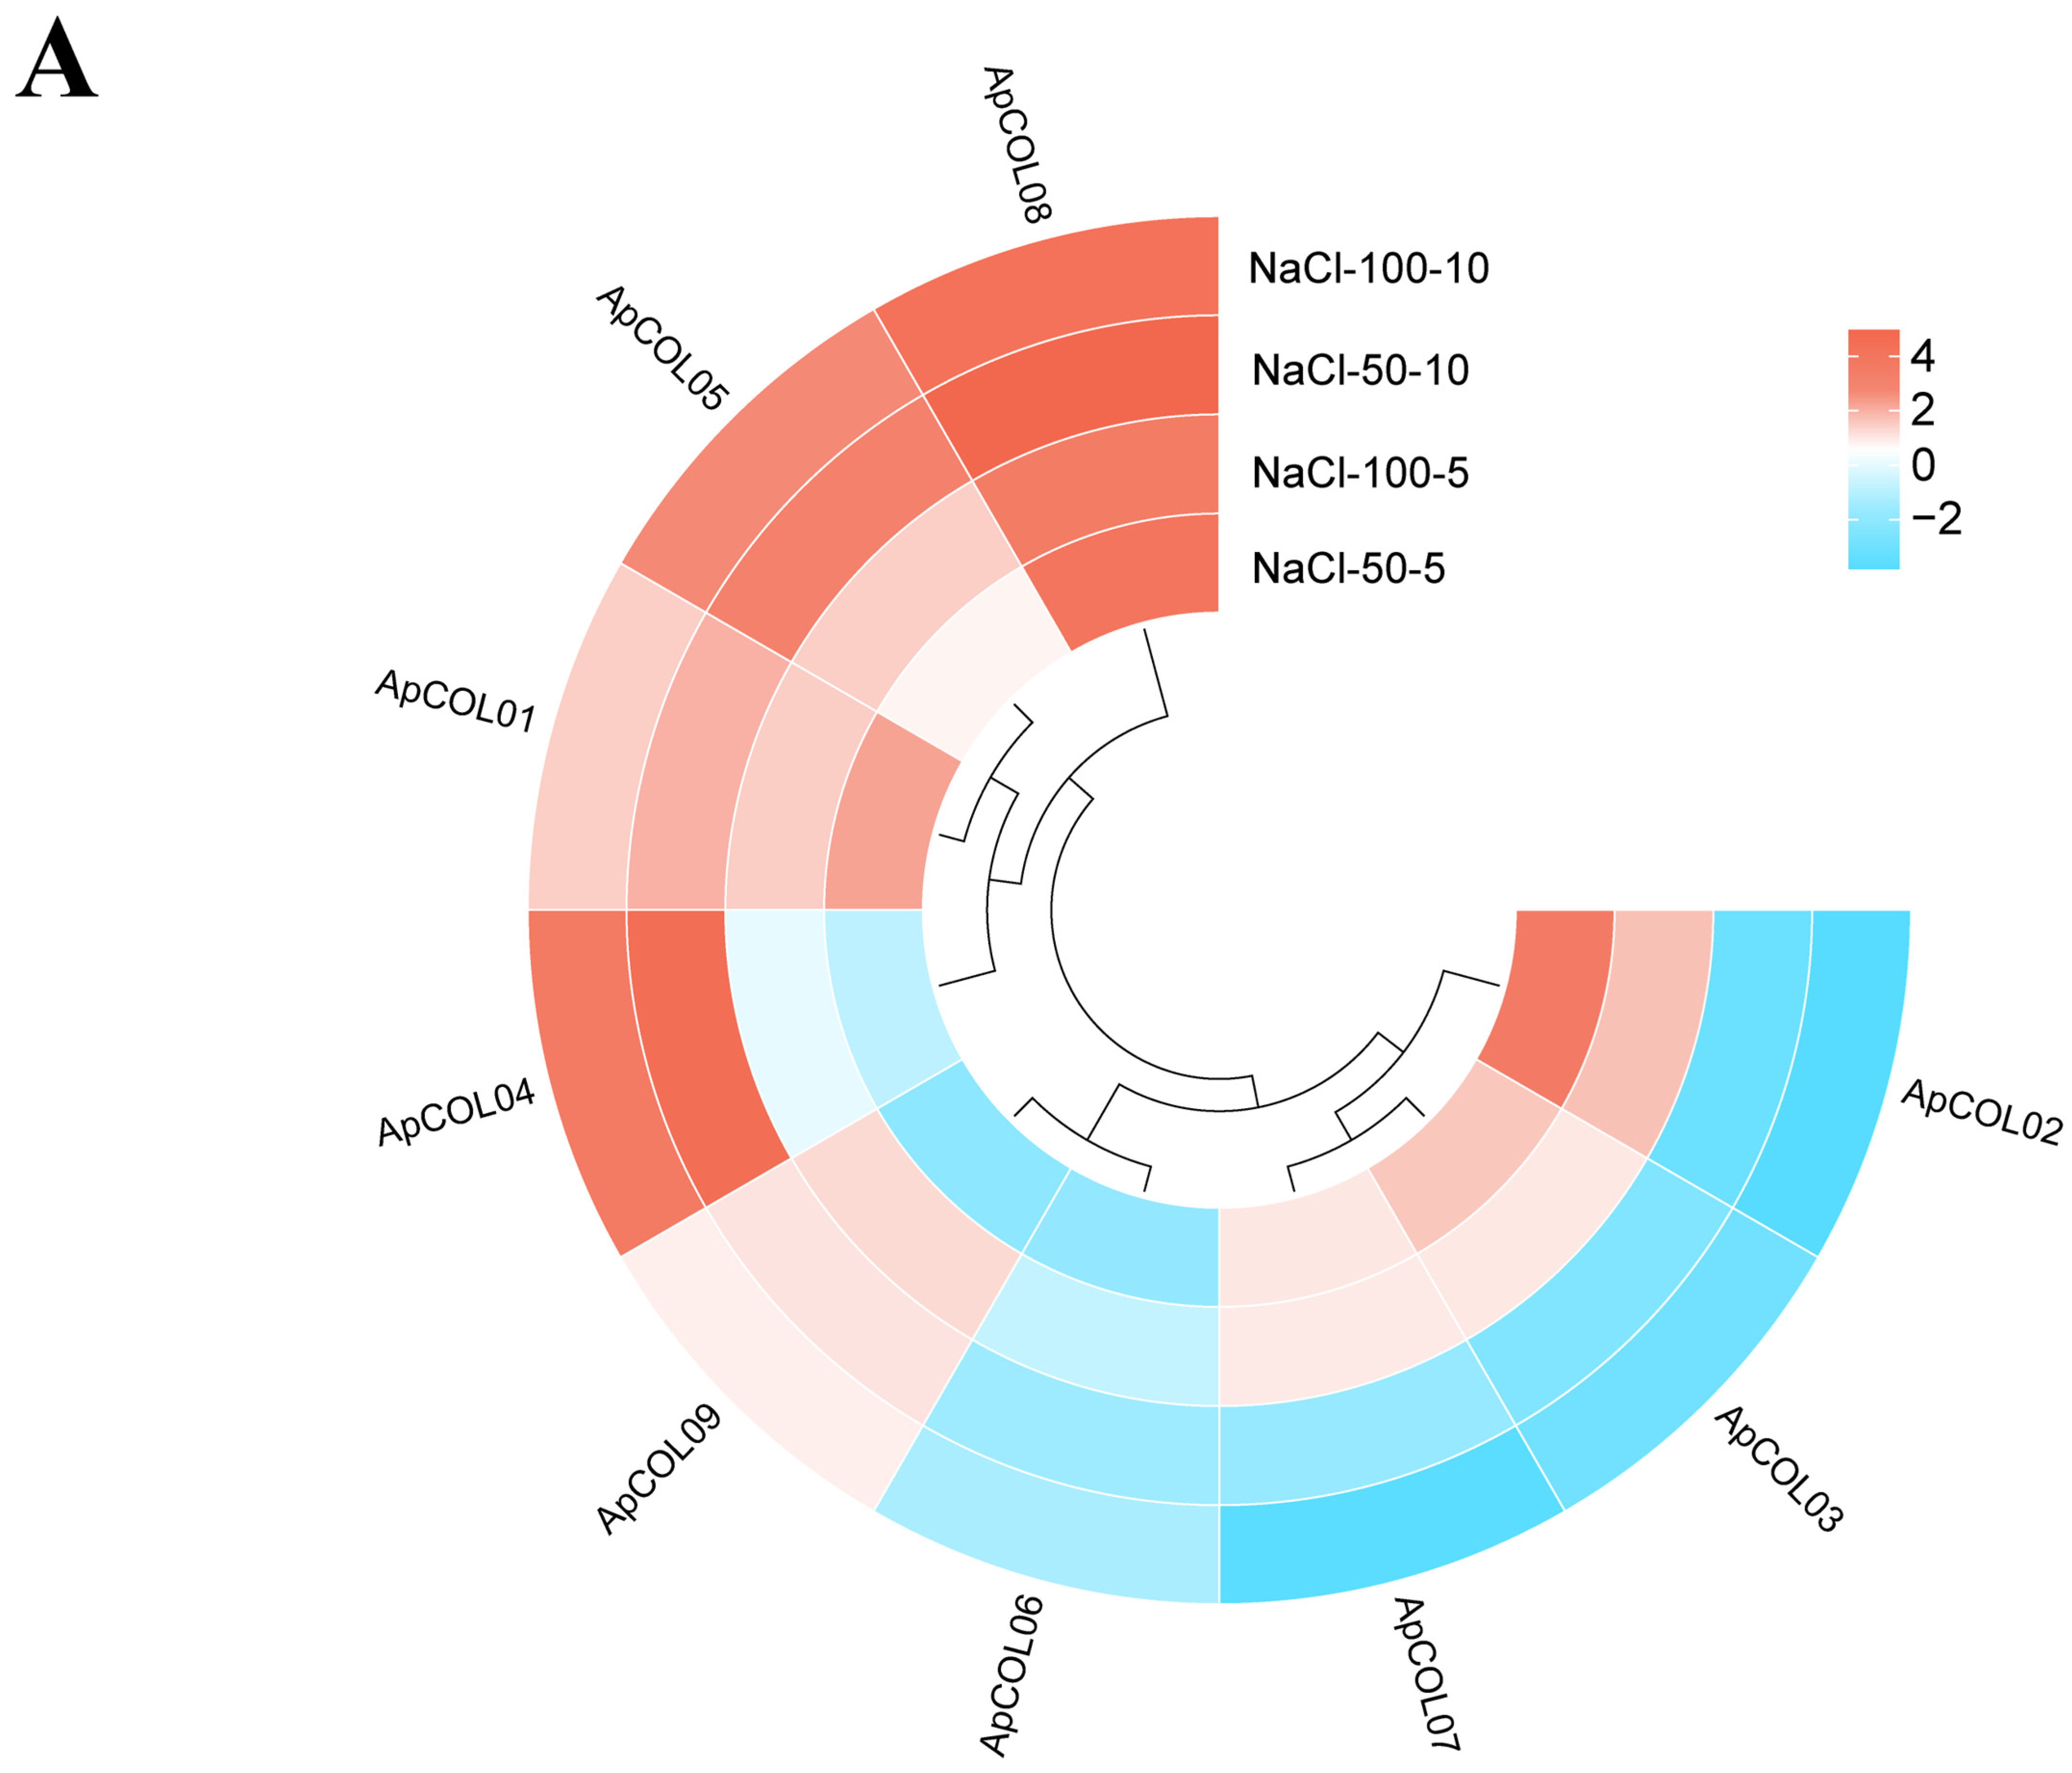
To further elucidate the involvement of ApCOL genes in response to various stresses, we conducted an analysis of the expression profiles of ApCOLs under different salt concentrations and treatment times (Figure 9A, Table S6). The results showed distinct expression patterns of ApCOLs in leaves across diverse treatment conditions. ApCOL01, -05, and -08 exhibited significant upregulation (log2 ≥ 2) under all four treatments. For instance, ApCOL01 displayed considerable upregulation across various treatment durations and low salt concentrations, while ApCOL05 showed significant upregulation after a 10-day treatment under varying salt concentrations, as did ApCOL04. Particularly noteworthy was the strong upregulation of ApCOL08 under all treatment conditions, with pronounced induction observed under NaCl-50-10 conditions (log2 ≥ 5). In addition, the expression levels of ApCOL02, ApCOL03, ApCOL07, and ApCOL09 were significantly downregulated (log2 ≤ −2) (Table S7).
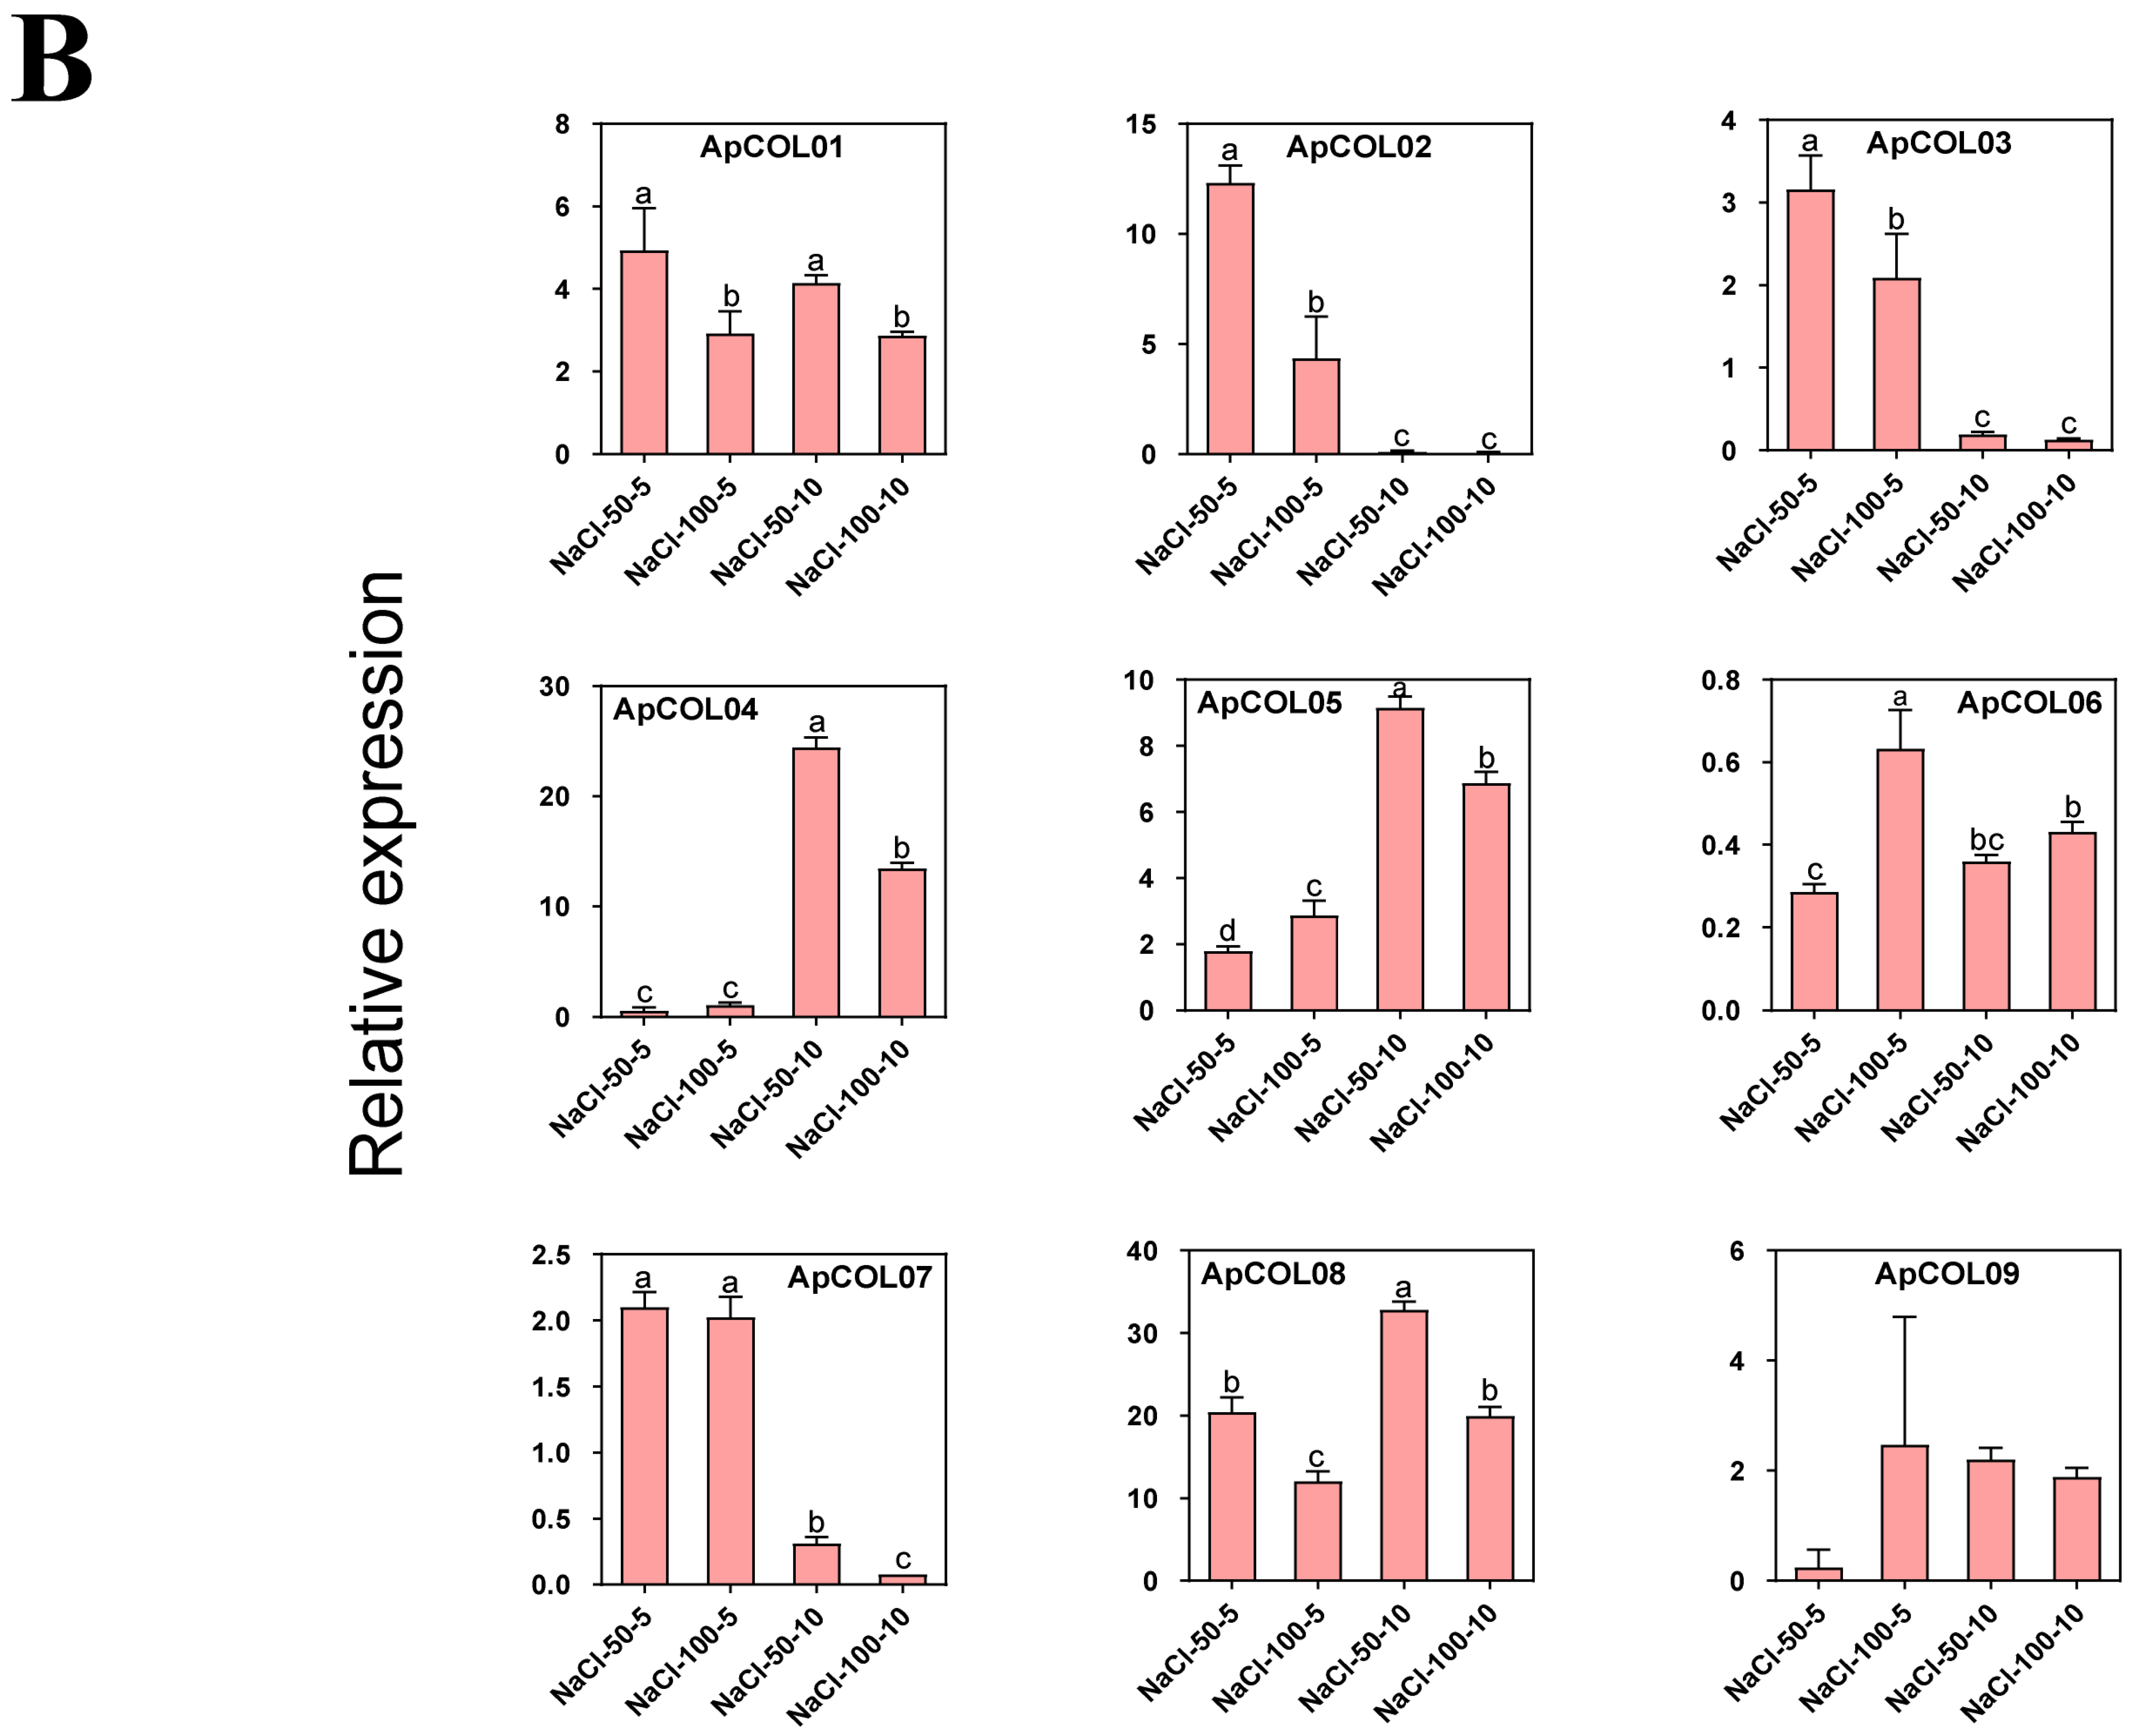
To better investigate the response mechanism of ApCOL to salt stress, we conducted an analysis of the relative expression levels of nine ApCOLs that exhibited significant changes under four distinct salt treatment conditions (Figure 9B). The results showed that six genes (ApCOL01, -02, -03, -04, -07, and -08) were significantly downregulated after 5 days of salt treatment, while ApCOL06 showed significant upregulation. Moreover, ApCOL05 exhibited upregulation at 10 days of salt treatment, followed by downregulation at higher salt concentrations. The expression patterns of three genes, ApCOL04, -05, and -08, were significantly upregulated, while ApCOL02, -03, and -07 were downregulated at varying treatment durations. ApCOL06 demonstrated a significant decrease in expression over time at high salt concentrations, with no significant difference observed at lower concentrations. There were no significant differences in the expression levels of ApCOL01 and ApCOL09. In addition, ApCOL08 displayed a substantial upregulation (more than 30-fold) in leaves subjected to high salt concentrations for 10 days.

2.9. Subcellular Localization of Key ApCOL Proteins

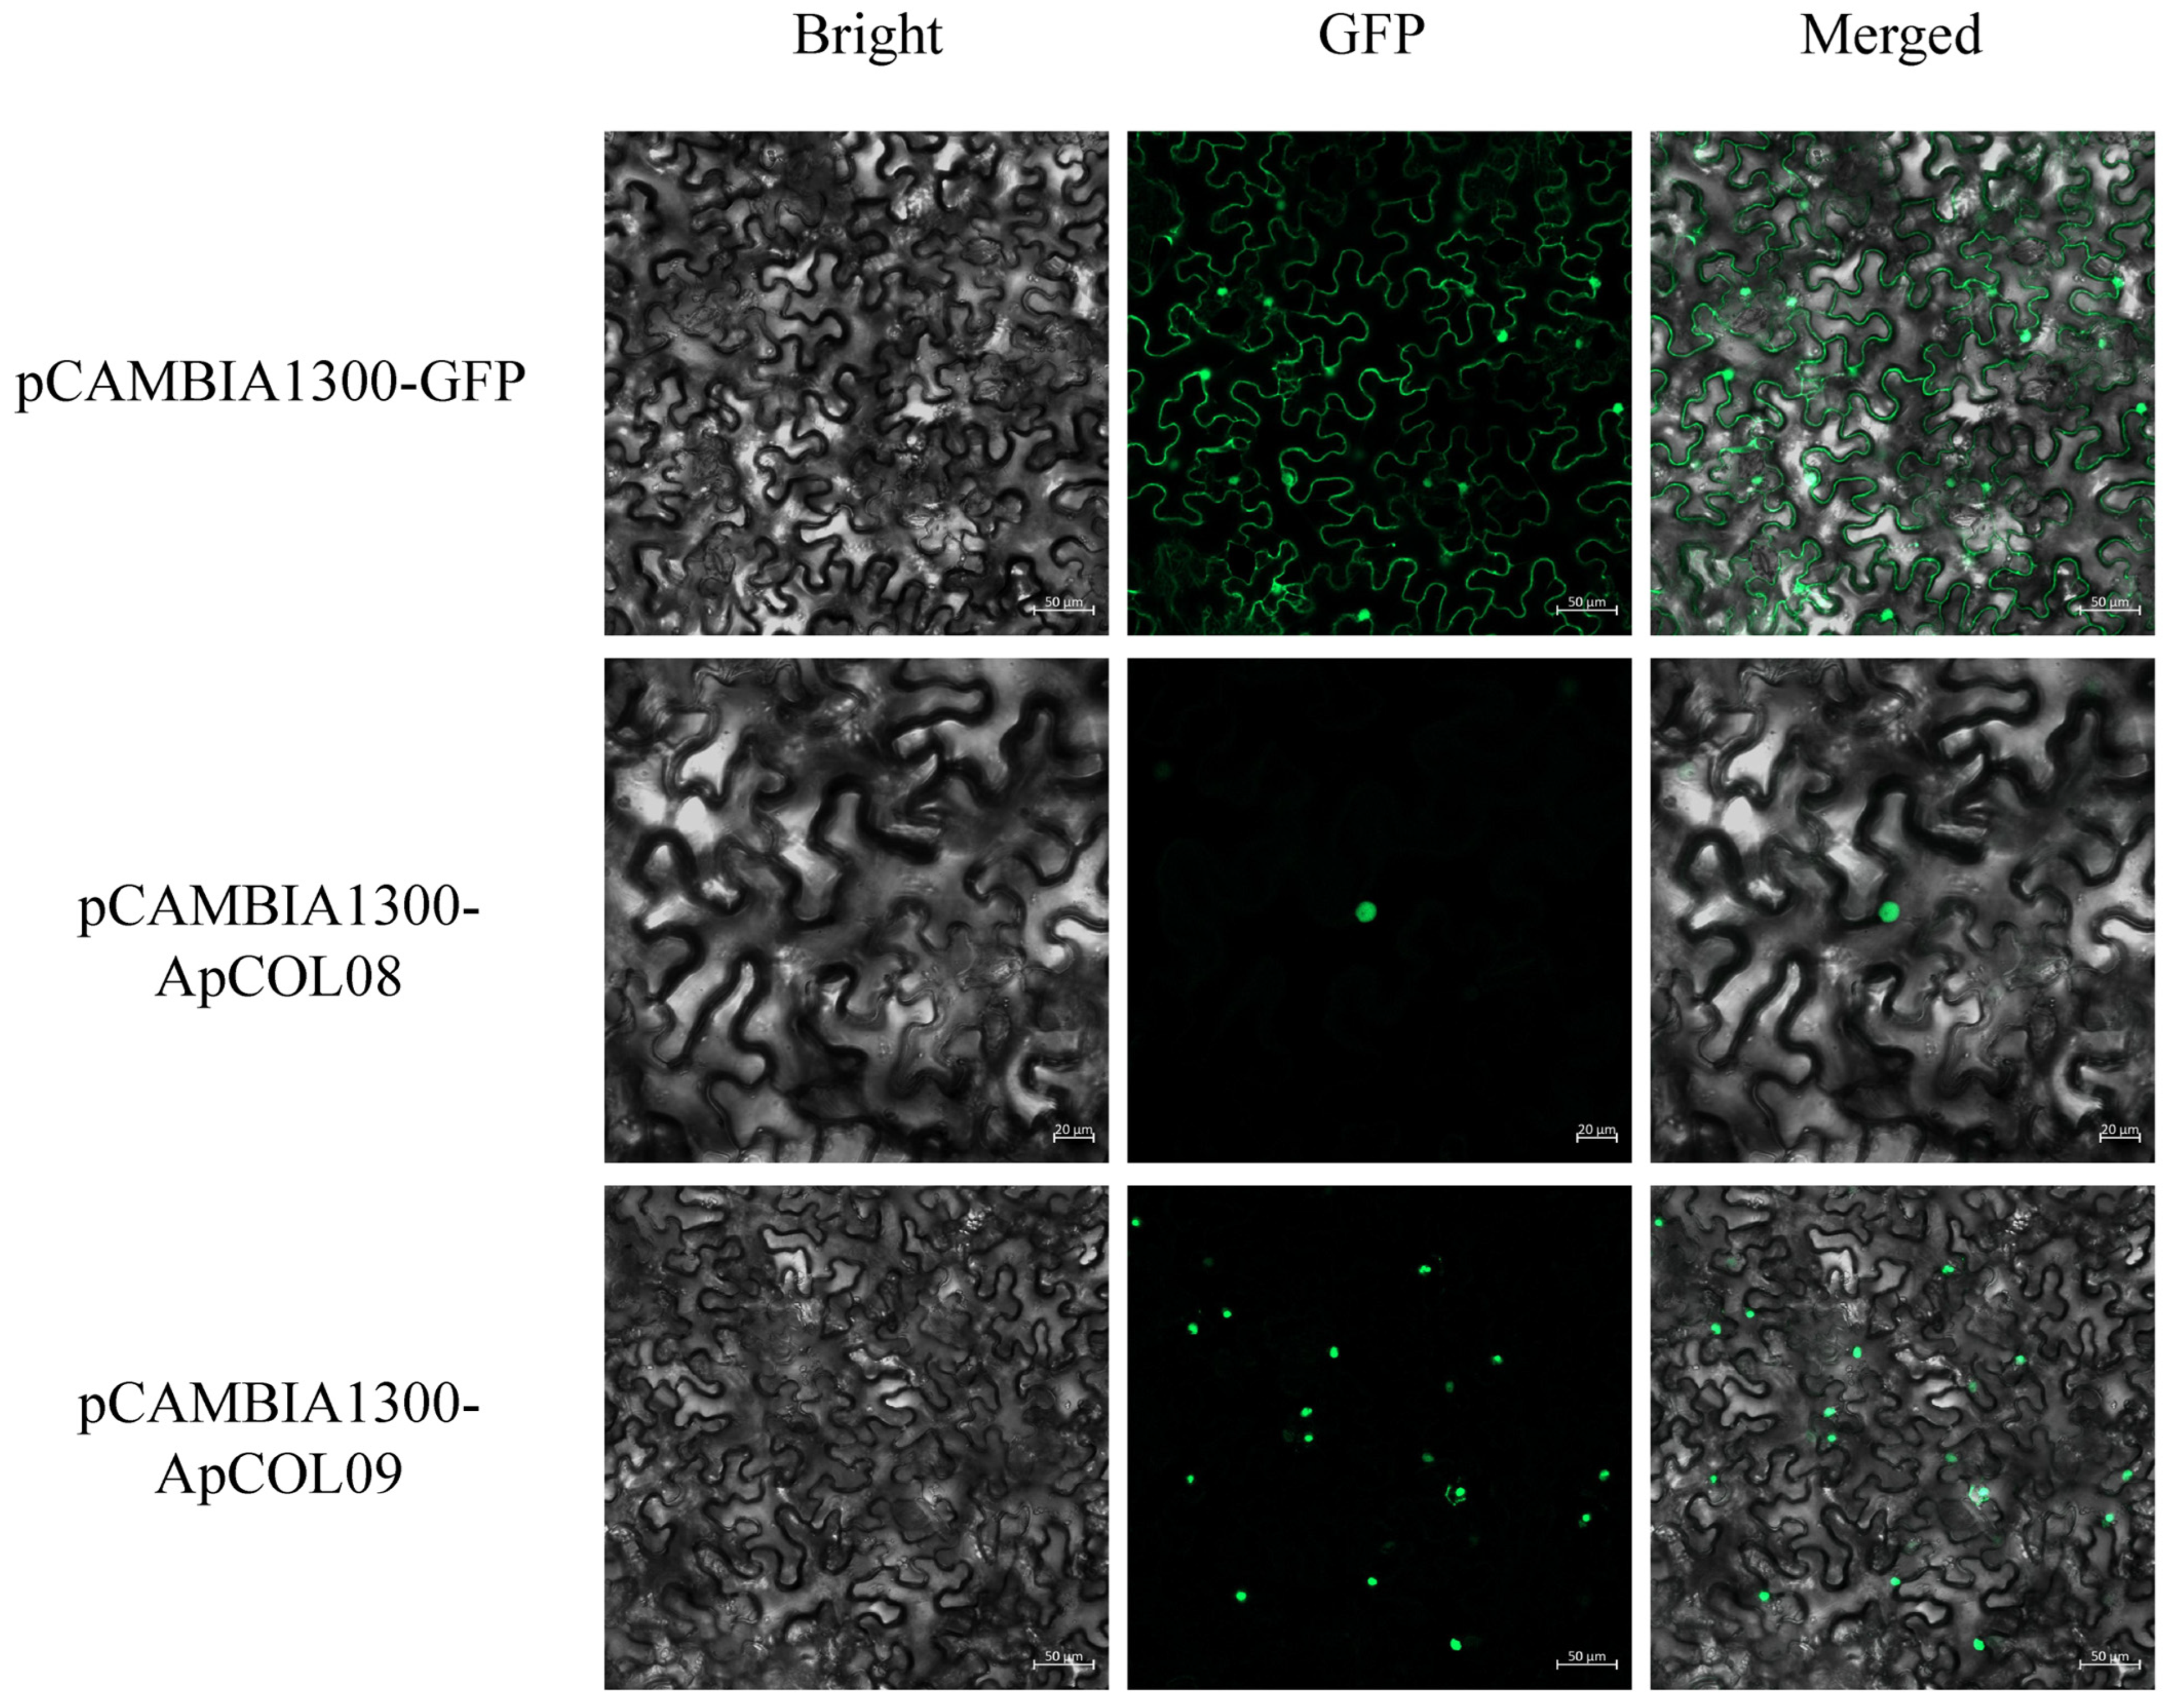
To determine the subcellular localization of ApCOL proteins to explore their function further, we fused ApCOL08/09 with a green fluorescent protein (eGFP). The results showed that the green fluorescence signals of both GFP-ApCOL08 and GFP-ApCOL09 were localized only to the nucleus, in contrast to the green fluorescence of the pCAMBIA1300-GFP empty vector, which was present in all parts of the cell (Figure 10). The results were consistent with previous BioSignal predictions.

2.10. Heterologous Expression Verification of ApCOL08 Salt Tolerance Function in Yeast

The plasmid pYES2 is designed to induce the expression of recombinant proteins in yeast and features the yeast GAL1 promoter. The plasmid pYES2 is specifically engineered for inducing the expression of recombinant proteins in yeast and features the yeast GAL1 promoter. This promoter enables the expression of proteins of interest at high levels by utilizing galactose-inducible proteins in Saccharomyces cerevisiae. Additionally, pYES2 includes the CYC1 terminator, which is glucose-suppressed and serves to effectively terminate mRNA transcription [50,51]. Given that ApCOL08 shows significant induction in response to various salt stresses, we selected its heterologous expression in yeast as a preliminary study of its biological function (Figure 11).
A comparative analysis of the growth patterns of recombinant pYES2-ApCOL08 and pYES2 empty vector yeast (INVSc1) strains under varying salt stress concentrations revealed intriguing findings. On day four, it was observed that INVSc1 (pYES2) exhibited better growth than INVSc1 (pYES2-ApCOL08) under 0 M, 0.5 M, and 1 M NaCl stress conditions. Under 1.5 M NaCl stress, a slight growth was observed in INVSc1 (pYES2-ApCOL08), while INVSc1 (pYES2) did not grow. Both yeast strains demonstrated no growth under 2 M NaCl stress. On the seventh day, a more pronounced growth trend was observed between the two yeast strains, and the contrast between the two yeasts was even more pronounced, especially under 1.3 M and 1.5 M NaCl stress, where the growth of INVSc1 (pYES2-ApCOL08) was significantly higher than the growth of INVSc1 (pYES2) under 1.5 M NaCl treatment (Figure 11). These results indicated that heterologous expression of the ApCOL08 gene in yeast improved tolerance to NaCl stress and further confirmed that ApCOL08 plays an important role in salt stress tolerance.

3. Discussion

The COL gene family plays a crucial regulatory role in the photoperiodic response and flowering in plants. Numerous studies have reported the presence of COL genes in various plant species, indicating their involvement in regulating diverse developmental processes, abiotic stress responses, and homeostatic mechanisms in plants [26,52,53,54]. This includes key regulation of flowering time control, circadian rhythms, photosynthesis, shade avoidance responses, and formation of light and dark morphology during development [55]. In this study, we identified nine ApCOL genes from A. paniculata and classified them into three subgroups based on the Arabidopsis grouping (Table S1). A. paniculata contains fewer COL genes compared with other plant species, such as the seven plants in the previous syntenic analysis, Arabidopsis, soybean, sesame, tomato, grape, rice, and maize, which contain 17, 26, 15, 15, 12, 16, and 19 COL genes, respectively [56,57,58,59].
In addition, the genome sizes of these plant species varied considerably; however, it is noteworthy that there was no significant correlation observed between the number of COL genes and genome size. For instance, Arabidopsis has a genome size of 119 Mb, while the genome size of tomato is nearly seven times larger than that of Arabidopsis. Despite this difference in genome size, the number of COL genes in tomato is not significantly different from that in Arabidopsis (Table S2). Additionally, we noted that the genome sizes and COL gene numbers of sesame and A. paniculata are relatively similar, and they are closely related in evolution. This suggests that the number of COL gene families is more closely associated with species evolution rather than genome size [60]. Based on these findings, it is hypothesized that the ApCOL genes of A. paniculata have been relatively conserved during evolution, or, alternatively, some members of the COL gene family may be absent from the A. paniculata genome.
Subsequent investigations into COL genes have revealed that genome duplication events are associated with the expansion of gene family members. In this study, a pair of fragment duplication genes (ApCOL01/ApCOL04) was identified in the A. paniculata genome (Figure 1). Intriguingly, this duplicated gene pair exhibits homology with corresponding genes in sesame and tomato, indicating a close evolutionary relationship with A. paniculata (Table S5). These findings suggest that segmental duplication may play a significant role in the evolution of A. paniculata COL genes, and that these genes and their functions are relatively conserved among closely related species.
Conserved protein motifs and gene structures serve as bases for predicting evolutionary relationships among species and gene functions [61,62]. Members belonging to the same subfamily typically exhibit similar gene structures and motif distributions, suggesting comparable functions [60]. Within the COL family, proteins commonly possess two conserved structural domains: the B-box structural domain and the CCT structural domain [13]. All ApCOL proteins contain these two structural domains, with both group I and group II proteins featuring two B-boxes: Bbox1 and Bbox2. The exception is ApCOL02, which is speculated to have lost Bbox2 during the evolutionary process of A. paniculata, or where Bbox2 in these genes may have arisen from a duplication event of Bbox1 [63] (Figure 4C).
The proteins of group III are characterized by the presence of only one B-box and one CCT, which is consistent with the phylogenetic class II of COL proteins, and based on previous speculations, group III may be an early conserved protein. Analysis of gene structure reveals significant variation in sequence length among ApCOL genes. Studies have demonstrated that the number of introns can impact gene expression levels, with fewer introns associated with higher gene expression levels. For instance, ApCOL07, -08, and -09 exhibit relatively short protein sequences and fewer introns, potentially indicating rapid induction under stress conditions [48,64,65,66,67] (Figure 4D and Figure 9B, salt stress). Conversely, ApCOL06, which has the highest number of introns, exhibits the lowest expression level (Figure 9A). The diverse gene structures of ApCOL family members offer valuable insights for investigating the evolution and protein function of ApCOLs.
COL genes have been reported to exhibit wide expression across various plant tissues, with significant tissue specificity [68]. In our study, we observed the predominant expression of most ApCOLs in leaves and branches, particularly high expression levels of ApCOL03, -06, and -09 in leaves, and exclusive leaf expression of ApCOL08 at a high level (Figure 7). Leaves are known as primary organs for sensing photoperiodic signals, and the high expression of ApCOL in leaves suggests its role in activating FT transcription to promote flowering [69,70]. Additionally, apart from ApCOL08, we identified three genes (ApCOL04, -05, and -07) with pronounced transcript levels specific to flowers, indicating their potential significance in flower growth and development. Notably, the absence of ApCOL expression in seeds implies a lack of involvement in A. paniculata seed development (Figure 7).
Cis-regulatory elements in the promoter region play a crucial role in the regulation of gene expression under the influence of various factors [71,72]. Numerous light-responsive elements have been identified in the promoter region of the ApCOL gene, and many reports have shown that the COL gene is a key regulator in photoperiod-mediated regulation of flowering, suggesting that the A. paniculata COL gene is sensitive to photoperiodic changes [49,69,73]. Furthermore, the identification of response elements to various exogenous phytohormones and abiotic stresses in the promoter region implies a potential inducibility of ApCOL gene expression by these stimuli (Figure 5).
To date, COL has been extensively investigated in the context of light regulation and circadian rhythms in plants, but its responses to exogenous hormones and abiotic stresses remain relatively understudied. In Arabidopsis, it has been observed that ABA, salt stress, and osmotic stress can upregulate the expression of AtCOL4, thereby improving salt tolerance [26]. In rice, the Ghd7 gene, a homolog of CO-like genes, not only controls plant height, heading stage, and grain yield, but also plays a role in enhancing stress tolerance [27]. Additionally, OsCOL9 has been found to interact with OsRACK1 via salicylic acid and ethylene signaling pathways, contributing to elevated resistance in rice [52].
In our study, we employed qRT-PCR to anticipate the expression patterns of ApCOLs in specific environmental conditions. Our findings revealed that alterations in hormone concentrations did not impact the expression levels of ApCOLs, however, their expression was notably upregulated over the course of treatment (Figure 5). ApCOL08 and ApCOL09 exhibited similar expression profiles, especially in response to 6-BA and NAA treatments, displaying significant induction. ApCOL01, -04, and -05 demonstrated varying degrees of upregulation across all treatment conditions, indicating potential involvement in the whole process of hormone signaling crosstalk. The expression of ApCOL03, -06, and -07 was initially suppressed following treatment initiation. Notably, the majority of ApCOLs exhibited robust induction following prolonged exposure to 6-BA. These observations suggest that ApCOLs may serve as regulatory elements involved in phytohormone modulation through synergistic mechanisms.
Several abiotic factors, including soil salinity, have been identified as serious impediments to the productivity of medicinal plants. Salt stress stands out as a prominent abiotic factor contributing to diminished plant growth and productivity [74,75]. In the present investigation, the expression patterns of the majority of ApCOLs were influenced by two different concentrations and durations of salt treatments (Figure 9A). Of ApCOLs, 67% exhibited elevated expression levels under low salt concentrations compared to high salt concentrations, while 56% of ApCOLs showed higher expression levels under short-term salt stress rather than long-term salt stress conditions (Table S7). Noteworthy is the expression behavior of ApCOL08 under salt stress, showcasing significant responsiveness to varying concentrations and treatment durations, suggesting its potential as a key player in salt stress tolerance within A. paniculata (Figure 9B). We chose ApCOL08 and ApCOL09 for subcellular localization. ApCOL08 and ApCOL09 are located in the same subgroup in the phylogeny, and not only the gene structures are similar, but the expression patterns of both are similar, so we speculate that ApCOL08 and ApCOL09 may have similar functions. The subcellular localization results showed localization to the nucleus, which was consistent with the prediction of BioSignal, suggesting that ApCOL08 and ApCOL09 proteins function in the nucleus (Figure 10).
So far, some progress has been made in the research on the genetic engineering of A. paniculata. Still, the complexity of the A. paniculata genome and the fact that the genetic transformation system of A. paniculata has not yet been established have created a great limitation for us in studying its gene function. Compared with heterologous expression in Arabidopsis, we found an efficient and more rapid means to verify plant resistance-related gene functions. In recent years, yeast heterologous expression has been used more frequently for the study of stress tolerance genes, such as in Populus trichocarpa, where the resistance of PtrRZFP1/4/7 to osmotic and salt stresses was verified by observing the growth condition of S. cerevisiae [76]. Overexpression of GbSOS1 enhanced the salt tolerance of yeast, thus providing evidence to support the screening of candidate genes for the cultivation of salt-tolerant Gossypium barbadense [77]. TrSAMDC1 was expressed in yeast for the Arabidopsis in salt and cold tolerance [78]. S. cerevisiae has a eukaryotic expression system close to that of plants and also has the processes of glycosylation, disulfide bond formation and protein folding, and post-translational processing, which leads to the normal functioning of proteins encoded by the screened plant genes, and the probability of false positives of the validated genes for adversity resistance is greatly reduced [79]. Therefore, yeast became an ideal model for verifying gene resistance in this study. We used the INVSc1-pYES2 recombinant protein inducible expression system to heterologously express ApCOL08 in yeast for further validation (Figure 11). Encouragingly, transformed INVSc1 yeast (pYES2) with ApCOL08 showed enhanced tolerance to high salt stress compared with untransformed INVSc1 yeast (pYES2), confirming the qRT-PCR expression analysis and emphasizing the possible involvement of the ApCOL08 gene in the salt stress response mechanism. Our study preliminarily verified the potential function of ApCOL08 in A. paniculata salt stress, and later we will further investigate the stable transgenic A. paniculata method to fully elucidate the nuclear regulatory mechanism of its gene function.

4. Materials and Methods

4.1. Identification and Update of the COL Genes

The relevant genome files of A. paniculata were downloaded from the National Center for Biotechnology Information database (NCBI, PRJNA421867) [46]. The HMM models for CCT (PF06203) and B-box (PF00643) were obtained from the Pfam database (http://pfam.xfam.org/ (accessed on 12 February 2024)) [80] and compared in the A. paniculata genome by HMMER 3.3.2 (http://hmmer.org/ (accessed on 12 February 2024)), with an E-value of 10−3, thus screening for potential ApCOL protein sequences [81]. Redundant sequences were removed, and the results were used to create specific HMM models of ApCOL proteins for secondary searches. Meanwhile, the AtCOL protein sequences (https://www.arabidopsis.org/ (accessed on 20 February 2024)) were served as query sequences for BLAST analysis of ApCOL, with an E-value of 10−10. The CDD database (https://www.ncbi.nlm.nih.gov/cdd/ (accessed on 20 February 2024)) was applied for multiple sequence analysis [82], and only the genes containing both of these domains were eventually identified as the candidate genes. In addition, the SMART database (http://smart.embl.de/ (accessed on 22 February 2024)) was applied to verify the integrity of the ApCOL protein [83]. The sequences of the remaining species, i.e., Arabidopsis (Arabidopsis thaliana), soybean (Glycine max), sesame (Sesamum indicum), tomato (Solanum lycopersicum), grape (Vitis vinifera), rice (Oryza sativa), and maize (Zea mays), were obtained from the Ensembl Plants with the above method of retrieval and update (http://plants.ensembl.org/index.html (accessed on 1 March 2024)).

4.2. Chromosomal Location and Syntenic Analysis of ApCOLs

The COL genes were renamed based on their chromosomal location, and the Perl script was employed for the collection of distribution information. Syntenic analysis was performed via the Multiple Collinearity Scan toolkit (MCScanx https://github.com/wyp1125/MCScanX (accessed on 20 February 2024)) for determining the duplication patterns of COL genes in the A. paniculata genome with default parameters (E-value set to 10−10) [84]. Inter-species syntenic analyses were conducted to anticipate the evolutionary preferences of COL family genes (Dicotyledonous: Arabidopsis, soybean, sesame, tomato, and grape; Monocotyledonous: rice and maize).

4.3. Phylogenetic Analysis and Subfamily Classification

Multiple sequence alignment (MSA) of the full-length protein sequences of COL was performed by MUSCLE (embedded in MEGA version 11.0.13) (default parameters) [85]. The phylogenetic relationship was constructed by the neighbor-joining method with the above alignment results (Poisson model, pairwise deletion, and other default parameters). The 1000 bootstrap replicates were taken to evaluate the reliability, and only those with bootstrap values higher than 50 were displayed. The subfamily delineation of ApCOL took the phylogenetic classification of AtCOL as a reference [9].

4.4. Sequence and Structural Analysis of COL Proteins

The online program ExPASy (https://web.expasy.org/protparam/ (accessed on 26 January 2024)) was utilized to predict the biochemical properties of ApCOL proteins, including amino acid numbers, molecular weights (MWs), and predicted isoelectric points (pIs), etc. [86]. Subcellular localization was performed by WoLF PSORT (https://wolfpsort.hgc.jp/ (accessed on 26 January 2024)), CELLO 2.5 (http://cello.life.nctu.edu.tw/ (accessed on 26 January 2024)), and Cell-PLoc (http://www.csbio.sjtu.edu.cn/bioinf/Cell-PLoc/ (accessed on 26 January 2024)) for multiple assessments [87,88,89]. The conserved motifs of ApCOL proteins were recognized via the Multiple Em for Motif Elicitation 5.4.1 (MEME, https://meme-suite.org/meme/ (accessed on 12 March 2024)) [90]. Gene structure information was obtained from gene annotation files.

4.5. Analysis of Cis-Regulatory Elements and Transcription Factor Binding Sites

The 2000 bp sequences of the ApCOL genes upstream of the ATG start codon were extracted by Perl script. The Plant CARE database (http://bioinformatics.psb.ugent.be/webtools/plantcare/html/ (accessed on 15 March 2024)) was applied to predict cis-regulatory elements (CREs) [91].

4.6. Plant Materials and Treatment Methods

The seeds of A. paniculata were derived from the Key Laboratory of Plant Secondary Metabolism and Regulation, Zhejiang Sci-Tech University, Hangzhou, China. The seeds were soaked in 40 °C warm water with natural cooling overnight to interrupt seed dormancy. The seedling stage was conducted in the artificial climate chamber, growing to 4–6 leaves for transplanting in the natural environment. Rapid-growth period A. paniculata were re-transferred to the artificial climate chamber for incubation so that the rate of uptake and the growth condition could be guaranteed. A. paniculata was stressed with gradient solutions; salt treatments were used with the most commonly used concentrations of NaCl (0, 50, 100 mM), while hormone treatments were set according to existing studies with SA, 6-BA, and NAA concentrations of (0, 5, and 10 μM). [92,93,94]. It was treated with a hand-held nebulizer, spraying the solution to the leaves until the leaves were well-wetted. The bottoms of the potted plants were placed with water storage devices for solution absorption and water replenishment. The time of treatment was picked in the evening to reduce the influence of plant photosynthesis. Each treatment was repeated three times. To capture the dynamics of the stress response, fresh young leaves were collected on days 5 and 10, respectively, after treatment, immediately placed in liquid nitrogen, and then stored in a refrigerator at −80 °C until reused.

4.7. RNA Extraction and Construction of Gene Expression Profiles

Total RNA from A. paniculata leaves was extracted using the FastPure Plant Total RNA Isolation Kit (Vazyme, Nanjing, China). The quantity and quality of all RNA samples were determined by microspectrophotometer (Thermo Fisher, NanoDrop 2000, Waltham, MA, USA). cDNA was synthesized using the Reverse Transcription Kit, and the product was diluted and used as a template. The above processes were performed according to the manufacturer’s instructions. The qRT-PCR was carried out with a ChamQ Universal SYBR qPCR Master Mix (Vazyme, Q311, Nanjing, China) on the QuantStudio 6 Flex Real-Time PCR System (Thermo Fisher, Waltham, MA, USA). A minimum of three replicates were used for each gene. The UBC was treated as an internal reference gene, and all primers are listed in the Supplemental Table S6. The 2−ΔΔCt method was adopted for outcome analysis [95], and gene expression profiles were visualized in TBtools version v2.142 as log2-fold change values of gene expression [96]. When the relative expressions of genes (treatment/control) were ≥2 or ≤0.5 compared to the control group, they were considered as significantly up- or downregulated.

4.8. Subcellular Localization Analysis

The CDS of ApCOL08 and ApCOL09 without stop codon were constructed into the pCAMBIA1300-eGFP vector and cut with Xbal and BamHI. The recombinant vectors (pCAMBIA1300-ApCOL08 and pCAMBIA1300-ApCOL09) and the empty vector (pCAMBIA1300-eGFP) were then transformed into Agrobacterium GV3101 and injected into approximately five-week-old tobacco leaves. After incubation under dark conditions for 48 h, GFP fluorescence was observed by laser scanning confocal microscopy.

4.9. Heterologous Expression of Genes in Yeast

The recombinant plasmid pYES2-ApCOL08 was obtained by cloning CDS of ApCOL08 onto pYES2 vector using EcoRI and XhoI sites. The yeast expression vectors pYES2 no-load control and pYES2-ApCOL08 were converted into S. cerevisiae INVSc1 by the lithium acetate conversion method [76]. Specifically, the INVSc1 yeast containing the plasmid was shaken overnight at 30 °C in liquid medium containing 2% glucose SD-U to OD600 = 0.4 and centrifuged at 1500× g; the supernatant was then removed, and the same volume of SG-U liquid medium containing 2% galactose was added; the bacteria were shaken at 30 °C overnight for 24 h to induce expression, centrifuged to remove the supernatant, resuspended with sterile water, and diluted (100, 101, 102, 103) to SG-U + 0 M NaCl, SG-U + 0.5 M NaCl, SG-U + 1.0 M NaCl, SG-U + 1.3 M NaCl, SG-U + 1.5 M NaCl, SG-U + 2.0 M NaCl plates, which were placed in a 30 °C incubator and observed after 4 days and 7 days, respectively, and finally, pictures were taken [97].

5. Conclusions

In this study, we identified nine ApCOL genes and performed a comprehensive genomic analysis of the ApCOL gene family in A. paniculata, focusing on their evolution, structure, expression profile, and potential functions. Our results suggest that the COL gene family may have important roles in plant growth and development and stress response in addition to flowering regulation. We found that ApCOL genes were specifically expressed in different tissues. In addition, some genes could be significantly induced by hormones and salt stress, and we identified ApCOL08 as a possible key regulatory gene. Subsequently, cloning and expression analysis of ApCOL08 in S.cerevisiae showed enhanced tolerance to salt stress in yeast, suggesting that it may be a promising candidate gene for further exploration of salt tolerance studies. Since the successful cases of genetic engineering for A. paniculata are very limited, the only documented case is the successful expression of VIGS (virus-induced gene silencing) through Agrobacterium infestation of A. paniculata leaves, and we are currently trying to follow this method, and we will add the salt stress treatment to the experiment in the future, so as to further validate the biological function of the candidate genes. In addition, based on the fact that salt stress affects diterpene lactones, which are active components in A. paniculata, a salt-tolerant A. paniculata can be cultivated for planting in saline soils in the future, thus expanding the distribution of A. paniculata germplasm resources. In conclusion, this study not only contributes to the understanding of the evolutionary dynamics of COL genes, but also provides a new approach to improve salt stress tolerance in plant breeding.

Supplementary Materials

The supporting information can be downloaded at https://www.mdpi.com/article/10.3390/ijms26020724/s1.

Author Contributions

Conceptualization, Y.Z., L.X. and Z.L.; Methodology, Y.Z., J.X., L.X. and Z.L.; Software, Y.Z., J.X., X.X., H.L. and Q.C.; Validation, Y.Z., J.X. and X.X.; Formal analysis, Y.Z., J.X., X.X., H.L., Q.C. and L.X.; Investigation, Q.C.; Writing—original draft, Y.Z. and J.X.; Writing—review & editing, H.L., Q.C., L.X. and Z.L.; Visualization, X.X. and H.L.; Supervision, L.X. and Z.L.; Project administration, L.X. and Z.L.; Funding acquisition, Z.L. All authors have read and agreed to the published version of the manuscript.

Funding

This research was supported by Zhejiang Sci-Tech University and the Tasly Group Modern Chinese Medicine Resources Development Key Technology Research Center, grant number (TZYHT201903250246).

Institutional Review Board Statement

Not applicable.

Informed Consent Statement

Not applicable.

Data Availability Statement

Data is contained within the article and Supplementary Materials.

Acknowledgments

We also thank Xuemin Zhang and Hongliang Xu from Tianjin Tasly modern TCM Resources Co., Ltd., and Bo Xu from the Tianjin Key Laboratory of Modern Chinese Medicine Resources Research.

Conflicts of Interest

The authors declare that they have no conflicts of interests.

References

  1. Fitter, A.H.; Fitter, R.S.R. Rapid Changes in Flowering Time in British Plants. Science 2002, 296, 1689–1691. [Google Scholar] [CrossRef] [PubMed]
  2. Srikanth, A.; Schmid, M. Regulation of flowering time: All roads lead to Rome. Cell Mol. Life Sci. 2011, 68, 2013–2037. [Google Scholar] [CrossRef]
  3. Song, Y.H.; Ito, S.; Imaizumi, T. Flowering time regulation: Photoperiod- and temperature-sensing in leaves. Trends Plant Sci. 2013, 18, 575–583. [Google Scholar] [CrossRef] [PubMed]
  4. Blümel, M.; Dally, N.; Jung, C. Flowering time regulation in crops—What did we learn from Arabidopsis? Curr. Opin. Biotechnol. 2015, 32, 121–129. [Google Scholar] [CrossRef]
  5. Shim, J.S.; Kubota, A.; Imaizumi, T. Circadian Clock and Photoperiodic Flowering in Arabidopsis: CONSTANS Is a Hub for Signal Integration. Plant Physiol. 2017, 173, 5–15. [Google Scholar] [CrossRef]
  6. Kinmonth-Schultz, H.A.; Tong, X.; Lee, J.; Song, Y.H.; Ito, S.; Kim, S.H.; Imaizumi, T. Cool night-time temperatures induce the expression of CONSTANS and FLOWERING LOCUS T to regulate flowering in Arabidopsis. New Phytol. 2016, 211, 208–224. [Google Scholar] [CrossRef] [PubMed]
  7. Putterill, J.; Varkonyi-Gasic, E. FT and florigen long-distance flowering control in plants. Curr. Opin. Plant Biol. 2016, 33, 77–82. [Google Scholar] [CrossRef] [PubMed]
  8. Robson, F.; Costa, M.M.R.; Hepworth, S.R.; Vizir, I.; Piñeiro, M.; Reeves, P.H.; Putterill, J.; Coupland, G. Functional importance of conserved domains in the flowering-time gene CONSTANS demonstrated by analysis of mutant alleles and transgenic plants. Plant J. 2002, 28, 619–631. [Google Scholar] [CrossRef]
  9. Khanna, R.; Kronmiller, B.; Maszle, D.R.; Coupland, G.; Holm, M.; Mizuno, T.; Wu, S.-H. The Arabidopsis B-Box Zinc Finger Family. Plant Cell 2009, 21, 3416–3420. [Google Scholar] [CrossRef]
  10. Wenkel, S.; Turck, F.; Singer, K.; Gissot, L.; Le Gourrierec, J.; Samach, A.; Coupland, G. CONSTANS and the CCAAT Box Binding Complex Share a Functionally Important Domain and Interact to Regulate Flowering of Arabidopsis. Plant Cell 2006, 18, 2971–2984. [Google Scholar] [CrossRef]
  11. Lagercrantz, U.; Axelsson, T. Rapid Evolution of the Family of CONSTANS LIKE Genes in Plants. Mol. Biol. Evol. 2000, 17, 1499–1507. [Google Scholar] [CrossRef] [PubMed]
  12. Hassidim, M.; Harir, Y.; Yakir, E.; Kron, I.; Green, R.M. Over-expression of CONSTANS-LIKE 5 can induce flowering in short-day grown Arabidopsis. Planta 2009, 230, 481–491. [Google Scholar] [CrossRef]
  13. Griffiths, S.; Dunford, R.P.; Coupland, G.; Laurie, D.A. The Evolution of CONSTANS-LIKE Gene Families in Barley, Rice, and Arabidopsis. Plant Physiol. 2003, 131, 1855–1867. [Google Scholar] [CrossRef]
  14. Chen, Y.; Zhou, R.; Hu, Q.; Wei, W.; Liu, J. Conservation and Divergence of the CONSTANS-LIKE (COL) Genes Related to Flowering and Circadian Rhythm in Brassica napus. Front. Plant Sci. 2021, 12, 760379. [Google Scholar] [CrossRef] [PubMed]
  15. Niu, T.; Wang, X.; Abbas, M.; Shen, J.; Liu, R.; Wang, Z.; Liu, A. Expansion of CONSTANS-LIKE genes in sunflower confers putative neofunctionalization in the adaptation to abiotic stresses. Ind. Crops Prod. 2022, 176, 114400. [Google Scholar] [CrossRef]
  16. Wong, A.C.S.; Hecht, V.r.F.G.; Picard, K.; Diwadkar, P.; Laurie, R.E.; Wen, J.; Mysore, K.; Macknight, R.C.; Weller, J.L. Isolation and functional analysis of CONSTANS-LIKE genes suggests that a central role for CONSTANS in flowering time control is not evolutionarily conserved in Medicago truncatula. Front. Plant Sci. 2014, 5, 486. [Google Scholar] [CrossRef] [PubMed]
  17. Somers, D.E.; Wu, F.; Price, B.W.; Haider, W.; Seufferheld, G.; Nelson, R.; Hanzawa, Y. Functional and Evolutionary Characterization of the CONSTANS Gene Family in Short-Day Photoperiodic Flowering in Soybean. PLoS ONE 2014, 9, e85754. [Google Scholar]
  18. Wu, K.; Cai, D.; Liu, H.; Sang, N.; Huang, X. Identification and characterization of CONSTANS-LIKE (COL) gene family in upland cotton (Gossypium hirsutum L.). PLoS ONE 2017, 12, e0179038. [Google Scholar]
  19. Chaurasia, A.K.; Patil, H.B.; Azeez, A.; Subramaniam, V.R.; Krishna, B.; Sane, A.P.; Sane, P.V. Molecular characterization of CONSTANS-LIKE (COL) genes in banana (Musa acuminata L. AAA Group, cv. Grand Nain). Physiol. Mol. Biol. Plants 2016, 22, 1–15. [Google Scholar] [CrossRef]
  20. Datta, S.; Hettiarachchi, G.H.C.M.; Deng, X.-W.; Holm, M. Arabidopsis CONSTANS-LIKE 3 Is a Positive Regulator of Red Light Signaling and Root Growth. Plant Cell 2006, 18, 70–84. [Google Scholar] [CrossRef]
  21. Cheng, X.F.; Wang, Z.Y. Overexpression of COL9, a CONSTANS-LIKE gene, delays flowering by reducing expression of CO and FT in Arabidopsis thaliana. Plant J. 2005, 43, 758–768. [Google Scholar] [CrossRef]
  22. Takase, T.; Kakikubo, Y.; Nakasone, A.; Nishiyama, Y.; Yasuhara, M.; Tokioka-Ono, Y.; Kiyosue, T. Characterization and transgenic study of CONSTANS-LIKE8 (COL8) gene in Arabidopsis thaliana: Expression of 35S:COL8 delays flowering under long-day conditions. Plant Biotechnol. 2011, 28, 439–446. [Google Scholar] [CrossRef]
  23. Yano, M.; Katayose, Y.; Ashikari, M.; Yamanouchi, U.; Monna, L.; Fuse, T.; Baba, T.; Yamamoto, K.; Umehara, Y.; Nagamura, Y.; et al. Hd1, a major photoperiod sensitivity quantitative trait locus in rice, is closely related to the Arabidopsis flowering time gene CONSTANS. Plant Cell 2000, 12, 2473–2483. [Google Scholar] [CrossRef] [PubMed]
  24. Hayama, R.; Yokoi, S.; Tamaki, S.; Yano, M.; Shimamoto, K. Adaptation of photoperiodic control pathways produces short-day flowering in rice. Nature 2003, 422, 719–722. [Google Scholar] [CrossRef] [PubMed]
  25. Liu, H.; Gu, F.; Dong, S.; Liu, W.; Wang, H.; Chen, Z.; Wang, J. CONSTANS-LIKE 9 (COL9) delays the flowering time in Oryza sativa by repressing the Ehd1 pathway. Biochem. Biophys. Res. Commun. 2016, 479, 173–178. [Google Scholar] [CrossRef]
  26. Min, J.H.; Chung, J.S.; Lee, K.H.; Kim, C.S. The CONSTANS-LIKE 4 transcription factor, AtCOL4, positively regulates abiotic stress tolerance through an abscisic acid-dependent manner in Arabidopsis. J. Integr. Plant Biol. 2014, 57, 313–324. [Google Scholar] [CrossRef] [PubMed]
  27. Liu, J.; Shen, J.; Xu, Y.; Li, X.; Xiao, J.; Xiong, L. Ghd2, a CONSTANS-LIKE gene, confers drought sensitivity through regulation of senescence in rice. J. Exp. Bot. 2016, 67, 5785–5798. [Google Scholar] [CrossRef] [PubMed]
  28. Xu, C.; Shan, J.; Liu, T.; Wang, Q.; Ji, Y.; Zhang, Y.; Wang, M.; Xia, N.; Zhao, L. CONSTANS-LIKE 1a positively regulates salt and drought tolerance in soybean. Plant Physiol. 2023, 191, 2427–2446. [Google Scholar] [CrossRef]
  29. Chen, J.; Chen, J.-y.; Wang, J.-n.; Kuang, J.-f.; Shan, W.; Lu, W.-j. Molecular characterization and expression profiles of MaCOL1, a CONSTANS-LIKE gene in banana fruit. Gene 2012, 496, 110–117. [Google Scholar] [CrossRef] [PubMed]
  30. Xia, P.; Li, Q.; Liang, Z.; Zhang, X.; Yan, K. Spaceflight breeding could improve the volatile constituents of Andrographis paniculata. Ind. Crops Prod. 2021, 171, 113967. [Google Scholar] [CrossRef]
  31. Samy, R.P.; Thwin, M.M.; Gopalakrishnakone, P.; Ignacimuthu, S. Ethnobotanical survey of folk plants for the treatment of snakebites in Southern part of Tamilnadu, India. J. Ethnopharmacol. 2008, 115, 302–312. [Google Scholar] [CrossRef]
  32. Lim, J.C.W.; Chan, T.K.; Ng, D.S.W.; Sagineedu, S.R.; Stanslas, J.; Wong, W.S.F. Andrographolide and its analogues: Versatile bioactive molecules for combating inflammation and cancer. Clin. Exp. Pharmacol. Physiol. 2012, 39, 300–310. [Google Scholar] [CrossRef] [PubMed]
  33. Mishra, K.; Dash, A.P.; Swain, B.K.; Dey, N. Anti-malarial activities of Andrographis paniculata and Hedyotis corymbosa extracts and their combination with curcumin. Malar. J. 2009, 8, 26. [Google Scholar] [CrossRef]
  34. Yu, B.; Dai, C.-Q.; Jiang, Z.-Y.; Li, E.-Q.; Chen, C.; Wu, X.-L.; Chen, J.; Liu, Q.; Zhao, C.-L.; He, J.-X.; et al. Andrographolide as an Anti-H1N1 drug and the mechanism related to retinoic acid-inducible gene-I-like receptors signaling pathway. Chin. J. Integr. Med. 2014, 20, 540–545. [Google Scholar] [CrossRef]
  35. Zeng, W.J.; Xu, L.; He, Q.L.; Zhang, L.L.; Xu, H.L.; Liang, Z.S. Agronomic traits of Andrographis paniculata and their correlation with diterpene lactones. Chin. J. Chin. Mater. Med. 2019, 44, 3233–3238. [Google Scholar]
  36. Xie, R.; Lin, Z.; Zhong, C.; Li, S.; Chen, B.; Wu, Y.; Huang, L.; Yao, H.; Shi, P.; Huang, J. Deciphering the potential anti-COVID-19 active ingredients inAndrographis paniculata(Burm. F.) Nees by combination of network pharmacology, molecular docking, and molecular dynamics. RSC Adv. 2021, 11, 36511–36517. [Google Scholar] [CrossRef] [PubMed]
  37. Wang, Q.; Xu, L.; Wang, F.; Chai, W.; Xu, B.; Xu, X.; Zhang, X.; Liang, Z. Preliminary analysis on the formation of Andrographis paniculata quality between the two main producing areas. J. Zhejiang Sci-Tech Univ. 2021, 45, 416–422. [Google Scholar]
  38. Hossain, M.S. The effect of salinity stress on the morpho-physiology and protein profile of Andrographis paniculata. Master’s Thesis, Kulliyyah of Science, International Islamic University Malaysia, Jalan Gombak, Malaysia, 2016. [Google Scholar]
  39. Wang, Q.; Xu, L.; Zhang, M.; Chai, W.; Zhang, X.; Xu, X.; Liang, Z. Mechanism of salicylic acid ameliorates salt-induced changes in Andrographis paniculata. China J. Chin. Mater. Medica 2020, 45, 5465–5471. [Google Scholar]
  40. Yu, Z.; Duan, X.; Luo, L.; Dai, S.; Ding, Z.; Xia, G. How Plant Hormones Mediate Salt Stress Responses. Trends Plant Sci. 2020, 25, 1117–1130. [Google Scholar] [CrossRef] [PubMed]
  41. Zhai, Y.; Shen, X.; Sun, Y.; Liu, Q.; Ma, N.; Zhang, X.; Jia, Q.; Liang, Z.; Wang, D. Genome-wide investigation of ARF transcription factor gene family and its responses to abiotic stress in Coix (Coix lacryma-jobi L.). Protoplasma 2023, 260, 1389–1405. [Google Scholar] [CrossRef] [PubMed]
  42. Anuradha, V.E.; Jaleel, C.A.; Salem, M.A.; Gomathinayagam, M.; Panneerselvam, R. Plant growth regulators induced changes in antioxidant potential and andrographolide content in Andrographis paniculata Wall.ex Nees. Pestic. Biochem. Physiol. 2010, 98, 312–316. [Google Scholar] [CrossRef]
  43. Sharma, S.N.; Jha, Z.; Sinha, R.K.; Geda, A.K. Jasmonate-induced biosynthesis of andrographolide in Andrographis paniculata. Physiol. Plant 2014, 153, 221–229. [Google Scholar] [CrossRef] [PubMed]
  44. Srinath, M.; Shailaja, A.; Bindu, B.B.V.; Giri, C.C. Molecular Cloning and Differential Gene Expression Analysis of 1-Deoxy-D-xylulose 5-Phosphate Synthase (DXS) in Andrographis paniculata (Burm. f) Nees. Mol. Biotechnol. 2020, 63, 109–124. [Google Scholar] [CrossRef] [PubMed]
  45. Liang, Z.; Fang, Y.; Yang, D. Biosynthesis, Regulation and Metabolic Engineering of Terpenoids in Plants. J. Zhejiang Sci-Tech Univ. 2017, 37, 255–264. [Google Scholar]
  46. Sun, W.; Leng, L.; Yin, Q.; Xu, M.; Huang, M.; Xu, Z.; Zhang, Y.; Yao, H.; Wang, C.; Xiong, C.; et al. The genome of the medicinal plant Andrographis paniculata provides insight into the biosynthesis of the bioactive diterpenoid neoandrographolide. Plant J. 2019, 97, 841–857. [Google Scholar] [CrossRef] [PubMed]
  47. Wang, W.-Z.; Ren, Y.-J.; Miao, Y. Roles of PPR Proteins in Plant Growth and Development. J. Trop. Subtrop. Bot. 2019, 27, 225–234. [Google Scholar]
  48. Pan, G.; Li, Z.; Yin, M.; Huang, S.; Tao, J.; Chen, A.; Li, J.; Tang, H.; Chang, L.; Deng, Y.; et al. Genome-wide identification, expression, and sequence analysis of CONSTANS-LIKE gene family in cannabis reveals a potential role in plant flowering time regulation. BMC Plant Biol. 2021, 21, 142. [Google Scholar] [CrossRef] [PubMed]
  49. Tan, J.; Jin, M.; Wang, J.; Wu, F.; Sheng, P.; Cheng, Z.; Wang, J.; Zheng, X.; Chen, L.; Wang, M.; et al. OsCOL10, a CONSTANS-LIKE Gene, Functions as a Flowering Time Repressor Downstream of Ghd7 in Rice. Plant Cell Physiol. 2016, 57, 798–812. [Google Scholar] [CrossRef] [PubMed]
  50. Li, X.L.; Ljungdahl, L.G. Expression of Aureobasidium pullulans xynA in, and secretion of the xylanase from, Saccharomyces cerevisiae. Appl. Environ. Microbiol. 1996, 62, 209–213. [Google Scholar] [CrossRef]
  51. Esquivel, B.D.; Rybak, J.M.; Barker, K.S.; Fortwendel, J.R.; Rogers, P.D.; White, T.C.; Idnurm, A. Characterization of the Efflux Capability and Substrate Specificity of Aspergillus fumigatus PDR5-like ABC Transporters Expressed in Saccharomyces cerevisiae. MBio 2020, 11, e00338-20. [Google Scholar] [CrossRef]
  52. Devarenne, T.P.; Liu, H.; Dong, S.; Sun, D.; Liu, W.; Gu, F.; Liu, Y.; Guo, T.; Wang, H.; Wang, J.; et al. CONSTANS-Like 9 (OsCOL9) Interacts with Receptor for Activated C-Kinase 1(OsRACK1) to Regulate Blast Resistance through Salicylic Acid and Ethylene Signaling Pathways. PLoS ONE 2016, 11, e0166249. [Google Scholar]
  53. Wang, H.; Zhang, Z.; Li, H.; Zhao, X.; Liu, X.; Ortiz, M.; Lin, C.; Liu, B. CONSTANS-LIKE 7 regulates branching and shade avoidance response in Arabidopsis. J. Exp. Bot. 2013, 64, 1017–1024. [Google Scholar] [CrossRef] [PubMed]
  54. Zhang, Z.; Ji, R.; Li, H.; Zhao, T.; Liu, J.; Lin, C.; Liu, B. CONSTANS-LIKE 7 (COL7) Is Involved in Phytochrome B (phyB)-Mediated Light-Quality Regulation of Auxin Homeostasis. Mol. Plant 2014, 7, 1429–1440. [Google Scholar] [CrossRef]
  55. Casal, J. Signalling for developmental plasticity. Trends Plant Sci. 2004, 9, 309–314. [Google Scholar] [CrossRef] [PubMed]
  56. Yang, T.; He, Y.; Niu, S.; Yan, S.; Zhang, Y. Identification and characterization of the CONSTANS (CO)/CONSTANS-LIKE (COL) genes related to photoperiodic signaling and flowering in tomato. Plant Sci. 2020, 301, 110653. [Google Scholar] [CrossRef]
  57. López, M.; Larrea, H.; Alvarenga, N.; González, D.; Iehisa, J.C.M. CONSTANS-LIKE genes are associated with flowering time in sesame. Theor. Exp. Plant Physiol. 2023, 35, 341–353. [Google Scholar] [CrossRef]
  58. Wang, L.; Xue, J.; Dai, W.; Tang, Y.; Gong, P.; Wang, Y.; Zhang, C. Genome-wide Identification, Phylogenetic Analysis, and Expression Profiling of CONSTANS-LIKE (COL) Genes in Vitis vinifera. J. Plant Growth Regul. 2018, 38, 631–643. [Google Scholar] [CrossRef]
  59. Song, N.; Xu, Z.; Wang, J.; Qin, Q.; Jiang, H.; Si, W.; Li, X. Genome-wide analysis of maize CONSTANS-LIKE gene family and expression profiling under light/dark and abscisic acid treatment. Gene 2018, 673, 1–11. [Google Scholar] [CrossRef]
  60. Ke, Y.-Z.; Wu, Y.-W.; Zhou, H.-J.; Chen, P.; Wang, M.-M.; Liu, M.-M.; Li, P.-F.; Yang, J.; Li, J.-N.; Du, H. Genome-wide survey of the bHLH super gene family in Brassica napus. BMC Plant Biol. 2020, 20, 115. [Google Scholar] [CrossRef] [PubMed]
  61. Valcarcel, J.; Koralewski, T.E.; Krutovsky, K.V. Evolution of Exon-Intron Structure and Alternative Splicing. PLoS ONE 2011, 6, e18055. [Google Scholar]
  62. Han, Y.; Hou, Z.; He, Q.; Zhang, X.; Yan, K.; Han, R.; Liang, Z. Genome-Wide Characterization and Expression Analysis of bZIP Gene Family Under Abiotic Stress in Glycyrrhiza uralensis. Front. Genet. 2021, 12, 754237. [Google Scholar] [CrossRef] [PubMed]
  63. Yang, N.; Cong, Q.; Cheng, L. BBX transcriptional factors family in plants–a review. Chin. J. Biotechnol. 2020, 36, 666–677. [Google Scholar]
  64. He, F.; Shi, Y.-J.; Li, J.-L.; Lin, T.-T.; Zhao, K.-J.; Chen, L.-H.; Mi, J.-X.; Zhang, F.; Zhong, Y.; Lu, M.-M.; et al. Genome-wide analysis and expression profiling of Cation/H+ exchanger (CAX) family genes reveal likely functions in cadmium stress responses in poplar. Int. J. Biol. Macromol. 2022, 204, 76–88. [Google Scholar] [CrossRef]
  65. He, F.; Shi, Y.-J.; Mi, J.-X.; Zhao, K.-J.; Cui, X.-L.; Chen, L.-H.; Yang, H.-B.; Zhang, F.; Zhao, Q.; Huang, J.-L.; et al. Genome-Wide Investigation of the NF-X1 Gene Family in Populus trichocarpa Expression Profiles during Development and Stress. Int. J. Mol. Sci. 2021, 22, 4664. [Google Scholar] [CrossRef]
  66. He, F.; Shi, Y.-J.; Zhao, Q.; Zhao, K.-J.; Cui, X.-L.; Chen, L.-H.; Yang, H.-B.; Zhang, F.; Mi, J.-X.; Huang, J.-L.; et al. Genome-wide investigation and expression profiling of polyphenol oxidase (PPO) family genes uncover likely functions in organ development and stress responses in Populus trichocarpa. BMC Genom. 2021, 22, 731. [Google Scholar] [CrossRef]
  67. Zhao, P.; Wang, D.; Wang, R.; Kong, N.; Zhang, C.; Yang, C.; Wu, W.; Ma, H.; Chen, Q. Genome-wide analysis of the potato Hsp20 gene family: Identification, genomic organization and expression profiles in response to heat stress. BMC Genom. 2018, 19, 61. [Google Scholar] [CrossRef] [PubMed]
  68. Li, R.; Li, T.; Wu, X.; Yao, X.; Ai, H.; Zhang, Y.; Gan, Z.; Huang, X. Genome-Wide Identification, Characterization and Expression Profiling of the CONSTANS-LIKE Genes in Potato (Solanum tuberosum L.). Genes 2023, 14, 1174. [Google Scholar] [CrossRef]
  69. Turck, F.; Fornara, F.; Coupland, G. Regulation and Identity of Florigen: FLOWERING LOCUS T Moves Center Stage. Annu. Rev. Plant Biol. 2008, 59, 573–594. [Google Scholar] [CrossRef]
  70. Zhang, S.; Zhang, L.; Zou, H.; Qiu, L.; Zheng, Y.; Yang, D.; Wang, Y. Effects of Light on Secondary Metabolite Biosynthesis in Medicinal Plants. Front. Plant Sci. 2021, 12, 781236. [Google Scholar] [CrossRef]
  71. Zemlyanskaya, E.V.; Dolgikh, V.A.; Levitsky, V.G.; Mironova, V. Transcriptional regulation in plants: Using omics data to crack the cis-regulatory code. Curr. Opin. Plant Biol. 2021, 63, 102058. [Google Scholar] [CrossRef]
  72. Hu, W.; Zheng, Y.; Zheng, J.; Yan, K.; Liang, Z.; Xia, P. Binding proteins PnCOX11 and PnDCD strongly respond to GA and ABA in Panax notoginseng. Int. J. Biol. Macromol. 2022, 212, 303–313. [Google Scholar] [CrossRef] [PubMed]
  73. Wu, W.; Zheng, X.-M.; Chen, D.; Zhang, Y.; Ma, W.; Zhang, H.; Sun, L.; Yang, Z.; Zhao, C.; Zhan, X.; et al. OsCOL16, encoding a CONSTANS-LIKE protein, represses flowering by up-regulating Ghd7 expression in rice. Plant Sci. 2017, 260, 60–69. [Google Scholar] [CrossRef] [PubMed]
  74. Irfanqureshi, M.; Israr, M.; Abdin, M.; Iqbal, M. Responses of Artemisia annua L. to lead and salt-induced oxidative stress. Environ. Exp. Bot. 2005, 53, 185–193. [Google Scholar] [CrossRef]
  75. Wang, Q.; Zeng, W.; Ali, B.; Zhang, X.; Xu, L.; Liang, Z. Genome-wide identification of WRKY gene family and expression analysis under abiotic stresses in Andrographis paniculata. Biocell 2021, 45, 1107–1119. [Google Scholar] [CrossRef]
  76. Li, J.-L.; Li, H.; Zhao, J.-J.; Yang, P.; Xiang, X.; Wei, S.-Y.; Wang, T.; Shi, Y.-J.; Huang, J.; He, F. Genome-wide identification and characterization of the RZFP gene family and analysis of its expression pattern under stress in Populus trichocarpa. Int. J. Biol. Macromol. 2024, 255, 128108. [Google Scholar] [CrossRef]
  77. Xu, F.-C.; Wang, M.-J.; Guo, Y.-W.; Song, J.; Gao, W.; Long, L. The Na+/H+ antiporter GbSOS1 interacts with SIP5 and regulates salt tolerance in Gossypium barbadense. Plant Sci. 2023, 330, 111658. [Google Scholar] [CrossRef] [PubMed]
  78. Jia, T.; Hou, J.; Iqbal, M.Z.; Zhang, Y.; Cheng, B.; Feng, H.; Li, Z.; Liu, L.; Zhou, J.; Feng, G.; et al. Overexpression of the white clover TrSAMDC1 gene enhanced salt and drought resistance in Arabidopsis thaliana. Plant Physiol. Biochem. 2021, 165, 147–160. [Google Scholar] [CrossRef]
  79. Baghban, R.; Farajnia, S.; Rajabibazl, M.; Ghasemi, Y.; Mafi, A.; Hoseinpoor, R.; Rahbarnia, L.; Aria, M. Yeast Expression Systems: Overview and Recent Advances. Mol. Biotechnol. 2019, 61, 365–384. [Google Scholar] [CrossRef]
  80. Mistry, J.; Chuguransky, S.; Williams, L.; Qureshi, M.; Salazar Gustavo, A.; Sonnhammer, E.L.L.; Tosatto, S.C.E.; Paladin, L.; Raj, S.; Richardson, L.J.; et al. Pfam: The protein families database in 2021. Nucleic Acids Res. 2021, 49, D412–D419. [Google Scholar] [CrossRef] [PubMed]
  81. Potter, S.C.; Luciani, A.; Eddy, S.R.; Park, Y.; Lopez, R.; Finn, R.D. HMMER web server: 2018 update. Nucleic Acids Res. 2018, 46, W200–W204. [Google Scholar] [CrossRef] [PubMed]
  82. Lu, S.; Wang, J.; Chitsaz, F.; Derbyshire, M.K.; Geer, R.C.; Gonzales, N.R.; Gwadz, M.; Hurwitz, D.I.; Marchler, G.H.; Song, J.S.; et al. CDD/SPARCLE: The conserved domain database in 2020. Nucleic Acids Res. 2020, 48, D265–D268. [Google Scholar] [CrossRef] [PubMed]
  83. Letunic, I.; Khedkar, S.; Bork, P. SMART: Recent updates, new developments and status in 2020. Nucleic Acids Res. 2021, 49, D458–D460. [Google Scholar] [CrossRef] [PubMed]
  84. Wang, Y.; Tang, H.; DeBarry, J.D.; Tan, X.; Li, J.; Wang, X.; Lee, T.h.; Jin, H.; Marler, B.; Guo, H.; et al. MCScanX: A toolkit for detection and evolutionary analysis of gene synteny and collinearity. Nucleic Acids Res. 2012, 40, e49. [Google Scholar] [CrossRef] [PubMed]
  85. Kumar, S.; Stecher, G.; Tamura, K. MEGA7: Molecular Evolutionary Genetics Analysis Version 7.0 for Bigger Datasets. Mol. Biol. Evol. 2016, 33, 1870–1874. [Google Scholar] [CrossRef] [PubMed]
  86. Duvaud, S.; Gabella, C.; Lisacek, F.; Stockinger, H.; Ioannidis, V.; Durinx, C. Expasy, the Swiss Bioinformatics Resource Portal, as designed by its users. Nucleic Acids Res. 2021, 49, W216–W227. [Google Scholar] [CrossRef] [PubMed]
  87. Yu, C.S.; Chen, Y.C.; Lu, C.H.; Hwang, J.K. Prediction of protein subcellular localization. Proteins 2006, 64, 643–651. [Google Scholar] [CrossRef]
  88. Horton, P.; Park, K.J.; Obayashi, T.; Fujita, N.; Harada, H.; Adams-Collier, C.J.; Nakai, K. WoLF PSORT: Protein localization predictor. Nucleic Acids Res. 2007, 35, W585–W587. [Google Scholar] [CrossRef]
  89. Chou, K.-C.; Shen, H.-B. Cell-PLoc: A package of Web servers for predicting subcellular localization of proteins in various organisms. Nat. Protoc. 2008, 3, 153–162. [Google Scholar] [CrossRef] [PubMed]
  90. Bailey, T.L.; Boden, M.; Buske, F.A.; Frith, M.; Grant, C.E.; Clementi, L.; Ren, J.; Li, W.W.; Noble, W.S. MEME SUITE: Tools for motif discovery and searching. Nucleic Acids Res. 2009, 37, W202–W208. [Google Scholar] [CrossRef] [PubMed]
  91. Lescot, M.; Déhais, P.; Thijs, G.; Marchal, K.; Moreau, Y.; Peer, Y.V.d.; Rouzé, P.; Rombauts, S. PlantCARE, a database of plant cis-acting regulatory elements and a portal to tools for in silico analysis of promoter sequences. Nucleic Acids Res. 2002, 30, 325–327. [Google Scholar] [CrossRef]
  92. Ismail, N.A.; Hossain, M.S.; Husna, N.; Mustafa, M.; Phang, I.C. Morpho-physiological characteristics, selected macronutrient uptake, and oxidative stress level of Andrographis paniculata under saline condition. J. Teknol. 2015, 77, 135–140. [Google Scholar] [CrossRef]
  93. Zaheer, M.; Giri, C.C. Multiple shoot induction and jasmonic versus salicylic acid driven elicitation for enhanced andrographolide production in Andrographis paniculata. Plant Cell Tissue Organ. Cult. 2015, 122, 553–563. [Google Scholar] [CrossRef]
  94. Xu, J.; Xu, H.; Zhao, H.; Liu, H.; Xu, L.; Liang, Z. Genome-wide investigation of bHLH genes and expression analysis under salt and hormonal treatments in Andrographis paniculata. Ind. Crops Prod. 2022, 183, 114928. [Google Scholar] [CrossRef]
  95. Livak, K.J.; Schmittgen, T.D. Analysis of Relative Gene Expression Data Using Real-Time Quantitative PCR and the 2−ΔΔCT Method. Methods 2001, 25, 402–408. [Google Scholar] [CrossRef] [PubMed]
  96. Chen, C.; Chen, H.; Zhang, Y.; Thomas, H.R.; Frank, M.H.; He, Y.; Xia, R. TBtools: An Integrative Toolkit Developed for Interactive Analyses of Big Biological Data. Mol. Plant 2020, 13, 1194–1202. [Google Scholar] [CrossRef]
  97. Ibrahim, H.R.; Matsuzaki, T.; Aoki, T. Genetic evidence that antibacterial activity of lysozyme is independent of its catalytic function. FEBS Lett. 2001, 506, 27–32. [Google Scholar] [CrossRef]
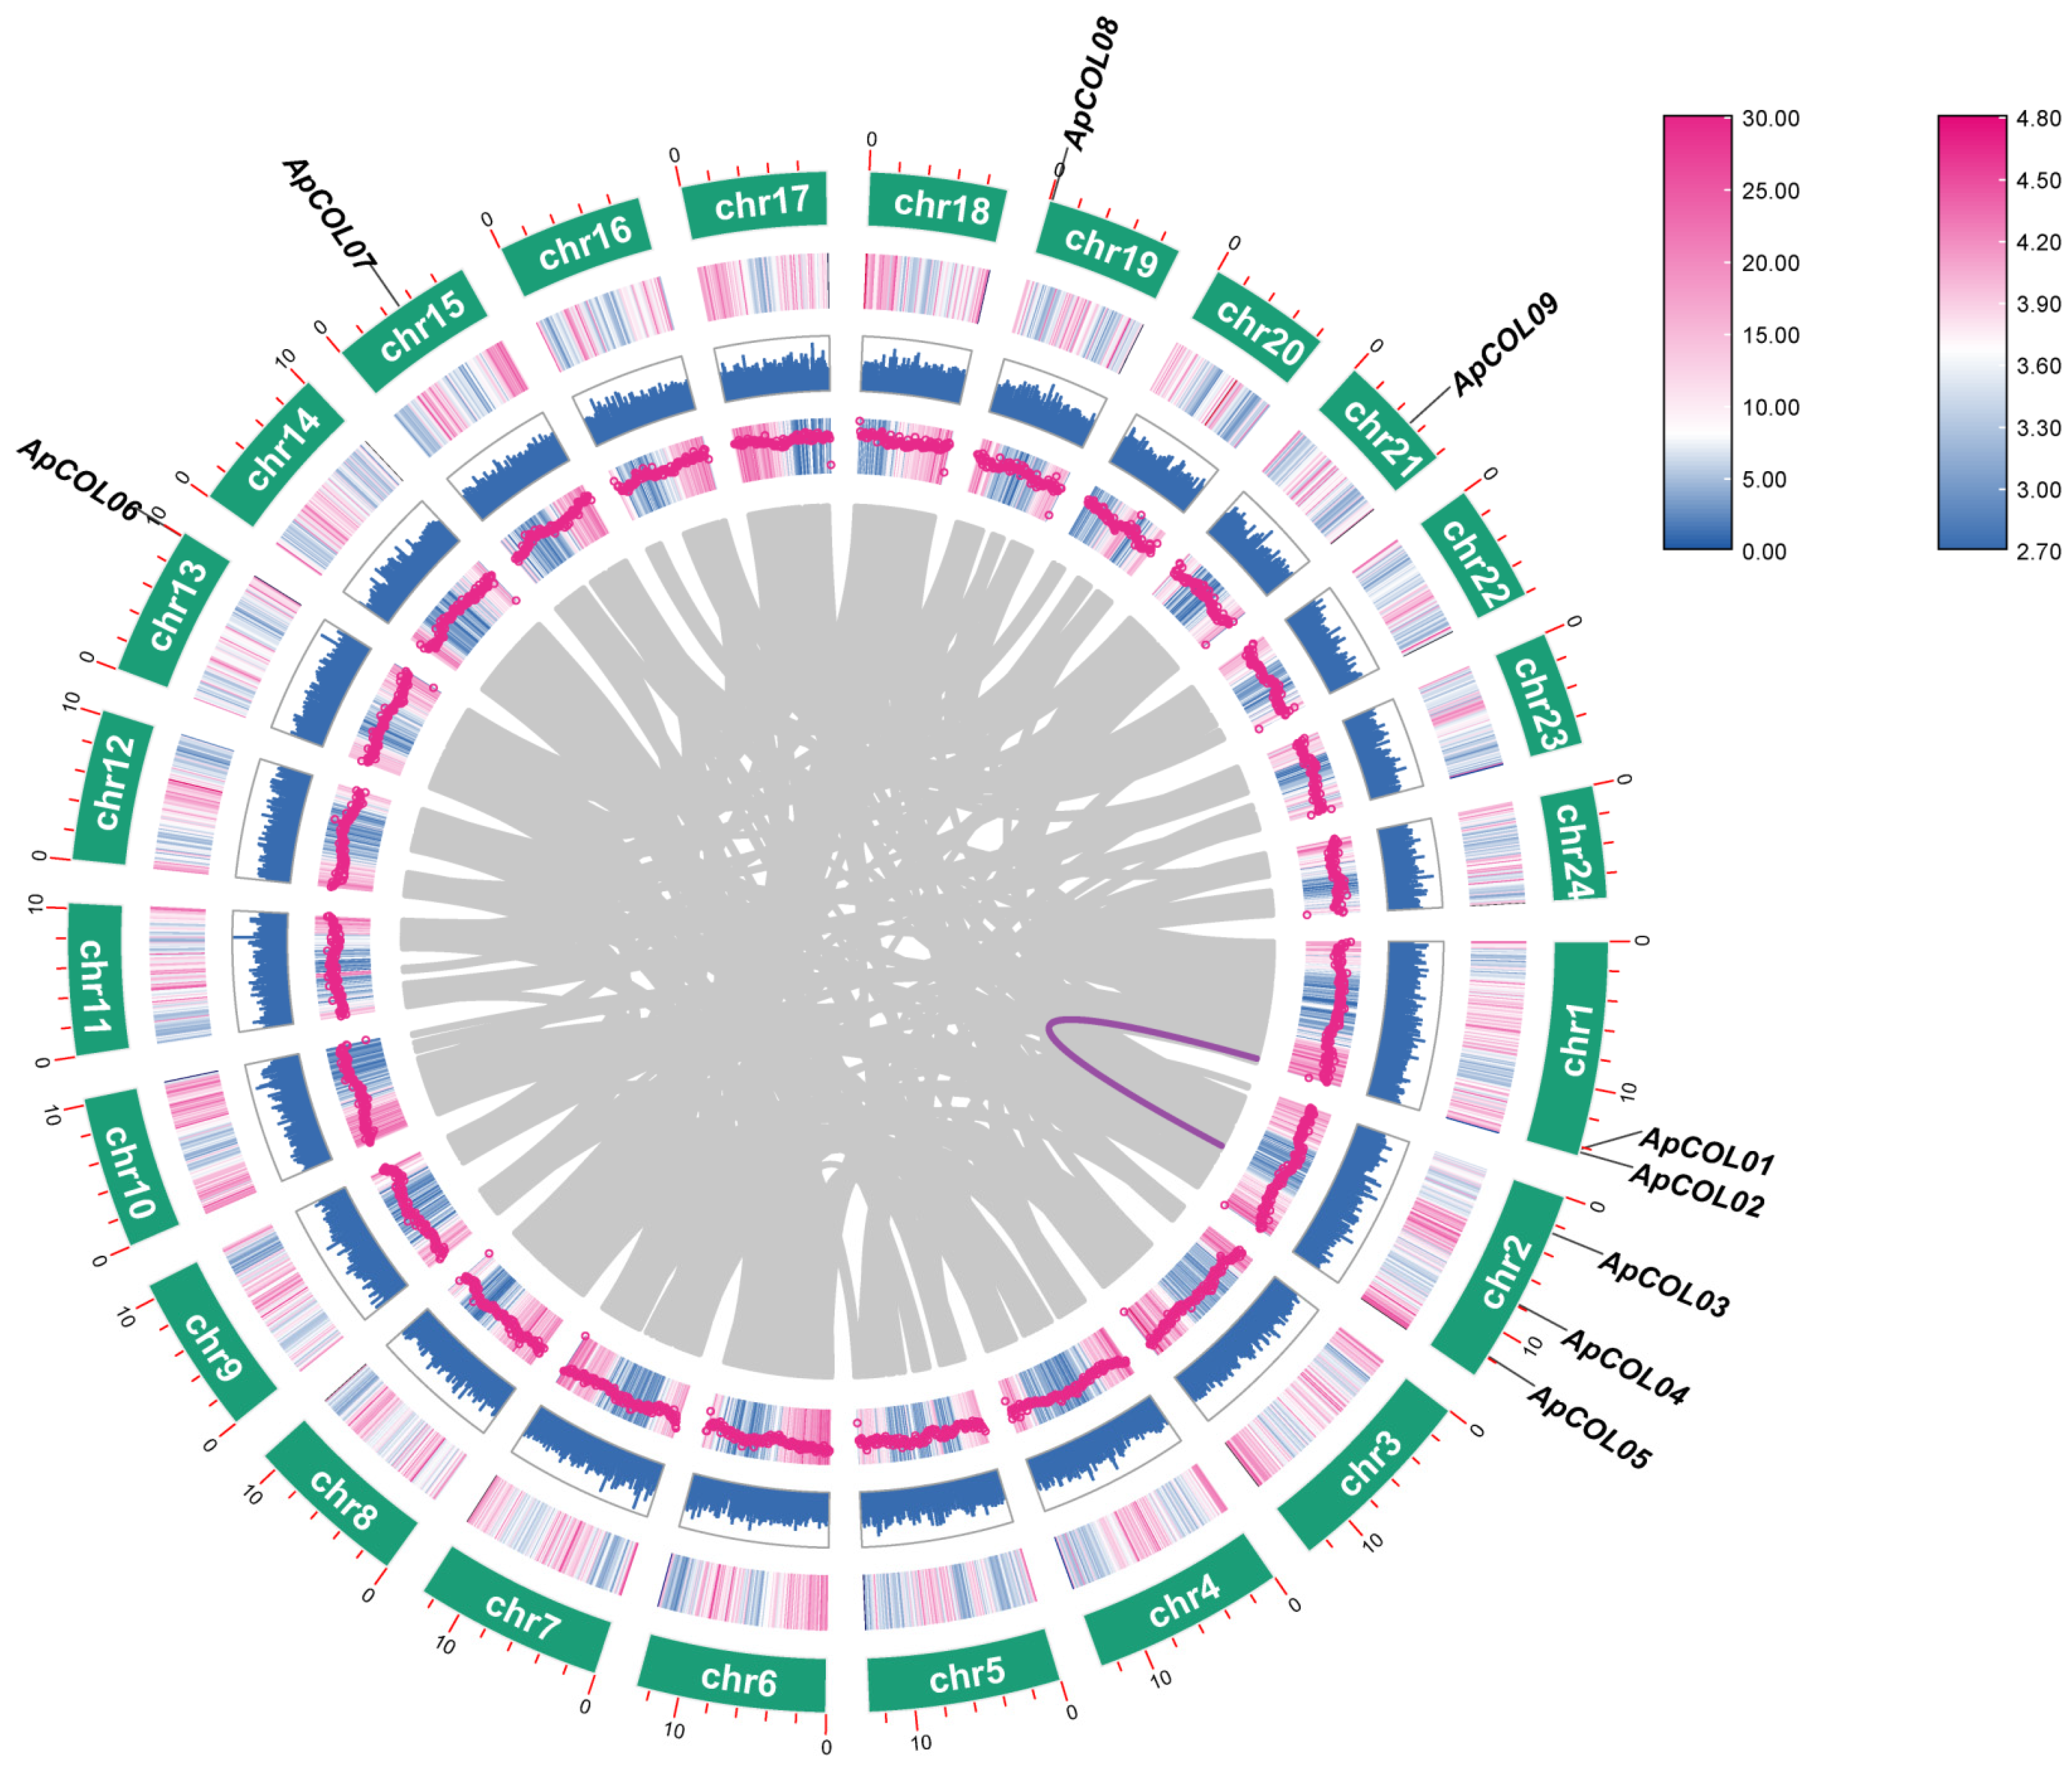
Figure 1. Interchromosomal homology analysis of ApCOL gene in the A. paniculata genome. The purple line represents the replication events of the ApCOL genes, and the gray line represents the syntenic blocks in the A. paniculata genome.
Ijms 26 00724 g001
Figure 2. NJ Phylogenetic tree of eight plant COL proteins. The phylogenetic tree is divided into three groups and six subgroups, each marked with different colors. Circular nodes represent Bootstrap values above 50%.
Ijms 26 00724 g002
Figure 3. The Nightingale Rose Chart calculates the number of COL members in eight species and shows the number of members in the three groups. The eight plants include A. paniculata, Arabidopsis (A.thaliana), soybean (G. max), sesame (S. indicum), tomato (S. lycopersicum), grape (V. vinifera), rice (O. sativa), and maize (Z. mays).
Ijms 26 00724 g003
Figure 4. Phylogenetic tree, conserved motifs, and gene structure analyses of A. paniculata ApCOL genes. (A) Evolutionary relationships of the nine ApCOL genes. (B) Conserved motif composition of ApCOL proteins. (C) Distribution of conserved protein structural domains of ApCOLs. (D) Exon–intron structure analysis of ApCOLs. Exons and introns are represented by yellow boxes and gray lines, respectively.
Ijms 26 00724 g004
Figure 5. Distribution of cis-regulatory elements in the 2000 bp sequence of the promoter region of the ApCOL gene. Each cis-regulatory element is indicated by a different color and is positioned in the same position as the corresponding position of the promoter.
Ijms 26 00724 g005
Figure 6. Synteny relationship analysis of COL genes between A. paniculata and other plants. Gray lines in the background represent collinear blocks in the A. paniculata and other plant genomes, and green lines indicate synthetic COL gene pairs.
Ijms 26 00724 g006
Figure 7. Tissue-specific expression profiles of ApCOL genes in different tissues of A. paniculata. The logarithm of FPKM values was normalized for creating heatmaps. Different colors represent gene expression levels, with high expression levels approaching red and low expression levels approaching green. Genes with relative expression values > 0.3 in each tissue are listed in the four squares of the right-hand panel, and no genes were expressed in seeds. L: Leaves; S: Stem; B: Branch; F: Flowers; SD: Seed.
Ijms 26 00724 g007
Figure 8. The expression profile of ApCOL genes in the leaves of A. paniculata under three PGR treatments (6-BA, SA, and NAA) was analyzed by qRT-PCR. The relative expression levels of genes were calculated by using the 2−ΔΔCt method. The UBC gene serves as an internal reference gene. The results were visualized as log2-fold changes. 6-BA-5-5/6-BA-5-10: A. paniculata treated with 5 μM 6-BA for 5 and 10 days; 6-BA-10-5/6-BA-10-10: A. paniculata treated with 10 μM 6-BA for 5 and 10 days; SA-5-5/SA-5-10: A. paniculata treated with 5 μM SA for 5 and 10 days; SA-10-5/SA-10-10: A. paniculata treated with 10 μM SA for 5 and 10 days; NAA-5-5/NAA-5-10: A. paniculata treated with 5 μM NAA for 5 and 10 days; NAA-10-5/NAA-10-10: A. paniculata treated with 10 μM NAA for 5 and 10 days.
Ijms 26 00724 g008
Figure 9. Expression analysis of COL genes in A. paniculata leaves under salt treatment. Expression analysis of ApCOLs in the leaves of A. paniculata under salt stress. (A) The expression profile of ApCOL genes under salt treatment was analyzed by qRT-PCR. The relative expression levels of genes were calculated by using the 2−ΔΔCt method. The UBC gene serves as an internal reference gene. The results were visualized as log2-fold changes. (B) Relative expression of nine ApCOLs in response to salt stress. The histogram was presented by the mean and standard error of the data. Lowercase letters “a, b, c, d” indicate a significant level of 0.05, and different letters indicate significant differences between groups (p < 0.05). NaCl-50-5/NaCl-50-10: A. paniculata treated with 50 mM NaCl for 5 and 10 days; NaCl-100-5/NaCl-100-10: A. paniculata treated with 100 mM NaCl for 5 and 10 days.
Ijms 26 00724 g009aIjms 26 00724 g009b
Figure 10. Subcellular localization of the ApCOL08 and ApCOL09 proteins in A. paniculata.
Ijms 26 00724 g010
Figure 11. Comparison of growth between INVSc1 (pYES2-ApCOL08) and INVSc1 (pYES2) under treatment with six concentrations of NaCl (0 M, 0.5 M, 1 M, 1.3 M, 1.5 M, 2 M). Photos were taken after incubating at 30 °C for 4 d and 7 d, respectively.
Ijms 26 00724 g011
Table 1. Detailed information of nine COL proteins identified in Andrographis paniculata.
NameGene IDChromosomeStrandGene Length (bp)ProteinPredicted Subcellular Localization
Length (aa)MW (kDa)pI
ApCOL01CXN00019358Chr1+132726439.137445.5Nucleus
ApCOL02CXN00016323Chr1+222824743.255755.1Chloroplast
ApCOL03CXN00002171Chr2+506732635.318665.84Nucleus
ApCOL04CXN00012269Chr2417326046.361846.24Nucleus
ApCOL05CXN00007803Chr2+405320447.512745.1Nucleus
ApCOL06CXN00005866Chr13135535236.455495.2Nucleus
ApCOL07CXN00017383Chr15121220741.874286.81Chloroplast
ApCOL08CXN00004299Chr19153621148.410065.42Nucleus
ApCOL09CXN00005183Chr21+162523840.984865.95Nucleus
MW, molecular weight; pI, isoelectric point.
Disclaimer/Publisher’s Note: The statements, opinions and data contained in all publications are solely those of the individual author(s) and contributor(s) and not of MDPI and/or the editor(s). MDPI and/or the editor(s) disclaim responsibility for any injury to people or property resulting from any ideas, methods, instructions or products referred to in the content.