Article

CG-Based Stratification of 8-mers Highlights Functional Roles and Phylogenetic Divergence Markers

1
School of Life Science and Technology, Inner Mongolia University of Science and Technology, Baotou 014020, China
2
Inner Mongolia Key Laboratory of Life Health and Bioinformatics, Inner Mongolia University of Science and Technology, Baotou 014020, China
3
School of Economics and Management, Inner Mongolia University of Science and Technology, Baotou 014020, China
4
Department of Immunochemistry, Institution of Chemical Engineering, Ural Federal University, Yekaterinburg 620075, Russia
5
Laboratory for Brain and Neurocognitive Development, Ural Federal University, Yekaterinburg 620075, Russia
*
Authors to whom correspondence should be addressed.
Int. J. Mol. Sci. 2025, 26(19), 9477; https://doi.org/10.3390/ijms26199477 (registering DOI)
Submission received: 27 May 2025 / Revised: 17 September 2025 / Accepted: 20 September 2025 / Published: 27 September 2025
(This article belongs to the Special Issue Statistical Approaches to Omics Data: Searching for Biological Truth)

Abstract

K-mer analysis is a powerful tool for understanding genome structure and evolution. A “k-mer” refers to a short DNA sequence made up of k nucleotides (where k is a specific integer), while an “m-mer” is a similar concept but with a shorter sequence length. The functional mechanisms of CG-containing k-mers, as well as their potential role in evolutionary processes, remain unclear. To explore this issue, we analyzed 8-mers in several species with varying genomic complexities and evolutionary divergences: Homo sapiens, Saccharomyces cerevisiae, Bombyx mori, Ciona intestinalis, Danio rerio, and Caenorhabditis elegans, which were grouped by CG dinucleotide content (0CG, 1CG, and 2CG). We examined the relative frequencies of shorter m-mers (with m = 3 and 4) within each CG-defined group, using information-theoretic, distance-based, and angular metrics. Our results show that 0CG motifs follow random patterns, while 1CG and 2CG motifs display significant deviations, likely due to functional constraints such as nucleosome-binding and CpG island association. The observed unimodal distribution of 8-mers arises from the convergence of the three CG-defined groups. Among them, the 2CG group shows the highest divergence in m-mer composition, followed by 1CG, reflecting varying degrees of selective pressure. Furthermore, species-specific differences in CG-classified 8-mer patterns could provide valuable insights into phylogenetic relationships. Through extensive comparison, we explore how CG content and sequence composition influence genomic organization and contribute to evolutionary divergence across different taxa. These findings deepen our understanding of short motif functions, genome organization, and sequence evolution.

1. Introduction

DNA sequences serve as the fundamental carriers of genetic information, involved in gene expression, regulation, protein modulation, and the selection of transcription and replication start sites [1,2,3,4,5]. A k-mer, defined as a nucleotide sequence of length k, offers a powerful way to decode the “language” of DNA. By sliding a window of k bases along a genome, researchers can capture the functional and structural characteristics embedded in local motifs [6,7,8,9]. Prior to large-scale sequencing, studies of k-mer distributions focused on probabilistic modeling [10]. For example, Bultrini et al. used the principal component analysis of pentanucleotide frequency distributions to reveal typical intronic vocabulary preferences in Caenorhabditis elegans and Drosophila melanogaster [11]. Although k-mers themselves are not inherently functional, their usage patterns reflect biochemical biases, mutational pressures, and evolutionary selection, offering valuable insights into genome function and evolution. Some k-mers have been linked to protein-binding affinities [12,13], nucleosome formation [14,15], and conserved distributions in untranslated regions (UTRs) [16].
Despite the increasing availability of genome data, research on k-mers with k ≥ 3 has largely concentrated on extremely rare or frequent k-mers [17,18,19,20,21]. Notably, the concept of “nullomers”—k-mers absent from genomes—has been explored across >1500 species, with potential applications proposed by Hampikian and Andersen [22]. The availability of complete genome sequences has enabled comparative analyses of k-mer distributions across species and genomic regions. Reinert et al. first formalized the concept of k-mer distribution, noting that most k-mers follow a normal distribution, while a minority conform to a Poisson distribution [23]. Chor et al. extended this work, analyzing 4 ≤ k ≤ 13 k-mers across more than 100 organisms and identifying both unimodal and multimodal patterns. For example, 8-mer distributions were typically unimodal in non-mammalian species such as zebrafish, while species like chickens and frogs showed multimodal patterns [24]. Such variation is observed not only across species but also within different functional regions of the same genome. For instance, 8-mer distributions tend to be unimodal in prokaryotes [25,26], but multimodal in humans and mice [27]. Similar trends have been reported for 6-mers, with multimodal distributions observed in mammals and chickens, but not in non-mammalian species or Arabidopsis thaliana [28]. In mammals, multimodal k-mer distributions correlate with specific G + C content ranges and CpG suppression [29,30], although exceptions exist—for example, Entamoeba shows CpG suppression without multimodality [31]. Stacey et al. found that CpG suppression contributes to multimodal 8-mer spectra in mammals, whereas bacterial genomes remain unimodal [27]. While numerous studies have explored the causes of unimodal and multimodal k-mer distributions, the true underlying mechanisms remain unclear.
Jia et al. attributed the human genome’s trimodal 8-mer distribution to three distinct groups of CG-content-defined k-mers: CG0 (no CG), CG1 (one CG), and CG2 (two or more CGs), a phenomenon termed the “Law of Independent Selection”. CG1 motifs are implicated in nucleosome positioning, while CG2 motifs form core units of CpG islands [32,33]. Rare k-mers also show strong associations with promoters and CpG islands and can be predicted using methods like rare-word clustering (RWC) [34]. In addition, periodic distributions of CG, GG, CC, and GC dinucleotides have been identified as nucleosome positioning signals [35,36]. Experimental studies confirm that CC, CG, GC, and GG dinucleotides are enriched near nucleosome centers, while AT-rich motifs are often nucleosome-repelling [13,37,38]. Nyamdavaa et al. developed a nucleosome feature index based on 15 preferred or rare trinucleotides from CG1-containing 8-mers, which aligned well with nucleosome occupancy profiles around human transcription start sites [39]. Therefore, studying the nucleotide frequencies of shorter m-mers (m = 3, m = 4) within 8-mers could provide valuable insights into the functional roles of motifs.
Yeast (Saccharomyces cerevisiae) is a single-celled organism, and its simpler regulatory landscape and conserved chromatin structure make it an ideal model for large-scale k-mer analysis [13]. In particular, its use is especially valuable for investigating the functional roles of k-mers containing CpG dinucleotides. Caenorhabditis elegans (C. elegans) is an invertebrate and multicellular organism. As a relatively simple model organism, it has a unique but functionally significant nervous system, which provides valuable biological insights when compared to more complex organisms. Ciona intestinalis (sea squirt), although a chordate and “distant cousin” of vertebrates, lacks the key structure of a vertebral column. This makes it a meaningful species for k-mer comparison studies, as it provides insights into genomic evolution without the complexity of a vertebral structure. The silkworm (Bombyx mori) is also an invertebrate but exhibits greater anatomical complexity than simpler invertebrates due to its complete metamorphosis. This increased complexity makes it relevant for comparative analysis, particularly in studying developmental processes that differ from those in other organisms. The zebrafish (Danio rerio) genome sequencing project is one of the three major goals of the Genome Reference Consortium (GRC) [40]. In recent years, zebrafish has become a popular model for vertebrate development and human genetic disease research. Compared to other vertebrates, zebrafish has over 6000 genetic mutations, which is one of its most notable advantages. This provides a unique opportunity for genetic research, offering additional directions and content for scientific investigation [41]. By comparing the distribution distances of 0CG, 1CG, and 2CG subset motifs in the 8-mer relative motif distribution data across the genomes of Saccharomyces cerevisiae, Danio rerio, Caenorhabditis elegans, Bombyx mori, and Ciona intestinalis, we may gain valuable insights into the evolutionary divergence and functional roles of CG-containing motifs in different species.
In this study, we first analyzed the trimodal 8-mer distribution of human chromosome 1 and the unimodal distribution across the Saccharomyces cerevisiae genome, exploring the potential functions of CG0, CG1, and CG2-defined sequence groups. To uncover the sequence determinants underlying the unimodal 8-mer distribution observed in Saccharomyces cerevisiae, we applied New Symmetric Relative Entropy (NSRE), distance difference, and angle deviation metrics to assess the usage of 3-mers and 4-mers within each CG-defined 8-mer group. Furthermore, we calculated the peak distances between CG0, CG1, and CG2 subsets across Saccharomyces cerevisiae, Bombyx mori, Ciona intestinalis, Danio rerio, and Caenorhabditis elegans, in order to test the association between CG-based classification and evolutionary divergence among species with unimodal distribution patterns. Our analysis reveals differences in CG-content distribution across these species, providing insights into their unique genomic structures and functional constraints. This study underscores the importance of species diversity in understanding the evolutionary significance of k-mers and their potential role in genome organization.

2. Results

2.1. 8-mer Distribution in Human Chromosome 1

The genome assembly versions, total sequence lengths, and chromosome counts for these species are summarized in Table 1. Chor et al. reported that the trimodal distribution of k-mer spectra (for k = 4 to 13) becomes increasingly stable when k ≥ 6. They found that 6-mer spectra exhibit a unimodal pattern in bacteria, non-mammalian species, and Arabidopsis thaliana, but are multimodal in the genomes of human, mouse, and chicken [24]. In our study, we selected k = 8. This choice is based on Benny Chor’s recommendation to use the smallest k value satisfying the equation k = 0.7 log4 L, where L is the length of the DNA sequence. For the shortest protein-coding sequences in the human genome, the resulting minimum k value is approximately 8.9. To reduce local noise and visualize the overall trend of 8-mer frequency distributions, we applied a moving average smoothing with a window size of k = 10 using the rollmean function from the zoo R package (version 1.8.12).
As shown in Figure 1A, the x axis represents the 8-mer appearance from smallest to largest, and the y axis represents the relative motif count of the 8-mers, which is the frequency of appearance (FA) calculated using Formula (1). As a result, we obtained the FA distribution of 8-mers in the human chromosome 1 sequences, which showed a distinct trimodal distribution pattern (Figure 1A). For clearer visualization, the x axis of the distribution plot was transformed into a logarithmic scale (Figure 1B). The three peaks, labeled as Peak1, Peak2, and Peak3 from left to right, each contained a significant number of instances, with their central frequency ratios approximately being 50:307:3602. To investigate further, we generated a random sequence with the same length and CG content as the chromosome 1 sequence and plotted the relative frequency distributions of 8-mers for both the chromosome 1 and random sequences. Upon comparison, we observed that the random sequence (red) corresponded to Peak3, whereas the centers of Peak1 and Peak2 were significantly separated from that of the random sequence (Figure 1C). The complete set of 8-mers (which contains 48 = 65,536 unique sequences) was divided into three subsets based on the number of 16 types of dinucleotides they contain—specifically, 0XY, 1XY, and 2XY—where X and Y represent the four nucleotide bases: A, C, G, and T. The 0XY subset includes 8-mer motifs that do not contain a specific dinucleotide; the 1XY subset includes motifs that contain exactly one occurrence of that dinucleotide; and the 2XY subset includes motifs with two or more occurrences (Figure 1D). The number of 8-mers in the three XY subsets varies depending on whether X and Y are the same or different.
After dividing the total 8-mers into these three subsets, we obtained the frequency distribution for each. We found that only the 8-mer distribution categorized by the CG dinucleotide formed independent peaks that were mutually exclusive and well-separated. We refer to this pattern as the independent distribution, as shown in Figure 1E. In contrast, for the other 15 dinucleotide categories, the 8-mer distributions formed overlapping peaks, which we defined as the non-independent distribution. For these non-independent distributions, only the motif distribution categorized by GC is presented, as the other 14 categories exhibited similar patterns (Figure 1F). We applied criteria based on GC content and the observed/expected ratio of CpG dinucleotides to identify and exclude CpG island sequences. First, the GC content of each sequence on human chromosome 1 was calculated, and sequences with a GC content below 50% were removed, as they do not exhibit typical CpG island features. Second, the observed/expected ratio of CpG dinucleotides was computed for each sequence. Sequences with a ratio below 0.6 were excluded, as their CpG density was not significantly higher than random expectation. Finally, additional filtering was performed based on sequence length and genomic location. We defined a sliding window approach with a window size of 1000 bp and a step size of 500 bp, and excluded short sequences located within gene bodies. The resulting 8-mer distribution after CpG island removal is shown in Figure 1G.
By comparing Figure 1H with Figure 1E, we observed a marked change in the distribution of 8-mers containing two CpG dinucleotides (2CG) after CpG island removal. These findings suggest that the usage of 8-mers with zero CpG dinucleotides (0CG) may reflect random evolutionary processes, whereas 2CG 8-mers represent core motifs contributing to CpG island formation.

2.2. Distribution of 8-mer Frequency of Appearance in Yeast

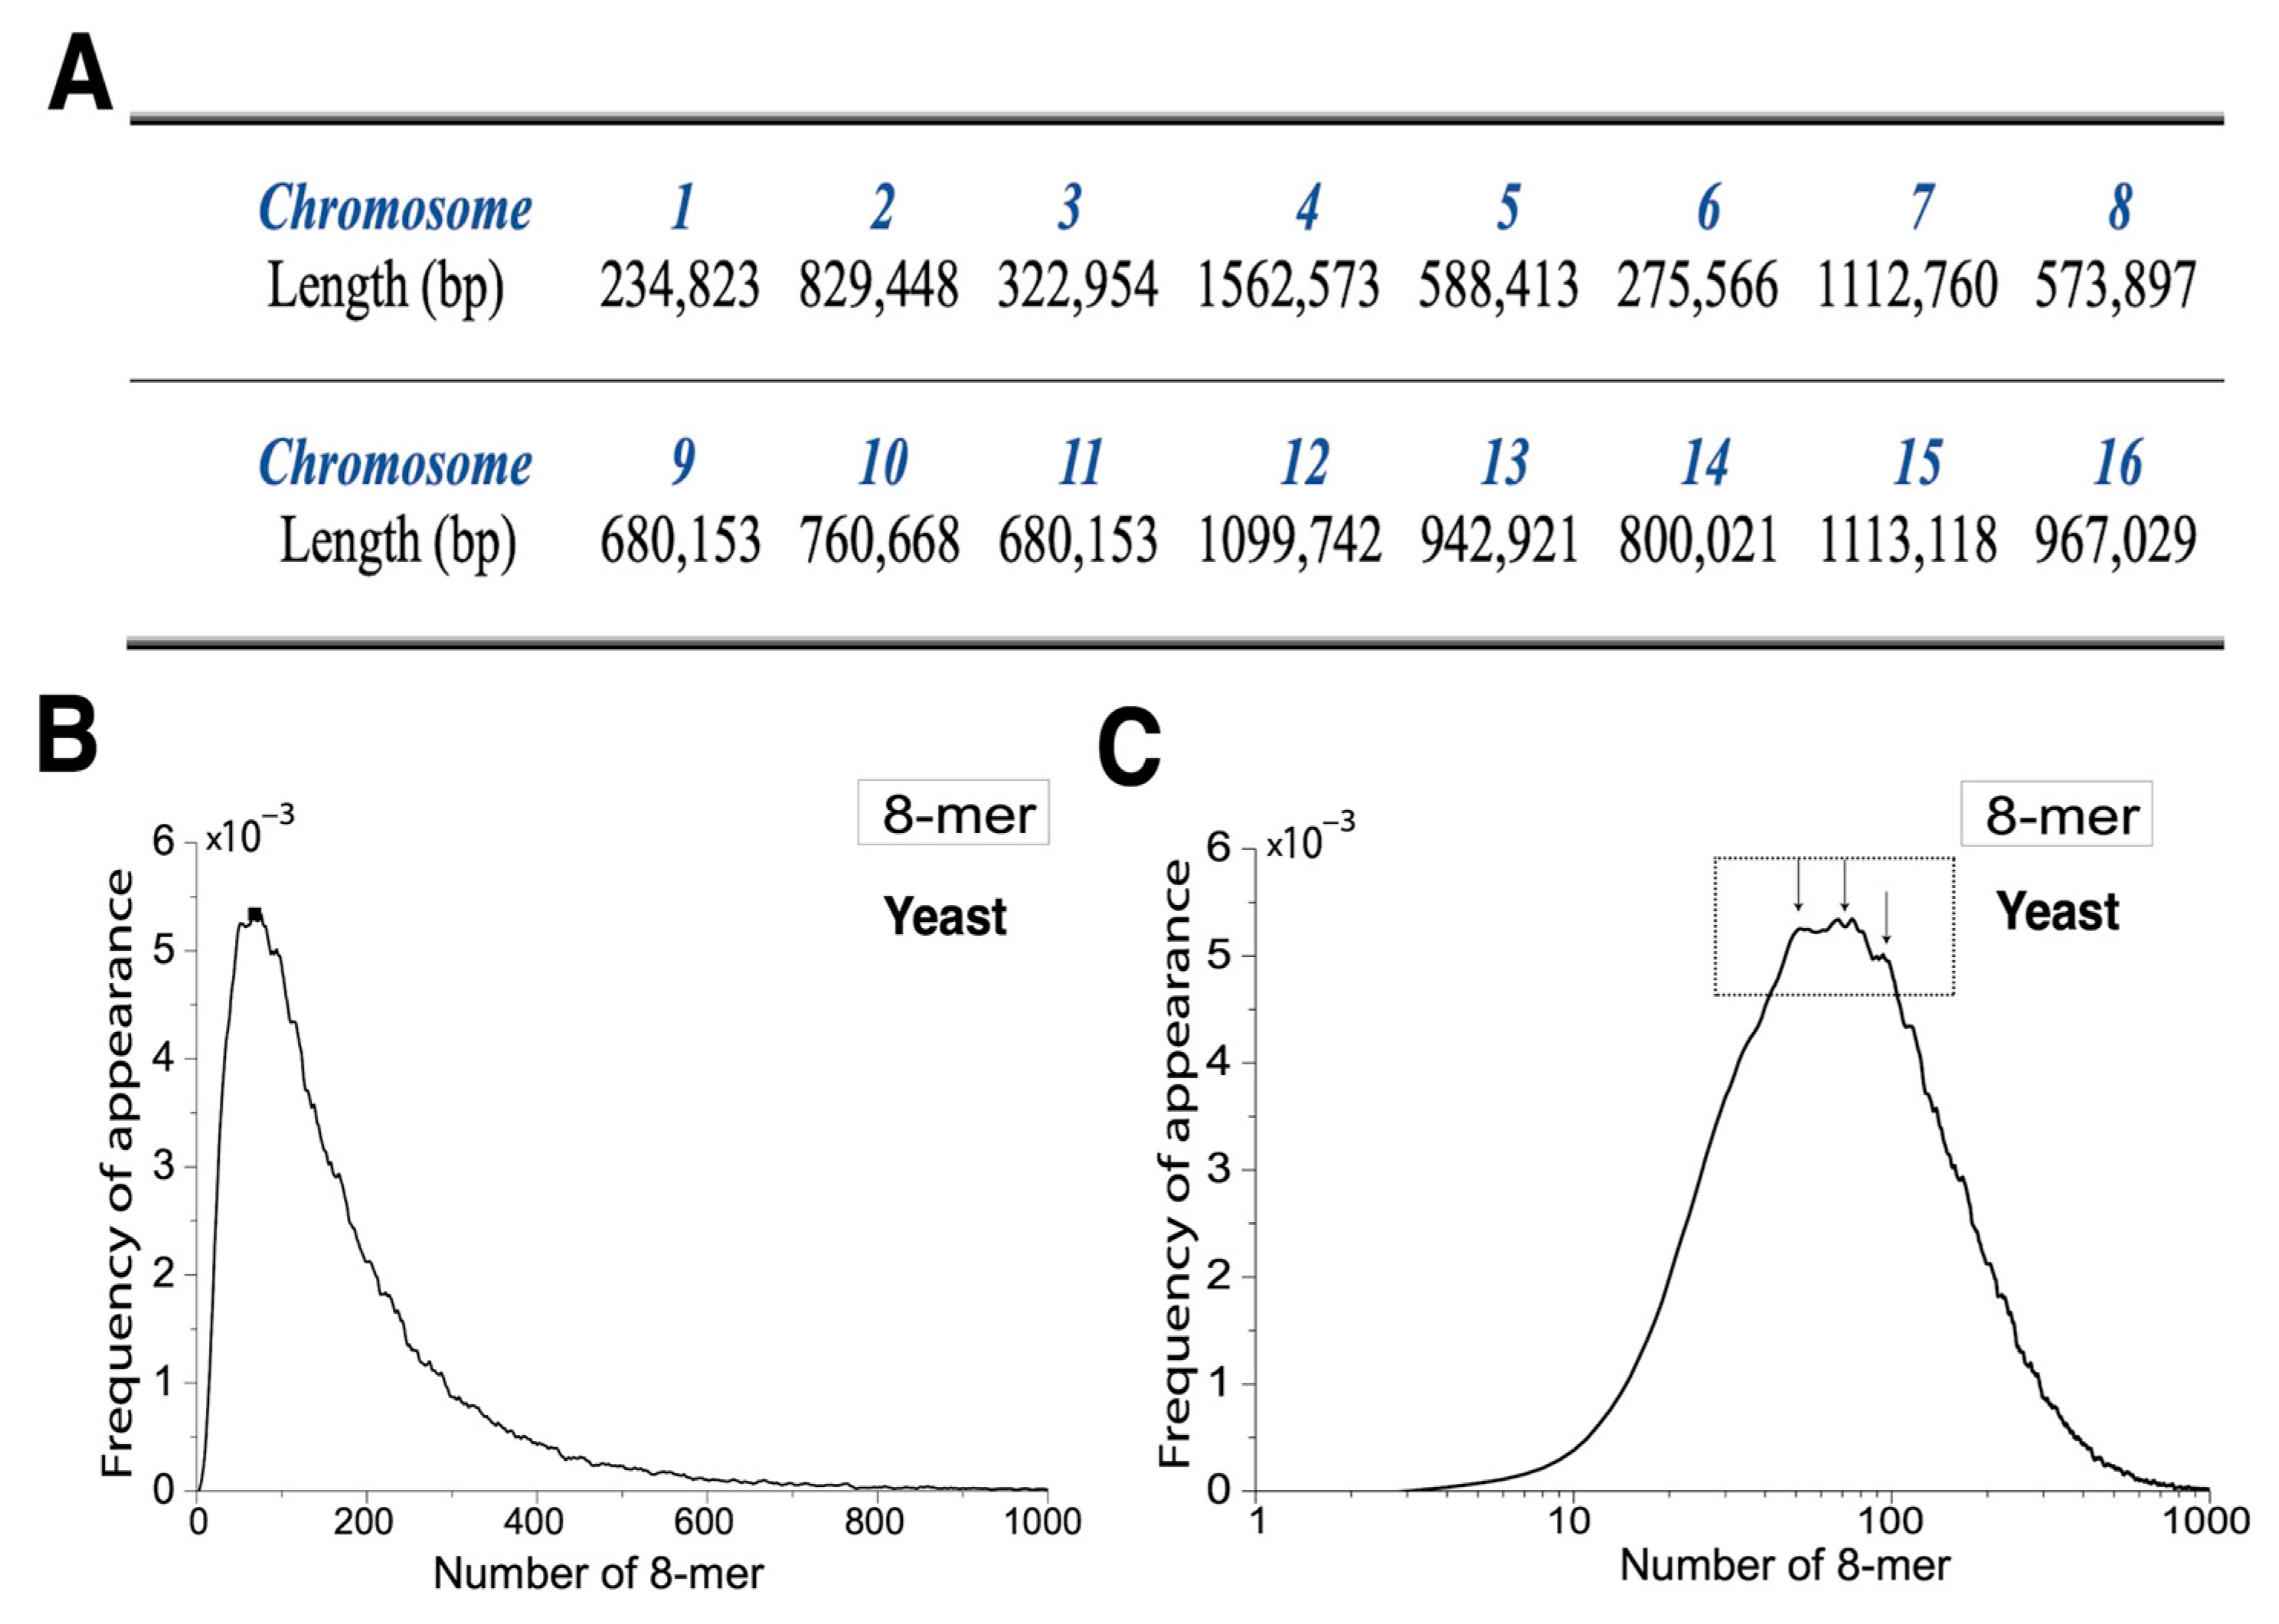
The lengths of the 16 yeast chromosomes are shown in Figure 2A. To better illustrate the distribution pattern, we set the bin size to 1 and defined the x axis range from 1 to 1000. After multiple rounds of smoothing, the final distribution was obtained. The FA distribution of yeast 8-mers approximates a Poisson distribution and is positively skewed, indicating that the influence of low-frequency 8-mers (on the left side) is significantly greater than that of high-frequency 8-mers (on the right), resulting in an asymmetric pattern (Figure 2B). To enhance peak visibility, we applied a base-10 logarithmic transformation to the x axis. Upon closer inspection, the peak regions displayed a distinct sawtooth-like pattern (Figure 2C). Due to positive skewness, the slope on the left side is much steeper than that on the right, reflecting a much higher number of 8-mers with a lower occurrence than those with high frequency. To further investigate this trend, we extracted the least and most frequent 8-mers from the distribution (Table S1). The results revealed that 8-mer appearance counts were discontinuous: the least frequent 8-mers were predominantly rich in C and G bases, whereas the most frequent ones were primarily composed of A and T bases.

2.3. The 8-mer Distribution of Yeast Based on the XY Dinucleotide Classification

A total of 65,536 8-mers were first grouped into three subsets—0XY, 1XY, and 2XY—based on the number of occurrences of the 16 possible dinucleotides they contained. Using Formula (1), we calculated the FA distributions for each of the 16 subsets. The peak value of the FA distribution for the 0XY subset was denoted as FA0(p), with the corresponding appearance value denoted as N0(p). Similarly, FA1(p) and N1(p) represented the peak FA and the corresponding appearance for the 1XY subset, and FA2(p) and N2(p) for the 2XY subset. Overall, the 16 distribution plots could be broadly classified into three distinct categories based on their distributional patterns.
Figure 3A presents the 8-mer distributions based on the CG, GC, CC, and GG dinucleotide classifications. In all four cases, we observed that N2(p) < N1(p) < N0(p), indicating that the 2XY and 1XY subsets are left-shifted relative to the 0XY subset. For the GC, GG, and CC classifications, the distributions followed the pattern FA2(p) < FA1(p) < FA0(p), whereas in the CG classification, the pattern was FA2(p) < FA0(p) < FA1(p). This suggests that only the 1CG distribution exhibits a higher peak FA than both the 0CG and 2CG distributions, which is consistent with the pattern observed in human 8-mer distributions. Additionally, the 2CG distribution showed a higher peak FA than other 2XY distributions.
Figure 3B shows the 8-mer distributions for the AA, AT, TA, and TT dinucleotide classifications. In these cases, N0(p) < N1(p) < N2(p), indicating that the 1XY and 2XY subsets are shifted to the right relative to the 0XY subset. The distributions also followed the pattern FA2(p) < FA1(p) < FA0(p), with markedly lower peak FA values for the 1XY and 2XY subsets. Figure 3C presents the distributions for the AC, AG, CA, CT, GA, GT, TC, and TG classifications. Here, N0(p) ≈ N1(p) ≈ N2(p), suggesting minimal positional shift among subsets. However, the peak FA values still followed the trend FA2(p) < FA1(p) < FA0(p), with 1XY and 2XY subsets showing substantially lower peaks than 0XY.

2.4. Comparison of m-mer Usage in 8-mers Classified by 0XY, 1XY, 2XY

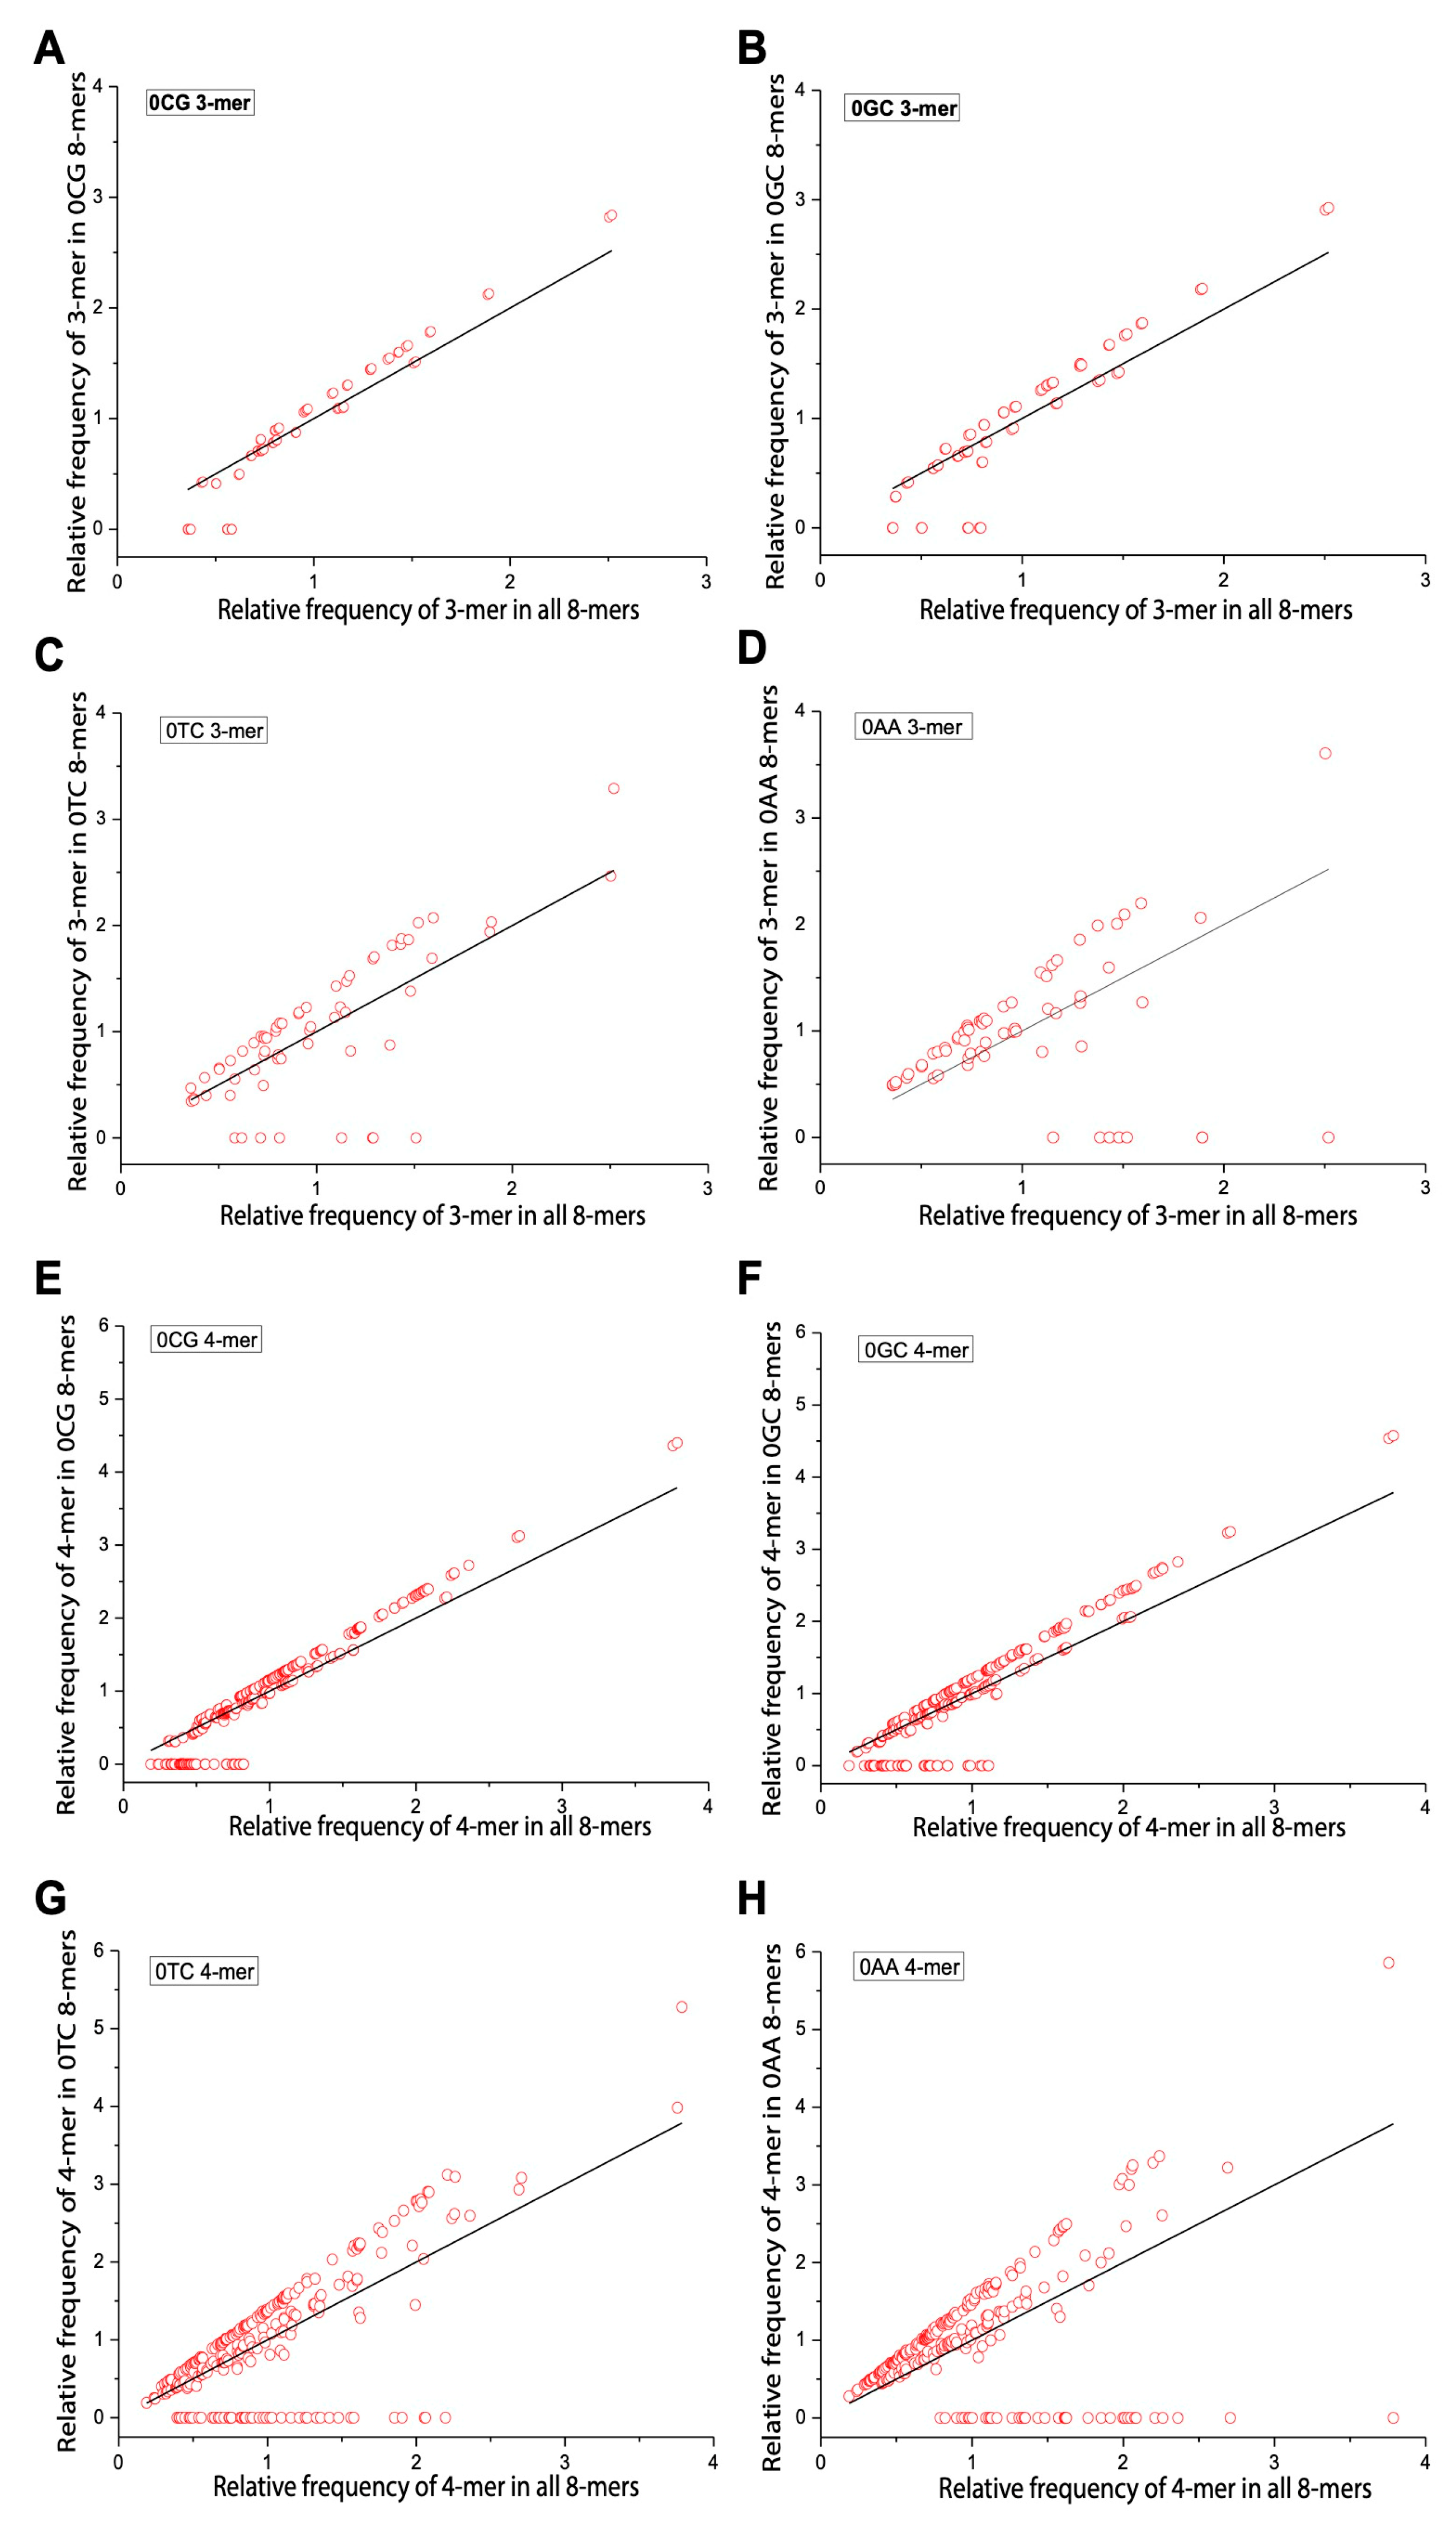
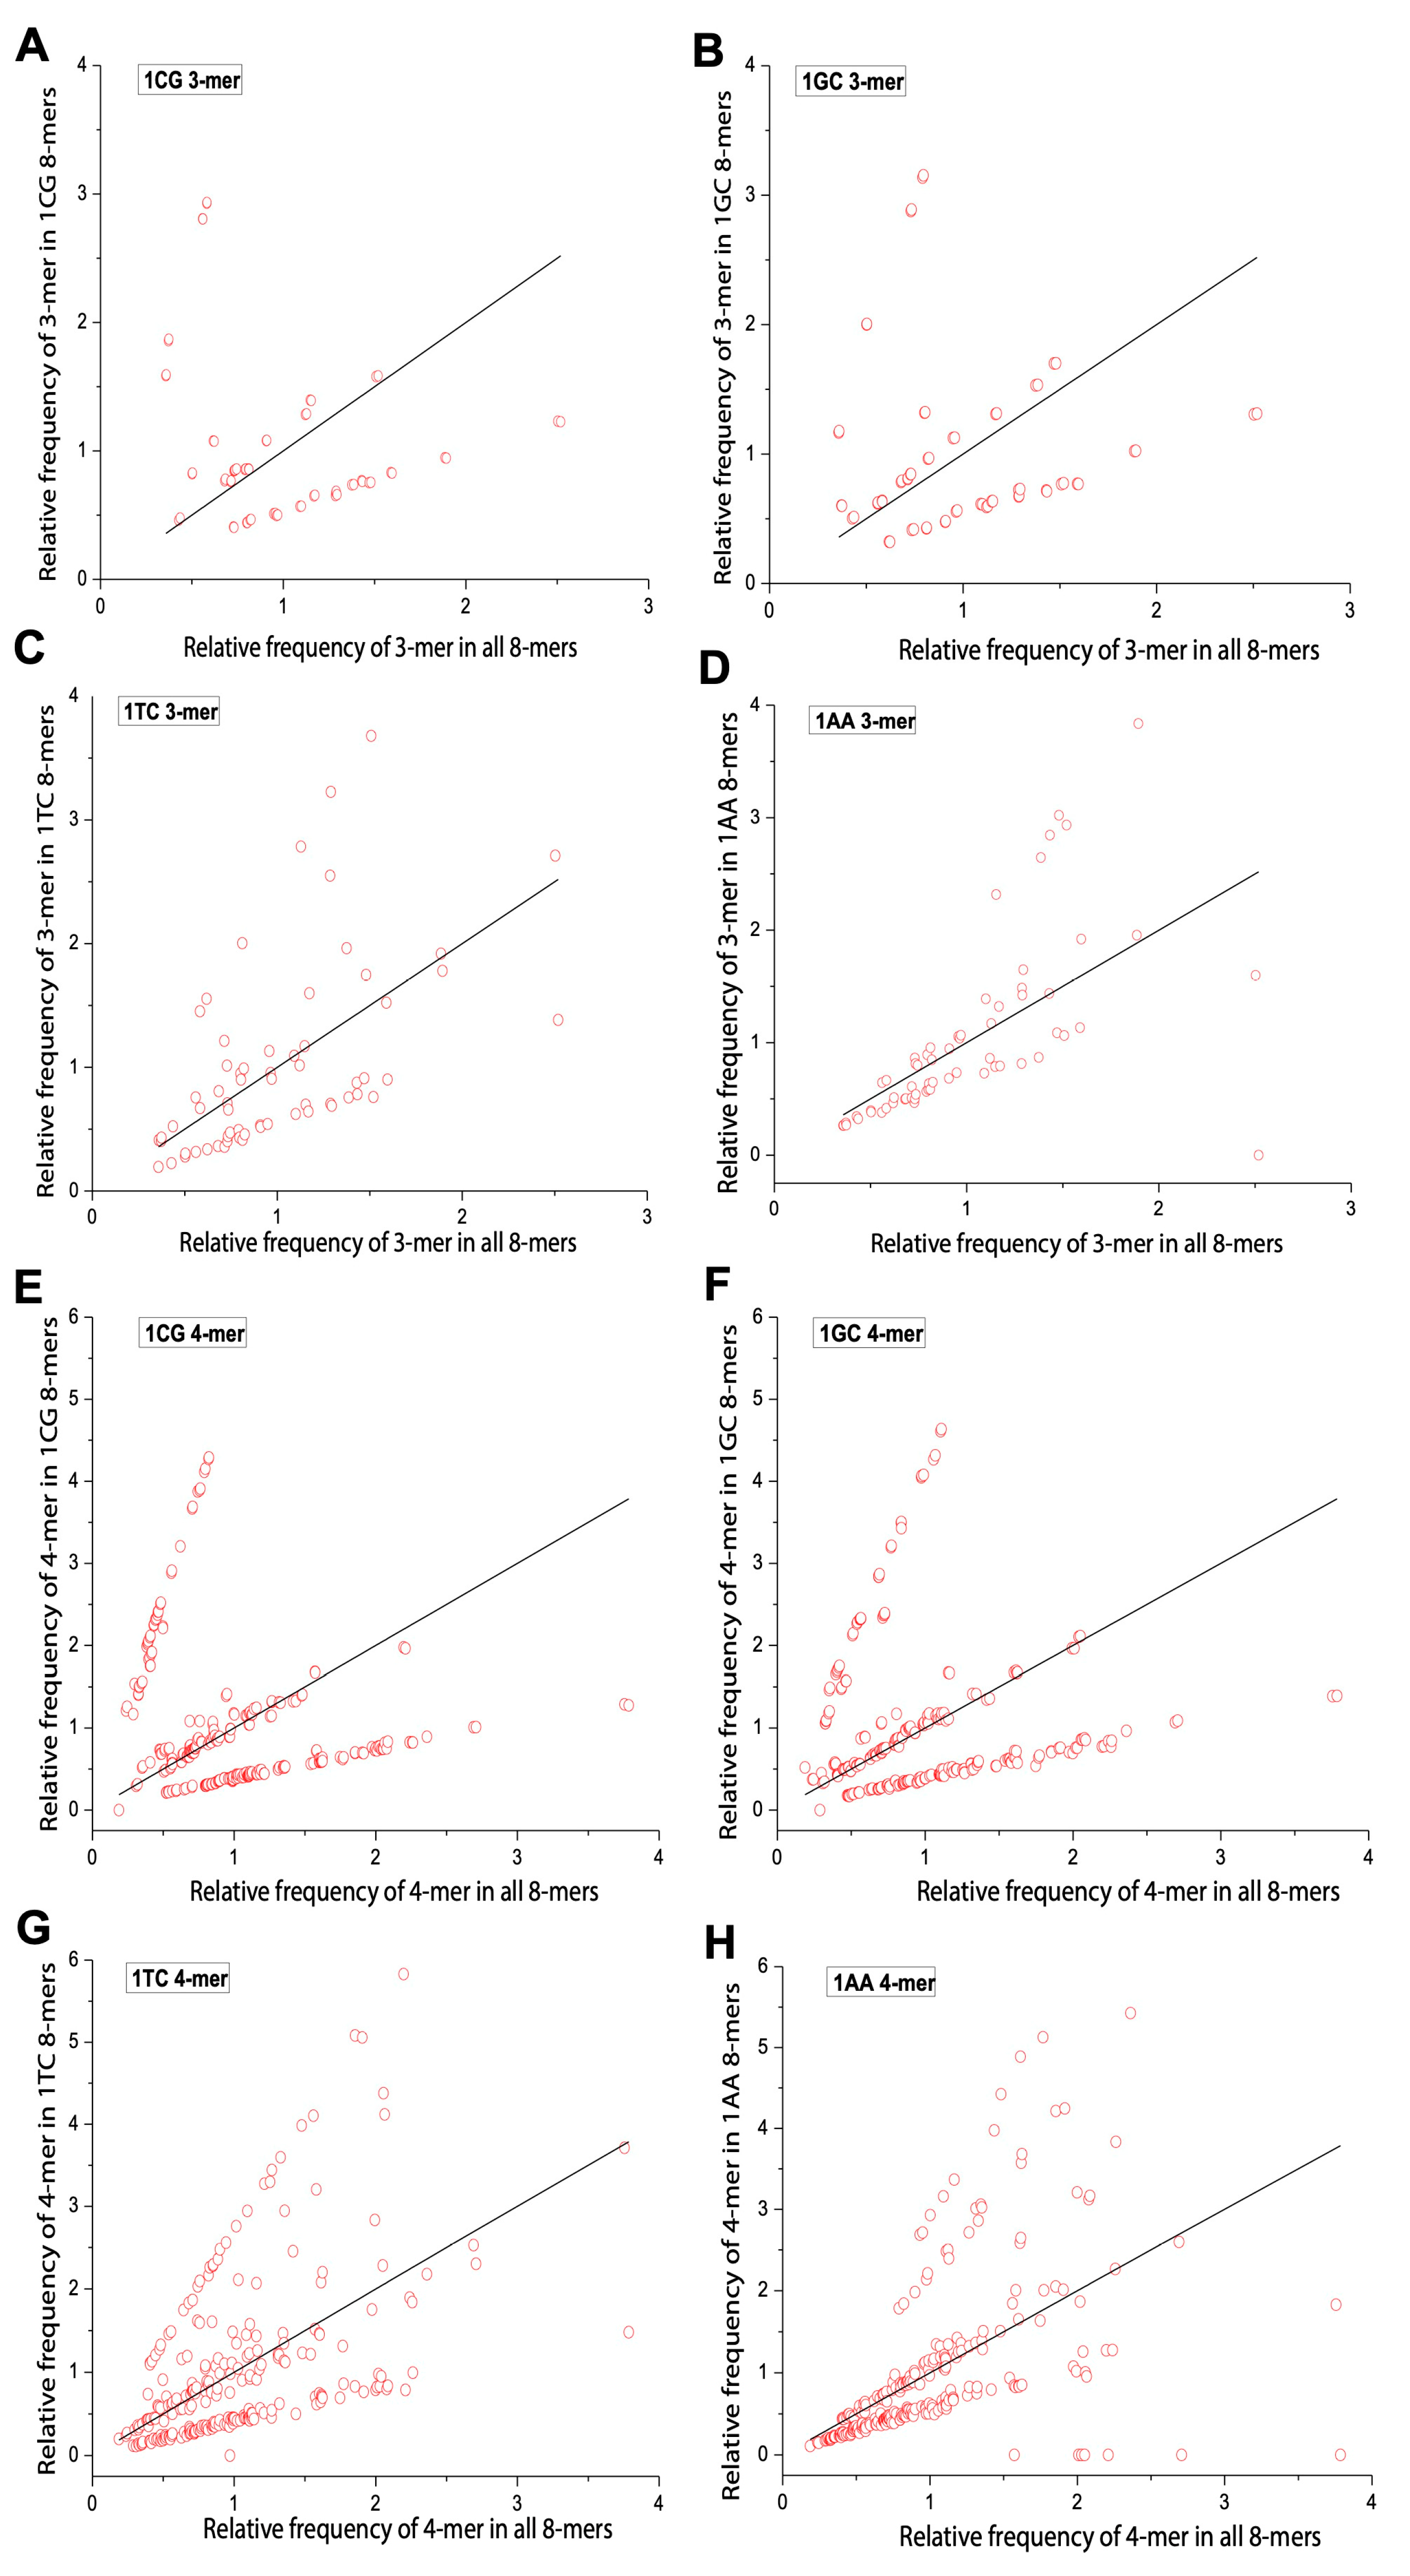
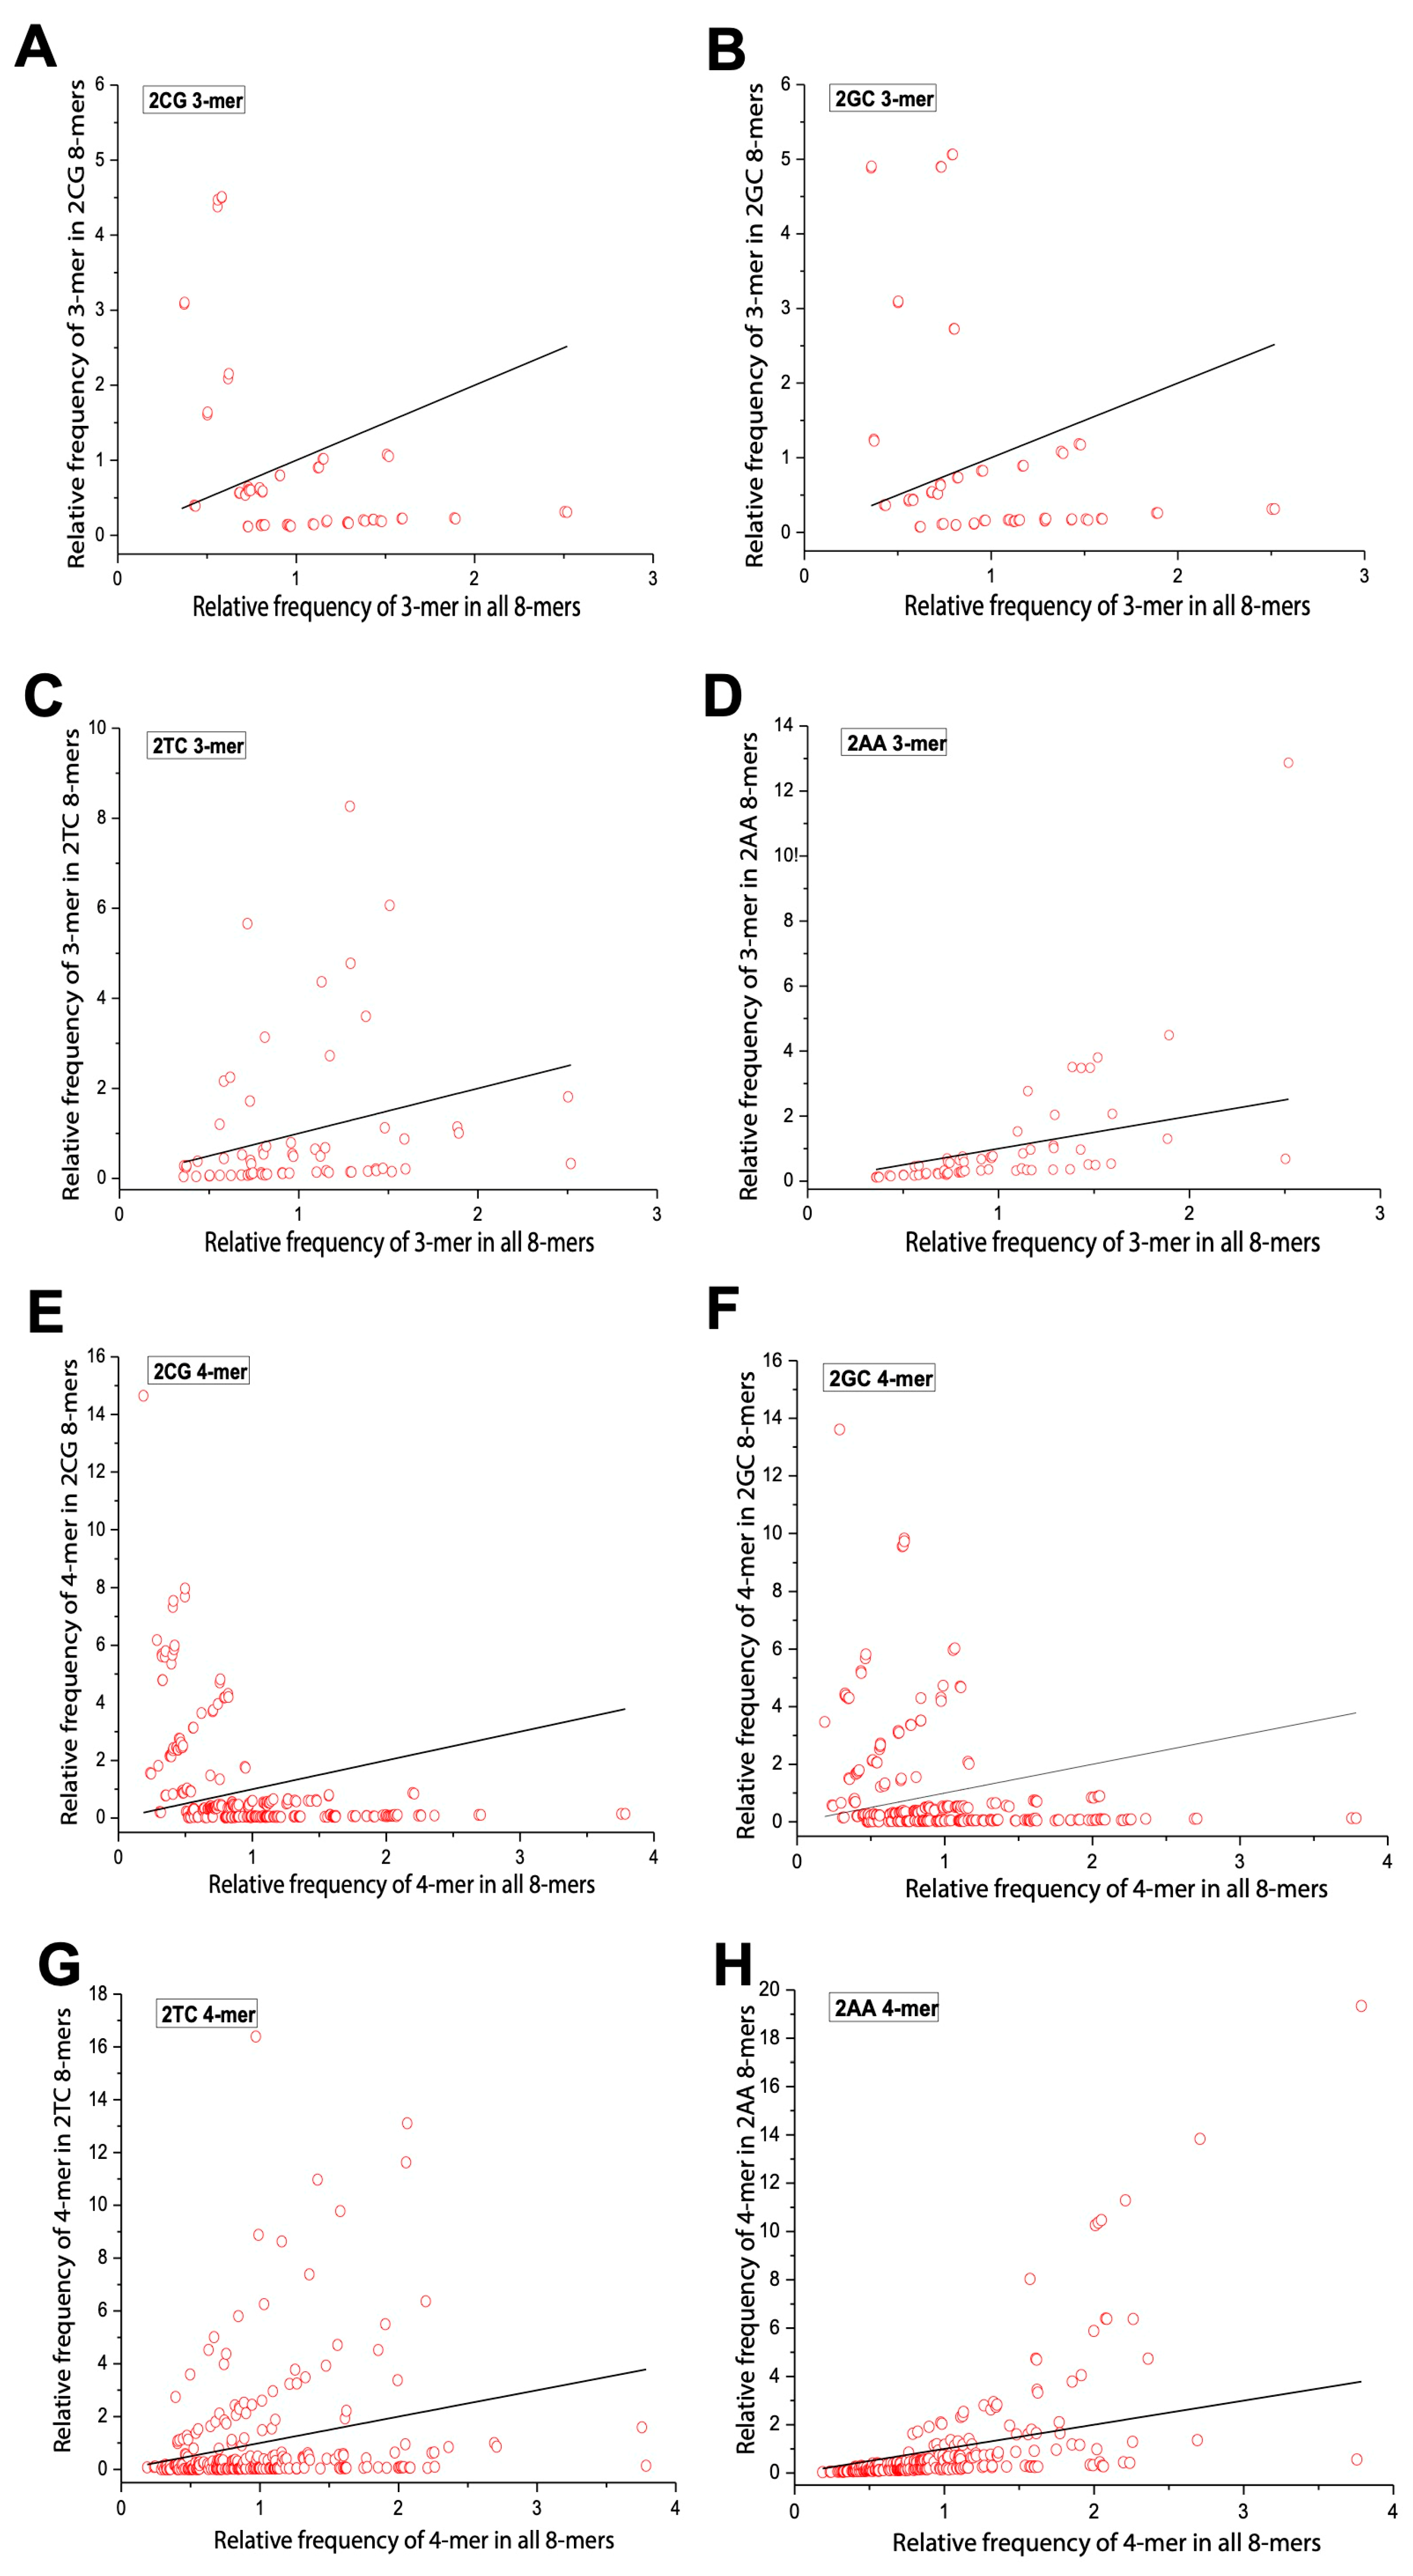
We applied Formula (2) to calculate the relative frequencies of 3-mers and 4-mers in the overall 8-mer set. Table 2 shows all 64 3-mers, while Table 3 presents the top 15 (optimal) and bottom 15 (rare) 4-mers. Low-frequency motifs were enriched in C/G, and high-frequency ones were enriched in A/T. We then compared the relative frequencies of m-mers (m = 3, 4) in yeast 0XY, 1XY, and 2XY subsets against the overall set. To illustrate m-mer usage separation, we selected CG and GC (small separation), AA (large separation), and TC (moderate separation) subsets. The x axis represents m-mer frequencies in the overall set, and the y axis shows their frequencies in each subset. Red circles denote m-mers, and deviation from the diagonal indicates separation. In 0XY subsets, most m-mers formed two clusters—one near the diagonal and one oblique. 0CG/0GC showed the least separation, and 0AA showed the most (Figure 4). In 1XY subsets, m-mers formed three clusters, with 1CG/1GC showing the largest separation and 1AA showing the smallest (Figure 5). In 2XY subsets, most m-mers clustered in the lower-left; 2CG/2GC exhibited the strongest deviations, and 2AA exhibited the weakest (Figure 6). Overall, m-mer usage separation increased from 0XY to 2XY, suggesting stronger directed evolution in 2XY.

2.5. Differences in m-mer Usage Based on NSRE

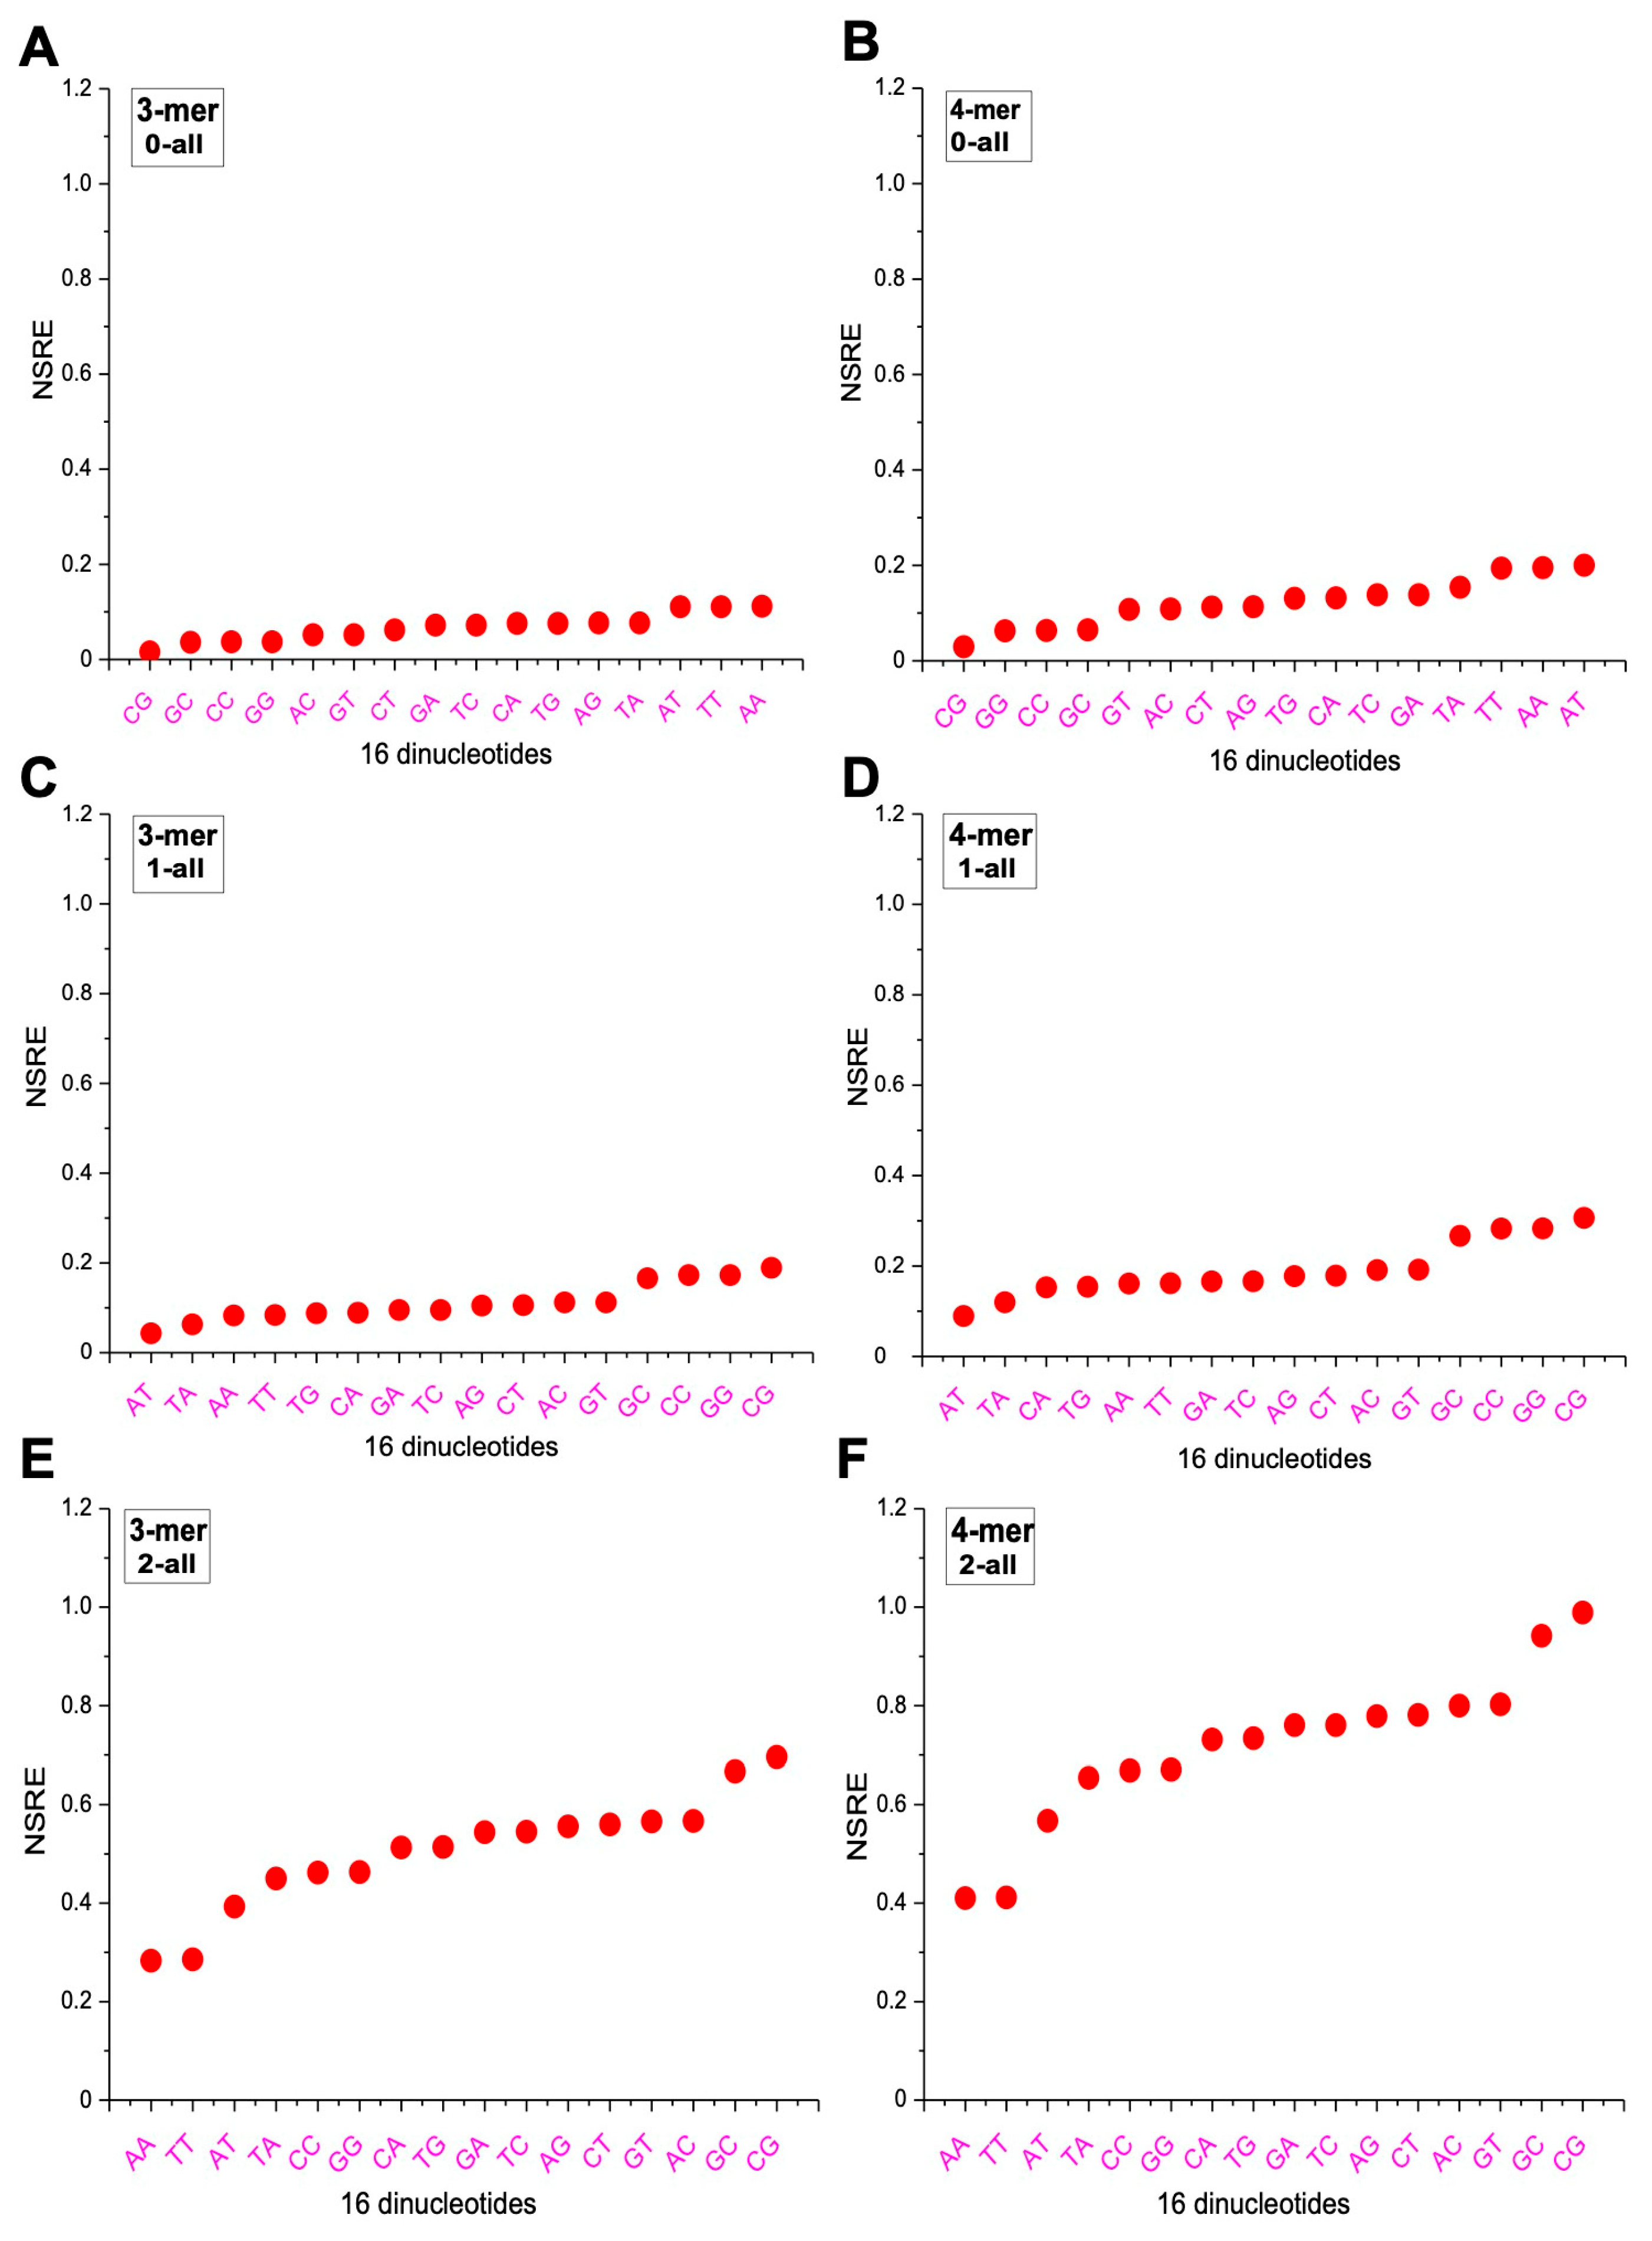
We adopted a previously defined metric, NSRE(P‖Q), to quantify the separation distance of 3-mers and 4-mers along the same angular direction. For m-mers located at the same angle, NSRE(P‖Q) increases with their distance from the origin. For example, if the frequency of AAA is 2 in the overall 8-mer set and 3 in a subset, while CCC has frequencies of 1 and 1.5, respectively, then the NSRE(P‖Q) value of AAA is twice that of CCC, reflecting a greater deviation. We calculated the NSRE(P‖Q) values for all 3-mers and 4-mers in the 0XY, 1XY, and 2XY subsets relative to the overall 8-mer set, and grouped the results into six categories (Figure 7). In the plots, the x axis represents the 16 dinucleotide categories, and the y axis shows the corresponding NSRE(P‖Q) values. In the 0XY subset, m-mers associated with the AA, TT, and AT categories had the highest NSRE(P‖Q) values, indicating the greatest deviation from the overall distribution, while those in the CG, GC, CC, and GG categories exhibited the lowest (Figure 7A,B). In the 1XY subset, the highest NSRE(P‖Q) values were observed for m-mers in the CG, GC, CC, and GG categories, while the AT and TA categories showed the lowest deviation (Figure 7C,D). In the 2XY subset, m-mers in the CG and GC categories displayed the largest deviations, whereas those in the AA and TT categories had the smallest (Figure 7E,F). Overall, the differences in NSRE(P‖Q) values were most pronounced in the 2XY subset, moderate in the 1XY subset, and least evident in the 0XY subset.

2.6. Characterization of m-mer Usage Bias Based on Distance Differences

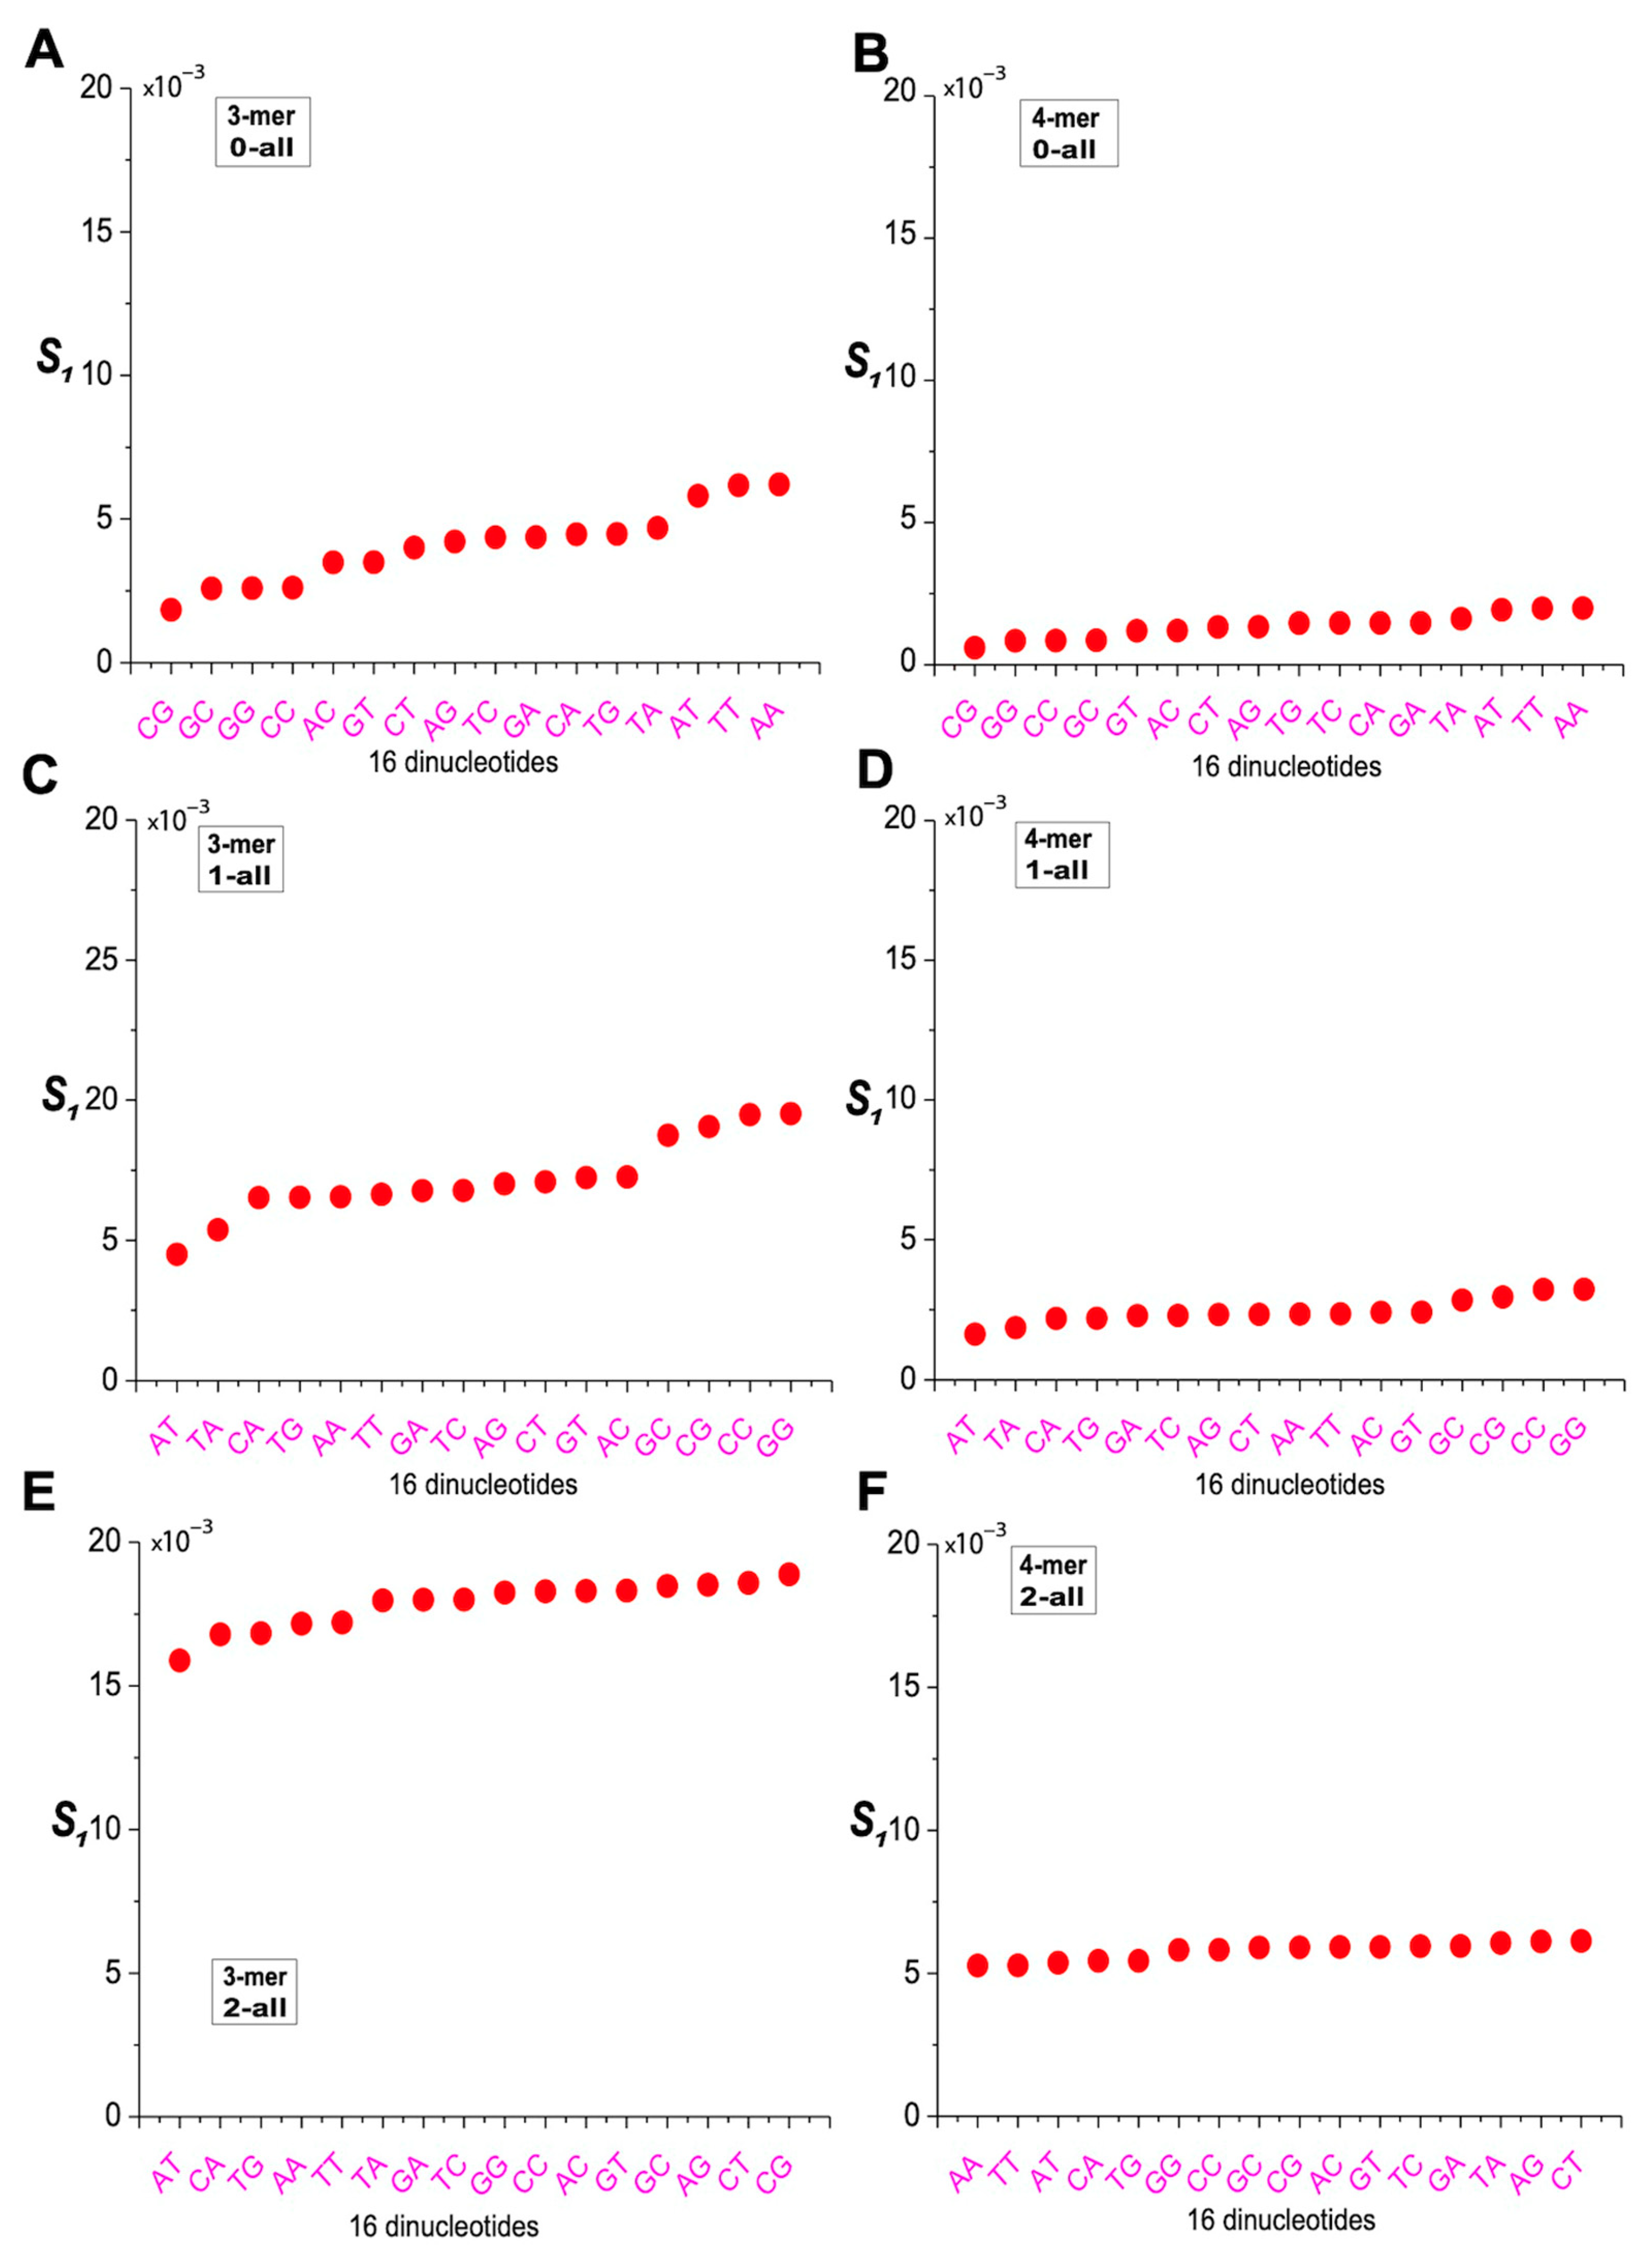
Compared to the overall 8-mer sequence, in the 0XY subset, m-mers from the AA, TT, and AT categories showed significantly higher S1 values, while those from the CG, GC, CC, and GG categories showed significantly lower values, indicating that 0AA-, 0TT-, and 0AT-containing 8-mers deviated the most and 0CG-, 0GC-, 0CC-, and 0GG-containing 8-mers deviated the least (Figure 8A,B). In the 1XY subset, m-mers from the CG, GC, CC, and GG categories had the highest S1 values, and those from the AT/TA categories had the lowest, suggesting that 1CG-, 1GC-, 1CC-, and 1GG-containing 8-mers deviated the most, while 1AT- and 1TA-containing 8-mers deviated the least (Figure 8C,D). In the 2XY subset, the S1 values of 3-mers and 4-mers formed an oblique line, indicating smaller differences across the 16 dinucleotide categories, with significant variation among subsets but no consistent pattern (Figure 8E,F). Overall, the 0XY subset exhibited the lowest S1 values, indicating the least deviation from the overall 8-mer sequence, whereas the 2XY subset showed the highest S1 values, reflecting the greatest deviation. The 1XY subset displayed intermediate S1 values between the two.

2.7. Characterization of m-mer Usage Bias Based on Angular Deviation

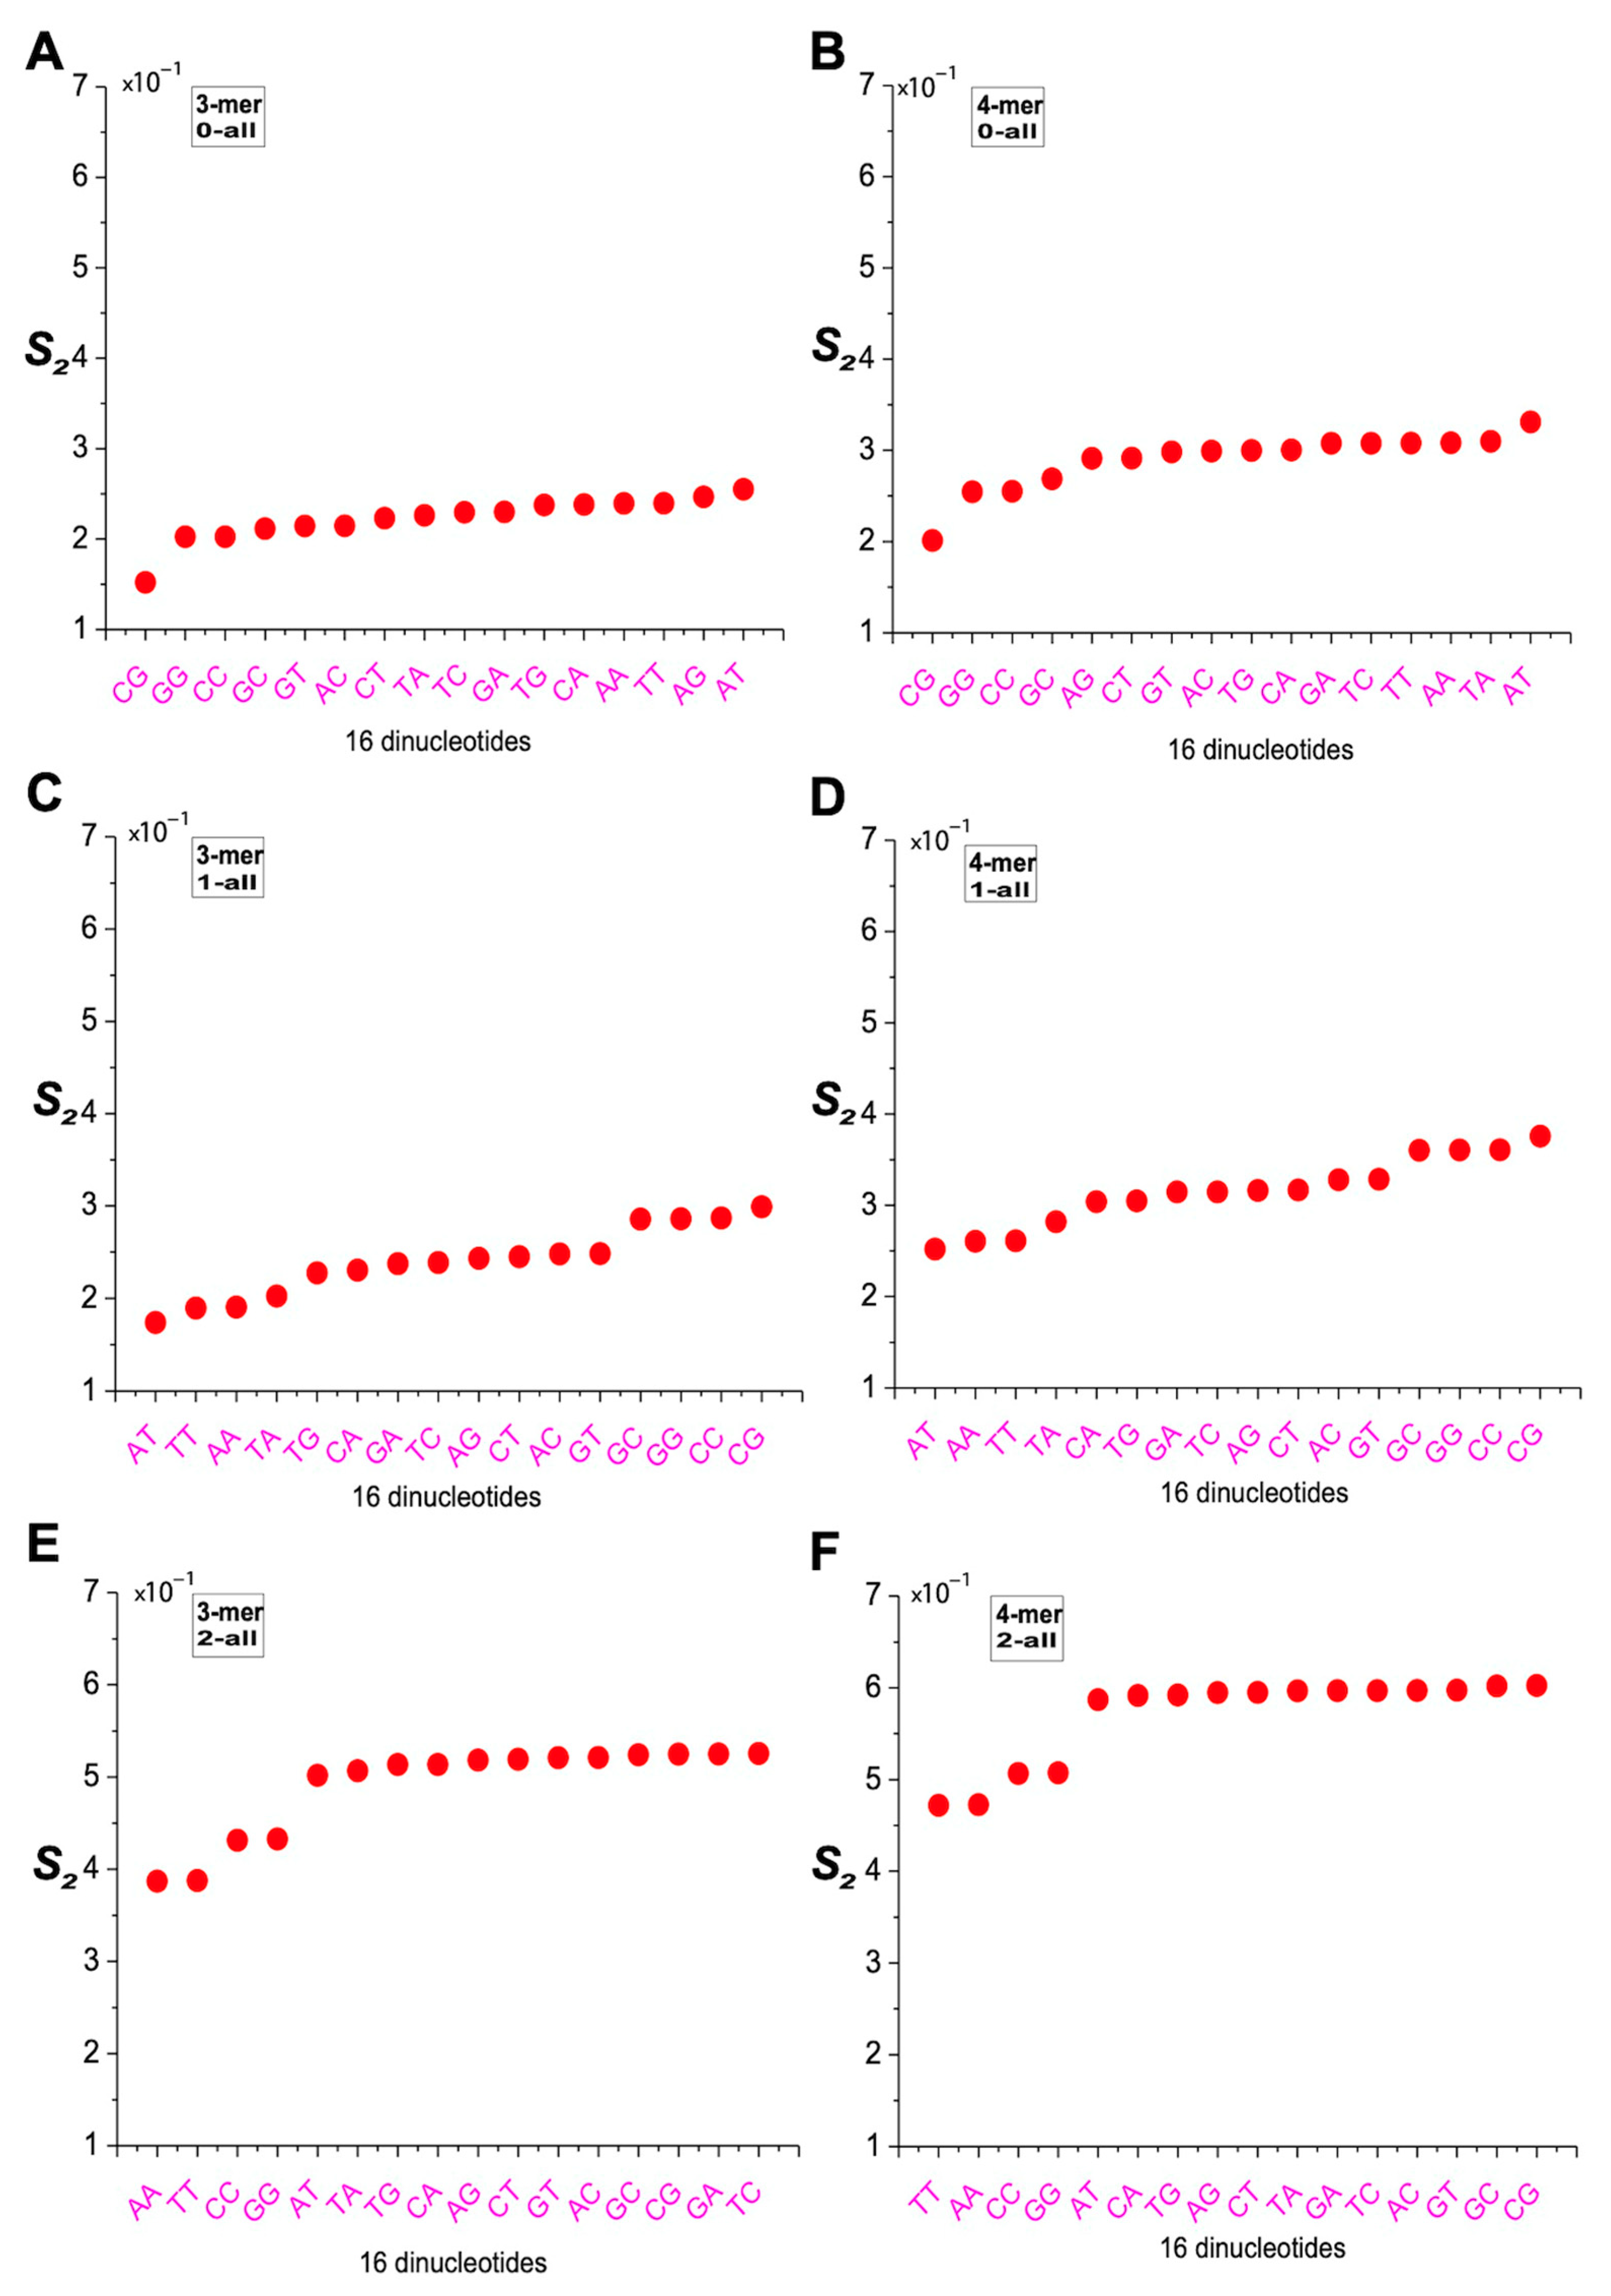
An analysis of m-mer usage differences based on angular deviations revealed that, in the 0XY subset, the S2 values for the AT category were significantly higher, while those for the CG, GC, CC, and GG categories were lower. This indicates that 8-mers containing 0AT deviated the most, whereas those containing 0CG, 0GC, 0CC, and 0GG deviated the least from the overall 8-mer sequence (Figure 9A,B). In the 1XY subset, the CG, GC, CC, and GG categories exhibited the highest S2 values, while the AT, TA, AA, and TT categories showed the lowest. These results suggest that 8-mers containing 1CG, 1GC, 1CC, and 1GG deviated the most, while those containing 1AT, 1TA, 1AA, and 1TT deviated the least (Figure 9C,D). In the 2XY subset, except for the AA, TT, CC, and GG categories—which had lower S2 values—the 12 remaining dinucleotide categories formed an oblique line, indicating relatively small differences among them (Figure 9E,F). Taken together, the 2XY subset showed the highest S2 values, reflecting the greatest deviation from the overall 8-mer sequence; the 0XY subset had the lowest S2 values, indicating the least deviation; and the 1XY subset displayed intermediate values between the two.

2.8. Comparative Analysis of CG-Classified 8-mers Reveals Evolutionary Trends

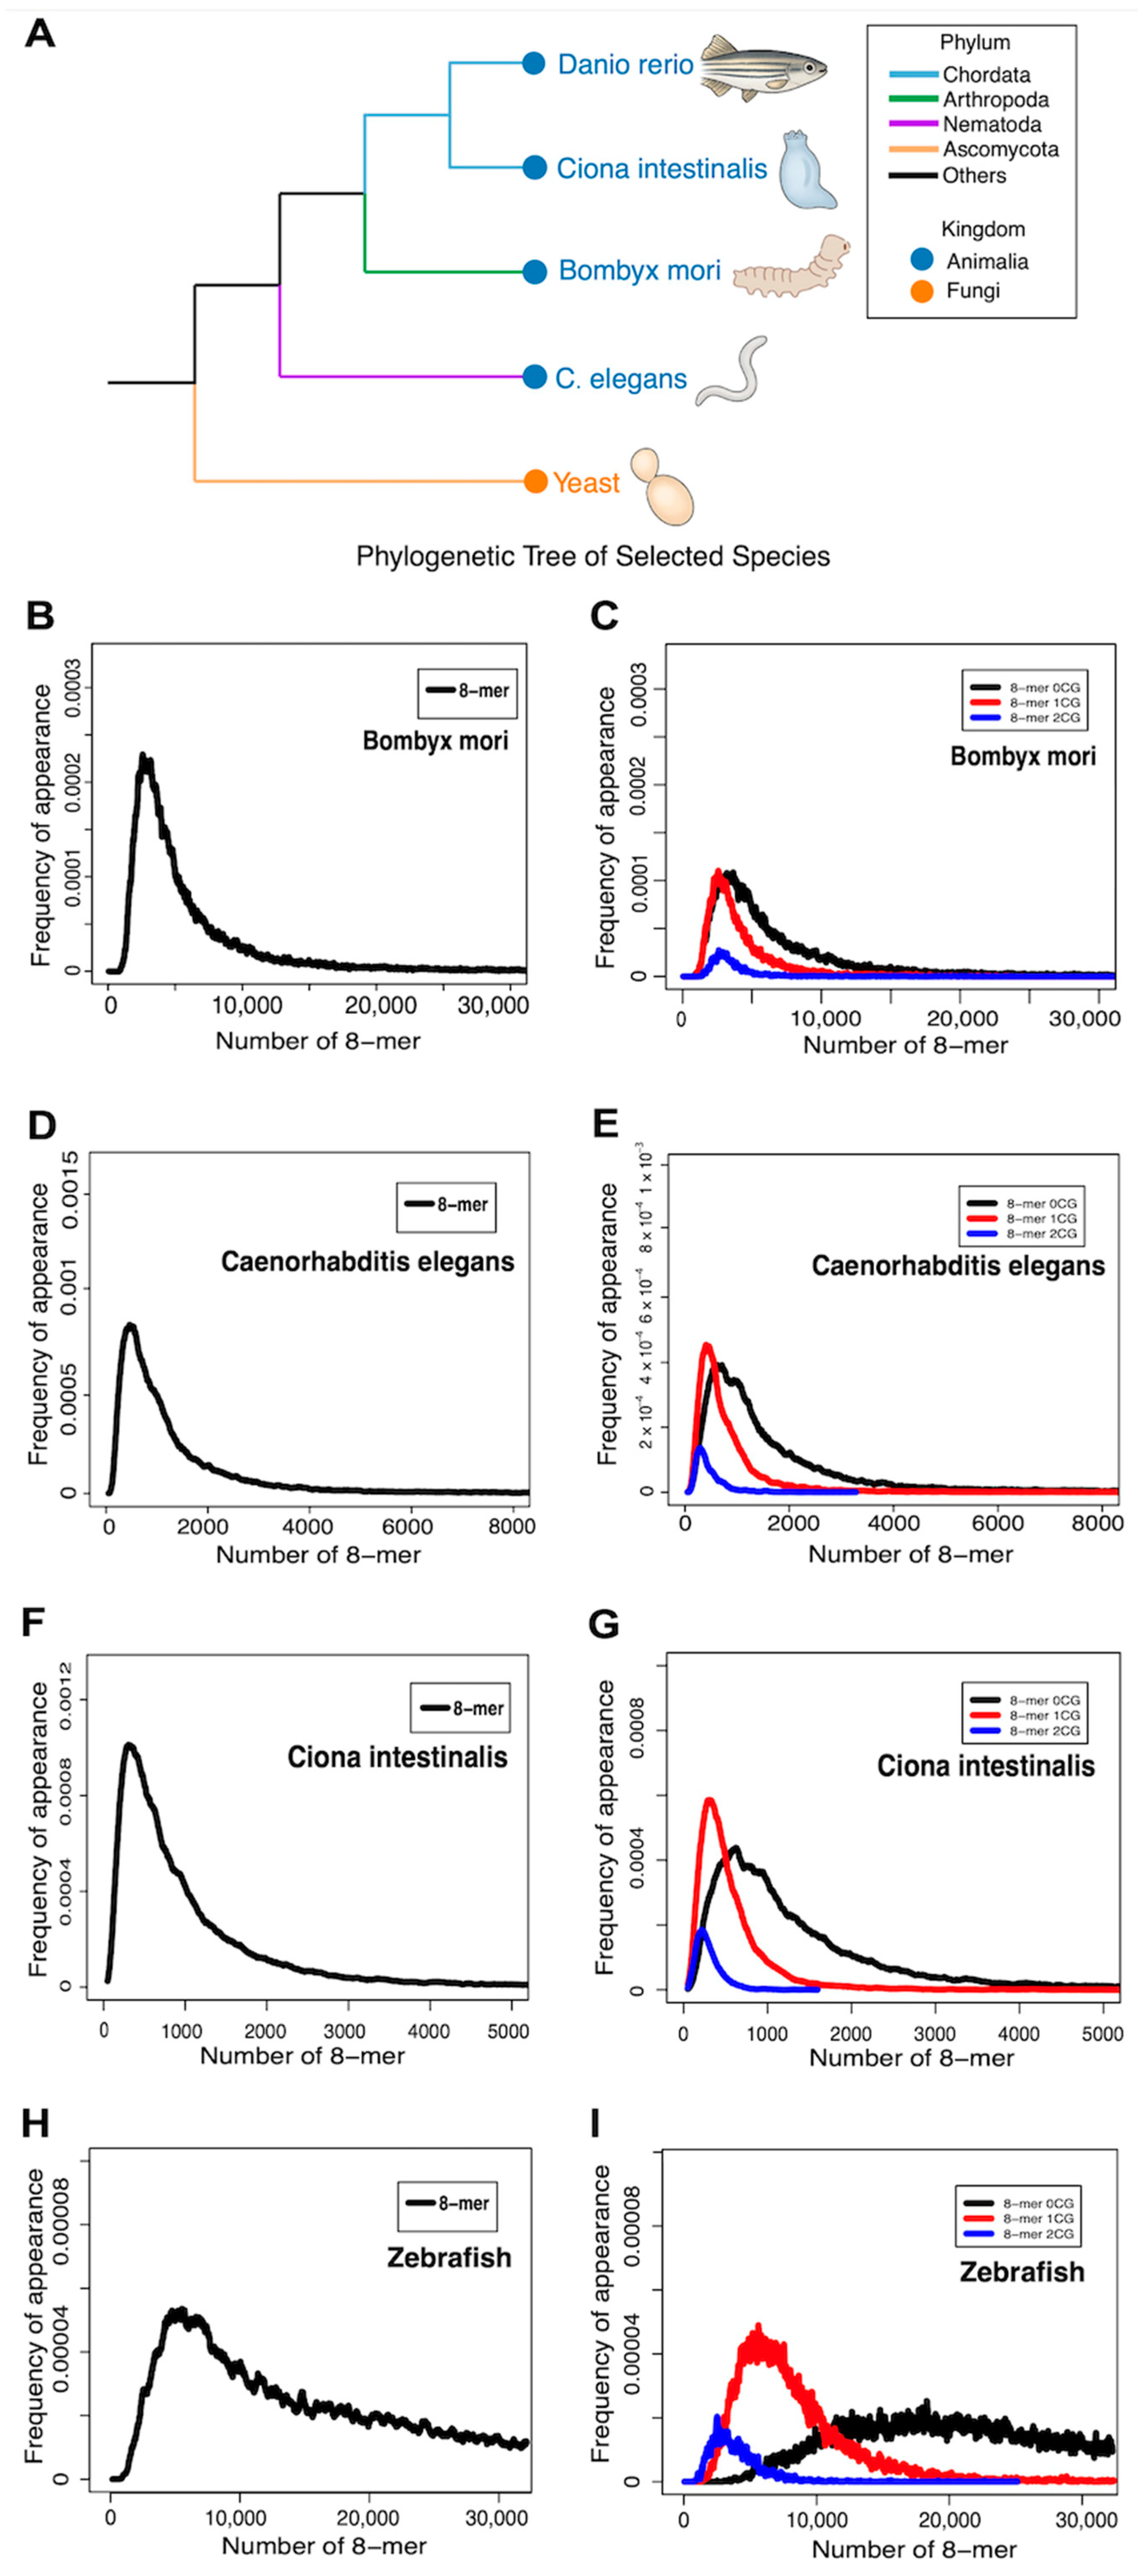
To explore the link between CG dinucleotide-classified 8-mers and species evolution, we compared Saccharomyces cerevisiae with Bombyx mori, Ciona intestinalis, Danio rerio, and Caenorhabditis elegans. Their phylogenetic tree is shown in Figure 10A. Unlike the trimodal distribution in human chromosome 1, all five species exhibited unimodal 8-mer distributions, with the 2CG and 1CG subsets shifted leftward relative to 0CG. The 1CG subset had a higher peak FA than both 0CG and 2CG, consistent with patterns in yeast and humans (Figure 10B–I). Peak distances between 0CG, 1CG, and 2CG subsets were calculated (Equations (9) and (10)), and significance was assessed by permutation test (Equations (11) and (12); Table 4 and Figure S1). The significance order for 0CG vs. 1CG and 0CG vs. 2CG was zebrafish > B. mori > C. intestinalis > C. elegans > yeast, suggesting that these distances may reflect evolutionary divergence. These findings suggest that the CG-classified 8-mer distribution patterns not only vary across species but also provide informative markers of phylogenetic divergence in species exhibiting unimodal 8-mer spectra.

3. Discussion

The non-random usage of k-mers and their biological functions have attracted increasing attention in genome research. Chor et al. analyzed k-mer distributions across 89 non-mammalian species and found that most display a Poisson-like unimodal pattern, whereas non-mammalian tetrapods tend to exhibit multimodal distributions—a trend that becomes predominant in mammals regardless of chromosome or genome scale. This shift has been associated with moderate GC content (35–45%) and low CpG dinucleotide ratios (<0.4) [24]. Previous studies further revealed a consistent trimodal distribution of k-mers (k > 6) in human intergenic regions, one that is particularly stable at k = 8. While the whole genome and non-coding regions exhibit three distinct peaks for k = 6 and 8, coding regions typically follow a unimodal 8-mer distribution [32]. These findings highlight the importance of investigating 8-mers containing CG dinucleotides, which may play key roles in shaping the compositional and functional landscape of the genome.
In this study, we investigated the distribution of 8-mers on human chromosome 1. The 0CG subset overlapped with the center of a randomized 8-mer distribution, whereas the 1CG and 2CG subsets were significantly underrepresented and skewed, suggesting non-random usage possibly driven by functional constraints. By analyzing the distribution of CG-containing 8-mers after removing CpG islands, we observed a marked change, particularly in 2CG 8-mers. This finding suggests that 8-mers with zero CpG dinucleotides (0CG) may result from random evolutionary processes, while 2CG 8-mers likely represent core motifs contributing to CpG island formation. Previous studies have shown that transcription factor binding sites and protein-binding sites in non-coding regions exhibit sequence preferences [42]. However, the number of such sites is insufficient to explain the substantial deviations observed in 1CG and 2CG 8-mers. A nucleosome unit, consisting of 146–170 bp of core DNA wrapped around a histone octamer and 6–80 bp of linker DNA, spans the majority of chromosomal DNA. The interaction between DNA and histones is influenced by sequence composition, indicating that base composition plays a critical role in nucleosome formation [43,44,45]. Additionally, GC-rich sequences have been implicated in nucleosome positioning, species evolution, and gene regulation [46,47,48,49,50,51,52]. Given the larger number of 1CG 8-mers, we propose that a subset of these motifs may be associated with histone interaction sites, potentially serving as the core elements of nucleosome-binding motifs. Notably, the trimodal distribution of 8-mer frequencies observed in our analysis may be partially attributed to the general under-representation of CG dinucleotides in vertebrate genomes. This phenomenon is largely due to the high mutation rate of methylated cytosine to thymine. Consequently, the low-frequency 1CG and 2CG peaks observed in human DNA are likely the result of this mutational bias [53].
Li et al. reported that only 8-mers containing CG or TA dinucleotides are directly associated with genome sequence evolution, and that the relative frequencies of internal m-mer usage are better suited to characterize this process [54,55]. To explore this further, we analyzed the m-mer usage separation of dinucleotide-containing 8-mers from a sequence structure perspective. We used NSRE(P‖Q), an information-theoretic measure of spatial state divergence [56], along with distance difference (S1) and angle deviation (S2), to quantitatively assess m-mer usage separation. Among the XY subsets, the 2XY group showed the highest separation, followed by 1XY and then 0XY. Within the 0XY group, 0CG exhibited the lowest separation, while 0AA and 0AT showed the highest. In the 1XY group, 1CG displayed the greatest separation, a pattern mirrored in the 2XY group, where 2CG had the highest separation. These results suggest that the evolutionary divergence of 0CG motifs may result mainly from random variation rather than m-mer usage preferences. In contrast, the divergence of 2CG motifs appears driven by biased m-mer usage or compositional skew. The 1CG motif represents an intermediate case, where divergence likely reflects a combination of low motif abundance and stochastic m-mer distribution rather than strong usage preference alone.
Through the comparative analysis of species exhibiting unimodal distributions, we found that the order of peak distance significance between 0CG vs. 1CG and 0CG vs. 2CG was as follows: Danio rerio > Bombyx mori > Ciona intestinalis > C. elegans > Saccharomyces cerevisiae. Yeast (Saccharomyces cerevisiae), a unicellular organism lacking tissue differentiation and relying on simple metabolic pathways such as fermentation, represents the lowest evolutionary tier among the species analyzed [57]. C. elegans, an invertebrate, is a multicellular organism with a fixed number of somatic cells (959 in adults) and possesses a simple yet functionally distinct nervous system [58]. Sea squirt (Ciona intestinalis), though equipped with a notochord and neural tube during its larval stage, undergoes regression into a sessile, filter-feeding adult form, resulting in a structurally simplified body plan [59]. This developmental reduction may partly account for why the peak distance significance between 0CG vs. 1CG and 0CG vs. 2CG in sea squirt is lower than that observed in silkworm. Silkworm (Bombyx mori), an invertebrate with specialized organs (e.g., compound eyes, silk glands), undergoes complete metamorphosis and displays greater anatomical complexity than simpler invertebrates, although it remains less advanced than vertebrates [60]. In contrast, zebrafish (Danio rerio), a vertebrate, occupies the highest evolutionary position in this group, characterized by well-developed organ systems, including a closed circulatory system, a complex central nervous system, and a functional adaptive immune system [61,62]. Zebrafish also exhibit complex behaviors, including social interactions [63]. Therefore, the hierarchical significance of the observed peak distances reflects the increasing structural and functional complexity among these species, suggesting that the evolutionary separation of 1CG and 2CG distributions may serve as an indirect indicator of evolutionary advancement in species exhibiting unimodal distributions.
Although some of our views have been supported by experiments and partially corroborated by the literature, certain aspects may still be difficult to accept. In our future work, we plan to address the following: (1) In this study, we focused on analyzing 8-mer sequences. We believe that conducting in-depth analyses of DNA sequences starting from k-mers (k ≥ 9) will provide further insights into the evolution and function of DNA sequences. (2) We calculated the degree of deviation in various subsets by comparing the usage differences of 3-mers and 4-mers between the subsets and the overall 8-mer dataset. The choice of 5-mers should be better explained in contrast to other options. For instance, Frontali et al. found that the choice of k = 5 could be equally relevant for preserving the “signal” properties of the k-mer distribution. In Caenorhabditis elegans, their recursive analysis revealed long-range correlations in the usage of oligonucleotides between intronic and intergenic regions [11,64]. (3) The NSRE is still a preliminary attempt and does not yet fully account for the differences caused by the high occurrence of m-mers with a relative frequency of 0. In the next phase, we will incorporate these factors to refine this parameter. (4) The separation of k-mer usage as a reflection of evolutionary relationships among biological genomes is a novel and significant topic. While this study compared only five representative unimodal species spanning fungi, invertebrates, and vertebrates, future research should include a broader range of organisms to further generalize the findings. (5) The hypothesis that 8-mers containing one CG dinucleotide may serve as nucleosome-binding motifs, and that those containing two CGs may function as core motifs involved in CpG island formation, remains preliminary. Notably, organisms such as Saccharomyces cerevisiae and Caenorhabditis elegans lack canonical CpG islands, suggesting that the functions of 2CG 8-mers in these species require further investigation [65]. In future work, we will systematically analyze the biological roles of both high-frequency 8-mers and those that occur less frequently. Addressing these open questions constitutes a key objective of our ongoing k-mer research.
In summary, this study systematically characterized the distribution patterns of 8-mer sequences containing CG dinucleotides in five unimodal species, revealing their non-random usage within these genomes. Integrating positional, structural, and evolutionary analyses, we identified distinct preferences for 1CG and 2CG motifs, which appear to correlate with organismal complexity within this limited set. These findings suggest that CG-containing k-mers may carry underlying regulatory or structural signals shaped by evolution. Our work provides new insights into the sequence-level features of genomic organization and offers a basis for further investigation into the biological functions of short DNA motifs.

4. Materials and Methods

4.1. Acquisition and Assembly of Whole Genome Sequences

Genome data for Homo sapiens chromosome 1 (230,481,012 bp) and all 16 chromosomes of Saccharomyces cerevisiae (Chr I–XVI; concatenated length 12,312,773 bp) were obtained from the UCSC Genome Browser (http://genome.ucsc.edu/, accessed on 16 September 2025). Whole-genome sequences of Danio rerio (zebrafish), Bombyx mori (silkworm), Ciona intestinalis (sea squirt), and Caenorhabditis elegans were retrieved from the NCBI genome database (https://www.ncbi.nlm.nih.gov/genome, accessed on 16 September 2025). Except for the human genome, species selection was based on two criteria: (i) motif spectra, as these organisms exhibit the unimodal 8-mer spectral distributions reported previously [49]; and (ii) phylogenetic representation, ensuring evolutionary breadth by including fungi (S. cerevisiae), invertebrates from distinct phyla (B. mori, Arthropoda; C. elegans, Nematoda; C. intestinalis, Chordata), and vertebrates (D. rerio). This design facilitates comparative analyses across major evolutionary lineages while relying on high-quality, well-annotated genomic resources.

4.2. Definition of k-mer Frequency of Appearance (FA)

Ni refers to the number of k-mer motifs in the i-th frequency group. The arrangement of k-mers consists of 4k types. The frequency of appearance (FA) of a k-mer, that is, the relative motif count, is defined as follows:
F A = N i 4 k
by plotting the number of k-mer occurrences on the x axis and the FA of k-mers on the y axis, the distribution of FA of k-mers with respect to frequency is obtained.

4.3. Definition of the Relative Frequency of m-mers Within 8-mers

Each 8-mer contains (8 − m + 1) m-mers. Let Lj represent the total number of 8-mers in the j-th set. The relative frequency (RF) of each m-mer is calculated as follows:
R F = 4 m ( 8 m + 1 ) i = 1 L j N m i H i i = 1 L j H i
In the above formula, Hi represents the occurrence frequency of the i-th 8-mer in the j-th set, and Nmi denotes the occurrence frequency of a specific m-mer within the i-th 8-mer in set j. In this study, m is 3 and 4.

4.4. Definition of New Symmetric Relative Entropy

Our previous work applied the New Symmetric Relative Entropy (NSRE) method to analyze nucleosome sequences in S. cerevisiae, S. pombe, and Drosophila. The NSRE distributions successfully captured characteristic differences in nucleosome sequences among these species [56]. NSRE quantifies the divergence of m-mer usage from an informational perspective by measuring the separation of m-mer frequencies between subsets (0XY, 1XY, 2XY) and the overall 8-mer set. This metric reflects the deviation of subset-specific 8-mers from the overall 8-mer distribution. Prior to NSRE calculation, the relative frequencies of m-mers in both subsets and the overall 8-mer set require normalization. Specifically, for any m-mer with a relative frequency of zero in a subset, its frequency is substituted with half of the smallest non-zero frequency observed in that subset. The NSRE between distributions P and Q, denoted as NSRE(P‖Q), is mathematically defined as follows:
N S R E ( P Q ) = i = 1 L m p i log 2 2 p i p i + q i + q i log 2 2 q i p i + q i
In the above formula, pi represents the relative frequency of the i-th m-mer in the subsets 0XY, 1XY, and 2XY, whereas qi denotes the relative frequency of the i-th m-mer in the overall set of 8-mers. For an information set composed of Lm symbols, Lm = 64 for 3-mers and Lm = 256 for 4-mers. Both pi and qi are frequency values bounded between 0 and 1. If the relative frequency of a specific m-mer in a subset matches its frequency in the overall 8-mer set, its contribution to the NSRE is zero.

4.5. Definitions of Distance Difference and Angular Deviation

Standard deviation is a very important statistical measure that represents the degree of deviation of a variable series from its mean [66]. It is an indicator used to measure the dispersion of a variable series and is denoted as Sx. We extended the form of standard deviation by introducing the concepts of distance deviation S1 and angular deviation S2:
S x = x i x ¯ 2 n 1
S 1 = i = 1 n d i 2 n 1
d i = p i 2 + q i 2 sin α i
S 2 = i = 1 n α i 2 n 1
α i = π 4 arctan p i q i
where pi represents the relative frequency of the i-th m-mer in the subsets 0XY, 1XY, and 2XY, while qi denotes the relative frequency of the i-th m-mer in the overall set of 8-mers. For an information set composed of n symbols, n = 64 for 3-mers and n = 256 for 4-mers. Both pi and qi are frequency values ranging between 0 and 1. Here, di is the vertical distance of the i-th m-mer from the diagonal line, and ai is the angle formed between the line connecting the origin and the i-th m-mer and the diagonal line. The distance deviation (S1) describes the separation of m-mer usage based on the vertical distance of the m-mer from the diagonal line. The angle deviation (S2) describes the separation of m-mer usage based on the angle formed by the line connecting the m-mer to the origin and the diagonal line.

4.6. Definition of Peak Distance Difference

Let f 0 x , f 1 x , and f 2 x represent the three frequency curves corresponding to 0CG, 1CG, and 2CG subsets, respectively. After smoothing, the main peak positions of these curves are identified as follows:
  x ^ i = arg max x f i x , i 0 , 1 , 2
The peak distance between two frequency distributions can be defined as
  D i j = x ^ i x ^ j

4.7. Definition of Nonparametric Permutation Test

To test whether there is a significant difference between the main peak positions of two 8-mer subsets (i.e., whether the observed peak difference D i j o b s is significant), we first randomly shuffle the data labels of f i x and f j x . After regrouping, we recalculate the smoothed curves and identify the peaks, obtaining the peak difference D i j b for each permutation. After performing B permutations, a “null distribution” of D i j b is constructed:
D i j null = D i j 1 , D i j 2 , , D i j B
The corresponding p-value of the permutation test was calculated using the following Formula [67]:
p = 1 B b = 1 B 1 D i j b D i j obs
The core idea of this method is to shuffle the labels of the pooled data, then recalculate the main peak difference, and finally repeat the process multiple times to generate a distribution under the null hypothesis for statistical evaluation.

5. Conclusions

  • Human chromosome 1 exhibits a trimodal distribution of 8-mers classified by CG dinucleotide content, where 0CG motifs align with random distributions, while 1CG and 2CG motifs show significant deviations, indicating possible functional constraints.
  • The unimodal distribution of 8-mers may arise from the close clustering of the distribution centers of 0CG, 1CG, and 2CG motifs.
  • Comparative studies across species show that differences in CG-classified 8-mer distributions correlate with evolutionary complexity.

Supplementary Materials

The following supporting information can be downloaded at https://www.mdpi.com/article/10.3390/ijms26199477/s1.

Author Contributions

G.L. (Guojun Liu) performed the computations; H.M., Z.Y., G.L. (Guoqing Liu), and Y.X. contributed to data preparation and analysis; G.L. (Guojun Liu) wrote the manuscript; N.X. reviewed and edited the entire manuscript and performed technical revisions; G.L. (Guojun Liu) and N.X. conceived and designed the study. All authors have read and agreed to the published version of the manuscript.

Funding

This work was supported by the National Natural Science Foundation of China (Grant Nos. 62161043 and 62401300); the Natural Science Foundation of Inner Mongolia (Grant Nos. 2022LHMS03015, 2024MS03054, and 2024JQ10); the Basic Scientific Research Funding for Universities Directly Under the Inner Mongolia Autonomous Region (Grant Nos. 2023XKJX016 and 2023RCTD023); and the Innovation Support Program for Overseas Returnees of Inner Mongolia Autonomous Region (grants awarded to G.Q.L. and G.J.L.).

Institutional Review Board Statement

This study did not involve human participants, animals, or data requiring ethical approval.

Informed Consent Statement

Not applicable.

Data Availability Statement

The whole-genome data used in this study were obtained from the UCSC (http://genome.ucsc.edu/, accessed on 16 September 2025) and NCBI (https://www.ncbi.nlm.nih.gov/, accessed on 16 September 2025) databases. Detailed version information for each dataset can be found in Table 1. The data supporting the figures and the code used in this study are available from the corresponding author upon reasonable request.

Acknowledgments

We sincerely acknowledge the support from The 2025 Inner Mongolia Key Laboratory of Life Health and Bioinformatics Project (2025KYPT0135) for this study.

Conflicts of Interest

The authors declare that the research was conducted in the absence of any commercial or financial relationships that could be construed as potential conflicts of interest.

Abbreviations

FA: Frequency of appearance; RF: Relative frequency; NSRE: New Symmetric Relative Entropy; m-mer: Short k-mer within 8-mer; S1: Distance difference; S2: Angular deviation; 0XY: 8-mers without XY dinucleotide; 1XY: 8-mers including 1 XY dinucleotide; 2XY: 8-mers including 2 or more than 2 XY dinucleotides.

References

  1. Choi, J.K.; Kim, Y.J. Epigenetic regulation and the variability of gene expression. Nat. Genet. 2008, 40, 141–147. [Google Scholar] [CrossRef]
  2. Choi, J.K.; Kim, Y.J. Intrinsic variability of gene expression encoded in nucleosome positioning sequences. Nat. Genet. 2009, 41, 498–503. [Google Scholar] [CrossRef]
  3. Stunkel, W.; Kober, I.; Seifart, K.H. A nucleosome positioned in the Distal promoter region activates transcription of the human U6 gene. Mol. Cell. Biol. 1997, 17, 4397–4405. [Google Scholar] [CrossRef]
  4. Kornberg, R.D.; Lorch, Y. Twenty-five years of the nucleosome: Fundamental particle of the eukaiyote chromosome. Cell 1999, 98, 285–294. [Google Scholar] [CrossRef]
  5. Jiang, C.; Pugh, B.F. Nucleosome positioning and gene regulation: Anvances through genomics. Nat. Rev. Genet. 2009, 10, 161–172. [Google Scholar] [CrossRef]
  6. Segal, E.; Widom, J. What controls nucleosome positions? Trends Genet. 2009, 25, 335–343. [Google Scholar] [CrossRef] [PubMed]
  7. Panyukov, V.V.; Kiselev, S.S.; Ozoline, O.N. Unique k-mers as Strain-Specific Barcodes for Phylogenetic Analysis and Natural Microbiome Profiling. Int. J. Mol. Sci. 2020, 21, 944. [Google Scholar] [CrossRef] [PubMed]
  8. Nilamyani, A.N.; Auliah, F.N.; Moni, M.A.; Shoombuatong, W.; Hasan, M.M.; Kurata, H. PredNTS: Improved and Robust Prediction of Nitrotyrosine Sites by Integrating Multiple Sequence Features. Int. J. Mol. Sci. 2021, 22, 2704. [Google Scholar] [CrossRef]
  9. Francino, M.P.; Ochman, H. Strand symmetry around the beta-globin origin of replication inprimates. Mol. Biol. Evol. 2000, 17, 416–422. [Google Scholar] [CrossRef] [PubMed]
  10. Chen, X.; Hughes, T.R.; Morris, Q. RankMotif++: A motif-search algorithm that accounts for relative ranks of K-mers in binding transcription factors. Bioinformatics 2007, 23, i72–i79. [Google Scholar] [CrossRef]
  11. Bultrini, E.; Pizzi, E.; Del Giudice, P.; Frontali, C. Pentamer vocabularies characterizing introns and intron-like intergenic tracts from Caenorhabditis elegans and Drosophila melanogaster. Gene 2003, 304, 183–192. [Google Scholar] [CrossRef] [PubMed]
  12. Peng, C.; Han, S.; Zhang, H.; Li, Y. RPITER: A Hierarchical Deep Learning Framework for ncRNAProtein Interaction Prediction. Int. J. Mol. Sci. 2019, 20, 1070. [Google Scholar] [CrossRef]
  13. Kaplan, N.; Moore, I.K.; Fondufe-Mittendorf, Y.; Gossett, A.J.; Tillo, D.; Field, Y.; LeProust, E.M.; Hughes, T.R.; Lieb, J.D.; Widom, J.; et al. The DNA-encoded nucleosome organization of a eukaryotic genome. Nature 2009, 458, 362–366. [Google Scholar] [CrossRef]
  14. Ogawa, R.; Kitagawa, N.; Ashida, H.; Saito, R.; Tomita, M. Computational prediction of nucleosome positioning by calculating the relative fragment frequency index of nucleosomal sequences. FEBS Lett. 2010, 584, 1498–1502. [Google Scholar] [CrossRef]
  15. Ruan, H.; Wang, Y.H. Friedreich’s ataxia GAA TTC duplex and GAA GAA TTC triplex structures exclude nucleosome assembly. J. Mol. Biol. 2008, 383, 292–300. [Google Scholar] [CrossRef]
  16. Wang, Y.H.; Griffith, J. Expanded CTG triplet blocks from the myotonic dystrophy gene createthe strongest known natural nucleosome positioning elements. Genomics 1995, 25, 570–573. [Google Scholar] [CrossRef]
  17. Marchet, C.; Boucher, C.; Puglisi, S.J.; Medvedev, P.; Salson, M.; Chikhi, R. Data structures based on k-mers for querying large collections of sequencing data sets. Genome Res. 2021, 31, 1–12. [Google Scholar] [CrossRef] [PubMed]
  18. Schones, D.E.; Cui, K.; Cuddapah, S.; Roh, T.Y.; Barski, A.; Wang, Z.; Wei, G.; Zhao, K. Dynamic regulation of nucleosome positioning in the human genome. Cell 2008, 132, 887–898. [Google Scholar] [CrossRef]
  19. Hesse, U. K-Mer-Based Genome Size Estimation in Theory and Practice. Methods Mol. Biol. 2023, 2672, 79–113. [Google Scholar]
  20. Hughes, A.L.; Jin, Y.; Rando, O.J.; Struhl, K. A functional evolutionary approach to identify determinants of nucleosome positioning: A unifying model for establishing the genome-wide pattern. Cell 2012, 48, 5–15. [Google Scholar] [CrossRef] [PubMed]
  21. Karikari, B.; Lemay, M.A.; Belzile, F. k-mer-Based Genome-Wide Association Studies in Plants: Advances, Challenges, and Perspectives. Genes 2023, 14, 1439. [Google Scholar] [CrossRef]
  22. Fofanov, Y.; Luo, Y.; Katili, C.; Wang, J.; Belosludtsev, Y.; Powdrill, T.; Belapurkar, C.; Fofanov, V.; Li, T.B.; Chumakov, S.; et al. How independent are the appearances of n-mers in different genomes? Bioinformatics 2004, 20, 2421–2428. [Google Scholar] [CrossRef] [PubMed]
  23. Reinert, G.; Schbath, S.; Waterman, M.S. Probabilistic and statistical properties of words: An overview. J. Comput. Biol. 2000, 7, 1–46. [Google Scholar] [CrossRef] [PubMed]
  24. Chor, B.; Horn, D.; Goldman, N.; Levy, Y.; Massingham, T. Genomic DNA k-mer spectra. models and modalities. Genome Biol. 2009, 10, R108. [Google Scholar] [CrossRef]
  25. Xie, H.; Hao, B. Visualization of K-tuple distribution in procaryote complete genomes and their randomized counterparts. Proc. IEEE Comput. Soc. Bioinform. Conf. 2002, 1, 31–42. [Google Scholar]
  26. Hsieh, L.C.; Luo, L.F.; Lee, H.C. Short segmental duplication: Parsimony in growth of microbial genomes. Genome Biol. 2003, 4, 7. [Google Scholar] [CrossRef]
  27. Stacey, K.J.; Young, G.R.; Clark, F.; Sester, D.P.; Roberts, T.L.; Naik, S.; Sweet, M.J.; Hume, D.A. The molecular basis for the lack of immunostimulatory activity of verterbrate DNA. J. Immunol. 2003, 170, 3614–3620. [Google Scholar] [CrossRef]
  28. Chen, Y.H.; Nyeo, S.L.; Yeh, C.Y. Model for the distributions of k-mers in DNA sequences. Phys. Rev. E Stat. Nonlin. Soft Matter Phys. 2005, 72, 011908. [Google Scholar] [CrossRef]
  29. Choi, J.K. Contrasting chromatin organization of CpG islands and exons in the human genome. Genome Biol. 2010, 11, R70. [Google Scholar] [CrossRef]
  30. Brown, W.R.; Bird, A.P. Long-range restriction site mapping of mammalian genomic DNA. Nature 1986, 322, 477–481. [Google Scholar] [CrossRef] [PubMed]
  31. Wang, S.; Li, H.; Li, X. Effect of the Nucleosome-Depleted Region in the Transcribed Regions of Saccharomyces cerevisiae Genes on Exogenous Gene Expression. Appl. Sci. 2024, 14, 11339. [Google Scholar] [CrossRef]
  32. Jia, Y.; Li, H.; Wang, J.; Meng, H.; Yang, Z. Spectrum structures and biological functions of 8-mers in the human genome. Genomics 2019, 111, 483–491. [Google Scholar] [CrossRef]
  33. Meng, H.; Li, H.; Yang, Z.; Si, Y. Nucleosome sliding mechanism based on the potential energy of sequence. Gen. Physiol. Biophys. 2020, 39, 269–276. [Google Scholar] [CrossRef]
  34. Mohamed Hashim, E.K.; Abdullah, R. Rare k-mer DNA: Identification of sequence motifs and prediction of CpG island and promoter. J. Theor. Biol. 2015, 387, 88–100. [Google Scholar] [CrossRef]
  35. Kogan, S.B.; Kato, M.; Kiyama, R.; Trifonov, E.N. Sequence structure of human nucleosome DNA. J. Biomol. Struct. Dyn. 2006, 24, 43–48. [Google Scholar] [CrossRef]
  36. Gupta, S.; Dennis, J.; Thurman, R.E.; Kingston, R.; Stamatoyannopoulos, J.A.; Noble, W.S. Predicting human nucleosome occupancy from primary sequence. PLoS Comput. Biol. 2008, 4, e1000134. [Google Scholar] [CrossRef]
  37. Peckham, H.E.; Thurman, R.E.; Fu, Y.; Stamatoyannopoulos, J.A.; Noble, W.S.; Struhl, K.; Weng, Z. Nucleosome positioning signals in genomic DNA. Genome Res. 2007, 17, 1170–1177. [Google Scholar] [CrossRef]
  38. Johnson, S.M.; Tan, F.J.; McCullough, H.L.; Riordan, D.P.; Fire, A.Z. Flexibility and constraint in the nucleosome core landscape of Caenorhabditis elegans chromatin. Genome Res. 2006, 16, 1505–1516. [Google Scholar] [CrossRef] [PubMed]
  39. Nyamdavaa; Li, H.; Zhou, D.L.; Yang, Y.X. Theoretical prediction and verification of the nucleosome bounding motifs. J. Inn. Mong. Univ. 2015, 46, 488–499. [Google Scholar]
  40. Song, H.D.; Sun, X.J.; Deng, M.; Zhang, G.W.; Zhou, Y.; Wu, X.Y.; Sheng, Y.; Chen, Y.; Ruan, Z.; Jiang, C.L.; et al. Hematopoietic gene expression profile in zebrafish kidney marrow. Proc. Natl. Acad. Sci. USA 2004, 101, 16240–16245. [Google Scholar] [CrossRef] [PubMed]
  41. Choi, T.Y.; Choi, T.I.; Lee, Y.R.; Choe, S.K.; Kim, C.H. Zebrafish as an animal model for biomedical research. Exp. Mol. Med. 2021, 53, 310–317. [Google Scholar] [CrossRef] [PubMed]
  42. FitzGerald, P.C.; Shlyakhtenko, A.; Mir, A.A.; Vinson, C. Clustering of DNA sequences in human promoters. Genome Res. 2004, 14, 1562–1574. [Google Scholar] [CrossRef] [PubMed]
  43. Ghorbani, M.; Mohammad-Rafiee, R. Geometrical correlations in the nucleosoma DNA conformation and the role of the covalent bonds rigidity. Nucleic Acids Res. 2011, 39, 1220–1230. [Google Scholar] [CrossRef] [PubMed]
  44. Travers, A.; Hiriart, E.; Churcher, M.; Caserta, M.; Di Mauro, E. The DNA sequence-dependence of nucleosome positioning in vivo and in vitro. J. Biomol. Struct. Dyn. 2010, 27, 713–724. [Google Scholar] [CrossRef] [PubMed]
  45. Tsankov, A.; Yanagisawa, Y.; Rhind, N.; Regev, A.; Rando, O.J. Evolutionary divergence of intrinsic and trans-regulated nucleosome positioning sequences reveals plastic rules for chromatin organization. Genome Res. 2011, 21, 1851–1862. [Google Scholar] [CrossRef]
  46. Goh, W.S.; Orlov, Y.; Li, J.; Clarke, N.D. Blurring of high-Resolution data shows that the effect of intrinsic nucleosome occupancy on transcription factor binding is mostly regional, not local. PLoS Comput. Biol. 2010, 6, e1000649. [Google Scholar] [CrossRef]
  47. Hodges, C.; Bintu, L.; Lubkowska, L.; Kashlev, M.; Bustamante, C. Nucleosomal fluctuations govern the transcription dynamics of RNA polymerase II. Science 2009, 235, 626–628. [Google Scholar] [CrossRef]
  48. Frith, M.C.; Valen, E.; Krogh, A.; Hayashizaki, Y.; Carninci, P.; Sandelin, A. A code for transcription initiation in mammalian genomes. Genome Res. 2008, 18, 1–12. [Google Scholar] [CrossRef]
  49. Yang, Z.; Li, H.; Jia, Y.; Zheng, Y.; Meng, H.; Bao, T.; Li, X.; Luo, L. Intrinsic laws of k-mer spectra of genome sequences and evolution mechanism of genomes. BMC Evol. Biol. 2020, 20, 157. [Google Scholar] [CrossRef]
  50. Diffley, J.F. Once and only once upon a time: Specifying and regulating origins of DNA replication in eukaryotic cells. Genes Dev. 1996, 10, 2819–2830. [Google Scholar] [CrossRef]
  51. Prendergast, J.G.; Semple, C.A. Widespread signatures of recent selection linked to nucleosome positioning in the human lineage. Genome Res. 2011, 21, 1777–1787. [Google Scholar] [CrossRef] [PubMed]
  52. Collings, C.K.; Fernandez, A.G.; Pitschka, C.G.; Hawkins, T.B.; Anderson, J.N. Oligonucleotide sequence motifs as nucleosome positioning signals. PLoS ONE 2010, 5, 1235–1244. [Google Scholar] [CrossRef]
  53. Fraser, R.M.; Keszenman-Pereyra, D.; Simmen, M.W.; Allan, J. High-resolution mapping of sequence-directed nucleosome positioning on genomic DNA. J. Mol. Biol. 2009, 390, 292–305. [Google Scholar] [CrossRef]
  54. Li, X.; Li, H.; Yang, Z.; Wu, Y.; Zhang, M. Exploring objective feature sets in constructing the evolution relationship of animal genome sequences. BMC Genom. 2023, 24, 634. [Google Scholar] [CrossRef]
  55. Li, X.; Li, H.; Yang, Z.; Wang, L. Distribution rules of 8-mer spectra and characterization of evolution state in animal genome sequences. BMC Genom. 2024, 25, 855. [Google Scholar] [CrossRef]
  56. Meng, H.; Li, H.; Zheng, Y.; Yang, Z.; Jia, Y.; Bo, S. Evolutionary analysis of nucleosome positioning sequences based on New Symmetric Relative Entropy. Genomics 2018, 110, 154–161. [Google Scholar] [CrossRef]
  57. Goffeau, A.; Barrell, B.G.; Bussey, H.; Davis, R.W.; Dujon, B.; Feldmann, H.; Galibert, F.; Hoheisel, J.D.; Jacq, C.; Johnston, M.; et al. Life with 6000 genes. Science 1996, 274, 546–567. [Google Scholar] [CrossRef]
  58. Sulston, J.E.; Schierenberg, E.; White, J.G.; Thomson, J.N. The embryonic cell lineage of the nematode Caenorhabditis elegans. Dev. Biol. 1983, 100, 64–119. [Google Scholar] [CrossRef]
  59. Satoh, N. The ascidian tadpole larva: Comparative molecular development and genomics. Nat. Rev. Genet. 2003, 4, 285–295. [Google Scholar] [CrossRef] [PubMed]
  60. Xia, Q.; Zhou, Z.; Lu, C.; Cheng, D.; Dai, F.; Li, B.; Zhao, P.; Zha, X.; Cheng, T.; Chai, C. A draft sequence for the genome of the domesticated silkworm (Bombyx mori). Science 2004, 306, 1937–1940. [Google Scholar] [CrossRef] [PubMed]
  61. Howe, K.; Clark, M.D.; Torroja, C.F.; Torrance, J.; Berthelot, C.; Muffato, M.; Collins, J.E.; Humphray, S.; McLaren, K.; Matthews, L.; et al. The zebrafish reference genome sequence and its relationship to the human genome. Nature 2013, 496, 498–503. [Google Scholar] [CrossRef] [PubMed]
  62. Trede, N.S.; Langenau, D.M.; Traver, D.; Look, A.T.; Zon, L.I. The use of zebrafish to understand immunity. Immunity 2004, 20, 367–379. [Google Scholar] [CrossRef]
  63. Norton, W.H.J.; Bally-Cuif, L. Adult zebrafish as a model organism for behavioural genetics. BMC Neurosci. 2010, 11, 90. [Google Scholar] [CrossRef]
  64. Frontali, C.; Pizzi, E. Similarity in oligonucleotide usage in introns and intergenic regions contributes to long-range correlation in the Caenorhabditis elegans genome. Gene 1999, 232, 87–95. [Google Scholar] [CrossRef]
  65. Zheng, Y.; Li, H.; Wang, Y.; Meng, H.; Zhang, Q.; Zhao, X. Evolutionary mechanism and biological functions of 8-mers containing CG dinucleotide in yeast. Chromosome Res. 2017, 25, 173–189. [Google Scholar] [CrossRef] [PubMed]
  66. Montgomery, D.C.; Runger, G.C. Applied Statistics and Probability for Engineers; John Wiley and Sons: Hoboken, NJ, USA, 2010. [Google Scholar]
  67. Phipson, B.; Smyth, G.K. Permutation p-values should never be zero: Calculating exact p-values when permutations are randomly drawn. Stat. Appl. Genet. Mol. Biol. 2010, 9, 39. [Google Scholar] [CrossRef] [PubMed]
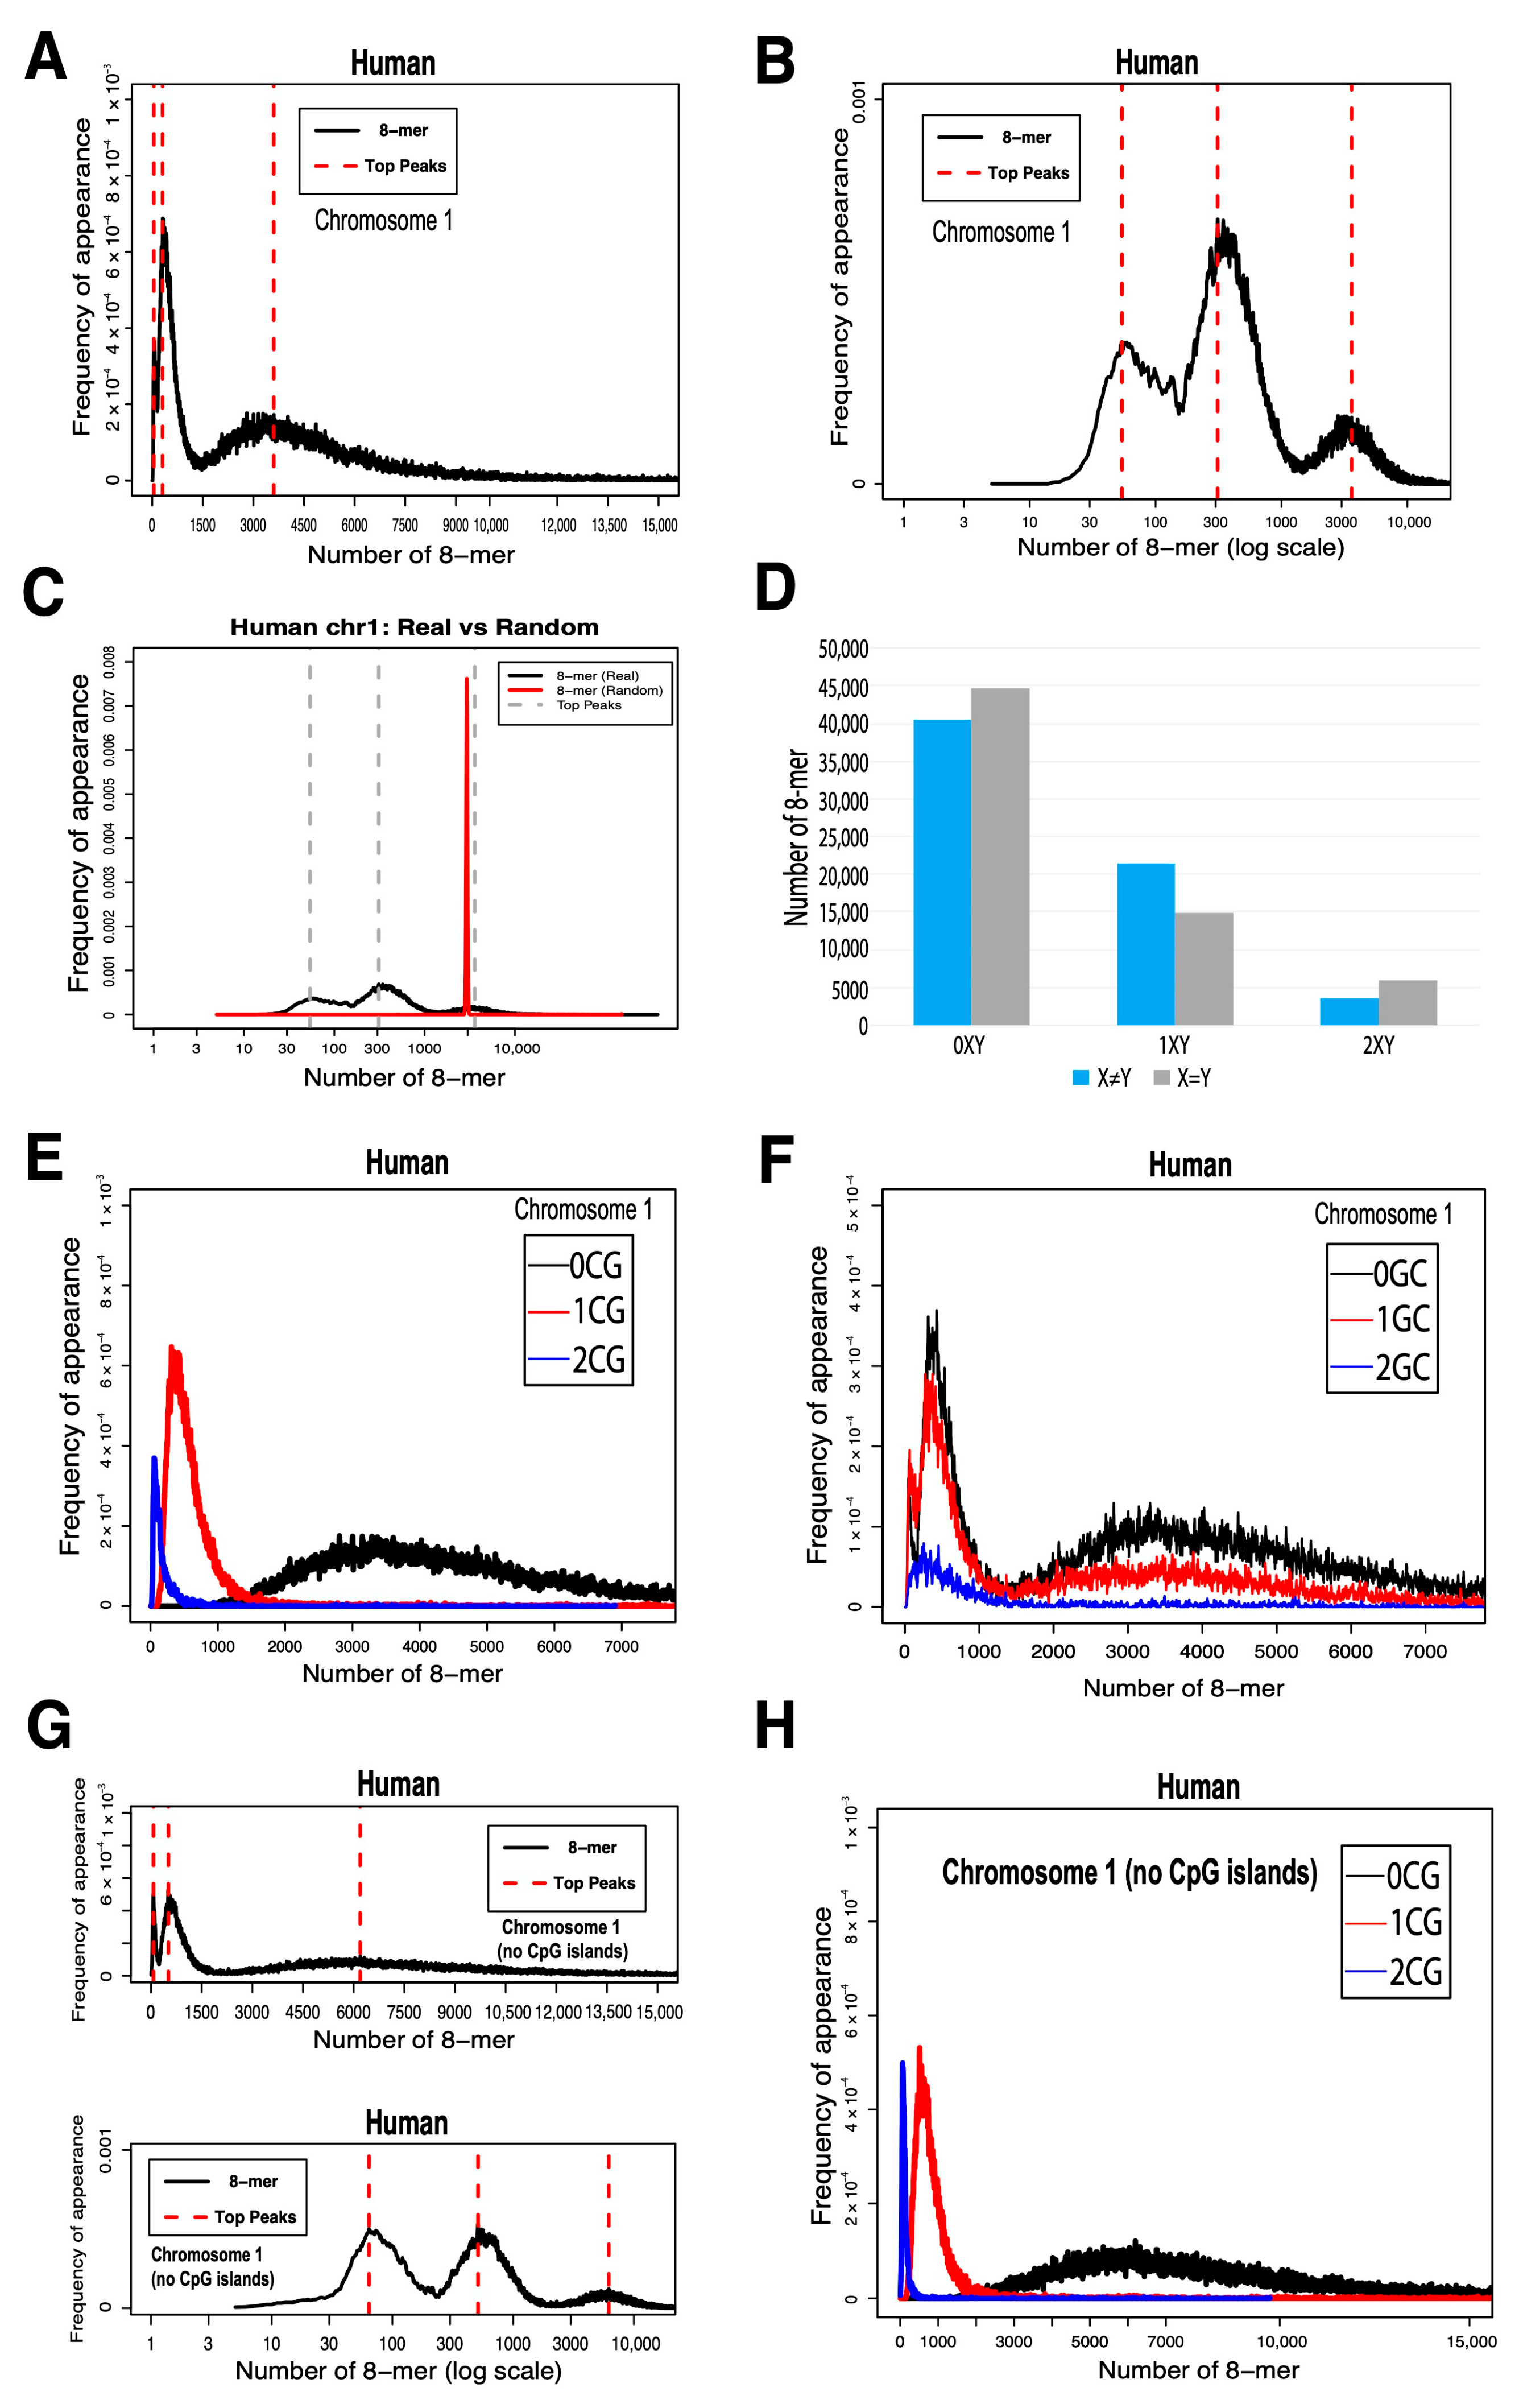
Figure 1. Distribution patterns of 8-mer frequencies in human chromosome 1 and analysis based on dinucleotide composition. (A) The distribution of 8-mers in human chromosome 1, with the x axis representing the number of k-mer appearances and the y axis indicating frequency of appearance (FA). (B) The same distribution shown with a log-transformed x axis. (C) A comparison with a random sequence of matched length and CG content shows that Peak3 corresponds to random 8-mer usage. (D) The number of 8-mers in the 0XY, 1XY, and 2XY subsets. (E) Distributions of 8-mers containing different numbers of CG dinucleotides. (F) Distributions of 8-mers containing different numbers of GC dinucleotides. (G) The distribution of 8-mers in chromosome 1 after removing CpG island sequences. (H) The same distribution as (G), shown with a log-transformed x axis.
Ijms 26 09477 g001
Figure 2. The 8-mer distribution in yeast genome sequences. (A) The sequence lengths of the sixteen chromosomes in yeast. (B) The unimodal distribution of 8-mers in the yeast genome sequence, with the x axis representing the number of k-mer appearances. (C) The unimodal distribution of 8-mers in the yeast genome sequence, with the x axis representing the logarithmic scale of the number of k-mer appearances.
Ijms 26 09477 g002
Figure 3. Distribution of 8-mers containing different counts (0, 1, 2) of the 16 dinucleotide types. (A) Distribution of 8-mers containing 0, 1, or 2 instances of CG, GC, CC, and GG dinucleotides. (B) Distribution of 8-mers containing 0, 1, or 2 instances of AA, AT, TA, and TT dinucleotides. (C) Distribution of 8-mers containing 0, 1, or 2 instances of each of the following dinucleotides: AC, AG, CA, CT, GA, GT, TC, and TG.
Ijms 26 09477 g003
Figure 4. Usage divergence of 3-mers and 4-mers between 0CG, 0GC, 0TC, 0AA subsets and the overall 8-mer. (A) The usage divergence of 3-mers between the 0CG subset and the overall 8-mer. (B) The usage divergence of 3-mers between the 0GC subset and the overall 8-mer. (C) The usage divergence of 3-mers between the 0TC subset and the overall 8-mer. (D) The usage divergence of 3-mers between the 0AA subset and the overall 8-mer. (E) The usage divergence of 4-mers between the 0CG subset and the overall 8-mer. (F) The usage divergence of 4-mers between 0GC subset and the overall 8-mer. (G) The usage divergence of 4-mers between 0TC subset and the overall 8-mer. (H) The usage divergence of 4-mers between the 0AA subset and the overall 8-mer.
Ijms 26 09477 g004
Figure 5. Usage divergence of 3-mer and 4-mer between the 1CG, 1GC, 1TC, and 1AA subsets and overall 8-mer. (A) The usage divergence of 3-mers between the 1CG subset and overall 8-mer. (B) The usage divergence of 3-mers between the 1GC subset and overall 8-mer. (C) The usage divergence of 3-mers between the 1TC subset and overall 8-mer. (D) The usage divergence of 3-mers between the 1AA subset and overall 8-mer. (E) The usage divergence of 4-mers between the 1CG subset and overall 8-mer. (F) The usage divergence of 4-mers between the 1GC subset and overall 8-mer. (G) The usage divergence of 4-mers between the 1TC subset and overall 8-mer. (H) The usage divergence of 4-mers between the 1AA subset and overall 8-mer.
Ijms 26 09477 g005
Figure 6. Usage divergence of 3-mer and 4-mer between the 2CG, 2GC, 2TC, and 2AA subsets and overall 8-mer. (A) The usage divergence of 3-mers between the 2CG subset and overall 8-mer. (B) The usage divergence of 3-mers between the 2GC subset and overall 8-mer. (C) The usage divergence of 3-mers between the 2TC subset and overall 8-mer. (D) The usage divergence of 3-mers between the 2AA subset and overall 8-mer. (E) The usage divergence of 4-mers between the 2CG subset and overall 8-mer. (F) The usage divergence of 4-mers between the 2GC subset and overall 8-mer. (G) The usage divergence of 4-mers between the 2TC subset and overall 8-mer. (H) The usage divergence of 4-mers between the 2AA subset and overall 8-mer.
Ijms 26 09477 g006
Figure 7. Analysis of the usage divergence of 3-mers and 4-mers between the 0XY, 1XY, and 2XY subsets and the overall 8-mer based on NSRE. (A) Analysis of the usage divergence of 3-mers between the 0XY subset and the overall 8-mer based on NSRE. (B) Analysis of the usage divergence of 4-mers between the 0XY subset and the overall 8-mer based on NSRE. (C) Analysis of the usage divergence of 3-mers between the 1XY subset and the overall 8-mer based on NSRE. (D) Analysis of the usage divergence of 4-mers between the 1XY subset and the overall 8-mer based on NSRE. (E) Analysis of the usage divergence of 3-mers between the 2XY subset and the overall 8-mer based on NSRE. (F) Analysis of the usage divergence of 4-mers between the 2XY subset and the overall 8-mer based on NSRE.
Ijms 26 09477 g007
Figure 8. Analysis of the usage divergence of 3-mers and 4-mers between the 0XY, 1XY, and 2XY subsets and the overall 8-mer based on S1. (A) Analysis of the usage divergence of 3-mers between the 0XY subset and the overall 8-mer based on S1. (B) Analysis of the usage divergence of 4-mers between the 0XY subset and the overall 8-mer based on S1. (C) Analysis of the usage divergence of 3-mers between the 1XY subset and the overall 8-mer based on S1. (D) Analysis of the usage divergence of 4-mers between the 1XY subset and the overall 8-mer based on S1. (E) Analysis of the usage divergence of 3-mers between the 2XY subset and the overall 8-mer based on S1. (F) Analysis of the usage divergence of 4-mers between the 2XY subset and the overall 8-mer based on S1.
Ijms 26 09477 g008
Figure 9. Analysis of the usage divergence of 3-mers and 4-mers between the 0XY, 1XY, and 2XY subsets and the overall 8-mer based on S2. (A) Analysis of the usage divergence of 3-mers between the 0XY subset and the overall 8-mer based on S2. (B) Analysis of the usage divergence of 4-mers between the 0XY subset and the overall 8-mer based on S2. (C) Analysis of the usage divergence of 3-mers between the 1XY subset and the overall 8-mer based on S2. (D) Analysis of the usage divergence of 4-mers between the 1XY subset and the overall 8-mer based on S2. (E) Analysis of the usage divergence of 3-mers between the 2XY subset and the overall 8-mer based on S2. (F) Analysis of the usage divergence of 4-mers between the 2XY subset and the overall 8-mer based on S2.
Ijms 26 09477 g009
Figure 10. The 8-mer distributions in Bombyx mori, Caenorhabditis elegans, Ciona intestinalis, and zebrafish. (A) Phylogenetic tree of the species studied in this paper. (B) Overall 8-mer distribution in Bombyx mori. (C) Distribution of 8-mers containing 0, 1, or 2 CG dinucleotides in Bombyx mori. (D) Overall 8-mer distribution in Caenorhabditis elegans. (E) Distribution of 8-mers containing 0, 1, or 2 CG dinucleotides in Caenorhabditis elegans. (F) Overall 8-mer distribution in Ciona intestinalis. (G) Distribution of 8-mers containing 0, 1, or 2 CG dinucleotides in Ciona intestinalis. (H) Overall 8-mer distribution in zebrafish. (I) Distribution of 8-mers containing 0, 1, or 2 CG dinucleotides in zebrafish.
Ijms 26 09477 g010
Table 1. Genomic features of model organisms in 8-mer evolutionary research.
SpeciesVersionSequence LengthNumber of ChromosomesSource
Homo sapiensGCA_000001405.15
(GRCh38)
230,481,012 bp1UCSC
Saccharomyces cerevisiae (Yeast)GCA_000146055.2
(SacCer3)
12,312,773 bp16UCSC
Caenorhabditis elegansGCF_000002985.6
(WBcel235)
100,272,607 bp6NCBI
Danio rerio (Zebrafish)GCF_000002035.6
(GRCz11)
1,345,101,833 bp25NCBI
Ciona intestinalis (Sea squirt)GCF_000224145.3
(KH)
78,296,155 bp14NCBI
Bombyx mori (Silkworm)GCF_030269925.1
(ASM3026992v2)
461,688,958 bp29NCBI
Note: The number of chromosomes used in this study excludes sex chromosomes and mitochondrial chromosomes.
Table 2. The relative frequencies of 3-mers in all 8-mer.
3-merRF3-merRF
GCG0.358TAC0.908
CGC0.36GTA0.91
CGG0.372TGG0.948
CCG0.374CCA0.957
GGG0.428ACT0.964
CCC0.436AGT0.97
GGC0.502TGT1.092
GCC0.503ACA1.1
CGT0.559GAT1.121
ACG0.56ATC1.128
TCG0.582GTT1.148
CGA0.583AAC1.154
GTC0.618ATG1.168
GAC0.622CAT1.174
GTG0.68TCT1.286
CAC0.684TGA1.288
CTC0.714TCA1.29
GAG0.715AGA1.295
CCT0.728CTT1.375
AGG0.731AAG1.386
GCT0.731TTA1.43
AGC0.734TAA1.433
GGT0.736TTG1.47
ACC0.745CAA1.48
TGC0.791TTC1.508
GCA0.795GAA1.52
CTG0.801TAT1.59
CAG0.804ATA1.596
TCC0.811ATT1.885
GGA0.812AAT1.893
CTA0.819TTT2.503
TAG0.824AAA2.519
Note: RF stands for relative frequency.
Table 3. The relative frequencies of the rare and optimal 4-mer in all 8-mer.
4-mer
Rare
RF4-mer
Optimal
RF
CGCG0.187CAAA2.05
CGGG0.237TTCT2.055
CCCG0.245TCTT2.063
GCGC0.288AGAA2.077
CCGG0.298AAGA2.086
GGGG0.308TTTC2.197
CCCC0.318GAAA2.21
GCCG0.324TATT2.239
CGGC0.325ATAT2.258
CCGC0.329AATA2.262
GCGG0.331AATT2.361
GGCG0.348ATTT2.691
GGGC0.351AAAT2.708
CGCC0.353TTTT3.756
GCCC0.356AAAA3.786
Note: RF stands for relative frequency.
Table 4. Observed peak distances and permutation p-values for CG-based 8-mer comparisons across species.
SpeciesObserved Distance (0CG vs. 1CG)Observed Distance (0CG vs. 2CG)Observed Distance (1CG vs. 2CG)Permutation p-value (0CG vs. 1CG)Permutation p-Value (0CG vs. 2CG)Permutation p-Value (1CG vs. 2CG)
Yeast7195240.309800.0015
Bombyx mori10741037370.057500.4764
Caenorhabditis elegans2113181070.435700
Ciona intestinalis317403860.025900
Zebrafish12,67515,7843109000
Note: A value of 0 for the permutation p-value indicates p ≤ 0.01.
Disclaimer/Publisher’s Note: The statements, opinions and data contained in all publications are solely those of the individual author(s) and contributor(s) and not of MDPI and/or the editor(s). MDPI and/or the editor(s) disclaim responsibility for any injury to people or property resulting from any ideas, methods, instructions or products referred to in the content.