Article

GmSAUR46b Integrates Light Signals to Regulate Leaf Midrib Thickness and Stem Trichome Density in Soybean

1
Xianghu Laboratory, Hangzhou 311200, China
2
Institute of Crops and Nuclear Technology Utilization, Zhejiang Academy of Agricultural Sciences, Hangzhou 310021, China
3
College of Agriculture, Nanjing Agricultural University, Nanjing 210095, China
*
Authors to whom correspondence should be addressed.
Int. J. Mol. Sci. 2025, 26(18), 9200; https://doi.org/10.3390/ijms26189200
Submission received: 21 August 2025 / Revised: 12 September 2025 / Accepted: 14 September 2025 / Published: 20 September 2025

Abstract

Soybean (Glycine max (L.) Merr.) is a vital crop for the global supply of protein and oil, with its growth and development being regulated by genetic, hormonal, and environmental factors, particularly light and hormone signaling. The Small Auxin-Up RNA (SAUR) gene family plays a crucial role in plant growth regulation; however, the molecular mechanisms by which GmSAUR46 integrates photosynthesis and hormonal networks in soybean remain unclear. In this study, we focused on GmSAUR46b (Glyma.19G182600.1) and employed CRISPR/Cas9-mediated knockout and 35S-driven overexpression lines, alongside wild-type soybean (cv. Williams 82), to investigate its function. RNA sequencing (RNA-Seq) was conducted on shoot apical meristems, stems, and leaves at three developmental stages (V1, V2, V3), followed by transcriptomic analyses, including differential gene expression (DEG) identification and functional enrichment (GO, KEGG, KOG). Anatomical studies using paraffin sectioning and scanning electron microscopy (SEM) assessed the leaf midrib thickness and stem trichome density under varying light conditions. The transcriptomic results revealed DEGs enriched in pathways related to cell wall metabolism, hormone response, and photosynthesis. Anatomical analyses demonstrated that GmSAUR46b specifically regulates the leaf midrib thickness and stem trichome density in a light-dependent manner: under shade, the overexpression lines exhibited increased midrib thickness and trichome density, whereas the knockout lines showed reduced trichome density. Additionally, novel transcripts associated with stress resistance, hormone metabolism, and photosynthesis were identified, expanding the known soybean gene repertoire. Collectively, GmSAUR46b functions as a central hub integrating light signals with hormone and cell wall pathways to modulate soybean growth, particularly leaf and stem traits. This study advances understanding of SAUR gene function in soybean and provides valuable insights for molecular breeding aimed at improving adaptability and yield under diverse environmental conditions.

1. Introduction

Soybean (Glycine max (L.) Merr.) is one of the most economically important leguminous crops worldwide, serving as a primary source of plant-based protein and vegetable oil for both human consumption and animal feed [1]. Its growth and development are tightly regulated by a complex interplay of genetic [2], hormonal, and environmental factors. Among these, light signaling and hormone-mediated pathways play pivotal roles in coordinating key agronomic traits such as morphogenesis [3,4,5,6,7,8,9,10], photosynthesis [11,12,13], leaf morphology [14,15,16,17], trichome development, and defense responses [18,19,20]. Understanding the molecular mechanisms underlying these regulatory networks is essential for optimizing soybean yields and adaptability under diverse environmental conditions.
The Small Auxin-Up RNA (SAUR) gene family, a large group of early auxin-responsive genes, has emerged as a central regulator of plant growth and development [21,22,23,24,25,26]. Members of this family are widely implicated in mediating cell elongation and expansion, such as hypocotyl elongation [17,27,28,29,30,31,32,33,34,35,36,37]; plant height [38,39]; organ morphogenesis, including leaf senescence, root development, stamen filament elongation, apical hook development, and hypocotyl elongation [37,40,41,42,43,44,45]; hormone signal transduction [46,47,48,49]; light response [50,51]; and responses to both biotic and abiotic stresses [52,53,54,55]. For instance, in Arabidopsis thaliana, constitutive expression of the AtSAUR19 gene in tomato results in hypocotyl elongation that is independent of auxin [35]. A group of PP2C.D phosphatases localized to the plasma membrane exerts a negative regulatory effect on SAUR-mediated cell expansion [27]. Additionally, SAUR proteins and PP2C.D phosphatases modulate H+-ATPases and K+ channels, thereby governing stomatal movements [56]. In grape (Vitis vinifera L.), SAUR041 is a candidate regulator of berry size [57].
Notably, the regulation of SAUR genes exhibits remarkable diversity [26]. Their expression can be intricately modulated by various hormones, including auxin [58,59], cytokinin [59], gibberellic acid (GA) [60,61], brassinosteroids [59,62,63,64], ethylene [65], abscisic acid (ABA) [66,67], and jasmonic acid (JA) [67]. Additionally, environmental cues such as light [51,59,68,69], cold [70,71], drought [71,72,73], high temperature [74], and high salinity [71,73] also significantly influence SAUR expression across different plant species. Despite the identification of GmSAUR as a potential regulator in soybean [8], the molecular mechanisms underlying its integration of photosynthesis and hormonal networks remain elusive.
In this study, we focused on a candidate gene, GmSAUR46b (Glyma.19G182600.1), a member of the GmSAUR gene family in soybean. We aimed to elucidate its role in soybean growth and development using existing gene-edited (knockout) and overexpression materials available in our laboratory. Preliminary analyses revealed that GmSAUR46b exhibits dynamic expression patterns in response to light–dark transitions, suggesting its potential involvement in light-dependent regulatory pathways. To systematically dissect the function and molecular mechanism of GmSAUR46b, we employed a multidimensional approach combining genetic manipulation, transcriptome profiling, and phenotypic characterization. RNA sequencing (RNA-Seq) was performed on CRISPR/Cas9-mediated knockout (KO) lines and 35S-driven overexpression (OE) lines of GmSAUR46b, alongside wild-type (WT) soybean (cv. Williams 82, W82), across three key tissues—shoot apical meristems (SAMs), stems, and leaves—at three developmental stages (V1, V2, V3). This approach allowed us to capture tissue- and stage-specific gene expression dynamics associated with GmSAUR46b perturbation. Transcriptomic analyses, including identification of differentially expressed genes (DEGs) and functional enrichment (GO, KEGG, KOG), were complemented by the discovery and characterization of novel transcripts, providing insights into both known and unannotated regulatory elements. Given that the thickness of the leaf midrib directly impacts the mechanical support and vascular transport, while stem trichomes serve as physical barriers against biotic and abiotic stresses [75,76], we further validated the transcriptome analysis results by conducting anatomical studies using paraffin sectioning and scanning electron microscopy (SEM) to assess the leaf midrib thickness and stem trichome density under varying light conditions. These analyses indicate that GmSAUR46b plays a significant regulatory role in shaping soybean morphology.
By integrating these datasets, we aimed to address the following three core objectives: (1) to define the role of GmSAUR46b in mediating light-responsive growth and development in soybean; (2) to identify the downstream molecular pathways—particularly those involved in hormone metabolism, cell wall modification, and photosynthesis—that are regulated by GmSAUR46b; and (3) to characterize the tissue-specific and light-dependent nature of these regulatory mechanisms. Ultimately, this research not only advances our understanding of the functional diversity of SAUR genes in soybean but also provides valuable insights for the genetic improvement and molecular breeding of soybean, with the potential to enhance the adaptability and yield under varying environmental conditions.

2. Results

2.1. Identification and Functional Screening of GmSAUR46b as a Candidate Gene Responsive to Light Signaling

The genomic sequence alignment across the soybean genome identified six homologous genes of GmSAUR46 (Figure 1A–C). qRT-PCR analysis showed that the expression of the gene with the ID Glyma.19G182600.1 (designated as GmSAUR46b) sharply increased at the onset of light and dark treatment, then rapidly decreased thereafter. This gene was significantly responsive to light signals (Figure 1D), suggesting its role in light-dependent regulation.
Preliminary phenotypic characterization revealed that the GmSAUR46b knockout lines exhibited significantly reduced plant height compared to the wild type (Figure 1E–I). To investigate the role of GmSAUR46b in soybean growth and development, and to elucidate its underlying molecular mechanisms, we utilized the existing GmSAUR46b KO and OE lines available in our laboratory for functional validation. SAMs, leaves, and stems were collected from the GmSAUR46b KO and OE lines at three developmental stages (V1, V2, and V3) for transcriptome sequencing. Through transcriptome analysis, we aimed to clarify the function of GmSAUR46b in soybean growth and development and to identify its potential molecular mechanisms.

2.2. Identification and Characterization of Novel Transcripts

Using StringTie software (v2.2.1) for transcript assembly, new transcripts and genes were successfully identified. The types and quantities of these novel transcripts are summarized in Table 1. Among them, the “j” type (multi-exon transcripts with at least one matching exon) is the most abundant, totaling 33,394. Additionally, there are 4204 “o” types (transcripts partially overlapping with other reference exons on the same strand), 3353 “u” types (unknown novel transcripts), 1543 “x” types (exon overlaps on the opposite strand), and 260 “i” types (transcripts completely contained within the introns of the reference transcripts) (Table 1).
TransDecoder was used to predict the coding sequences of the newly identified transcripts, and the coding sequence (CDS) length distribution is presented in Figure S1. The statistical results of the functional annotation of the novel transcripts are shown in Table S1. A total of 42,754 transcript sequences were analyzed, of which 38,187 (89.32%) received at least one type of annotation; 27,677 (64.74%) were annotated in the KEGG database; 13,456 (31.47%) were annotated in the KEGG Pathway database; and 38,161 (89.26%) were annotated in the Nr database.

2.3. Functional Annotation of New Transcripts via GO, KEGG, and KOG Analyses

To elucidate the functional roles of the new transcripts in key biological processes—including stress resistance, hormone metabolism, photosynthesis, chloroplast and thylakoid development, trichome density, and stem elongation—we performed Gene Ontology (GO), Kyoto Encyclopedia of Genes and Genomes (KEGG), and euKaryotic Orthologous Groups (KOG) annotations on the new transcripts. These annotation were subsequently classified according to the KEGG metabolic pathways (Figure 2).
For the GO annotation (Figure 2A), within the “biological process” category, terms such as “defense response”, “phosphorylation”, “cell division”, and “auxin-activated signaling pathway” were significantly enriched. The “defense response” is closely associated with stress resistance. “Protein phosphorylation” serves as a key mechanism in signal transduction and may participate in hormone-related signaling pathways. In the “cellular component” category, a substantial number of genes were assigned to both “plasma membrane” and “chloroplast”. The “plasma membrane” functions as a critical site for hormone perception and stress signal reception, while the “chloroplast” is the core organelle for photosynthesis, suggesting roles in chloroplast development and photosynthetic processes. At the “molecular function” level, “protein kinase activity” and “ATP binding” were prominent. “Protein kinase activity” is essential for mediating signal transduction cascades that regulate hormone metabolism, and “ATP binding” provides energy support for various biological processes, including photosynthesis and cell growth related to stem elongation and trichome formation.
Regarding the KEGG annotation (Figure 2B), the new transcripts were categorized into functional classes, including cellular processes, environmental information processing, genetic information processing, metabolism, and organismal systems. In terms of “stress resistance”, the “Environmental adaptation” pathway contained 1680 transcripts, suggesting a substantial role in enabling the organism to cope with environmental stresses. For “hormone metabolism and signal transduction”, the “Signal transduction” pathway (with 1744 transcripts) likely mediates hormone-related signaling, which is fundamental for regulating hormone levels and their downstream effects on growth and development. Concerning “photosynthesis, chloroplast development, and thylakoid development”, although no single pathway exclusively corresponds to all these processes, the “Energy metabolism” pathway (with 424 transcripts) is critical for providing energy. Additionally, pathways involved in cellular component biosynthesis may contribute to the construction of chloroplasts and thylakoids, as well as support photosynthetic reactions. For “trichome number and stem elongation”, which are associated with cell growth and development, the “Cell motility” pathway (with 392 transcripts), along with pathways related to cell cycle regulation, might influence trichome formation and stem elongation by modulating cell division, expansion, and movement. Collectively, the GO and KEGG annotations provide comprehensive insights into the potential involvement of transcripts in the targeted biological processes, laying a solid foundation for subsequent in-depth investigations.
For the KOG annotation (Figure 2C), the new transcripts were categorized into various functional groups, and the gene counts within each group were analyzed. For “stress resistance”, 57 genes were assigned to “Defense mechanisms” (category V), providing a foundation for exploring stress-responsive regulation. Regarding “hormone metabolism and signal transduction”, the “Signal transduction mechanisms” group (category T) contained 1051 genes, which may be involved in mediating hormone-related signaling pathways. Concerning “photosynthesis, chloroplast development, and thylakoid development”, although no single category directly corresponds to all these processes, genes in groups related to energy production (such as “Energy production and conversion”, category C) and cellular structure (such as “Cell wall/membrane/envelope biogenesis”, category M) could potentially participate in these chloroplast-associated events. For “trichome number and stem elongation”, which are related to cell growth and development, genes in “Cell cycle control, cell division, chromosome partitioning” (category D) and “Cytoskeleton” (category Z) might play roles in regulating these traits. This functional classification provides insights into the potential involvement of the new transcripts in the biological processes we focused on, guiding the subsequent targeted studies.

2.4. Evolutionary and Genomic Distribution Analyses of Transcripts

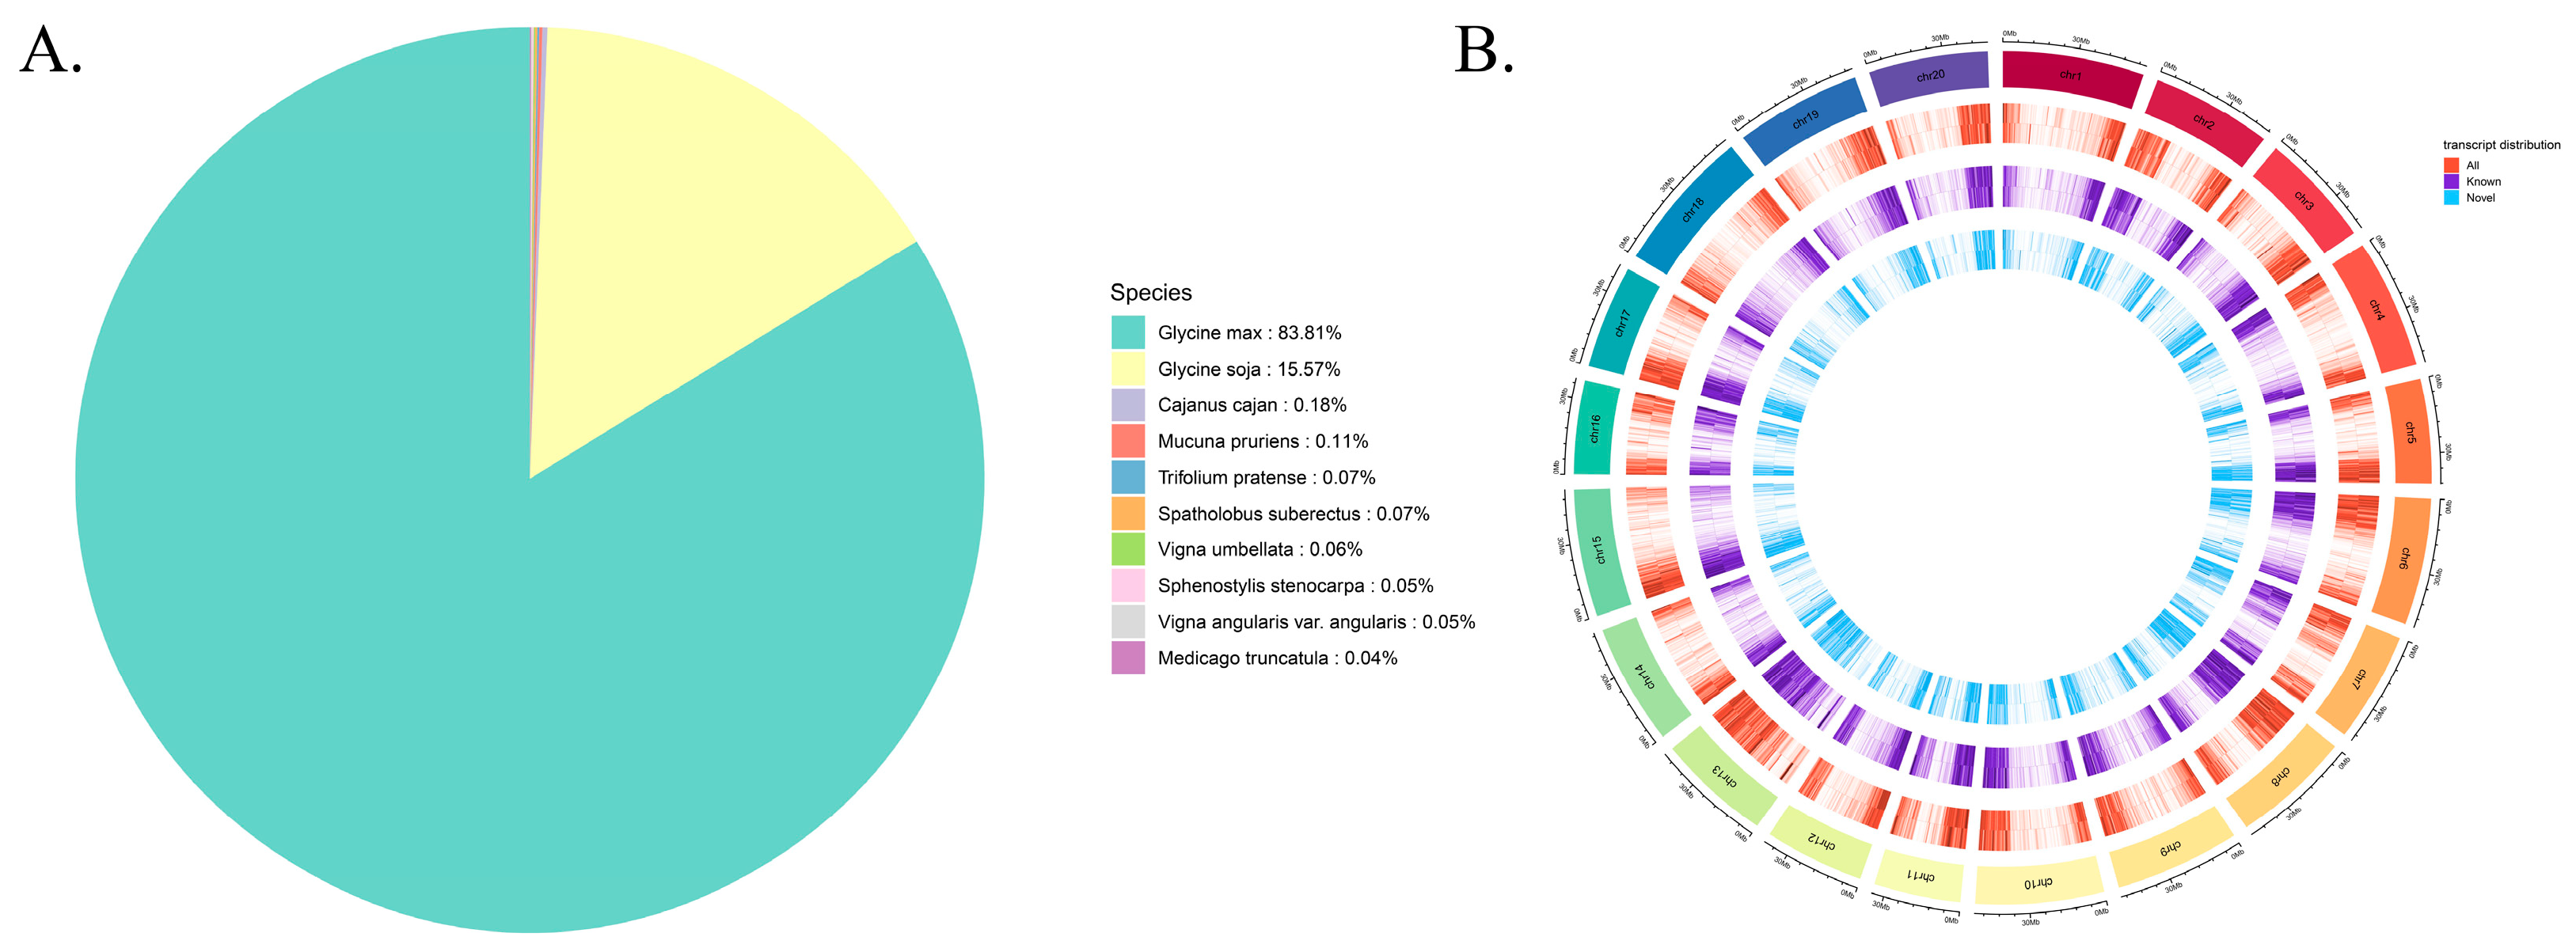
To further investigate the evolutionary relationships and genomic distribution patterns of the transcripts, we analyzed the species distribution based on the Nr annotation (Figure 3A) and transcript density across chromosomes (Figure 3B). For the Nr-annotated species distribution, the transcripts showed the highest similarity to sequences from “Glycine max” (83.81%), followed by “Glycine soja” (15.57%), with only a small proportion matching sequences from other species such as “Cajanus cajan” (0.18%), “Mucuna pruriens” (0.07%), and “Trifolium pratense” (0.07%). This high homology to “Glycine max” and “Glycine soja” indicates a close evolutionary relationship, providing a reliable reference for the subsequent functional inference based on known genes from these related species. Regarding the transcript density distribution map, from the outermost to the innermost layers, it depicts the chromosomes, all transcripts, known transcripts, and novel transcripts, while also distinguishing between positive and negative strands. The transcripts, including both known and novel ones, exhibit an uneven distribution across different chromosomes. Notably, regions with relatively high densities of all the transcripts were observed, and the distribution patterns of the known and novel transcripts showed both overlaps and differences, suggesting complex transcriptional regulation and potential novel transcriptional events in specific chromosomal regions. Collectively, the Nr annotation clarifies the evolutionary context of the transcripts, and the chromosome-level density distribution provides insights into their genomic organization, with the two analyses complementing each other to enhance our understanding of the transcripts.

2.5. Distribution of Gene Expression Levels Across Samples

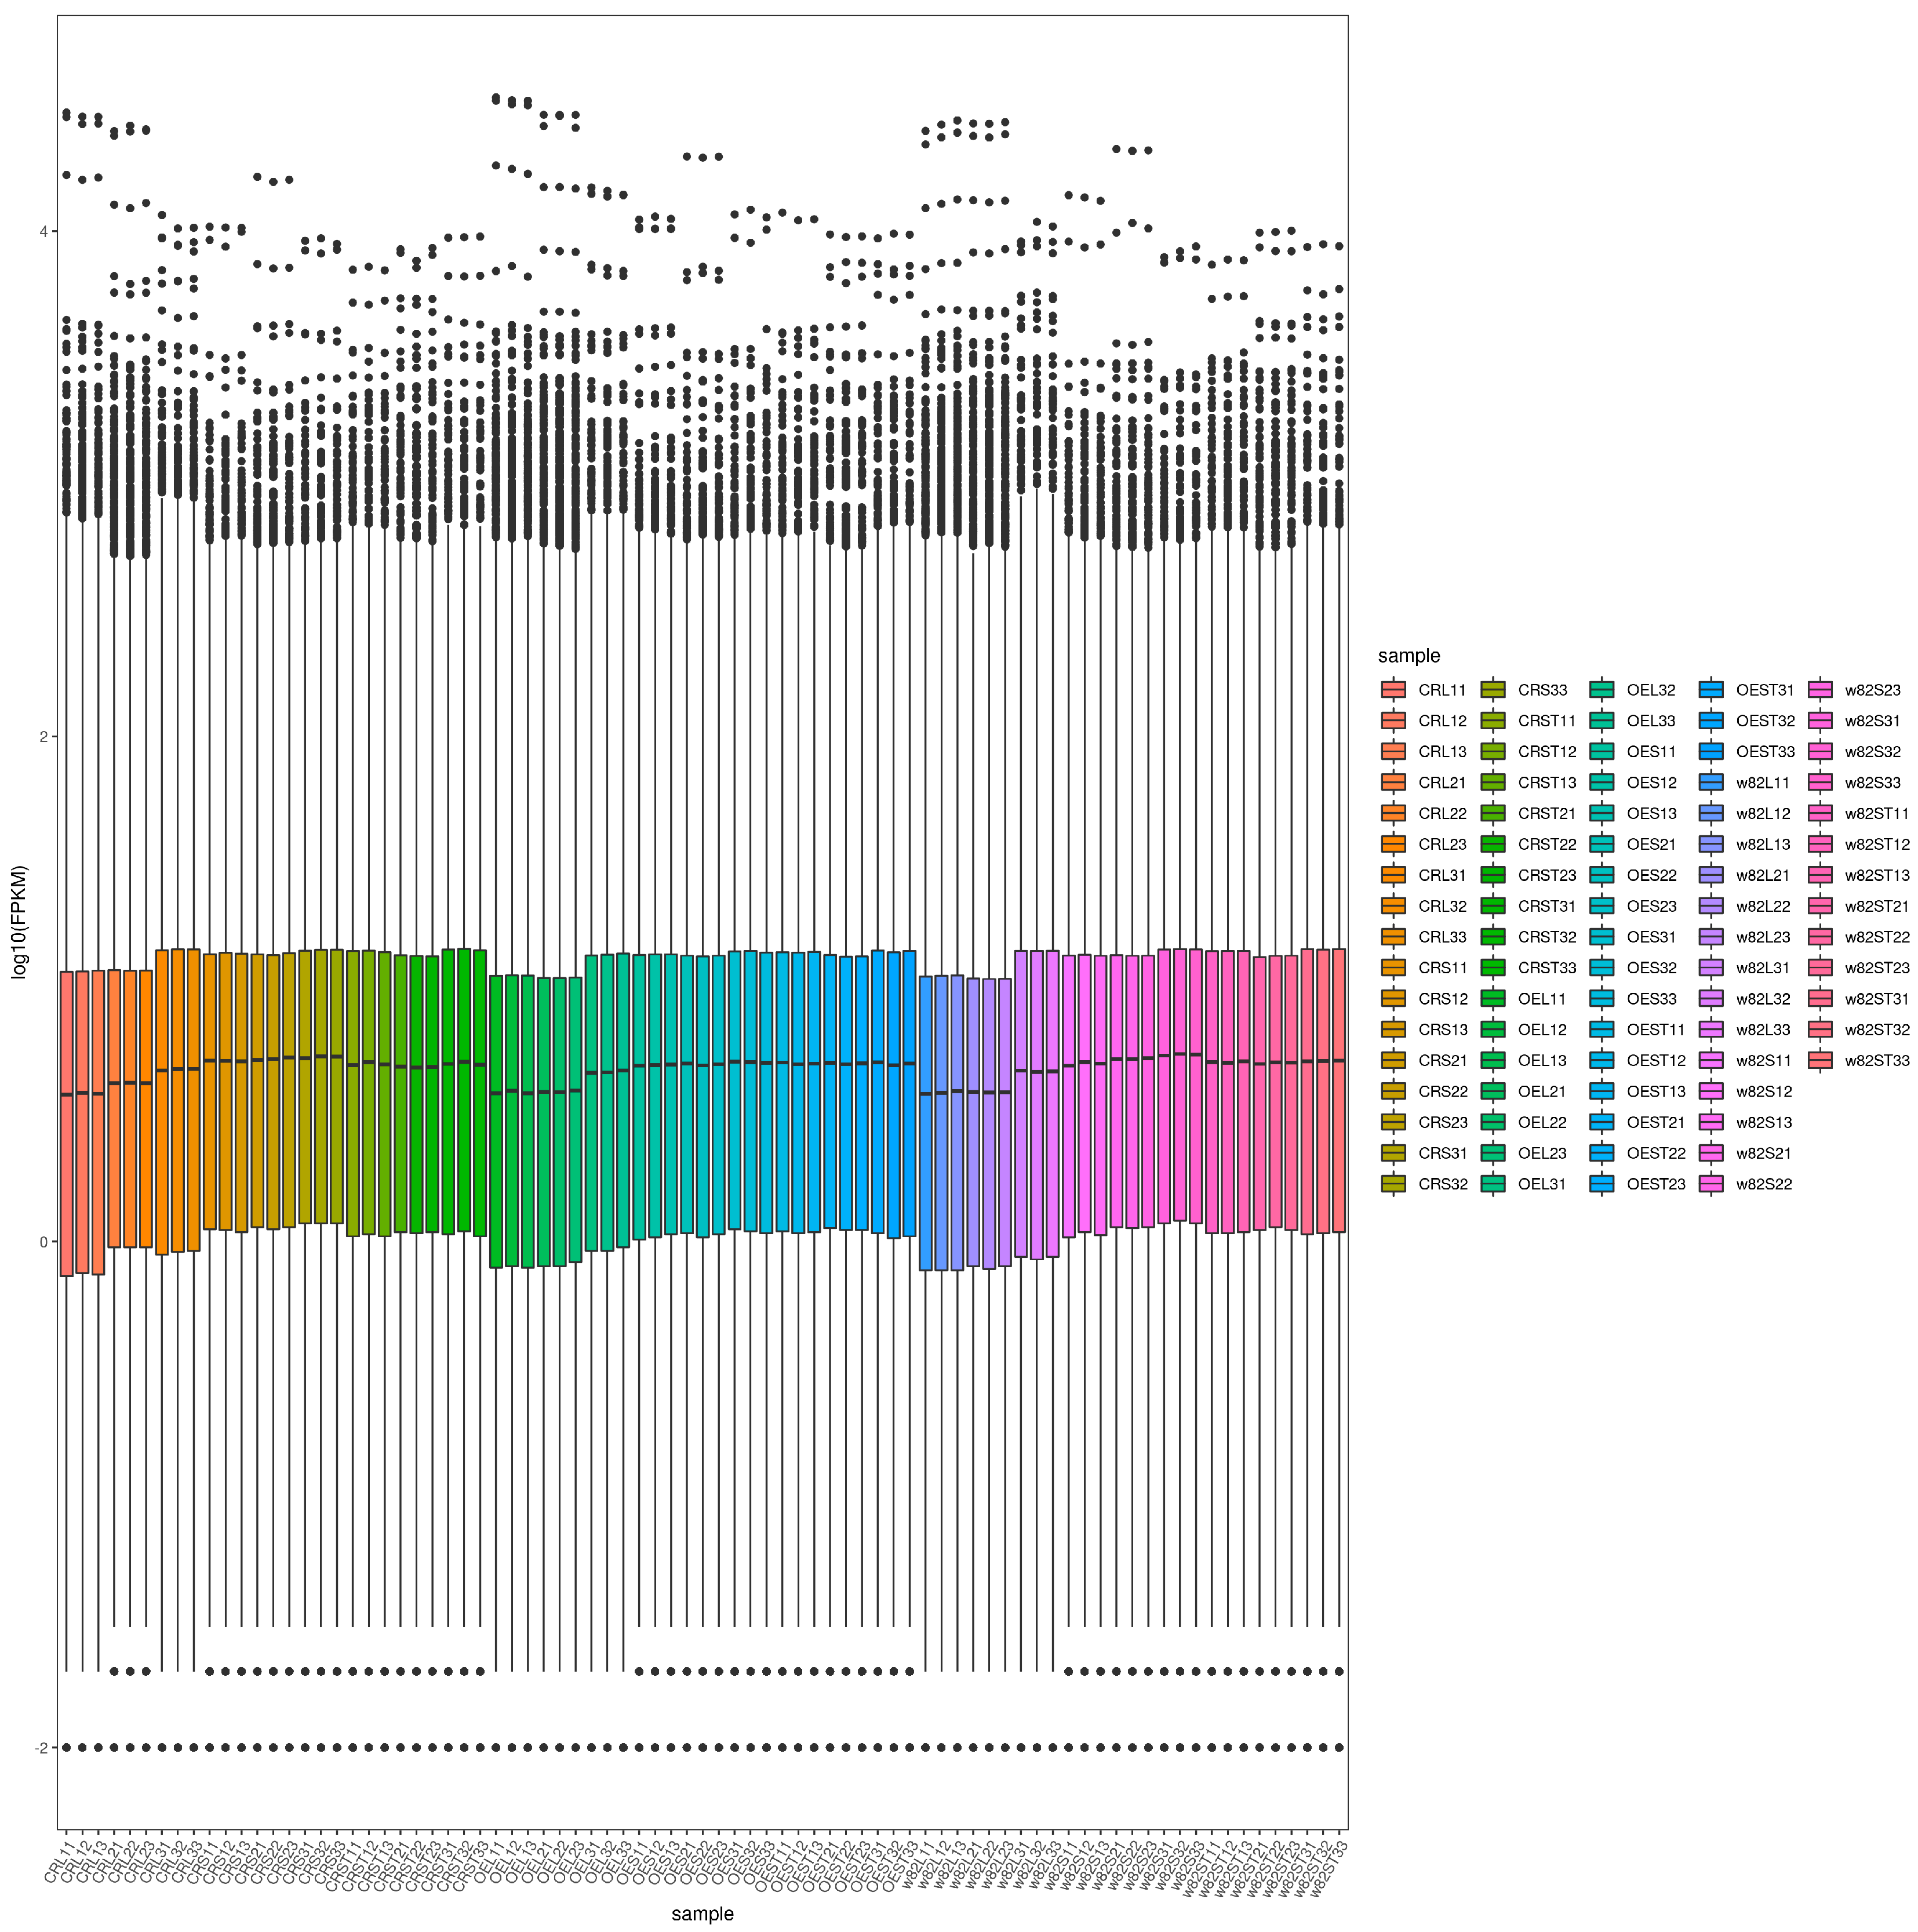
To visualize the distribution of the gene expression levels across samples, we generated the FPKM density distribution graph (Figure S2) and the box plot (Figure 4). The box plot illustrates the distribution of the gene expression levels across samples, with each box displaying five key statistics from top to bottom: maximum value, upper quartile, median, lower quartile, and minimum value. As shown, the median values across different samples were relatively consistent, indicating a stable overall trend in gene expression within the transcriptomic profiles. Additionally, the ranges between the maximum and minimum values, as well as the interquartile ranges, varied among the samples, reflecting differences in the dispersion of gene expression levels. These variations may be associated with the distinct genetic backgrounds of GmSAUR46b mutant materials.

2.6. Transcriptomic Analysis Reveals Enrichment of DEGs in Hormone and Photosynthesis Pathways

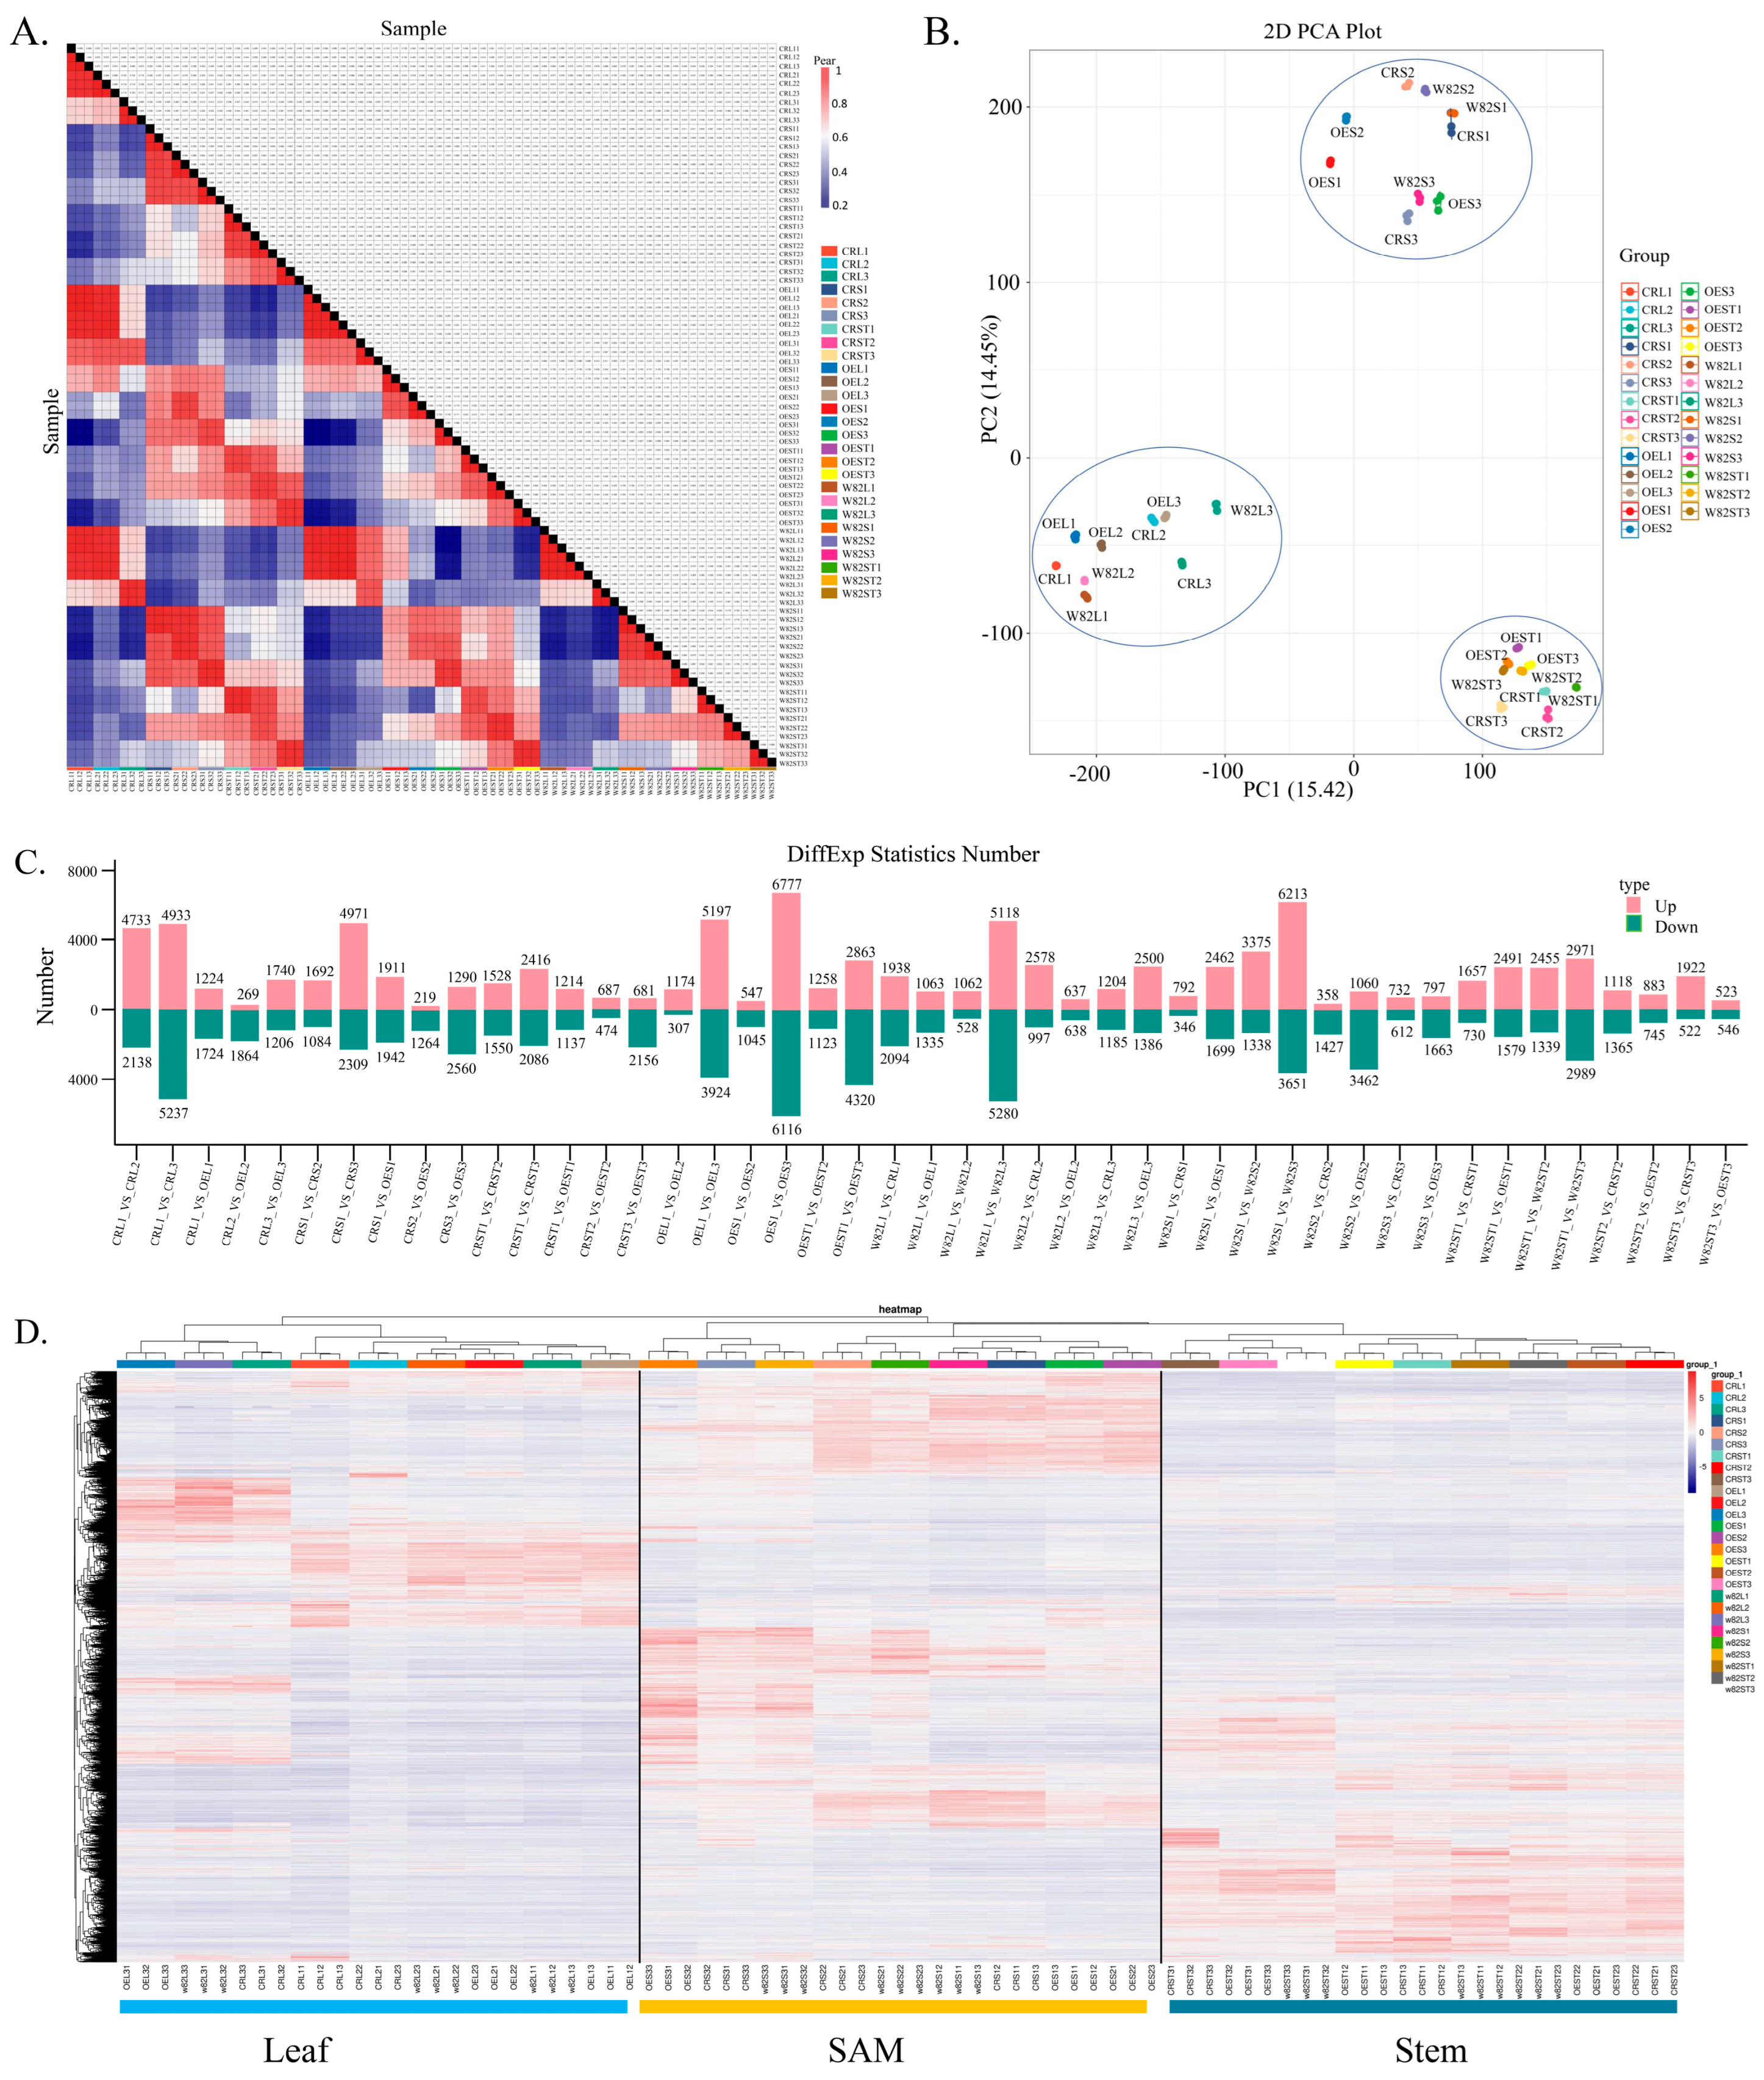
To assess the transcriptomic variations among samples, we first performed clustering analysis (Figure 5A), which revealed distinct clustering patterns that reflected the relationships between samples. The 2D PCA plot (Figure 5B) further illustrated the sample distribution, with PC1 (15.42%) and PC2 (14.45%) capturing the major sources of variation. Samples within the same group tended to cluster together, indicating strong biological reproducibility. Subsequently, we analyzed the number of DEGs across various comparison groups (Figure 5C). The results showed that the number of DEGs varied significantly among the different comparison combinations. For all the DEGs, clustering analysis was conducted on both samples and genes based on their expression profiles, with the results presented as a heatmap (Figure 5D). In this heatmap, each column represents a sample, and each row represents a gene. Notably, these genes clustered into three distinct groups that corresponded well with the three tissue types: leaf, SAM, and stem. This clustering pattern indicates that the differentially expressed genes exhibit tissue-specific expression, suggesting that GmSAUR46b may regulate soybean growth and development through tissue-specific modulation of gene expression in leaves, SAMs, and stems.

2.7. Functional Enrichment Analysis of DEGs

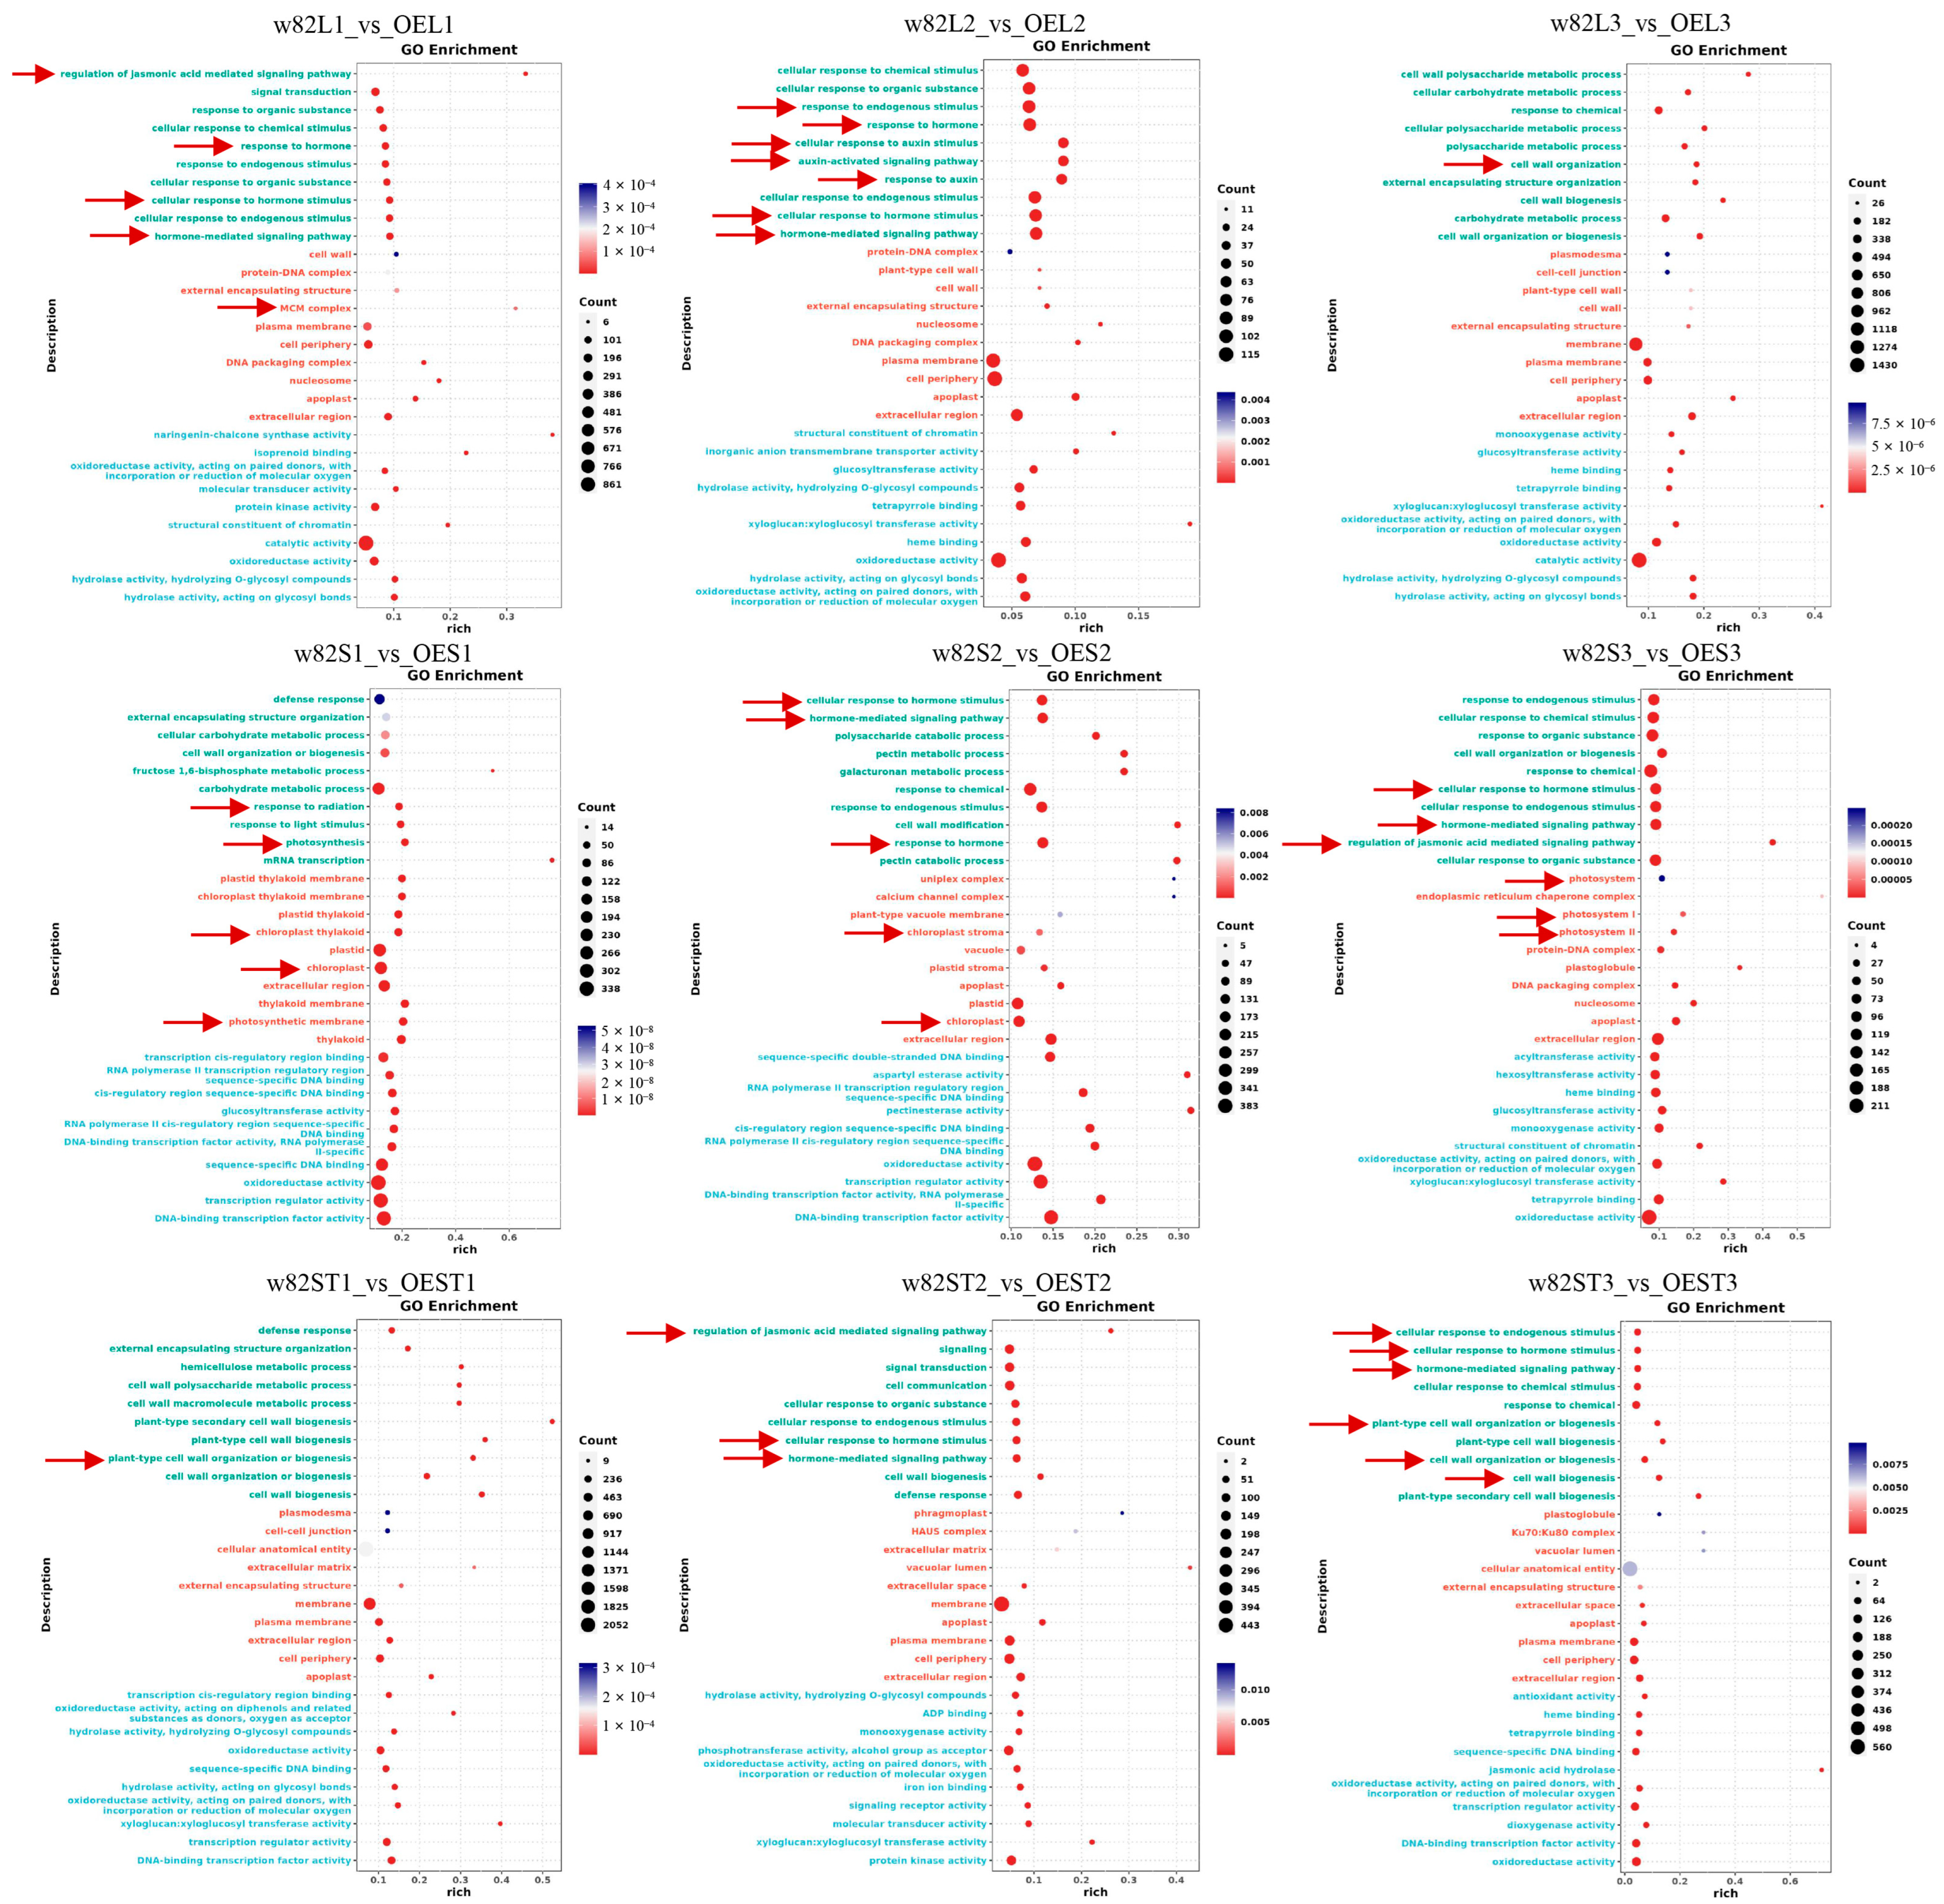
To elucidate the functional roles of the DEGs, GO enrichment analysis was performed for each comparison group (Figure 6 and Figure S3). Notably, despite variations in the number of DEGs across the different comparison groups (Figure 5C), these DEGs were significantly enriched in several key biological processes. Specifically, they were predominantly associated with terms related to “cell wall formation and metabolism” (such as “cell wall organization”, “plant type cell wall organization or biogenesis”), “hormone metabolism and response” (including “regulation of jasmonic acid mediated signaling pathway”, “response to hormone”, “hormone-mediated signaling pathway”, “response to endogenous stimulus”, “response to auxin”), and “photosynthetic systems and chloroplast development” (like “photosynthesis”, “chloroplast”, “photosynthetic membrane”, “chloroplast stroma”, “photosystem”, “photosystem I”, “photosystem II”) (Figure 6 and Figure S3). Importantly, these findings are consistent with the previously described GO, KEGG, and KOG analyses of the transcripts (Figure 2), collectively indicating that cell wall-related processes, hormone-associated pathways, and photosynthetic machinery play critical roles in the observed transcriptomic changes.

2.8. Analysis of Alternative Splicing Events and Transcription Factor Families

To investigate the alternative splicing (AS) events and transcription factor (TF) families, we first analyzed the distribution of AS event types. Statistical plots were generated for different AS types in each sample (Figure S4A), identifying multiple AS event types, including A3SS, A5SS, MXE, RI, and SE, each exhibiting distinct proportions across samples. We then used rMATS to detect differential AS events among samples and counted the number of differential AS events for the comparison groups (Figure S4B). The distribution patterns of the AS event types differed from the overall sample distribution, indicating that AS events may be regulated in a group-specific manner. Additionally, the TF families were analyzed by performing TF prediction and identification using the PlantTFDB (Figure S4C). Various TF families were detected, with C3H accounting for 12.58%, MYB_related for 11.99%, MYB for 9.70%, and other families such as HB—other (6.62%) and HD-ZIP (5.96%) also representing notable proportions. These results suggest the diversity and complexity of the TF families involved in regulatory processes.

2.9. GmSAUR46b Specifically Regulates the Leaf Midrib Thickness in a Light-Dependent Manner and Modulates the Epidermal/Mesophyll Responses to Light Signals

To further validate the role of GmSAUR46b in soybean growth and development, we subjected the GmSAUR46b KO and OE lines, along with WT plants, to different light conditions (Figure S5). This approach was based on prior functional enrichment and expression pattern analyses of transcriptome data, aiming to assess their responses to light signals. Following treatment under varying light regimes, significant changes in leaf development were observed. Therefore, paraffin sectioning was employed to investigate the impact of GmSAUR46b on the anatomical structure of soybean leaves.
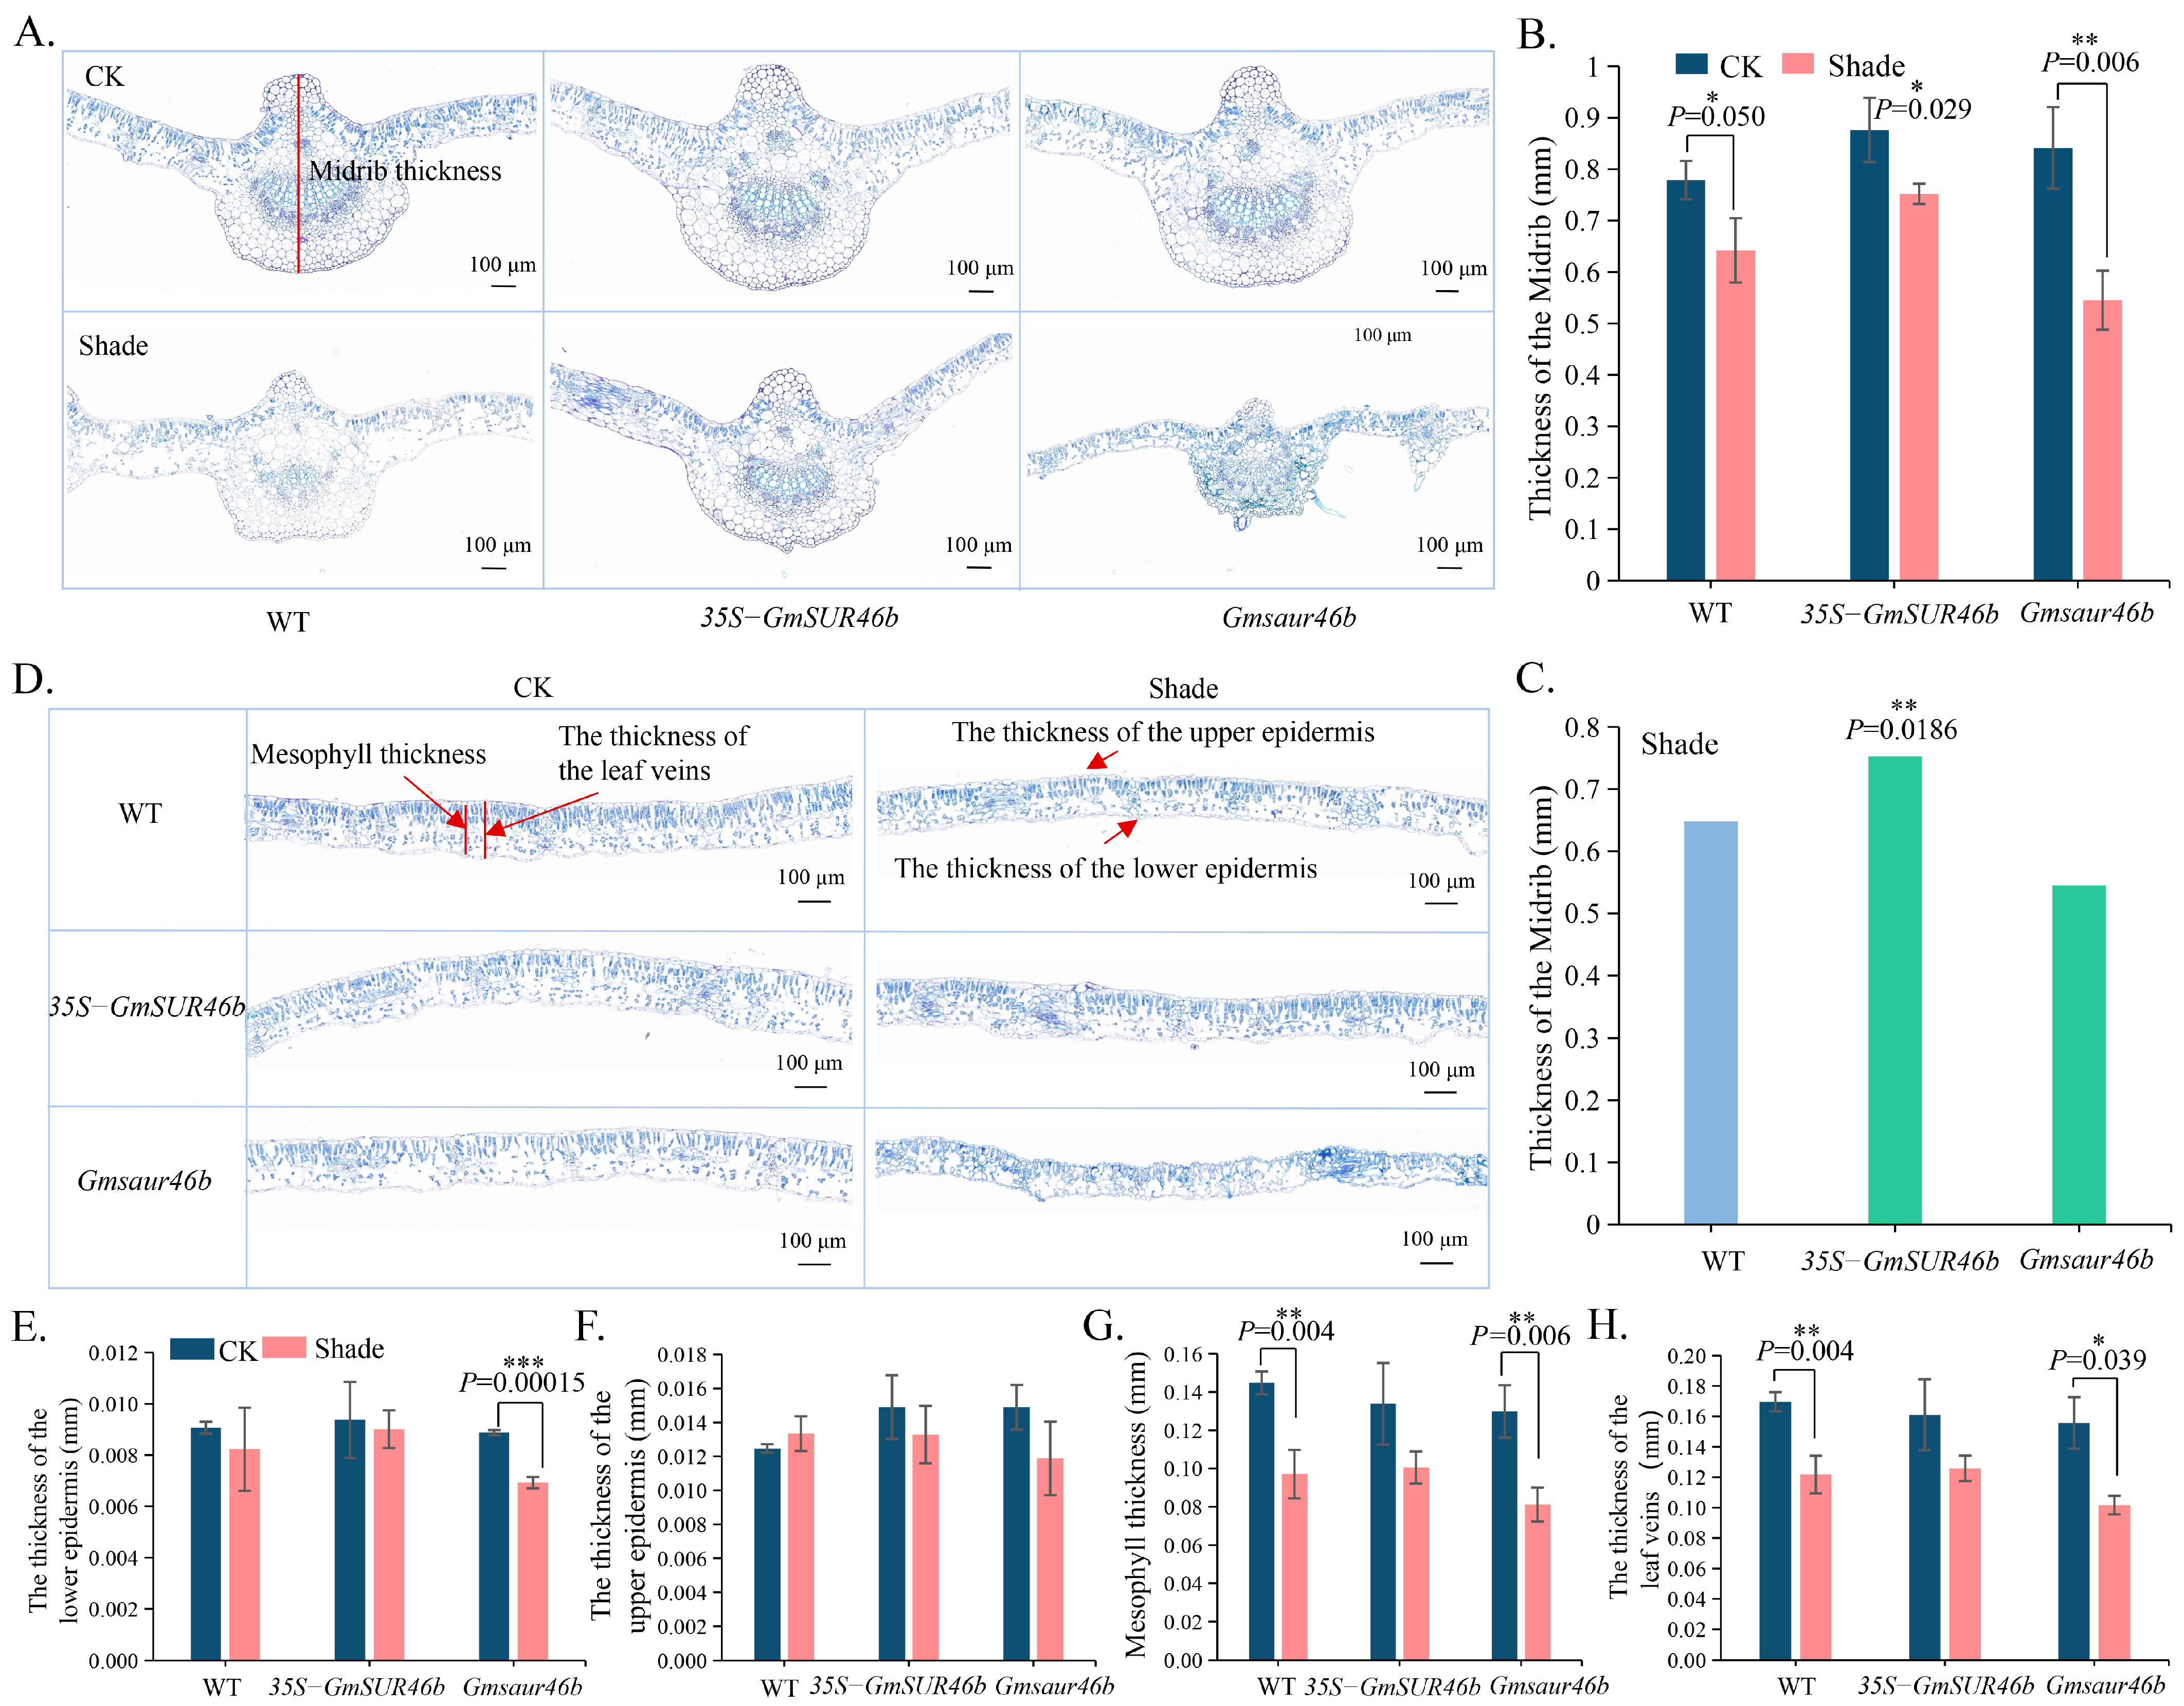
The results showed that GmSAUR46b specifically regulates the central region of the leaf midrib (Figure 7, Table S2). Under normal light conditions, the thickness of the midrib in the GmSAUR46b OE lines was 0.88 mm, which is 11.36% greater than that in the WT plants (0.78 mm), although this difference was not statistically significant (p = 0.081). Similarly, the midrib central thickness in the GmSAUR46b KO lines was 0.84 mm, representing a 7.69% increase compared to the WT; however, no significant difference was observed (p = 0.284) (Figure 7A,B).
Shading treatment further enhanced the regulatory effect of GmSAUR46b on the midrib thickness, suggesting a light-dependent regulatory mechanism. Under shaded conditions, the midrib central thickness of the OE lines reached 0.75 mm, representing a significant increase of 15.38% compared to the WT plants (0.65 mm) under the same shading conditions (p = 0.019) (Figure 7C). Additionally, the midrib central thickness of the OE lines under shading was significantly reduced by 14.33% compared to that under normal light (p = 0.029) (Figure 7B). For the KO lines under shading, the midrib central thickness measured 0.545 mm, showing no significant difference from the WT under shading; however, it was significantly reduced by 35.71% compared to the KO lines under normal light (p = 0.0063) (Figure 7A–C). Collectively, these results indicate that GmSAUR46b plays a specific role in regulating the central thickness of the leaf midrib, and this regulation is strongly influenced by the light conditions.
Additionally, in the GmSAUR46b OE lines, there were no significant differences in the thickness of the upper epidermis, lower epidermis, mesophyll, or leaf blade between normal light and shade conditions. In contrast, the GmSAUR46b KO lines exhibited a significantly thinner lower epidermis, mesophyll, and leaf blade under shade conditions compared to normal light conditions. However, under both normal light and shade conditions, the thicknesses of these leaf structures in the KO lines did not differ significantly from those in the WT plants (Figure 7D–H). These results further support the specificity and light-dependent characteristics of GmSAUR46b in regulating the leaf structure. They also suggest that its function may be localized to specific structures such as the midrib, while its influence on the epidermis and mesophyll may require the combined action of other genes or environmental signals.

2.10. GmSAUR46b Regulates the Stem Trichome Density in a Light-Dependent Manner

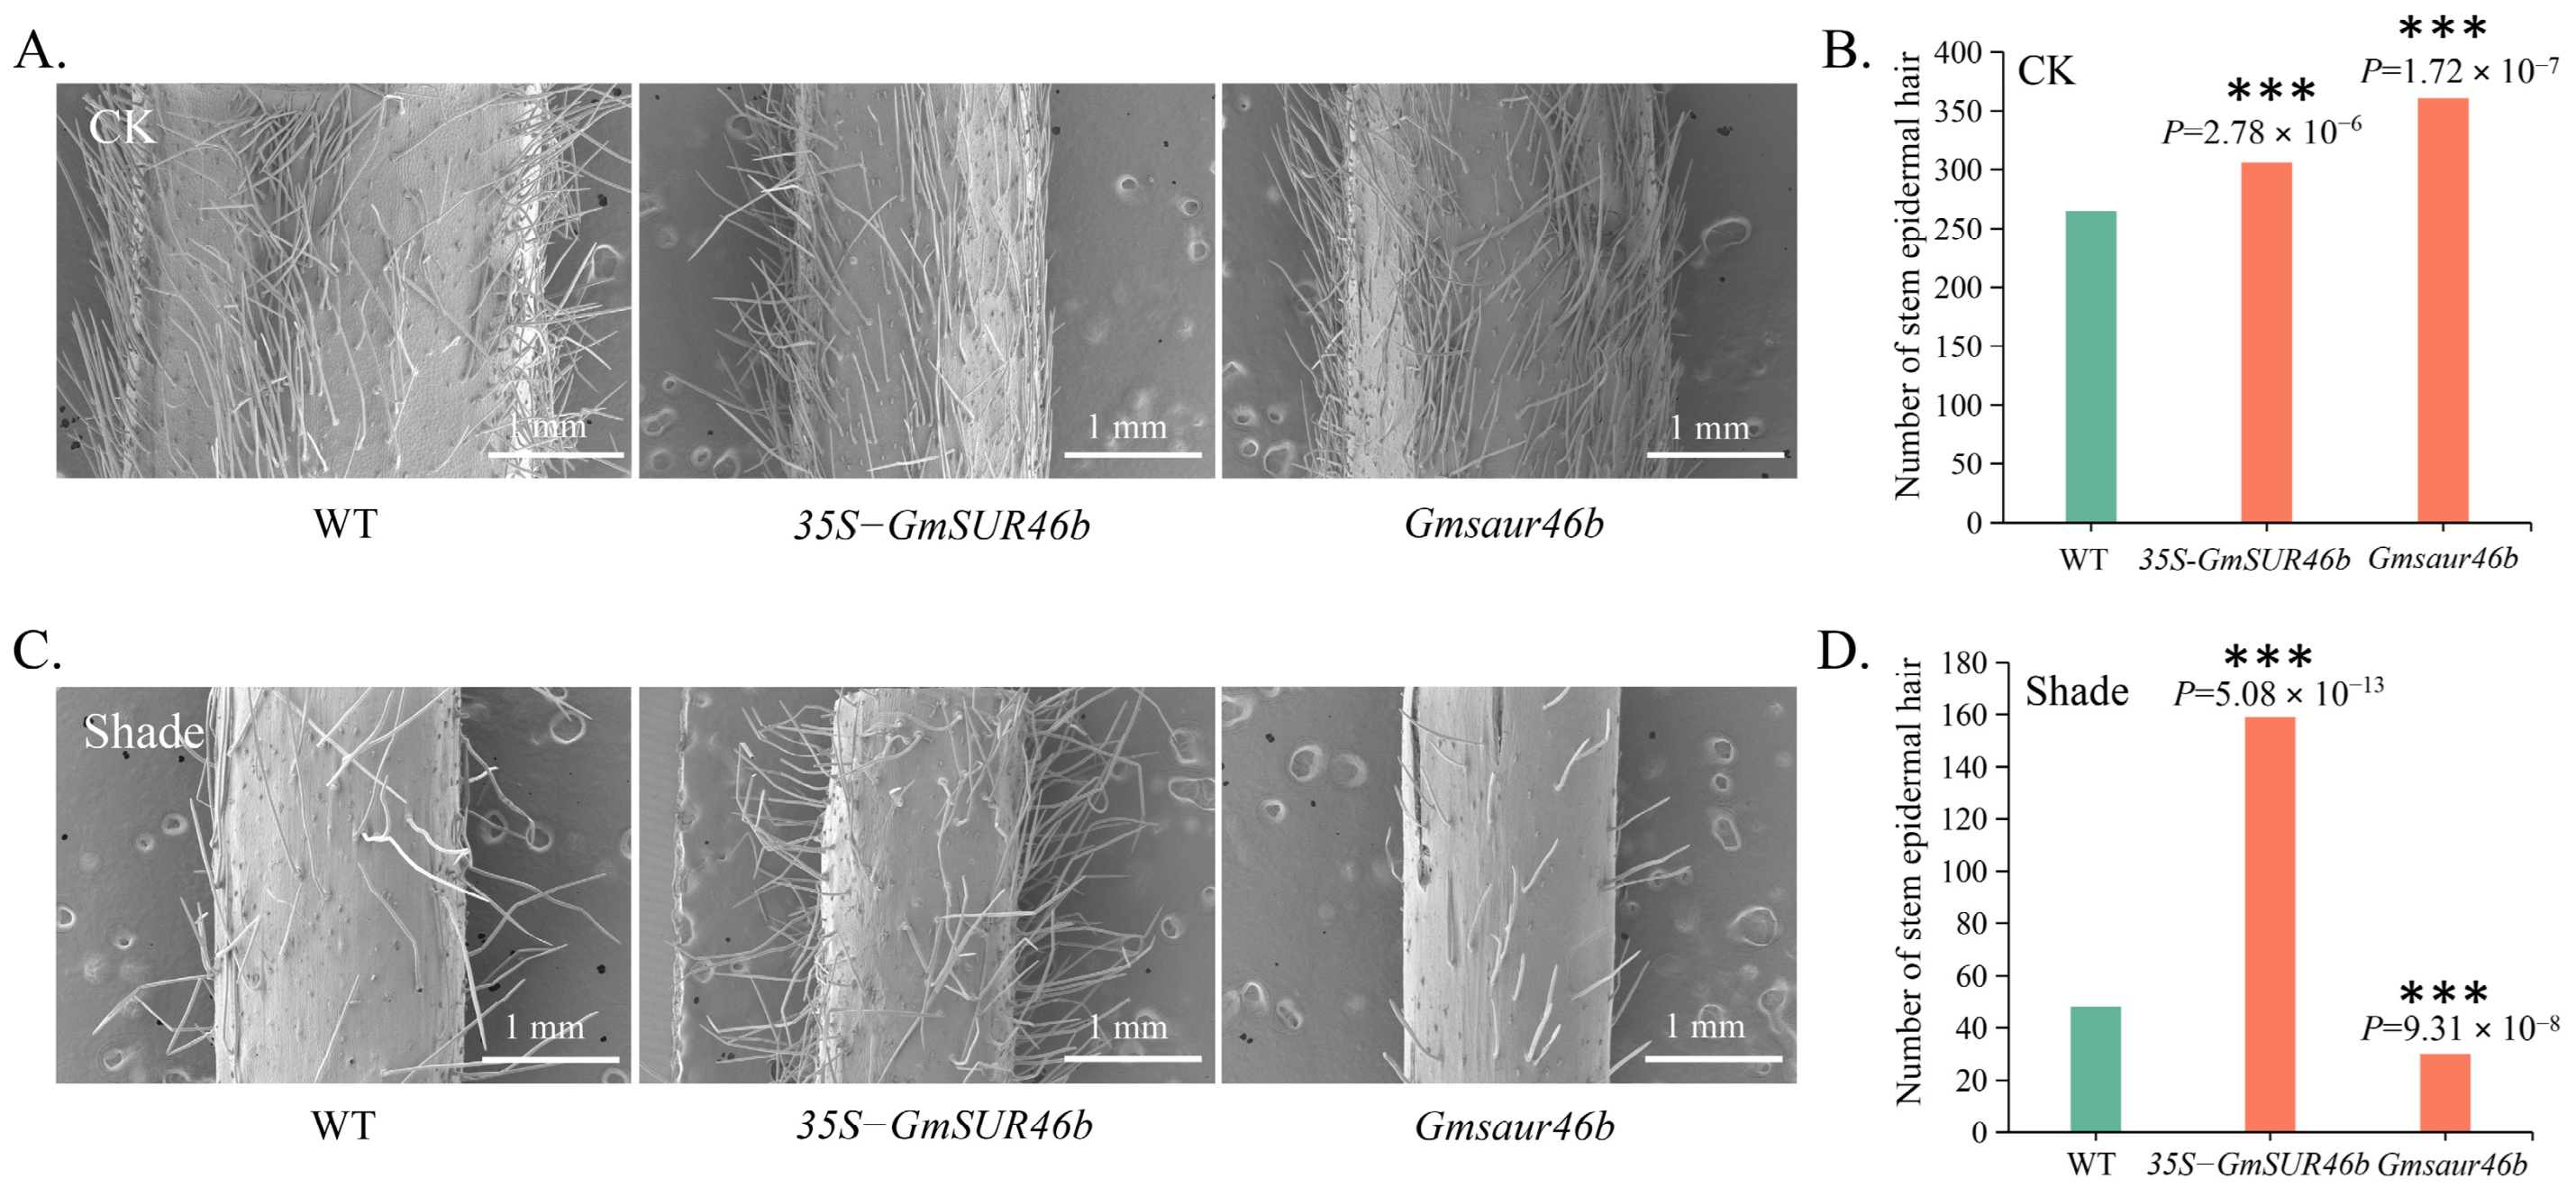
SEM analysis was conducted to investigate the effect of GmSAUR46b on the stem trichome density under normal light (CK) and shade conditions. Under CK conditions, both the GmSAUR46b OE and KO lines exhibited significantly increased stem trichome density compared to the WT plants (Figure 8A,B, Table S3). The average number of trichomes per square millimeter of stem surface in the OE lines was 306, representing a highly significant increase of 13.40% compared to the WT (265 trichomes per square millimeter, p = 2.78 × 10⁻⁶). The KO lines had an average of 361 trichomes per square millimeter of stem surface, showing a highly significant increase of 36.23% compared to the WT (p = 1.72 × 10⁻⁷).
However, under shaded conditions, the regulatory effect of GmSAUR46b on the stem trichome density changed. The OE lines maintained a relatively high trichome density, averaging 159 trichomes per square millimeter of stem surface, representing a highly significant increase of 231.25% compared to the WT, which had 48 trichomes per square millimeter (p = 5.08 × 10⁻¹³). In contrast, the KO lines averaged 30 trichomes per square millimeter, showing a high significant reduction of 37.50% compared to the WT (p = 9.31 × 10⁻⁸) (Figure 8C,D). These results indicate that GmSAUR46b plays a crucial role in regulating the stem trichome density, and this regulation is strongly influenced by the light conditions.

2.11. Differentially Expressed Genes Associated with Observed Morphological Phenotypes

To further elucidate the molecular basis of the observed phenotypic changes (dwarfism, altered leaf midrib thickness, and stem trichome density), we integrated RNA-seq data with phenotypic traits to identify key downstream genes potentially mediating these phenotypes.
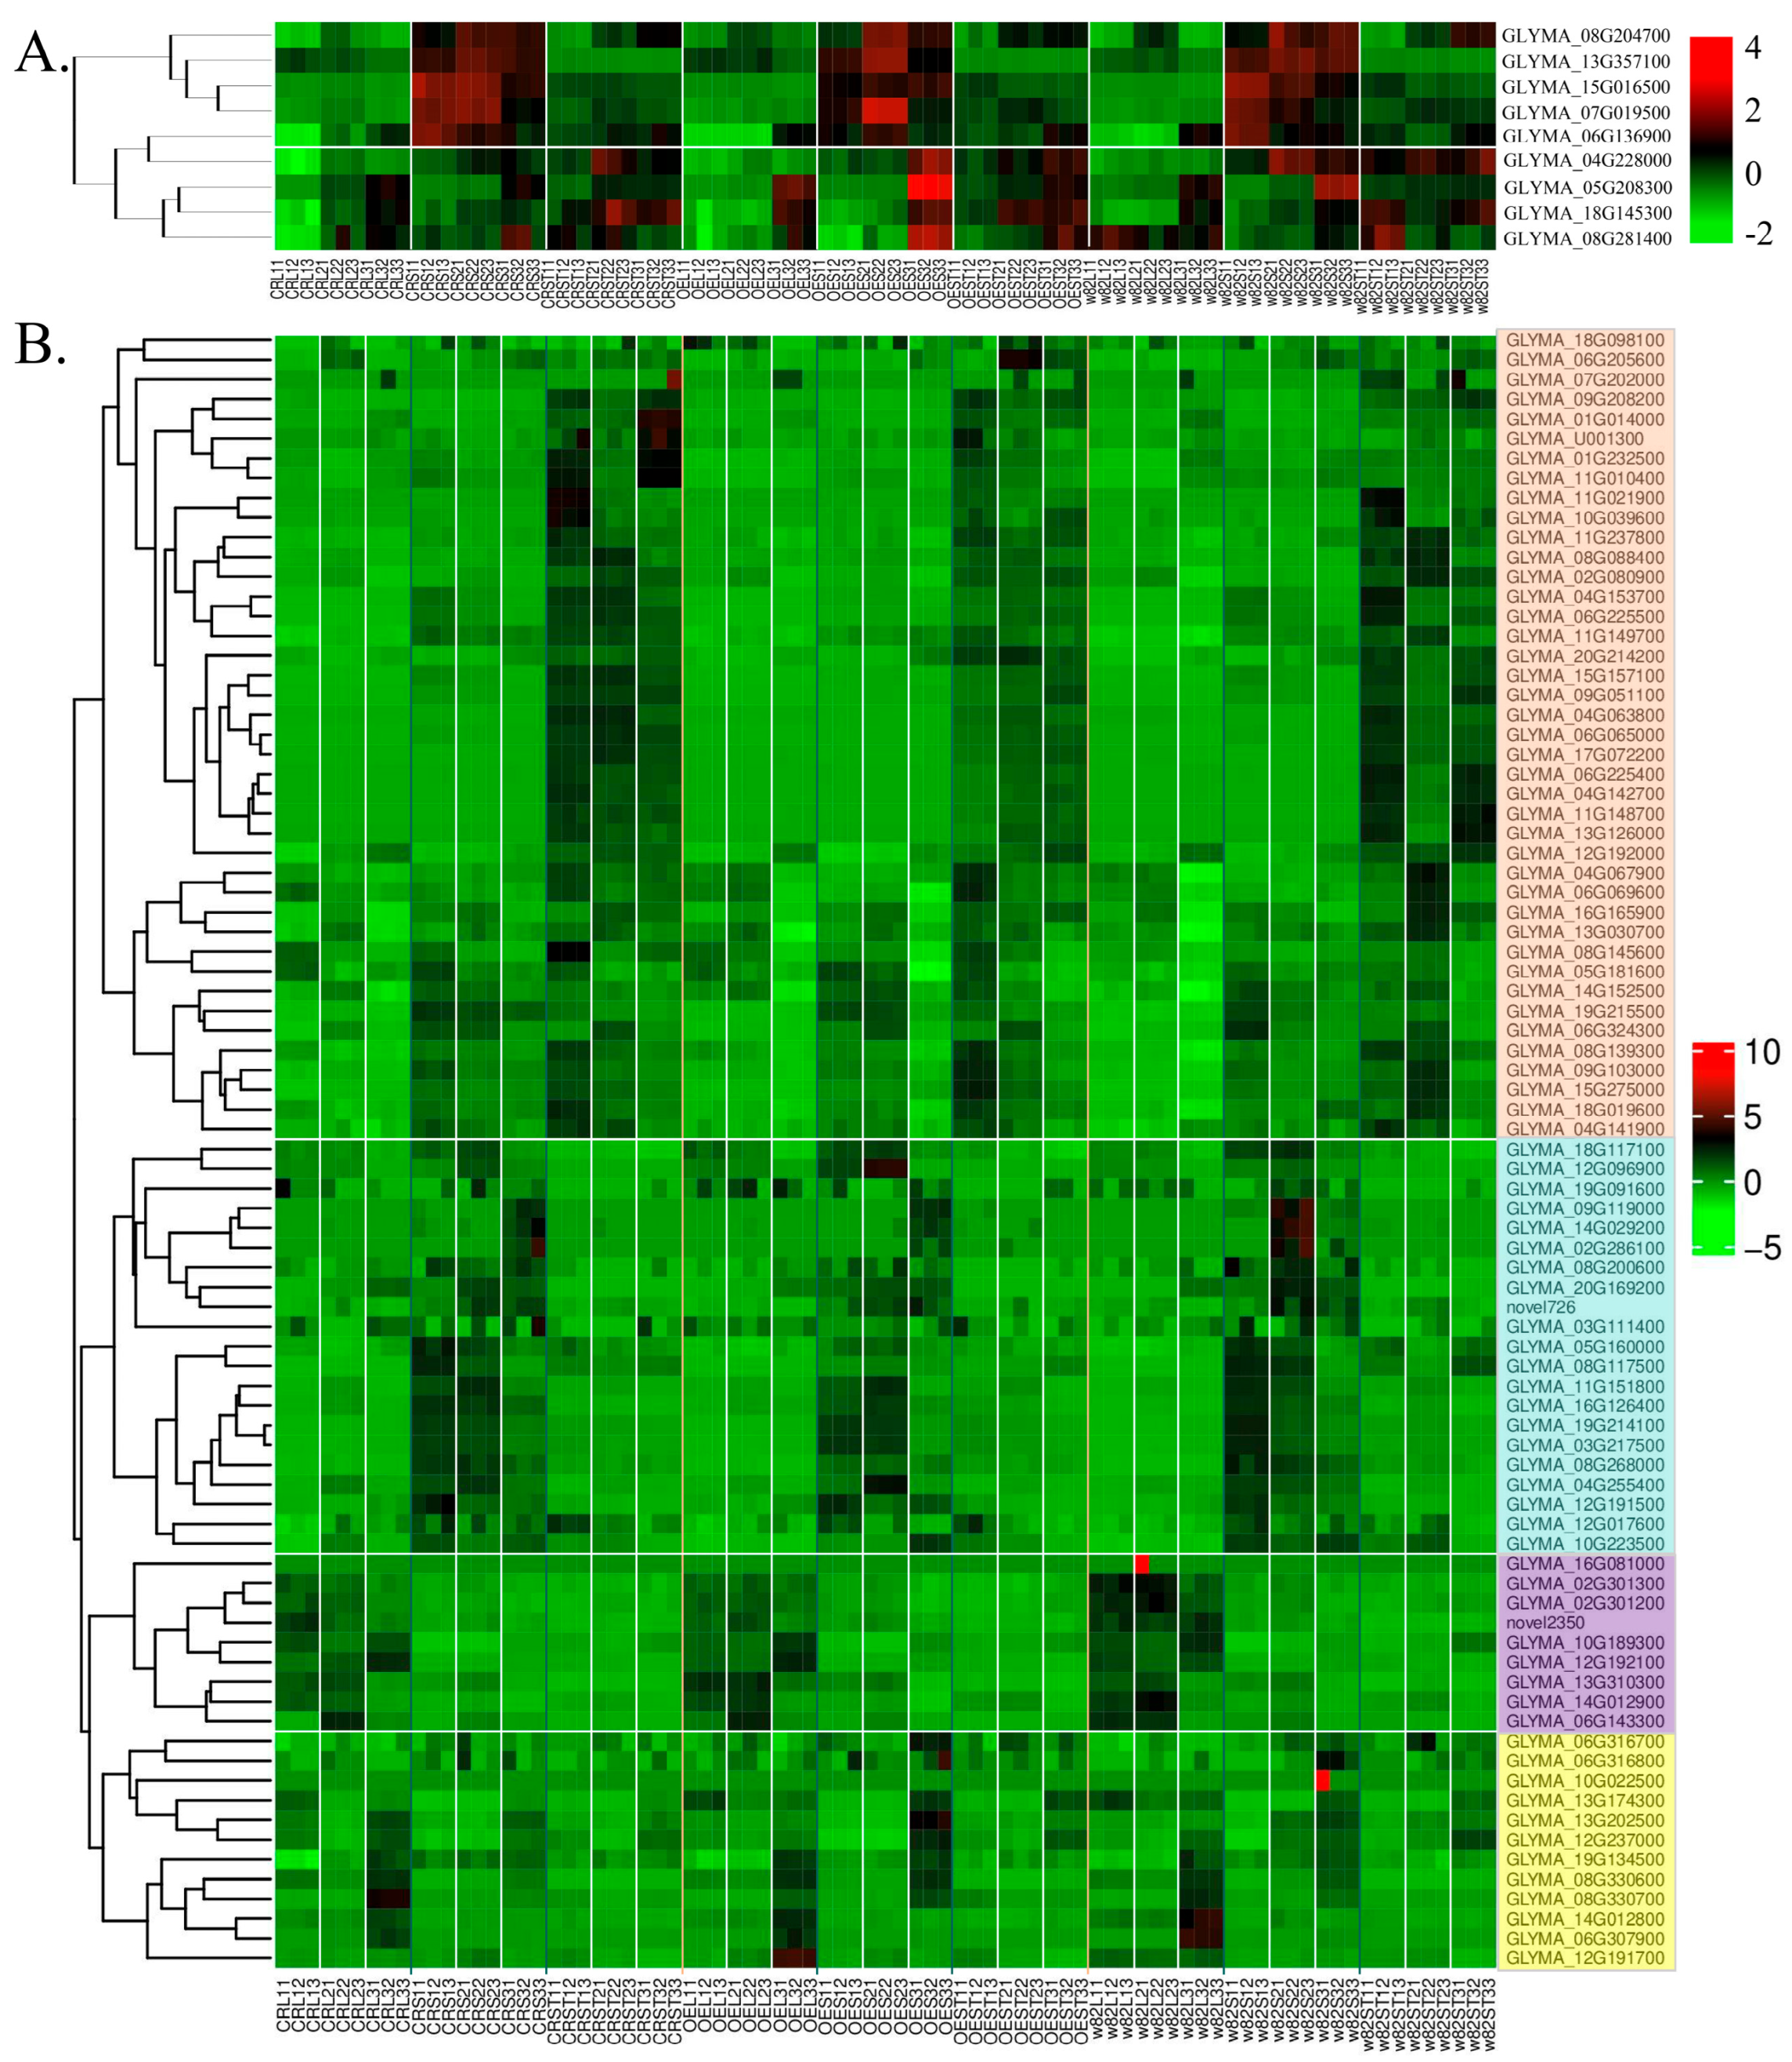
For the stem trichome density, a trait associated with trichome development, several GLABRA homologs exhibited distinct expression patterns across genotypes (GmSAUR46b gene-edited, overexpression, and wild-type) and tissues (leaves, SAMs, and stem) at developmental stages V1, V2, and V3 (Figure 9A). Notably, GLYMA_08G204700, GLYMA_13G357100, GLYMA_15G016500, GLYMA_07G019500, and GLYMA_06G136900 showed significantly higher expression in the SAM compared to the stems and leaves, with the highest levels observed in the overexpression lines at stage V2 (Figure 9A). Given the established role of GLABRA genes in trichome initiation and development, these upregulated homologs likely contribute to the increased stem trichome density observed in the overexpression lines.
Regarding the cell-wall-related phenotypes, such as dwarfism and altered leaf midrib thickness, numerous cellulose synthase genes displayed differential expression profiles (Figure 9B). Based on their preferential expression in specific tissues and developmental stages, these genes were categorized into four classes: Class I (stem-preferential), Class II (SAM-preferential), Class III (leaf-preferential), and Class IV (SAM-specific at stage V3) (Figure 9B). These tissue- and stage-specific expression patterns suggest that these cellulose synthase genes may regulate cellulose synthesis, with disruptions to their expression potentially impairing stem elongation (leading to dwarfism) and leaf midrib structural integrity.
Collectively, these differentially expressed genes—GLABRA homologs (involved in trichome development) and cellulose synthases (associated with cell wall modification)—are strong candidates linking genetic perturbations to the observed morphological traits.

3. Discussion

3.1. The Role of GmSAUR46b in Light-Responsive Soybean Development

Light is a critical environmental cue that regulates numerous aspects of plant growth and development [3,4,5,6,7,14,15,16,17,18]. Our study identified GmSAUR46b as a key regulator involved in light-dependent soybean development. The dynamic expression pattern of GmSAUR46b in response to light–dark transitions (Figure 1D) suggests its involvement in light signaling pathways. Phenotypic analysis further revealed that the GmSAUR46b knockout lines exhibited extreme dwarfism (Figure 1E–I), underscoring its essential role in regulating plant height, consistent with previous findings on SAUR genes mediating plant height [38,39].
Transcriptomic profiling of the GmSAUR46b-modified lines across multiple tissues and developmental stages revealed extensive alterations in gene expression related to hormone metabolism, cell wall modification, and photosynthesis (Figure 6 and Figure S3). GO enrichment analysis identified significant overrepresentation of DEGs in terms associated with “cell wall organization”, “hormone-mediated signaling pathways”, and “photosynthetic systems” (Figure 6 and Figure S3). These findings align with the well-established functions of SAUR genes in cell elongation [27,28,29,30,32,34,35,36], hormone signal transduction [46,47,48,49], and light response [50,51]. For instance, SAUR proteins have been implicated in regulating H+-ATPases and K+ channels to control cell expansion and stomatal movements [27,56], processes closely linked to cell wall dynamics and photosynthesis. Therefore, GmSAUR46b likely integrates light signals with hormone and cell wall metabolic pathways to modulate soybean growth.

3.2. Specific Regulation of Leaf Midrib Thickness by GmSAUR46b

The leaf midrib thickness is crucial for mechanical support and vascular transport, directly influencing the leaf function and overall plant performance. Our anatomical analysis revealed that GmSAUR46b specifically regulates the central thickness of the leaf midrib in a light-dependent manner (Figure 7). Under normal light conditions, the GmSAUR46b OE lines exhibited a slight increase in midrib thickness, while the KO lines showed only marginal effects, with no significant differences compared to the WT. However, under shade conditions, the OE lines demonstrated a significant increase in midrib thickness relative to the WT, whereas the KO lines displayed a pronounced reduction compared to their counterparts under normal light (Figure 7A–C).
This light-dependent regulation suggests that GmSAUR46b fine-tunes midrib development in response to light availability. Under shade conditions, where light is limited, the increased midrib thickness observed in the OE lines may enhance vascular efficiency or mechanical support, compensating for the reduced photosynthetic capacity. Conversely, the thinner midrib in the shaded KO lines could impair these functions, potentially contributing to the observed dwarf phenotype. The specificity of GmSAUR46b in regulating the midrib, with no significant effects on epidermal or mesophyll thickness in the OE lines (Figure 7D–H), indicates a targeted role in midrib development, possibly by modulating cell division or expansion in midrib vascular tissues.

3.3. Light-Dependent Regulation of Stem Trichome Density

Stem trichomes serve as physical barriers against biotic and abiotic stresses [75,76,77], and their development is frequently influenced by environmental cues. Our SEM analysis revealed that GmSAUR46b regulates the stem trichome density in a light-dependent manner (Figure 8). Under normal light conditions, both the OE and KO lines exhibited significantly higher trichome densities than the WT (Figure 8A,B), suggesting that GmSAUR46b is part of a complex regulatory network controlling trichome initiation, where either its overexpression or knockout disrupts the balance.
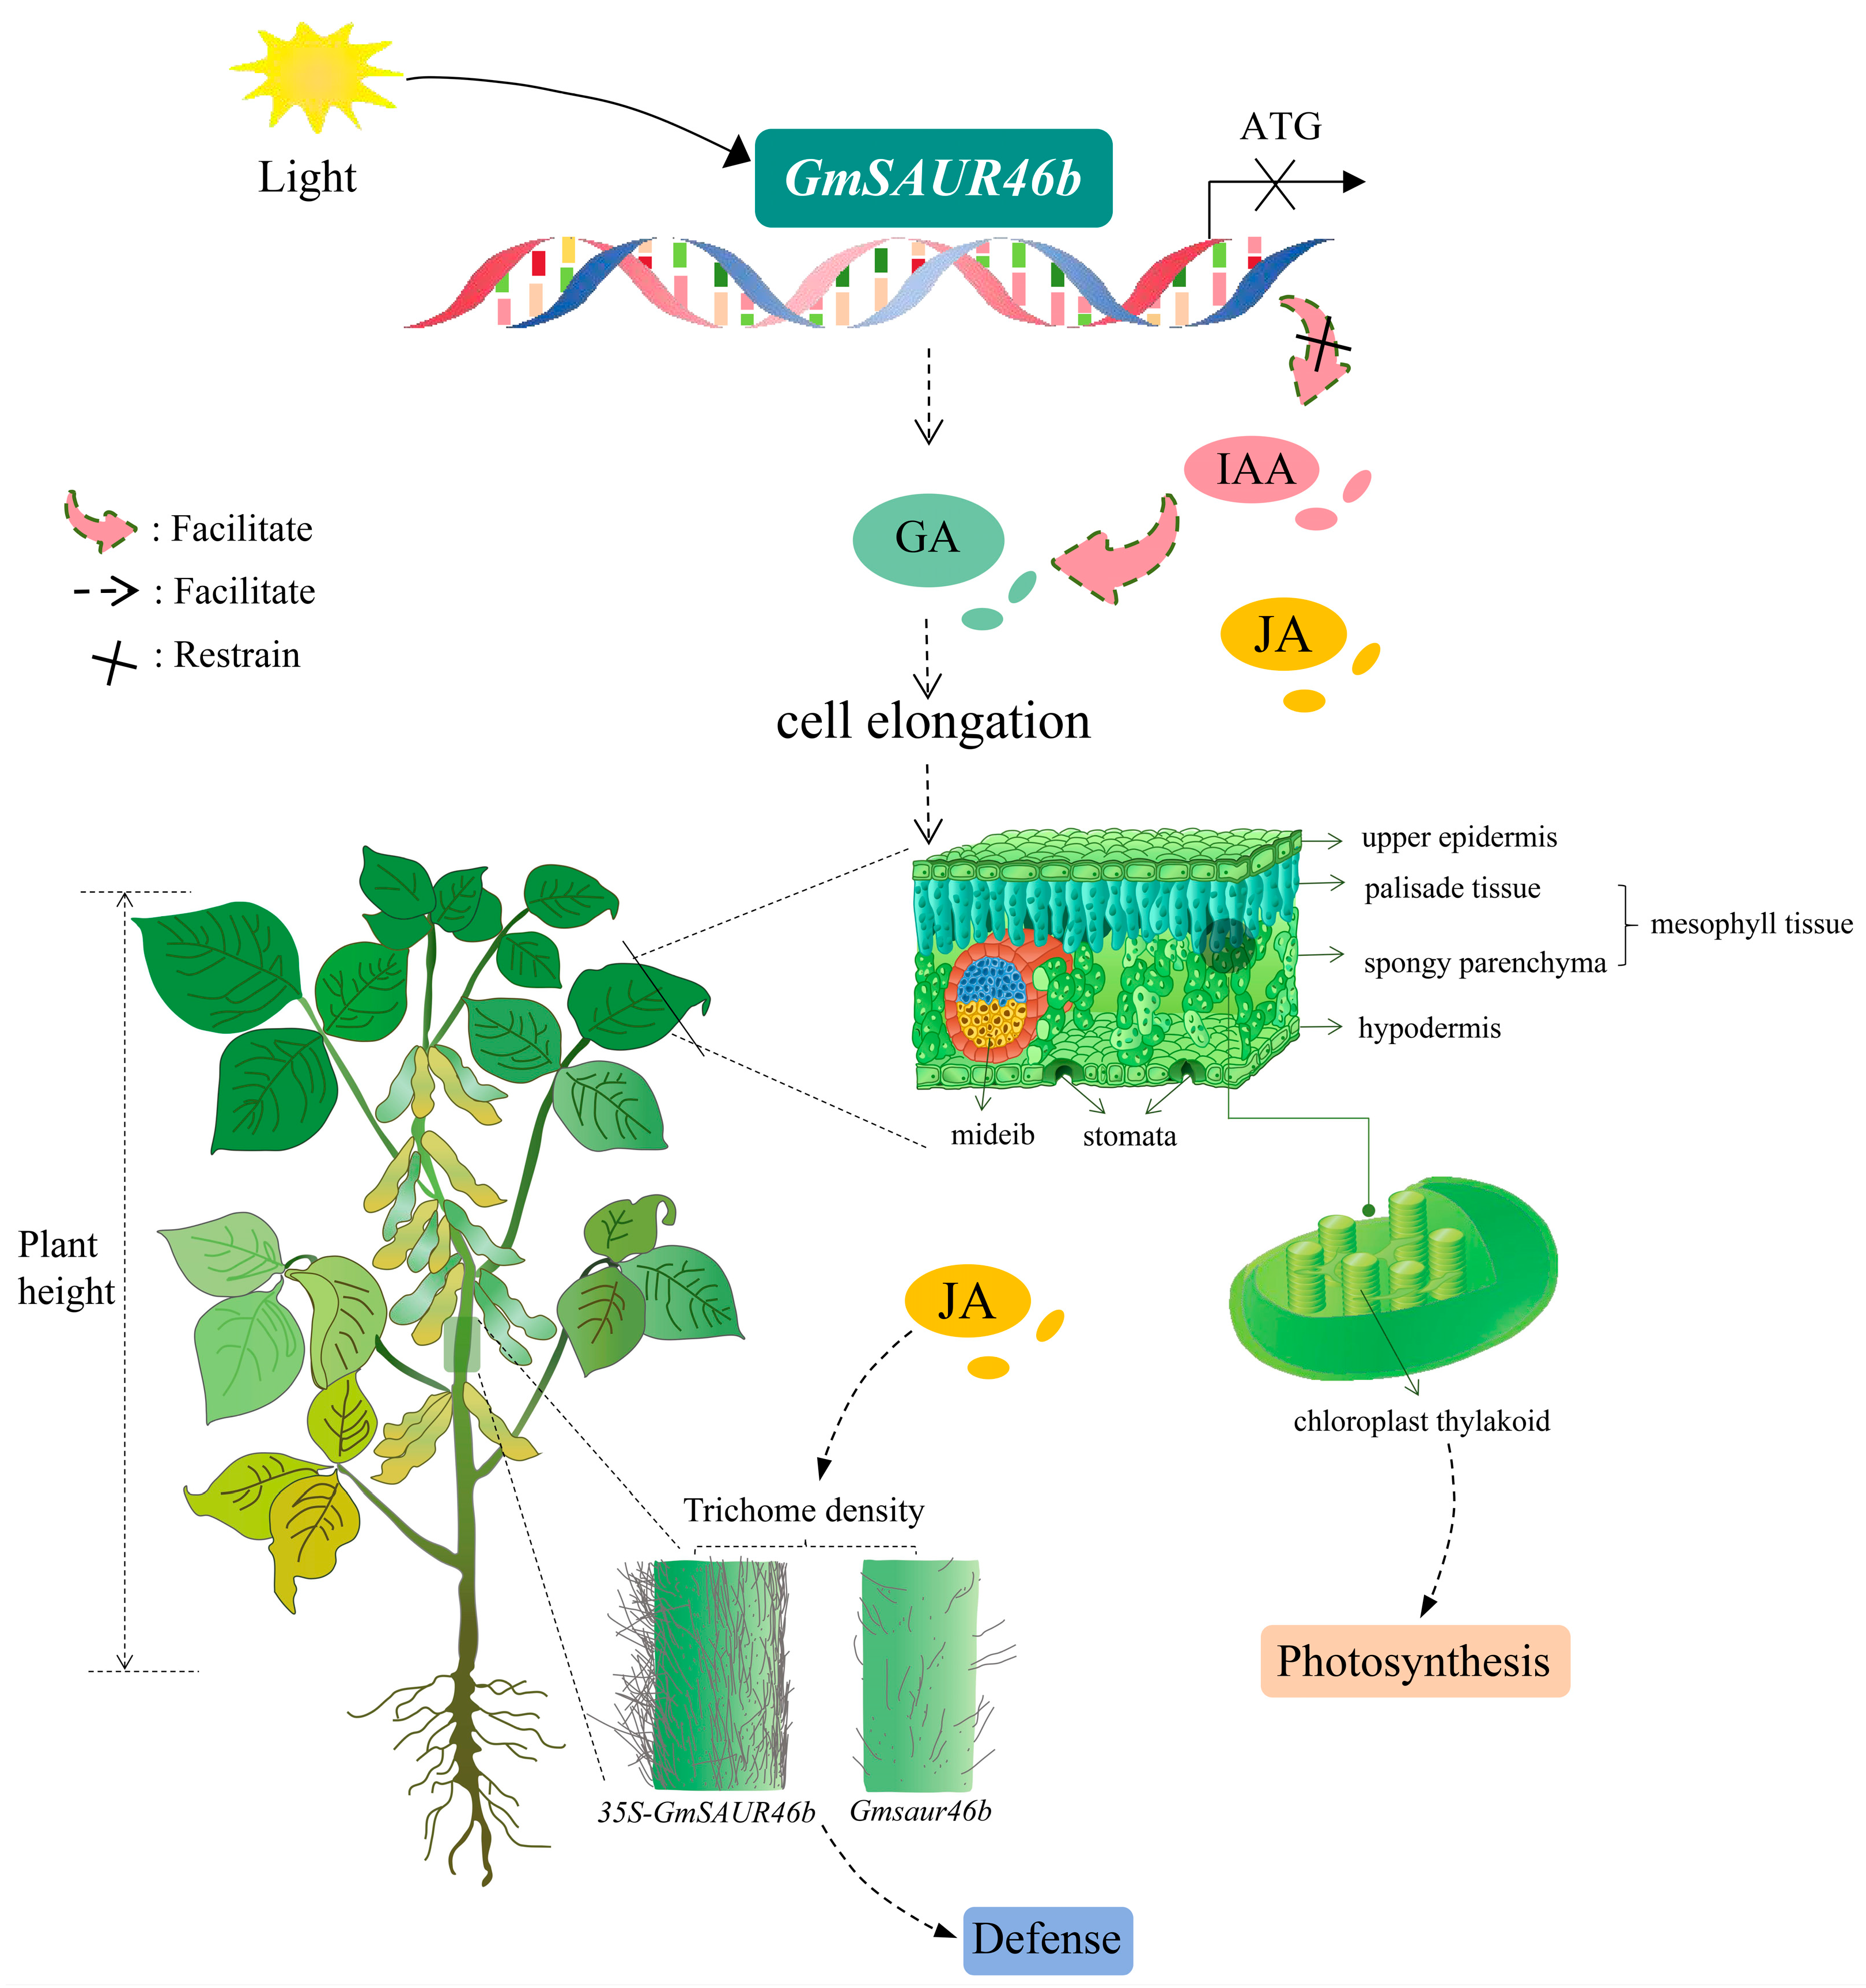
Under shade conditions, the regulatory pattern shifted: the OE lines maintained high trichome density, whereas the KO lines exhibited a drastic reduction (Figure 8C,D). This suggests that GmSAUR46b promotes trichome development under shade, possibly as an adaptive response to enhance stress resistance in low-light environments. The contrasting effects of GmSAUR46b overexpression and knockout under shade highlight its central role in integrating light signals to modulate trichome density, potentially involving crosstalk with hormone pathways. Both auxin and jasmonic acid (JA) are known regulators of trichome development [77,78] and play multifaceted roles in plant abiotic stress responses [79,80,81,82,83,84]. For instance, auxin and JA can induce the formation of type II, V, and VI trichomes in tomato [77]. Under mitochondrial translational stress, JA mediates retrograde signaling to balance plant growth and defense responses [85]. JA priming enhances the antioxidant defense system and photosynthetic capacity in soybean, alleviating the adverse effects of combined heat and drought stress [86]. Additionally, in rice, JA participates in phosphorus remobilization in root cell walls via a nitric-oxide-dependent pathway [87]. JA, salicylic acid, and GA interact to induce trichome development in A. thaliana [88]. Furthermore, the results of the GO and KEGG functional enrichment analyses in this study revealed that the DEGs were significantly enriched in pathways such as “response to auxin and jasmonic acid”, “response to endogenous stimulus”, “hormone response”, and “light signaling, photosynthesis, chloroplast thylakoid membrane development”. This further indicates that in soybean, GmSAUR46b may integrate light signals and hormone, especially JA and auxin, to regulate trichome development, thereby contributing to the stress resistance regulation of stress resistance (Figure 10).

3.4. Novel Transcripts and Functional Annotation

Our transcriptome analysis identified a substantial number of novel transcripts (Table 1, Figure S1), with significant annotations in the KEGG, KOG, and Nr databases (Table S1). Enrichment analyses of these transcripts and DEGs using GO, KEGG, and KOG consistently highlighted pathways related to stress resistance, hormone metabolism, and photosynthesis (Figure 2). The high sequence homology of the transcripts to Glycine max and Glycine soja (Figure 3A) underscores their evolutionary conservation, while the uneven chromosomal distribution (Figure 3B) suggests spatial regulation of transcriptional activity.
These novel transcripts expand the repertoire of known soybean genes and offer candidates for further investigation of GmSAUR46b-mediated regulation. For example, novel transcripts associated with “defense response” or “hormone signaling” may act downstream of GmSAUR46b to modulate stress tolerance or growth. The identification of these transcripts deepens our understanding of the molecular complexity underlying GmSAUR46b function.
In summary, our findings suggest that GmSAUR46b functions as a central hub integrating light signals with hormone metabolism, cell wall modification, and stress response pathways to regulate soybean growth and development (Figure 10). Under varying light conditions, GmSAUR46b modulates specific traits such as the leaf midrib thickness and stem trichome density, likely through tissue-specific regulation of gene expression. The specificity of GmSAUR46b in regulating midrib and trichome development, coupled with its influence on broader pathways such as hormone signaling and photosynthesis, highlights the multifaceted nature of SAUR gene function. Understanding GmSAUR46b’s role in light-dependent development has practical implications for soybean breeding. Modulating GmSAUR46b expression could potentially enhance soybean adaptability to variable light conditions (e.g., shade tolerance in dense canopies or resistance to high light stress). Our study provides comprehensive insights into GmSAUR46b’s function in soybean, emphasizing its role in integrating light signals to regulate tissue-specific development and broader physiological pathways. These findings advance our understanding of SAUR gene biology in soybean and offer promising avenues for molecular breeding.

4. Materials and Methods

4.1. Construction of Gene Knockout Vector and Soybean Transformation

4.1.1. CRISPR-Cas9 Vector Construction for GmSAUR46b Knockout

Gene editing was performed using the CRISPR-Cas9 system, referencing the soybean transformation protocol from Boyuan Bio (Wuhan, China). Specific single-guide RNAs (sgRNAs) targeting GmSAUR46b were designed (sequences shown in Figure 1E) and cloned into the BsaI restriction site of the PEG401 vector to construct the CRISPR-Cas9 expression vector. This vector was then introduced into the Agrobacterium tumefaciens strain EHA105 via electroporation.
Primer synthesis: Primers used to amplify the target sgRNA cassette were synthesized as follows:
Forward: cagtGGTCTCatgcatactgctgtgaatgggaactgttttagagc
Reverse: cagtGGTCTCaaaacctttggcacatcgttgggaatgcac
Restriction digestion and ligation: The ligation reaction (20 μL total volume) contained 8 μL of nuclease-free water, 2 μL of 10× buffer, 1 μL of BsaI/Eco31I, 1 μL of T4 DNA ligase, 4 μL of PEG401 vector, and 4 μL of purified PCR product. The reaction was incubated at 37 °C for 20 min, followed by 5 cycles of 37 °C for 10 min, and 20 °C for 10 min, then 37 °C for 20 min, and heat inactivation at 80 °C for 5 min.
Transformation and verification in E. coli: 5–10 μL of the ligation product were transformed into competent E. coli cells, which were then plated on LB agar containing kanamycin and incubated at 37 °C for 12 h. Twelve colonies were selected for colony PCR using PEG401-specific primers (forward: GCAACGCTCTGTCATCGTTACAAT; reverse: gcgattaagttgggtaacgccaggg). Colonies exhibiting the expected 7843 bp band were confirmed by sequencing.
Electroporation into Agrobacterium: 1 μL of recombinant plasmid was mixed with 50 μL competent A. tumefaciens EHA105 cells and transferred to an electroporation cuvette for electroporation. Afterward, 1 mL of LB broth was added, and the mixture was incubated at 30 °C with shaking (at 180 rpm) for 30 min. Subsequently, 50 μL of the culture were plated on LB agar and incubated in the dark at 30 °C for 48 h.

4.1.2. Agrobacterium-Mediated Soybean Transformation for Knockout Lines

Soybean transformation was performed in six stages: seed germination, co-cultivation, induction of differentiation, redifferentiation, elongation, and rooting, with medium formulations [89,90,91].
Explant preparation: Soybean seeds were surface-sterilized and germinated under sterile conditions. Cotyledon node explants were harvested after 3–5 days.
Agrobacterium infection: Explants were immersed in an A. tumefaciens EHA105 suspension (OD600 = 0.5) for 2–3 min with gentle stirring, then transferred to filter paper-lined co-cultivation plates and incubated at 25 °C in the dark for 3–5 days.
Callus induction and differentiation: Healthy explants (with hypocotyl ends removed) were cultured on dedifferentiation medium under a 16 h light/8 h photoperiod for 7–10 days, with subculturing onto fresh medium. Embryoids were then transferred to redifferentiation medium and cultured for 21 days under the same photoperiod, with subculturing.
Shoot elongation and rooting: Embryoids were transferred to elongation medium and cultured for 21 days. When the shoots reached approximately 5 cm in length, they were transferred to rooting medium and cultured for an additional 21 days under the same photoperiod to promote root and stem meristem development.
Verification of transgenic plants: T0 plants were screened for Bar/pat protein using Bar test strips. Positive seedlings were acclimatized in soil at 27 °C under a 16 h light/8 h dark photoperiod for 3–4 weeks. T1 seeds were sown in soil at 26 °C and 60% humidity, maintained under a 16 h light/8 h dark photoperiod. Mutations and the presence of Cas9 were verified in T1 plants using the Hi-TOM platform with specific primers (Table S5), and the genotypes were confirmed by Hi-TOM sequencing (Figure 1F,G). We identified a gene-edited line with a homozygous 8 bp deletion and a single base mutation (T1-14), as well as a gene-edited line with a 6 bp deletion (T1-15) (Figure 1G).

4.1.3. Construction of Overexpression Vector and Soybean Transformation

The CDS of GmSAUR46b was amplified by PCR (primers in Table S6) and cloned into the XbaI and SacI restriction sites of the PTF101-35S vector. The recombinant vector was transformed into A. tumefaciens EHA105 via electroporation. Agrobacterium-mediated transformation of soybean explants, subsequent culture (including callus induction, differentiation, elongation, and rooting), and acclimatization of positive seedlings were performed using the same protocol as described for the gene knockout lines.

4.2. Plant Materials and Growth Conditions

Soybean W82, GmSAUR46b overexpression lines (OE-1, OE-2), and CRISPR/Cas9-mediated knockout mutants (KO-1, KO-2) were used in this study. The OE lines were generated by transforming the CDS of the GmSAUR46b gene under the control of the 35S promoter. The KO lines were created by targeting the first exon of GmSAUR46b, resulting in frameshift mutations (Table S4).
OE lines were generated by transforming the CDS of GmSAUR46b gene under the control of the Cauliflower Mosaic Virus 35S promoter.
Growth conditions: Seeds were sown in an illuminated incubator with an 8 h light/16 h dark cycle at 26 °C and 60% relative humidity (Figure S5).
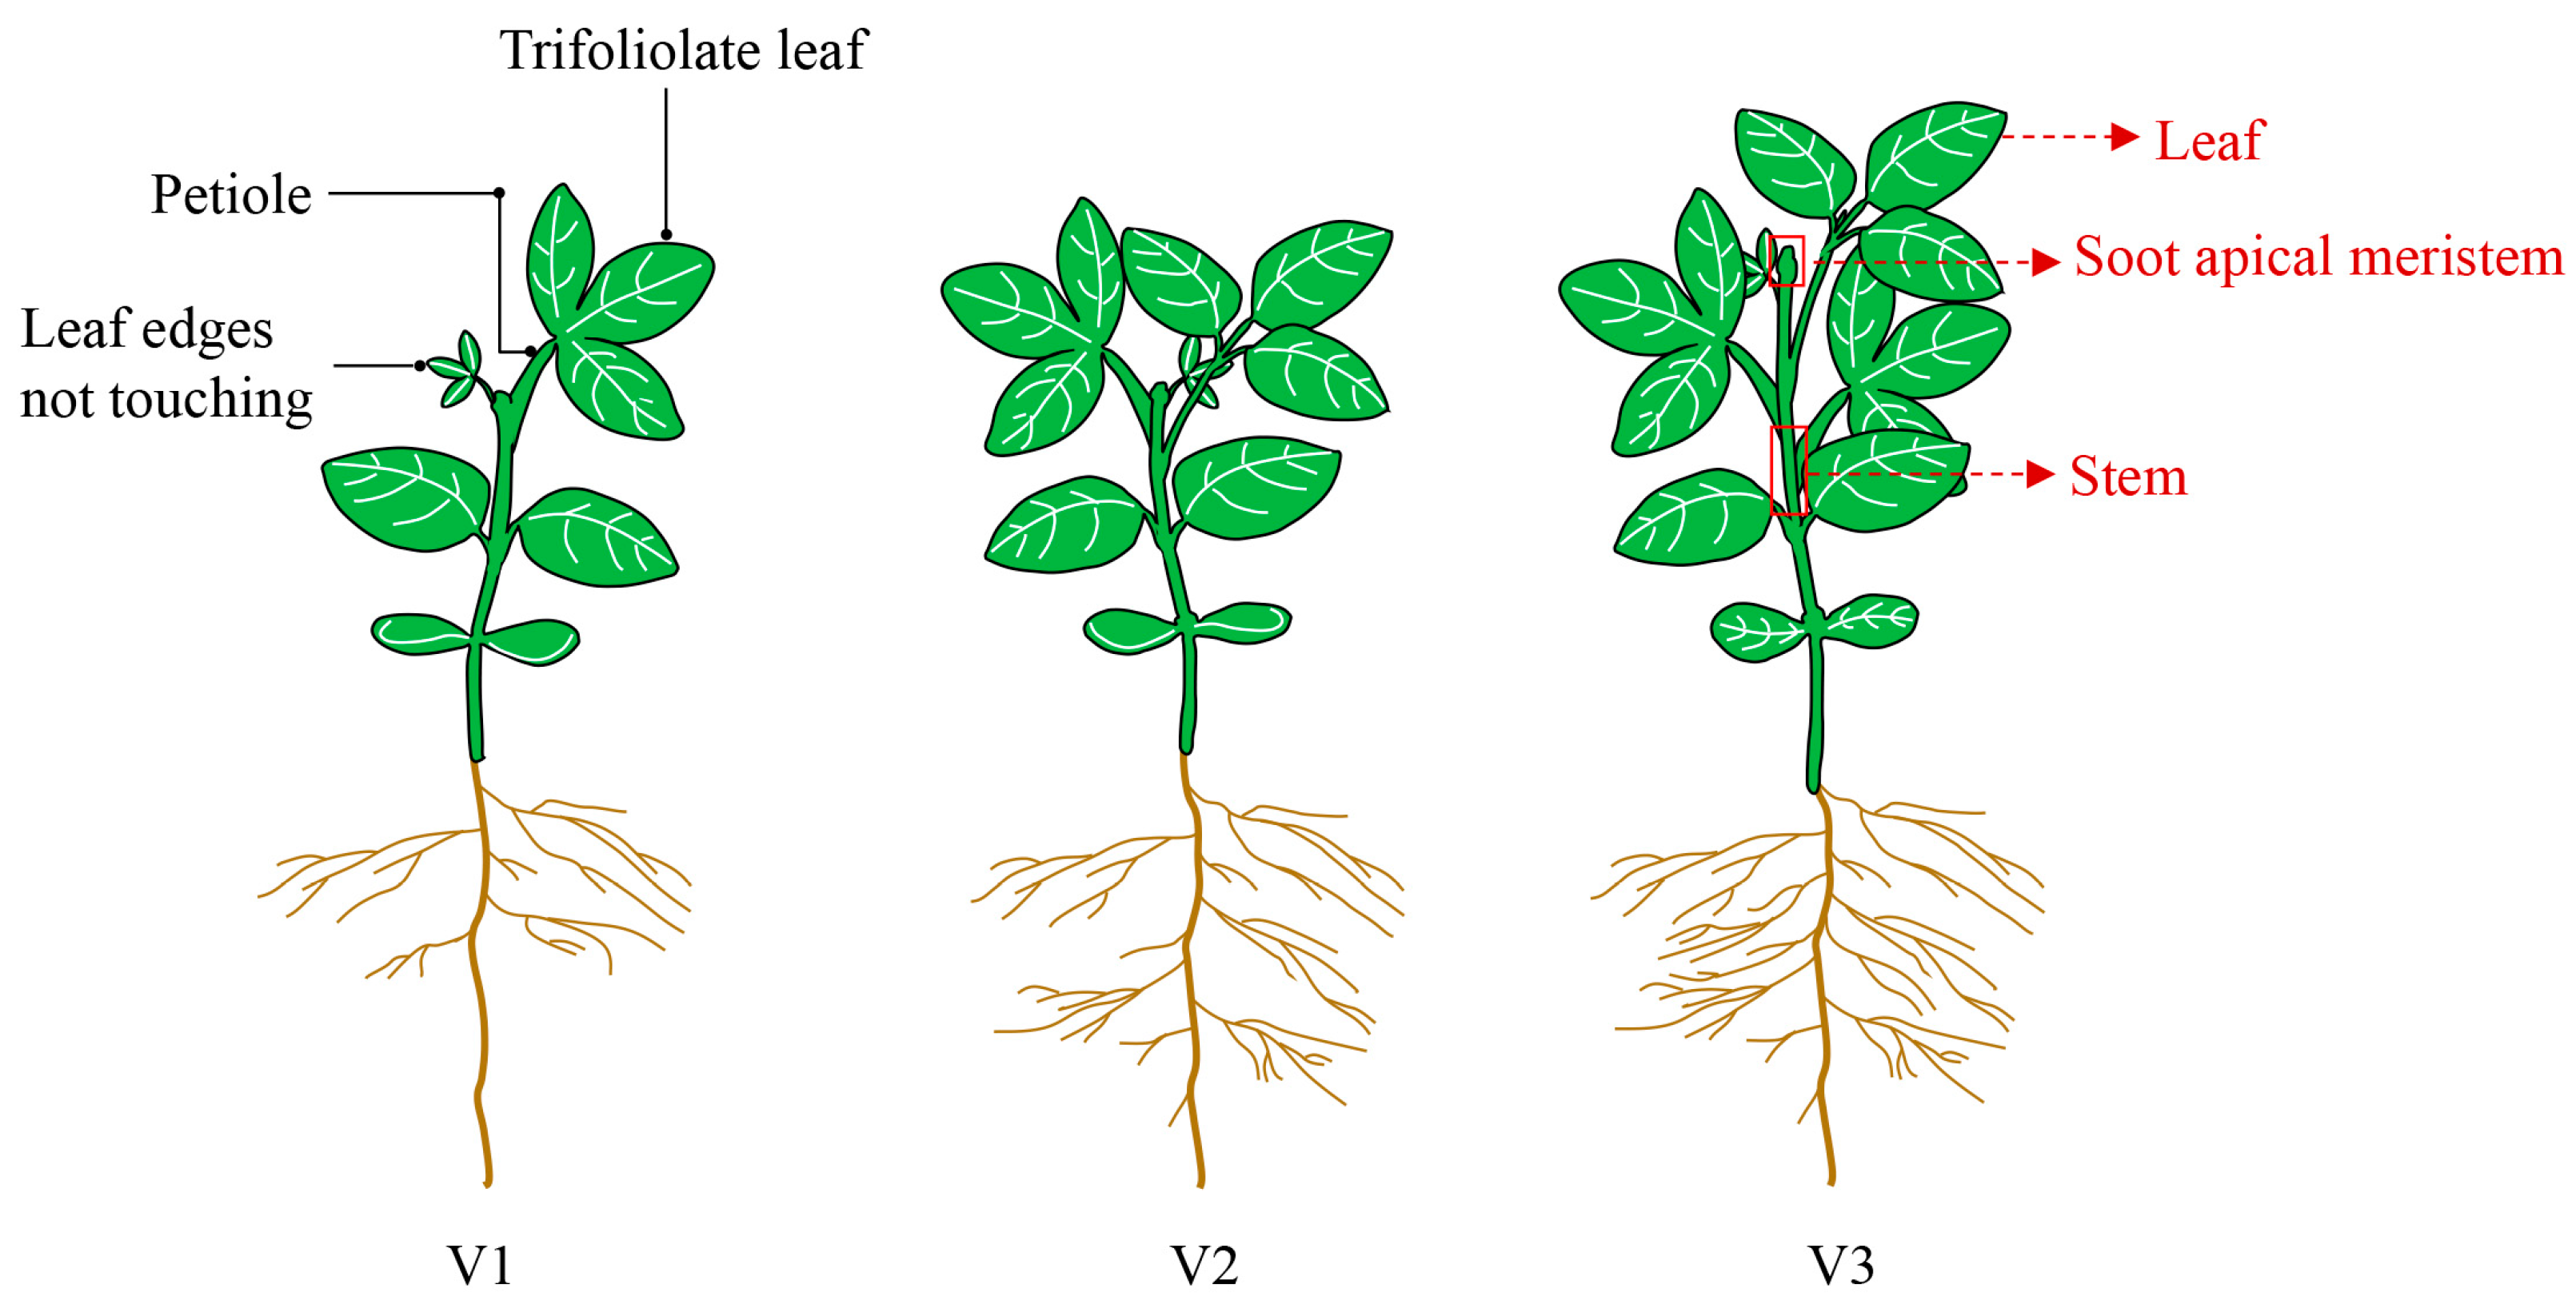
For paraffin sectioning and Scanning Electron Microscopy (SEM) analyses, soybean plants (WT, OE and KO lines) were grown under two light regimes. Normal light: photosynthetic photon flux density (PPFD) = 314.5 μmol/(m2·s); red (600–700 nm) = 192.2 μmol/(m2·s); blue (400–500 nm) = 46.19 μmol/(m2·s); far-red (700–780 nm) = 53.07 μmol/(m2·s); R:B = 4.16. Simulated shading: PPFD = 149.8 μmol/(m2·s); red = 77.42 μmol/(m2·s); blue = 23.50 μmol/(m2·s); far-red = 170.4 μmol/(m2·s); R:B = 3.30. Growth conditions: 26 °C, 60% humidity, 8 h light/16 h dark. Samples were collected at the V3 stage (Figure 11).

4.3. Analysis of Gene Evolution, Structure and Conserved Motifs

The CDS and protein sequences of GmSAUR46s were obtained from the SoyBase database (http://www.soybase.org, accessed on 22 January 2025). Sequence alignment was performed using ClustalX (v1.8) [92,93]. Molecular evolutionary genetics analyses were conducted using the maximum likelihood, evolutionary distance, and maximum parsimony methods with MEGA5 software [94]. The gene structure was visualized using the GSDS 2.0 server [95]. MEME tools were employed to discover and analyze motifs [96,97].

4.4. Analysis of the Expression Patterns

As described in previous studies [98], the total RNA was extracted from fresh plant samples (minimum 2 g) that were immediately frozen in liquid nitrogen and pulverized into a fine powder. The extraction process was carried out with FastPure Universal Plant Total RNA Isolation Kit (Vazyme, Nanjing, China) [98], and 1 μg of the isolated total RNA was reverse-transcribed into first-strand cDNA using a HiScript II 1st Strand cDNA Synthesis Kit (Vazyme, Nanjing, China). qPCR-PCR reactions were carried out on a QuantStudio 5 Real-Time PCR System (Thermo Fisher Scientific, Waltham, MA, USA) with the ChamQ Universal SYBR qPCR Master Mix (Vazyme, Nanjing, China). Each 10 μL reaction system contained 5 μL SYBR Master Mix, 0.2 μL each of the forward and reverse primer, and 4.6 μL cDNA template. The thermal cycling parameters were configured as follows: an initial denaturation step at 95 °C for 30 s, followed by 40 cycles consisting of 95 °C denaturation for 10 s and 60 °C annealing/extension for 30 s [98]. The GmTublin gene (Glyma.05G157300) was used as the internal control [9], with the relative gene expression levels determined via the 2−ΔΔCt algorithm. All the experiments included three biological replicates, each with three technical replicates. Primer sequences are provided in Supplementary Table S5.

4.5. RNA-Seq Sample Collection

For the transcriptome sequencing analyses of the leaf, stem and SAMs, seedlings were grown under SD conditions (8 h light/16 h dark) at 25 °C. Then, the leaf, stem, and SAMs (1.5 mm in length) were placed into liquid nitrogen for rapid freezing. For each tissue/stage, 8–10 biological replicates were collected from the WT, OE, and KO lines (total 81 samples: 3 genotypes × 3 tissues × 3 stages × 3 replicates) (Figure 11).

4.6. Transcriptome Data Analysis

Raw data processing: Raw reads were filtered using fastp (v0.21.0) [99] to remove adapters and low-quality reads, generating clean data. Quality control was verified using Fastqc (v0.11.9; Parameters: default). The clean reads were mapped to the Williams 82 reference genome [100,101] by HISAT2 (v2.2.1) [102] with the default settings for the parameters.
Alignment and expression quantification: Gene expression levels (Fragments Per Kilobase of transcript per Million mapped fragments, FPKM) were calculated using the feature Counts.
DEG identification: Differentially expressed genes (DEGs) between OE/WT and KO/WT were recognized using DESeq2 (Wolfgang Huber from Heidelberg University in Heidelberg, Germany) with the following thresholds: |log2(fold change)| > 1 and adjusted p-value (FDR) < 0.05 [103].
Functional enrichment: GO and KEGG enrichment analyses of the DEGs were carried out using clusterProfiler (Shanghai Institute of Biological Sciences, Chinese Academy of Sciences) [104,105], with the results visualized as bar plots and bubble plots. GSEA (v4.4.0) was used to identify enriched pathways.

4.7. Analysis of Novel Genes and Novel Transcripts

To systematically identify potential novel genes and transcripts in the samples, this study employed StringTie software (v2.2.1) [106] for de novo transcript assembly. The workflow was as follows: alignment results (in BAM format) of quality-controlled and alignment-filtered clean reads (refer to Section 4.6) mapped to the reference genome (version: Glycine_max_Glycine_max_v2.1_Ensemble_60_index) were used as input data. The transcript assembly parameters were set to the default, with a minimum transcript length of 200 bp and a minimum exon length of 50 bp to ensure the biological validity of the assembled products.

4.8. Observation and Measurement of Leaf Tissue Thickness

Referring to previous technical methods, samples were fixed in FAA fixative and then processed into qualified paraffin sections [98]. The sections were scanned using a PANNORAMIC whole-slide scanner (3DHISTECH, Budapest, Hungary) to generate complete image datasets, which were viewed with CaseViewer 2.4 (3DHISTECH, Budapest, Hungary). Target regions were imaged at 100× magnification under consistent background lighting. Using Image-Pro Plus 6.0 (Media Cybernetics, Rockville, MD, USA) with millimeters as the unit, five measurements per section were taken for the upper epidermis thickness, lower epidermis thickness, leaf vein thickness, mesophyll thickness (Table S2), and midvein center thickness at 100× magnification.

4.9. SEM Preparation and Analysis Procedures

For the SEM analysis, fresh tissues (≤3 mm2) were harvested within 1–3 min to minimize mechanical damage, rinsed with PBS (Servicebio, Wuhan, China, G0002) to remove contaminants, and labeled for target observation. Adherent cells on coverslips were rinsed with PBS after discarding the medium. Both sample types were fixed in Servicebio fixative (G1102) at room temperature for 2 h and stored at 4 °C. Post-fixation was performed using 1% osmium tetroxide (Ted Pella Inc., 18456, Redding, CA, USA) in 0.1 M PB (pH 7.4) for 1–2 h, followed by three 15 min rinses with 0.1 M PB. Dehydration was carried out using graded ethanol series (30–100%) and isoamyl acetate, each for 15 min, then the samples were dried with a Quorum K850 (Quorum Technologies, located in East Sussex, UK) critical point dryer. Finally, samples were sputter-coated with gold for approximately 30 s using a HITACHI MC1000 (Hitachi, Japan) and observed with a HITACHI SU8100 SEM (Hitachi, Japan), and take pictures at 30× magnification.

5. Conclusions

In this study, we systematically investigated the role of GmSAUR46b, a member of the SAUR gene family, in integrating light signals to regulate G. max growth and development. Using a combination of genetic manipulation (CRISPR/Cas9-mediated knockout and 35S-driven overexpression), transcriptomic profiling, anatomical characterization, and phenotypic analysis, we elucidated the functional mechanisms of GmSAUR46b in modulating specific agronomic traits under varying light conditions. Our findings demonstrate that GmSAUR46b functions as a key regulator in light-dependent developmental pathways. Its expression dynamically responds to light–dark transitions, indicating direct involvement in perceiving and transducing light signals. Transcriptomic analyses of SAMs, stems, and leaves across three developmental stages (V1, V2, V3) revealed that perturbation of GmSAUR46b significantly alters the expression of genes enriched in cell wall metabolism, hormone signaling (e.g., auxin and JA), and photosynthetic pathways. These results highlight the role of GmSAUR46b as a central hub integrating light cues with hormonal and cellular metabolic networks.
Anatomical and phenotypic analyses further confirmed the functional specificity of GmSAUR46b. Under shaded conditions, overexpression of GmSAUR46b led to a significant increase in leaf midrib thickness and stem trichome density compared to the WT plants, whereas the knockout lines exhibited reduced trichome density and diminished midrib thickness responses to shade. These findings indicate that GmSAUR46b specifically regulates leaf midrib development and stem trichome formation in a light-dependent manner—traits that are critical for mechanical support, vascular transport, and stress resistance. Additionally, the identification of numerous novel transcripts associated with stress resistance, hormone metabolism, and photosynthesis expands the known repertoire of soybean genes, providing new candidates for exploring GmSAUR46b-mediated regulatory networks. These transcripts, together with differentially expressed genes, underscore the complexity of the molecular pathways underlying GmSAUR46b function.
In summary, our study demonstrates that GmSAUR46b integrates light signals with hormonal and cell wall metabolic pathways to regulate soybean growth, specifically affecting leaf and stem traits. These findings deepen our understanding of the functional diversity of SAUR genes in soybean and offer valuable insights for molecular breeding strategies aimed at enhancing crop adaptability and yield under variable environmental conditions.

Supplementary Materials

The supporting information can be downloaded at https://www.mdpi.com/article/10.3390/ijms26189200/s1.

Author Contributions

Conceptualization, J.Z. and F.Y.; methodology, X.L., B.L. and Y.Y.; software, X.L. and H.Y.; validation, X.L., H.G. and H.D.; formal analysis, X.L. and H.Y.; investigation, X.L., Y.Y. and Y.C.; resources, F.Y.; data curation, X.L. and Y.C.; writing—original draft preparation, X.L. and H.G.; writing—review and editing, J.Z. and F.Y.; visualization, X.L. and H.D.; supervision, B.L. and F.Y.; project administration, F.Y.; funding acquisition, F.Y. All authors have read and agreed to the published version of the manuscript.

Funding

This research was funded by the Biological Breeding-National Science and Technology Major Project (2023ZD04034).

Institutional Review Board Statement

Not applicable.

Informed Consent Statement

Not applicable.

Data Availability Statement

The datasets used and/or analyzed in the current study are available from the corresponding author (Fengjie Yuan) on reasonable request.

Acknowledgments

We would like to express our sincere gratitude to Xiaochao Chen and Ping Deng from Xianghu Laboratory for offering valuable insights into the overall structure and logical flow of this manuscript.

Conflicts of Interest

The authors declare no conflicts of interest.

References

  1. Fan, J.; Shen, Y.; Chen, C.; Chen, X.; Yang, X.; Liu, H.; Chen, R.; Liu, S.; Zhang, B.; Zhang, M.; et al. A large-scale integrated transcriptomic atlas for soybean organ development. Mol. Plant 2025, 18, 669–689. [Google Scholar] [CrossRef] [PubMed]
  2. Zhang, Z.; Yang, S.; Wang, Q.; Yu, H.; Zhao, B.; Wu, T.; Tang, K.; Ma, J.; Yang, X.; Feng, X.; et al. Soybean GmHY2a encodes a phytochromobilin synthase that regulates internode length and flowering time. J. Exp. Bot. 2022, 73, 6646–6662. [Google Scholar] [CrossRef]
  3. Britz, S.J.; Sager, J.C. Photomorphogenesis and Photoassimilation in Soybean and Sorghum Grown under Broad Spectrum or Blue-Deficient Light Sources. Plant Physiol. 1990, 94, 448–454. [Google Scholar] [CrossRef]
  4. Cheng, B.; Wang, L.; Liu, R.; Wang, W.; Yu, R.; Zhou, T.; Ahmad, I.; Raza, A.; Jiang, S.; Xu, M.; et al. Shade-Tolerant Soybean Reduces Yield Loss by Regulating Its Canopy Structure and Stem Characteristics in the Maize-Soybean Strip Intercropping System. Front. Plant Sci. 2022, 13, 848893. [Google Scholar] [CrossRef]
  5. Mu, R.; Lyu, X.; Ji, R.; Liu, J.; Zhao, T.; Li, H.; Liu, B. GmBICs Modulate Low Blue Light-Induced Stem Elongation in Soybean. Front. Plant Sci. 2022, 13, 803122. [Google Scholar] [CrossRef]
  6. Wu, Y.; Chen, P.; Gong, W.; Gul, H.; Zhu, J.; Yang, F.; Wang, X.; Yong, T.; Liu, J.; Pu, T.; et al. Morphological and physiological variation of soybean seedlings in response to shade. Front. Plant Sci. 2022, 13, 1015414. [Google Scholar] [CrossRef]
  7. Lyu, X.; Cheng, Q.; Qin, C.; Li, Y.; Xu, X.; Ji, R.; Mu, R.; Li, H.; Zhao, T.; Liu, J.; et al. GmCRY1s modulate gibberellin metabolism to regulate soybean shade avoidance in response to reduced blue light. Mol. Plant 2021, 14, 298–314. [Google Scholar] [CrossRef]
  8. Sun, J.; Zheng, Y.; Guo, J.; Zhang, Y.; Liu, Y.; Tao, Y.; Wang, M.; Liu, T.; Liu, Y.; Li, X.; et al. GmGAMYB-BINDING PROTEIN 1 promotes small auxin-up RNA gene transcription to modulate soybean maturity and height. Plant Physiol. 2023, 193, 775–791. [Google Scholar] [CrossRef] [PubMed]
  9. Chen, L.; Nan, H.; Kong, L.; Yue, L.; Yang, H.; Zhao, Q.; Fang, C.; Li, H.; Cheng, Q.; Lu, S.; et al. Soybean AP1 homologs control flowering time and plant height. J. Integr. Plant Biol. 2020, 62, 1868–1879. [Google Scholar] [CrossRef] [PubMed]
  10. Meng, Y.; Chen, F.; Shuai, H.; Luo, X.; Ding, J.; Tang, S.; Xu, S.; Liu, J.; Liu, W.; Du, J.; et al. Karrikins delay soybean seed germination by mediating abscisic acid and gibberellin biogenesis under shaded conditions. Sci. Rep. 2016, 6, 22073. [Google Scholar] [CrossRef]
  11. Yang, F.; Liu, Q.; Cheng, Y.; Feng, L.; Wu, X.; Fan, Y.; Raza, M.A.; Wang, X.; Yong, T.; Liu, W.; et al. Low red/far-red ratio as a signal promotes carbon assimilation of soybean seedlings by increasing the photosynthetic capacity. BMC Plant Biol. 2020, 20, 148. [Google Scholar] [CrossRef] [PubMed]
  12. Feng, L.; Raza, M.A.; Li, Z.; Chen, Y.; Khalid, M.H.B.; Du, J.; Liu, W.; Wu, X.; Song, C.; Yu, L.; et al. The Influence of Light Intensity and Leaf Movement on Photosynthesis Characteristics and Carbon Balance of Soybean. Front. Plant Sci. 2018, 9, 1952. [Google Scholar] [CrossRef] [PubMed]
  13. Yao, X.; Zhou, H.; Zhu, Q.; Li, C.; Zhang, H.; Wu, J.J.; Xie, F. Photosynthetic Response of Soybean Leaf to Wide Light-Fluctuation in Maize-Soybean Intercropping System. Front. Plant Sci. 2017, 8, 1695. [Google Scholar] [CrossRef] [PubMed]
  14. Fan, Y.; Chen, J.; Wang, Z.; Tan, T.; Li, S.; Li, J.; Wang, B.; Zhang, J.; Cheng, Y.; Wu, X.; et al. Soybean (Glycine max L. Merr.) seedlings response to shading: Leaf structure, photosynthesis and proteomic analysis. BMC Plant Biol. 2019, 19, 34. [Google Scholar] [CrossRef]
  15. Fan, Y.; Chen, J.; Cheng, Y.; Raza, M.A.; Wu, X.; Wang, Z.; Liu, Q.; Wang, R.; Wang, X.; Yong, T.; et al. Effect of shading and light recovery on the growth, leaf structure, and photosynthetic performance of soybean in a maize-soybean relay-strip intercropping system. PLoS ONE 2018, 13, e0198159. [Google Scholar] [CrossRef]
  16. Gong, W.; Qi, P.; Du, J.; Sun, X.; Wu, X.; Song, C.; Liu, W.; Wu, Y.; Yu, X.; Yong, T.; et al. Transcriptome analysis of shade-induced inhibition on leaf size in relay intercropped soybean. PLoS ONE 2014, 9, e98465. [Google Scholar] [CrossRef]
  17. Wu, Y.; Gong, W.; Yang, W. Shade Inhibits Leaf Size by Controlling Cell Proliferation and Enlargement in Soybean. Sci. Rep. 2017, 7, 9259. [Google Scholar] [CrossRef]
  18. Dias, A.P.S.; Li, X.; Harmon, P.F.; Harmon, C.L.; Yang, X.B. Effects of Shade Intensity and Duration on Asian Soybean Rust Caused by Phakopsora pachyrhizi. Plant Dis. 2011, 95, 485–489. [Google Scholar] [CrossRef]
  19. Li, G.; Wang, Q.; Lu, L.; Wang, S.; Chen, X.; Khan, M.H.U.; Zhang, Y.; Yang, S. Identification of the soybean small auxin upregulated RNA (SAUR) gene family and specific haplotype for drought tolerance. Biologia 2022, 77, 1197–1217. [Google Scholar] [CrossRef]
  20. Chen, L.; Yang, H.; Fang, Y.; Guo, W.; Chen, H.; Zhang, X.; Dai, W.; Chen, S.; Hao, Q.; Yuan, S.; et al. Overexpression of GmMYB14 improves high-density yield and drought tolerance of soybean through regulating plant architecture mediated by the brassinosteroid pathway. Plant Biotechnol. J. 2021, 19, 702–716. [Google Scholar] [CrossRef]
  21. Chen, Y.; Hao, X.; Cao, J. Small auxin upregulated RNA (SAUR) gene family in maize: Identification, evolution, and its phylogenetic comparison with Arabidopsis, rice, and sorghum. J. Integr. Plant Biol. 2014, 56, 133–150. [Google Scholar] [CrossRef]
  22. Zhang, H.; Yu, Z.; Yao, X.; Chen, J.; Chen, X.; Zhou, H.; Lou, Y.; Ming, F.; Jin, Y. Genome-wide identification and characterization of small auxin-up RNA (SAUR) gene family in plants: Evolution and expression profiles during normal growth and stress response. BMC Plant Biol. 2021, 21, 4. [Google Scholar] [CrossRef] [PubMed]
  23. Guo, G.; Yu, T.; Zhang, H.; Chen, M.; Dong, W.; Zhang, S.; Tang, X.; Liu, L.; Heng, W.; Zhu, L.; et al. Evidence That PbrSAUR72 Contributes to Iron Deficiency Tolerance in Pears by Facilitating Iron Absorption. Plants 2023, 12, 2173. [Google Scholar] [CrossRef] [PubMed]
  24. Huang, X.; Lu, Z.; Zhai, L.; Li, N.; Yan, H. The Small Auxin-Up RNA SAUR10 Is Involved in the Promotion of Seedling Growth in Rice. Plants 2023, 12, 3880. [Google Scholar] [CrossRef]
  25. Qiu, T.; Qi, M.; Ding, X.; Zheng, Y.; Zhou, T.; Chen, Y.; Han, N.; Zhu, M.; Bian, H.; Wang, J. The SAUR41 subfamily of SMALL AUXIN UP RNA genes is abscisic acid inducible to modulate cell expansion and salt tolerance in Arabidopsis thaliana seedlings. Ann. Bot. 2020, 125, 805–819. [Google Scholar] [CrossRef]
  26. Stortenbeker, N.; Bemer, M. The SAUR gene family: The plant’s toolbox for adaptation of growth and development. J. Exp. Bot. 2019, 70, 17–27. [Google Scholar] [CrossRef]
  27. Muday, G.K.; Ren, H.; Park, M.Y.; Spartz, A.K.; Wong, J.H.; Gray, W.M. A subset of plasma membrane-localized PP2C.D phosphatases negatively regulate SAUR-mediated cell expansion in Arabidopsis. PLoS Genet. 2018, 14, e1007455. [Google Scholar]
  28. Spartz, A.K.; Ren, H.; Park, M.Y.; Grandt, K.N.; Lee, S.H.; Murphy, A.S.; Sussman, M.R.; Overvoorde, P.J.; Gray, W.M. SAUR Inhibition of PP2C-D Phosphatases Activates Plasma Membrane H+-ATPases to Promote Cell Expansion in Arabidopsis. Plant Cell 2014, 26, 2129–2142. [Google Scholar] [CrossRef] [PubMed]
  29. Wong, J.H.; Spartz, A.K.; Park, M.Y.; Du, M.; Gray, W.M. Mutation of a Conserved Motif of PP2C.D Phosphatases Confers SAUR Immunity and Constitutive Activity. Plant Physiol. 2019, 181, 353–366. [Google Scholar] [CrossRef]
  30. Du, M.; Spalding, E.P.; Gray, W.M. Rapid Auxin-Mediated Cell Expansion. Annu. Rev. Plant Biol. 2020, 71, 379–402. [Google Scholar] [CrossRef]
  31. Hur, Y.-S.; Oh, J.; Kim, N.; Kim, S.; Son, O.; Kim, J.; Um, J.-H.; Ji, Z.; Kim, M.-h.; Ko, J.-H.; et al. Arabidopsis transcription factor TCP13 promotes shade avoidance syndrome-like responses by directly targeting a subset of shade-responsive gene promoters. J. Exp. Bot. 2024, 75, 241–257. [Google Scholar] [CrossRef]
  32. Nagpal, P.; Reeves, P.H.; Wong, J.H.; Armengot, L.; Chae, K.; Rieveschl, N.B.; Trinidad, B.; Davidsdottir, V.; Jain, P.; Gray, W.M.; et al. SAUR63 stimulates cell growth at the plasma membrane. PLoS Genet. 2022, 18, e1010375. [Google Scholar] [CrossRef] [PubMed]
  33. Rovira, A.; Sentandreu, M.; Nagatani, A.; Leivar, P.; Monte, E. The Sequential Action of MIDA9/PP2C.D1, PP2C.D2, and PP2C.D5 Is Necessary to Form and Maintain the Hook After Germination in the Dark. Front. Plant Sci. 2021, 12, 636098. [Google Scholar] [CrossRef] [PubMed]
  34. Minami, A.; Takahashi, K.; Inoue, S.-i.; Tada, Y.; Kinoshita, T. Brassinosteroid Induces Phosphorylation of the Plasma Membrane H+-ATPase during Hypocotyl Elongation in Arabidopsis thaliana. Plant Cell Physiol. 2019, 60, 935–944. [Google Scholar] [CrossRef]
  35. Spartz, A.K.; Lor, V.S.; Ren, H.; Olszewski, N.E.; Miller, N.D.; Wu, G.; Spalding, E.P.; Gray, W.M. Constitutive Expression of Arabidopsis SMALL AUXIN UP RNA19 (SAUR19) in Tomato Confers Auxin-Independent Hypocotyl Elongation. Plant Physiol. 2017, 173, 1453–1462. [Google Scholar] [CrossRef]
  36. Kong, Y.; Zhu, Y.; Gao, C.; She, W.; Lin, W.; Chen, Y.; Han, N.; Bian, H.; Zhu, M.; Wang, J. Tissue-Specific Expression of SMALL AUXIN UP RNA41 Differentially Regulates Cell Expansion and Root Meristem Patterning in Arabidopsis. Plant Cell Physiol. 2013, 54, 609–621. [Google Scholar] [CrossRef]
  37. Hou, K.; Wu, W.; Gan, S.-S. SAUR36, a SMALL AUXIN UP RNA Gene, Is Involved in the Promotion of Leaf Senescence in Arabidopsis. Plant Physiol. 2013, 161, 1002–1009. [Google Scholar] [CrossRef]
  38. Xu, X.; Feng, G.; Li, P.; Yu, S.; Hao, F.; Nie, G.; Huang, L.; Zhang, X. Genome-wide association analysis reveals the function of DgSAUR71 in plant height improvement. BMC Plant Biol. 2025, 25, 240. [Google Scholar] [CrossRef] [PubMed]
  39. Liu, Y.; Liu, Y.; He, Y.; Yan, Y.; Yu, X.; Ali, M.; Pan, C.; Lu, G.; Murphy, A. Cytokinin-inducible response regulator SlRR6 controls plant height through gibberellin and auxin pathways in tomato. J. Exp. Bot. 2023, 74, 4471–4488. [Google Scholar] [CrossRef]
  40. Liu, R.; Wen, S.-S.; Sun, T.-T.; Wang, R.; Zuo, W.-T.; Yang, T.; Wang, C.; Hu, J.-J.; Lu, M.-Z.; Wang, L.-Q.; et al. PagWOX11/12a positively regulates the PagSAUR36 gene that enhances adventitious root development in poplar. J. Exp. Bot. 2022, 73, 7298–7311. [Google Scholar] [CrossRef]
  41. Li, M.; Liu, C.; Hepworth, S.R.; Ma, C.; Li, H.; Li, J.; Wang, S.-M.; Yin, H. SAUR15 interaction with BRI1 activates plasma membrane H+-ATPase to promote organ development of Arabidopsis. Plant Physiol. 2022, 189, 2454–2466. [Google Scholar] [CrossRef]
  42. Wen, Z.; Mei, Y.; Zhou, J.; Cui, Y.; Wang, D.; Wang, N.N. SAUR49 Can Positively Regulate Leaf Senescence by Suppressing SSPP in Arabidopsis. Plant Cell Physiol. 2020, 61, 644–658. [Google Scholar] [CrossRef]
  43. Gastaldi, V.; Lucero, L.E.; Ferrero, L.V.; Ariel, F.D.; Gonzalez, D.H. Class-I TCP Transcription Factors Activate the SAUR63 Gene Subfamily in Gibberellin-Dependent Stamen Filament Elongation. Plant Physiol. 2020, 182, 2096–2110. [Google Scholar] [CrossRef]
  44. Kathare, P.K.; Dharmasiri, S.; Dharmasiri, N. SAUR53 regulates organ elongation and apical hook development in Arabidopsis. Plant Signal. Behav. 2018, 13, e1514896. [Google Scholar] [CrossRef]
  45. He, S.-L.; Hsieh, H.-L.; Jauh, G.-Y. SMALL AUXIN UP RNA62/75 Are Required for the Translation of Transcripts Essential for Pollen Tube Growth. Plant Physiol. 2018, 178, 626–640. [Google Scholar] [CrossRef] [PubMed]
  46. Li, X.-M.; Zhai, H.-H.; An, X.-H.; Zhang, H.; Zhang, X.; Wang, P.; Chen, H.; Tian, Y. PpSAUR5 promotes plant growth by regulating lignin and hormone pathways. Front. Plant Sci. 2024, 15, 1291693. [Google Scholar] [CrossRef]
  47. Yin, C.; Sun, A.; Zhou, Y.; Liu, K.; Wang, P.; Ye, W.; Fang, Y.; Gibbs, D. The dynamics of H2A.Z on SMALL AUXIN UP RNAs regulate abscisic acid–auxin signaling crosstalk in Arabidopsis. J. Exp. Bot. 2023, 74, 4158–4168. [Google Scholar] [CrossRef] [PubMed]
  48. Bianchimano, L.; De Luca, M.B.; Borniego, M.B.; Iglesias, M.J.; Casal, J.J. Temperature regulation of auxin-related gene expression and its implications for plant growth. J. Exp. Bot. 2023, 74, 7015–7033. [Google Scholar] [CrossRef]
  49. Ferrero, L.V.; Gastaldi, V.; Ariel, F.D.; Viola, I.L.; Gonzalez, D.H. Class I TCP proteins TCP14 and TCP15 are required for elongation and gene expression responses to auxin. Plant Mol. Biol. 2021, 105, 147–159. [Google Scholar] [CrossRef]
  50. Yang, H.; Klopotek, Y.; Hajirezaei, M.R.; Zerche, S.; Franken, P.; Druege, U. Role of auxin homeostasis and response in nitrogen limitation and dark stimulation of adventitious root formation in petunia cuttings. Ann. Bot. 2019, 124, 1053–1066. [Google Scholar] [CrossRef] [PubMed]
  51. Sun, N.; Wang, J.; Gao, Z.; Dong, J.; He, H.; Terzaghi, W.; Wei, N.; Deng, X.W.; Chen, H. Arabidopsis SAURs are critical for differential light regulation of the development of various organs. Proc. Natl. Acad. Sci. USA 2016, 113, 6071–6076. [Google Scholar] [CrossRef] [PubMed]
  52. Zhang, Y.; Li, Q.; Jiang, M.; Tian, H.; Khalid, M.H.B.; Wang, Y.; Yu, H. The Small Auxin-Up RNA 50 (SAUR50) Gene from Ammopiptanthus nanus Negatively Regulates Drought Tolerance. Plants 2024, 13, 2512. [Google Scholar] [CrossRef]
  53. Xu, K.; Lou, Q.; Wang, D.; Li, T.; Chen, S.; Li, T.; Luo, L.; Chen, L. Overexpression of a novel small auxin-up RNA gene, OsSAUR11, enhances rice deep rootedness. BMC Plant Biol. 2023, 23, 319. [Google Scholar] [CrossRef]
  54. Ma, S.; Hu, H.; Zhang, H.; Ma, F.; Gao, Z.; Li, X. Physiological response and transcriptome analyses of leguminous Indigofera bungeana Walp. to drought stress. PeerJ 2023, 11, e15440. [Google Scholar] [CrossRef]
  55. Chen, F.; Wang, R.-J.; Wu, C.-J.; Lin, M.; Yan, H.-W.; Xiang, Y. SAUR8, a small auxin-up RNA gene in poplar, confers drought tolerance to transgenic Arabidopsis plants. Gene 2022, 837, 146692. [Google Scholar] [CrossRef]
  56. Wong, J.H.; Klejchová, M.; Snipes, S.A.; Nagpal, P.; Bak, G.; Wang, B.; Dunlap, S.; Park, M.Y.; Kunkel, E.N.; Trinidad, B.; et al. SAUR proteins and PP2C.D phosphatases regulate H+-ATPases and K+ channels to control stomatal movements. Plant Physiol. 2021, 185, 256–273. [Google Scholar] [CrossRef]
  57. Li, M.; Chen, R.; Gu, H.; Cheng, D.; Guo, X.; Shi, C.; Li, L.; Xu, G.; Gu, S.; Wu, Z.; et al. Grape Small Auxin Upregulated RNA (SAUR) 041 Is a Candidate Regulator of Berry Size in Grape. Int. J. Mol. Sci. 2021, 22, 11818. [Google Scholar] [CrossRef]
  58. Ren, H.; Gray, W.M. SAUR Proteins as Effectors of Hormonal and Environmental Signals in Plant Growth. Mol. Plant 2015, 8, 1153–1164. [Google Scholar] [CrossRef] [PubMed]
  59. van Mourik, H.; van Dijk, A.D.J.; Stortenbeker, N.; Angenent, G.C.; Bemer, M. Divergent regulation of Arabidopsis SAUR genes: A focus on the SAUR10-clade. BMC Plant Biol. 2017, 17, 245. [Google Scholar] [CrossRef]
  60. Bai, M.-Y.; Shang, J.-X.; Oh, E.; Fan, M.; Bai, Y.; Zentella, R.; Sun, T.-P.; Wang, Z.-Y. Brassinosteroid, gibberellin and phytochrome impinge on a common transcription module in Arabidopsis. Nat. Cell Biol. 2012, 14, 810–817. [Google Scholar] [CrossRef] [PubMed]
  61. Stamm, P.; Kumar, P.P. Auxin and gibberellin responsive Arabidopsis SMALL AUXIN UP RNA36 regulates hypocotyl elongation in the light. Plant Cell Rep. 2013, 32, 759–769. [Google Scholar] [CrossRef]
  62. Lin, Z.; Zhu, P.; Gao, L.; Chen, X.; Li, M.; Wang, Y.; He, J.; Miao, Y.; Miao, R. Recent Advances in Understanding the Regulatory Mechanism of Plasma Membrane H+-ATPase through the Brassinosteroid Signaling Pathway. Plant Cell Physiol. 2024, 65, 1515–1529. [Google Scholar] [CrossRef] [PubMed]
  63. Oh, E.; Zhu, J.-Y.; Bai, M.-Y.; Arenhart, R.A.; Sun, Y.; Wang, Z.-Y. Cell elongation is regulated through a central circuit of interacting transcription factors in the Arabidopsis hypocotyl. eLife 2014, 3, e03031. [Google Scholar] [CrossRef]
  64. Wiesel, L.; Davis, J.L.; Milne, L.; Redondo Fernandez, V.; Herold, M.B.; Middlefell Williams, J.; Morris, J.; Hedley, P.E.; Harrower, B.; Newton, A.C.; et al. A transcriptional reference map of defence hormone responses in potato. Sci. Rep. 2015, 5, 15229. [Google Scholar] [CrossRef]
  65. Shi, Y.; Zhao, Y.; Yao, Q.; Liu, F.; Li, X.; Jin, X.; Zhang, Y.; Ahammed, G.J. Comparative Physiological and Transcriptomic Analyses Reveal Mechanisms of Exogenous Spermidine-Induced Tolerance to Low-Iron Stress in Solanum lycopersicum L. Antioxidants 2022, 11, 1260. [Google Scholar] [CrossRef]
  66. Kodaira, K.-S.; Qin, F.; Tran, L.-S.P.; Maruyama, K.; Kidokoro, S.; Fujita, Y.; Shinozaki, K.; Yamaguchi-Shinozaki, K. Arabidopsis Cys2/His2 Zinc-Finger Proteins AZF1 and AZF2 Negatively Regulate Abscisic Acid-Repressive and Auxin-Inducible Genes under Abiotic Stress Conditions. Plant Physiol. 2011, 157, 742–756. [Google Scholar] [CrossRef]
  67. Nemhauser, J.L.; Hong, F.; Chory, J. Different Plant Hormones Regulate Similar Processes through Largely Nonoverlapping Transcriptional Responses. Cell 2006, 126, 467–475. [Google Scholar] [CrossRef]
  68. Roig-Villanova, I.; Bou-Torrent, J.; Galstyan, A.; Carretero-Paulet, L.; Portolés, S.; Rodríguez-Concepción, M.; Martínez-García, J.F. Interaction of shade avoidance and auxin responses: A role for two novel atypical bHLH proteins. EMBO J. 2007, 26, 4756–4767. [Google Scholar] [CrossRef]
  69. OuYang, F.; Mao, J.-F.; Wang, J.; Zhang, S.; Li, Y. Transcriptome Analysis Reveals that Red and Blue Light Regulate Growth and Phytohormone Metabolism in Norway Spruce [Picea abies (L.) Karst.]. PLoS ONE 2015, 10, e0127896. [Google Scholar] [CrossRef] [PubMed]
  70. Hu, W.; Yan, H.; Luo, S.; Pan, F.; Wang, Y.; Xiang, Y. Genome-wide analysis of poplar SAUR gene family and expression profiles under cold, polyethylene glycol and indole-3-acetic acid treatments. Plant Physiol. Biochem. 2018, 128, 50–65. [Google Scholar] [PubMed]
  71. Wu, J.; Liu, S.; He, Y.; Guan, X.; Zhu, X.; Cheng, L.; Wang, J.; Lu, G. Genome-wide analysis of SAUR gene family in Solanaceae species. Gene 2012, 509, 38–50. [Google Scholar] [CrossRef]
  72. Fowler, S.; Thomashow, M.F. Arabidopsis Transcriptome Profiling Indicates That Multiple Regulatory Pathways Are Activated during Cold Acclimation in Addition to the CBF Cold Response Pathway. Plant Cell 2002, 14, 1675–1690. [Google Scholar] [CrossRef]
  73. Guo, Y.; Jiang, Q.; Hu, Z.; Sun, X.; Fan, S.; Zhang, H. Function of the auxin-responsive gene TaSAUR75 under salt and drought stress. Crop J. 2018, 6, 181–190. [Google Scholar] [CrossRef]
  74. Franklin, K.A.; Lee, S.H.; Patel, D.; Kumar, S.V.; Spartz, A.K.; Gu, C.; Ye, S.; Yu, P.; Breen, G.; Cohen, J.D.; et al. PHYTOCHROME-INTERACTING FACTOR 4 (PIF4) regulates auxin biosynthesis at high temperature. Proc. Natl. Acad. Sci. USA 2011, 108, 20231–20235. [Google Scholar] [CrossRef]
  75. Han, G.; Li, Y.; Yang, Z.; Wang, C.; Zhang, Y.; Wang, B. Molecular Mechanisms of Plant Trichome Development. Front. Plant Sci. 2022, 13, 910228. [Google Scholar] [CrossRef]
  76. Sun, C.; Wei, J.; Gu, X.; Wu, M.; Li, M.; Liu, Y.; An, N.; Wu, K.; Wu, S.; Wu, J.; et al. Different multicellular trichome types coordinate herbivore mechanosensing and defense in tomato. Plant Cell 2024, 36, 4952–4969. [Google Scholar] [CrossRef]
  77. Zheng, X.; Jian, Y.; Long, Q.; Luo, Y.; Xu, X.; Zhang, Q.; Cheng, Y.; Huang, B.; Qiu, D.; Li, Z.; et al. SlASR3 mediates crosstalk between auxin and jasmonic acid signaling to regulate trichome formation in tomato. Plant J. 2025, 121, e70053, Erratum in Plant J. 2025, 122, e70220. https://doi.org/10.1111/tpj.70220. [Google Scholar] [CrossRef]
  78. Chen, G.; Klinkhamer, P.G.L.; Escobar-Bravo, R.; Leiss, K.A. Type VI glandular trichome density and their derived volatiles are differently induced by jasmonic acid in developing and fully developed tomato leaves: Implications for thrips resistance. Plant Sci. 2018, 276, 87–98. [Google Scholar] [CrossRef] [PubMed]
  79. Ali, M.S.; Baek, K.H. Jasmonic Acid Signaling Pathway in Response to Abiotic Stresses in Plants. Int. J. Mol. Sci. 2020, 21, 621. [Google Scholar] [CrossRef] [PubMed]
  80. Marquis, V.; Smirnova, E.; Graindorge, S.; Delcros, P.; Villette, C.; Zumsteg, J.; Heintz, D.; Heitz, T. Broad-spectrum stress tolerance conferred by suppressing jasmonate signaling attenuation in Arabidopsis JASMONIC ACID OXIDASE mutants. Plant J. 2022, 109, 856–872. [Google Scholar] [CrossRef]
  81. Rehman, M.; Saeed, M.S.; Fan, X.; Salam, A.; Munir, R.; Yasin, M.U.; Khan, A.R.; Muhammad, S.; Ali, B.; Ali, I.; et al. The Multifaceted Role of Jasmonic Acid in Plant Stress Mitigation: An Overview. Plants 2023, 12, 3982. [Google Scholar] [CrossRef]
  82. Attia, H.; Alamer, K.H. Supplementation of Jasmonic acid Mitigates the Damaging Effects of Arsenic Stress on Growth, Photosynthesis and Nitrogen Metabolism in Rice. Rice 2024, 17, 31. [Google Scholar] [CrossRef] [PubMed]
  83. Yoshida, Y.; Sano, R.; Wada, T.; Takabayashi, J.; Okada, K. Jasmonic acid control of GLABRA3 links inducible defense and trichome patterning in Arabidopsis. Development 2009, 136, 1039–1048. [Google Scholar] [CrossRef] [PubMed]
  84. Escobar-Bravo, R.; Klinkhamer, P.G.L.; Leiss, K.A. Induction of Jasmonic Acid-Associated Defenses by Thrips Alters Host Suitability for Conspecifics and Correlates with Increased Trichome Densities in Tomato. Plant Cell Physiol. 2017, 58, 622–634. [Google Scholar] [CrossRef]
  85. Li, J.; Yu, G.; Wang, X.; Guo, C.; Wang, Y.; Wang, X. Jasmonic acid plays an important role in mediating retrograde signaling under mitochondrial translational stress to balance plant growth and defense. Plant Commun. 2025, 6, 101133. [Google Scholar] [CrossRef]
  86. Rahman, M.M.; Mostofa, M.G.; Keya, S.S.; Ghosh, P.K.; Abdelrahman, M.; Anik, T.R.; Gupta, A.; Tran, L.-S.P. Jasmonic acid priming augments antioxidant defense and photosynthesis in soybean to alleviate combined heat and drought stress effects. Plant Physiol. Biochem. 2024, 206, 108193. [Google Scholar] [CrossRef]
  87. Tao, Y.; Huang, J.; Jing, H.K.; Shen, R.F.; Zhu, X.F. Jasmonic acid is involved in root cell wall phosphorus remobilization through the nitric oxide dependent pathway in rice. J. Exp. Bot. 2022, 73, 2618–2630. [Google Scholar] [CrossRef] [PubMed]
  88. Traw, M.B.; Bergelson, J. Interactive effects of jasmonic acid, salicylic acid, and gibberellin on induction of trichomes in Arabidopsis. Plant Physiol. 2003, 133, 1367–1375. [Google Scholar] [CrossRef]
  89. Li, S.; Cong, Y.; Liu, Y.; Wang, T.; Shuai, Q.; Chen, N.; Gai, J.; Li, Y. Optimization of Agrobacterium-Mediated Transformation in Soybean. Front. Plant Sci. 2017, 8, 246. [Google Scholar] [CrossRef]
  90. Zhong, H.; Li, C.; Yu, W.; Zhou, H.-P.; Lieber, T.; Su, X.; Wang, W.; Bumann, E.; Lunny Castro, R.M.; Jiang, Y.; et al. A fast and genotype-independent in planta Agrobacterium-mediated transformation method for soybean. Plant Commun. 2024, 5, 101063. [Google Scholar] [CrossRef]
  91. Hada, A.; Krishnan, V.; Punjabi, M.; Basak, N.; Pandey, V.; Jeevaraj, T.; Marathe, A.; Gupta, A.K.; Jolly, M.; Kumar, A.; et al. Refined glufosinate selection and its extent of exposure for improving the Agrobacterium-mediated transformation in Indian soybean (Glycine max) genotype JS-335. Plant Biotechnol. 2016, 33, 341–350. [Google Scholar] [CrossRef] [PubMed][Green Version]
  92. Hung, J.-H.; Weng, Z. Sequence Alignment and Homology Search with BLAST and ClustalW. Cold Spring Harb. Protoc. 2016, 11, 1–6. [Google Scholar] [CrossRef]
  93. Larkin, M.A.; Blackshields, G.; Brown, N.P.; Chenna, R.; McGettigan, P.A.; McWilliam, H.; Valentin, F.; Wallace, I.M.; Wilm, A.; Lopez, R.; et al. Clustal W and Clustal X version 2.0. Bioinformatics 2007, 23, 2947–2948. [Google Scholar] [CrossRef]
  94. Tamura, K.; Peterson, D.; Peterson, N.; Stecher, G.; Nei, M.; Kumar, S. MEGA5: Molecular Evolutionary Genetics Analysis Using Maximum Likelihood, Evolutionary Distance, and Maximum Parsimony Methods. Mol. Biol. Evol. 2011, 28, 2731–2739. [Google Scholar] [CrossRef] [PubMed]
  95. Hu, B.; Jin, J.; Guo, A.Y.; Zhang, H.; Luo, J.; Gao, G. GSDS 2.0: An upgraded gene feature visualization server. Bioinformatics 2015, 31, 1296–1297. [Google Scholar] [CrossRef]
  96. Bailey, T.L.; Boden, M.; Buske, F.A.; Frith, M.; Grant, C.E.; Clementi, L.; Ren, J.; Li, W.W.; Noble, W.S. MEME SUITE: Tools for motif discovery and searching. Nucleic Acids Res. 2009, 37, W202–W208. [Google Scholar] [CrossRef]
  97. Bailey, T.L.; Williams, N.; Misleh, C.; Li, W.W. MEME: Discovering and analyzing DNA and protein sequence motifs. Nucleic Acids Res. 2006, 34, W369–W373. [Google Scholar] [CrossRef]
  98. Li, X.; Wu, Y.; Liu, Z.; Wei, H.; Wang, H.; Yu, S. Apical meristem transcriptome analysis identifies a role for the blue light receptor gene GhFKF1 in cotton architecture development. Crop J. 2024, 12, 1126–1136. [Google Scholar] [CrossRef]
  99. Chen, S.; Zhou, Y.; Chen, Y.; Gu, J. fastp: An ultra-fast all-in-one FASTQ preprocessor. Bioinformatics 2018, 34, i884–i890. [Google Scholar] [CrossRef]
  100. Schmutz, J.; Cannon, S.B.; Schlueter, J.; Ma, J.; Mitros, T.; Nelson, W.; Hyten, D.L.; Song, Q.; Thelen, J.J.; Cheng, J.; et al. Genome sequence of the palaeopolyploid soybean. Nature 2010, 463, 178–183. [Google Scholar] [CrossRef] [PubMed]
  101. Shimomura, M.; Kanamori, H.; Komatsu, S.; Namiki, N.; Mukai, Y.; Kurita, K.; Kamatsuki, K.; Ikawa, H.; Yano, R.; Ishimoto, M.; et al. The Glycine max cv. Enrei Genome for Improvement of Japanese Soybean Cultivars. Int. J. Genom. 2015, 2015, 358127. [Google Scholar] [CrossRef]
  102. Kim, D.; Paggi, J.M.; Park, C.; Bennett, C.; Salzberg, S.L. Graph-based genome alignment and genotyping with HISAT2 and HISAT-genotype. Nat. Biotechnol. 2019, 37, 907–915. [Google Scholar] [CrossRef]
  103. Pertea, M.; Kim, D.; Pertea, G.M.; Leek, J.T.; Salzberg, S.L. Transcript-level expression analysis of RNA-seq experiments with HISAT, StringTie and Ballgown. Nat. Protoc. 2016, 11, 1650–1667. [Google Scholar] [CrossRef] [PubMed]
  104. Wu, T.; Hu, E.; Xu, S.; Chen, M.; Guo, P.; Dai, Z.; Feng, T.; Zhou, L.; Tang, W.; Zhan, L.; et al. clusterProfiler 4.0: A universal enrichment tool for interpreting omics data. Innovation 2021, 2, 100141. [Google Scholar] [CrossRef] [PubMed]
  105. Yu, G.; Wang, L.G.; Han, Y.; He, Q.Y. clusterProfiler: An R package for comparing biological themes among gene clusters. Omics 2012, 16, 284–287. [Google Scholar] [CrossRef]
  106. Pertea, M.; Pertea, G.M.; Antonescu, C.M.; Chang, T.C.; Mendell, J.T.; Salzberg, S.L. StringTie enables improved reconstruction of a transcriptome from RNA-seq reads. Nat. Biotechnol. 2015, 33, 290–295. [Google Scholar] [CrossRef] [PubMed]
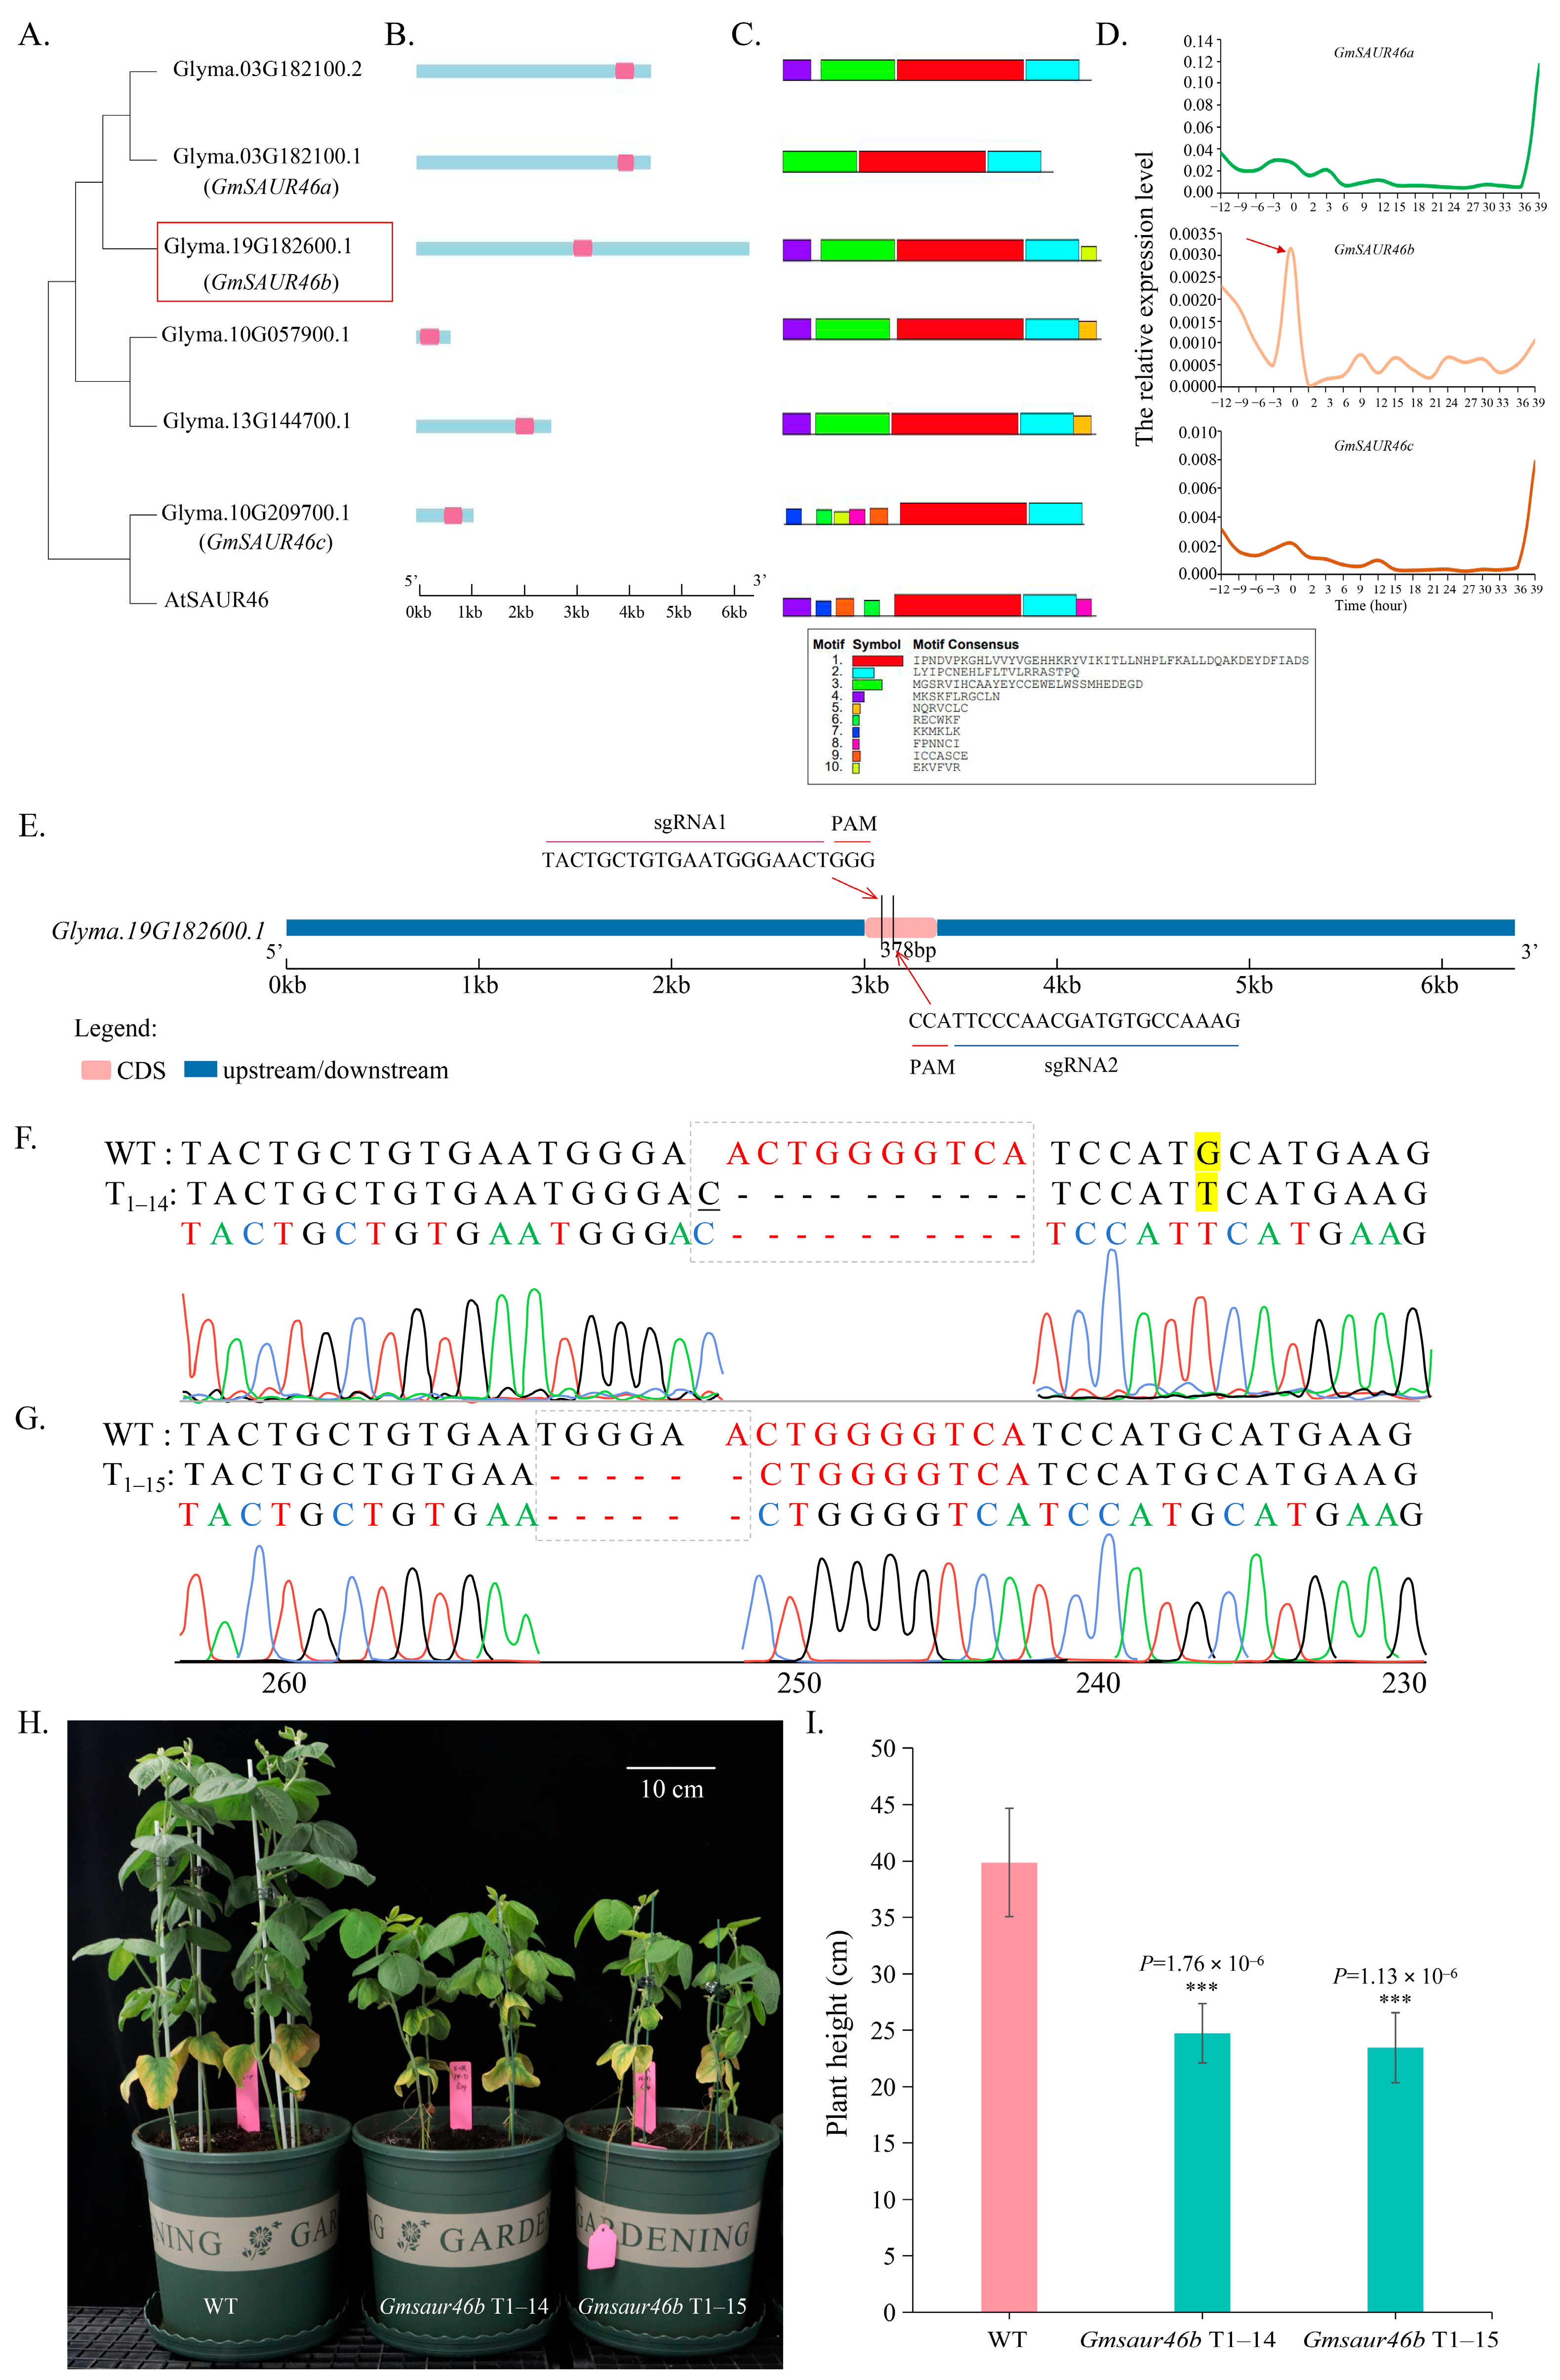
Figure 1. The response of GmSAUR46b to light signals and its regulation of plant height. (AC) Evolutionary analysis (A), gene structure (B), and conserved domain analysis (C) of GmSAUR46s in soybean. (D) Analysis of the light-responsive expression pattern of GmSAUR46s. Data are presented as means ± SD of three replicates. The box and arrow represent the gene GmSAUR46b. (E) The sgRNA sequencing of the CRISPR-Cas9 of GmSAUR46b. (F,G) Identification of the gene-editing status of the T1 generation GmSAUR46b lines numbered 14 (F) and 15 (G) in soybeans. Different colored curves represent different bases. The shaded part is highlighted by a dashed line box, representing base deletions, and the yellow-marked bases indicate base mutations, and the underlined bases represent single-base insertions. (HI) The regulation of soybean plant height by the GmSAUR46b gene-editing lines (numbered 14 and 15) of the T1 generation (H) and their statistical analysis (I). Scale bar, 10 cm. The data are presented as means ± SD of 8 samples of the same line. *** p < 0.001.
Ijms 26 09200 g001
Figure 2. Gene Ontology (GO), Kyoto Encyclopedia of Genes and Genomes (KEGG), and euKaryotic Orthologous Groups (KOG) annotations for the new transcripts. (A) GO annotation secondary classification distribution chart. (B) KEGG annotation of transcript sequences. (C) Direct homology classification of transcripts using the KOG database. The red arrows represent the enriched pathways related to photosynthesis, hormone signaling, cell division, nuclear cell elongation.
Ijms 26 09200 g002
Figure 3. (A) Nr-annotated species distribution map. (B) Transcript density distribution map. From outside to inside, they are the chromosomes, all transcripts, known transcripts, and new transcripts, and the positive and negative strands are distinguished.
Ijms 26 09200 g003
Figure 4. Box plot of gene expression. This composite plot illustrates the distribution of the gene expression levels across different samples. The upper portion shows individual gene expression data points, while the lower box-and-whisker plot displays key statistical summaries (maximum, upper quartile, median, lower quartile, and minimum) of the gene expression for each sample group. Different colors represent distinct sample categories, allowing for the comparison of the gene expression patterns and variability among various samples.
Ijms 26 09200 g004
Figure 5. Analysis of differentially expressed genes (DEGs). (A) Analysis of sample correlation. (B) Principal component analysis (PCA). (C) Statistical analysis of DEGs. (D) Cluster analysis of DEGs. Heatmaps are drawn based on the expression levels of genes in each sample, with each column representing a sample and each row representing a gene in the map. W82, Williams 82; CR, the CRISPR-Cas9-edited lines of GmSAUR46b; OE, the 35S overexpression mutant lines of GmSAUR46b; L, leaf; S, shoot apical meristem (SAM); ST, stem; 1, the stage when the first trifoliate leaf of soybean unfolds and flattens; 2, the stage when the second trifoliate leaf of soybean unfolds and flattens; 3, the stage when the third trifoliate leaf of soybean unfolds and flattens; Up, up-expressed DEGs; Down, down-expressed DEGs.
Ijms 26 09200 g005
Figure 6. GO functional enrichment analysis of differentially expressed genes based on RNA-Seq sequencing results. W82, Williams 82; L, leaf; S, shoot apical meristem; ST, stem; 1, the stage when the first trifoliate leaf of soybean unfolds and flattens; 2, the stage when the second trifoliate leaf of soybean unfolds and flattens; 3, the stage when the third trifoliate leaf of soybean unfolds and flattens; the red arrow, the enriched pathway related to hormone metabolism; OE, overexpression lines.
Ijms 26 09200 g006
Figure 7. GmSAUR46b regulates the soybean leaf anatomical structure in a light-dependent manner. (A) Paraffin sections of leaf midribs from wild-type (WT), 35S-GmSAUR46b overexpression (OE), and Gmsaur46b knockout (KO) plants under control (CK, normal light) and shade conditions. Scale bar = 100 μm. (B) Statistical analysis of leaf midrib thickness under CK and shade conditions for WT, OE, and KO lines. (C) Statistical analysis of leaf midrib thickness under shade conditions for WT, OE, and KO lines. (D) Paraffin sections of leaf blades (showing mesophyll, upper epidermis, and lower epidermis) from WT, OE, and KO plants under CK and shade conditions. Scale bar = 100 μm. (EH) Statistical analyses of lower epidermis thickness (E), upper epidermis thickness (F), mesophyll thickness (G), and leaf vein thickness (H) under CK and shade conditions for WT, OE, and KO lines. Data are presented as mean ± SD. *** p < 0.001, ** 0.001 ≤ p < 0.01, * 0.01 ≤ p < 0.05 (Student’s t-test).
Ijms 26 09200 g007
Figure 8. GmSAUR46b regulates the soybean stem epidermal hair density in a light-dependent manner. (A) Scanning electron microscopy (SEM) images of stem epidermal hairs from wild-type (WT), 35S-GmSAUR46b overexpression (OE), and Gmsaur46b knockout (KO) plants under control (CK, normal light) conditions. Scale bar, 1.00 mm. (B) Statistical analysis of stem epidermal hair number per unit area under CK conditions for WT, OE, and KO lines. (C) SEM images of stem epidermal hairs from WT, OE, and KO plants under shade conditions. Scale bar, 1.00 mm. (D) Statistical analysis of stem epidermal hair number per unit area under shade conditions for WT, OE, and KO lines. Data are presented as mean ± SD. *** p < 0.001 (Student’s t-test).
Ijms 26 09200 g008
Figure 9. Expression patterns of genes related to trichome development and cell wall modification. (A) Expression of GLABRA homologs (including GLYMA_08G204700, GLYMA_13G357100, etc.) in different tissues and genotypes at the V1–V3 stages. (B) Expression of cellulose synthase genes classified into four classes, with the relative expression levels shown.
Ijms 26 09200 g009
Figure 10. A proposed model illustrating GmSAUR46b-mediated regulation of soybean growth, development, and stress responses. Light signals activate GmSAUR46b, which integrates gibberellin (GA) [7], auxin (IAA), and jasmonic acid (JA) signaling pathways to modulate cell elongation. This regulatory cascade influences multiple agronomic and physiological traits: plant height, leaf anatomical features (including midrib structure, mesophyll tissue, and chloroplast thylakoid development), photosynthesis, stem trichome density (with 35S-GmSAUR46b overexpression and GmSAUR46b knockout lines as exemplars), and defense responses. Arrows indicate facilitation, dashed lines indicate regulatory links, and crosses indicate restraint. ATG, a translation initiation factor involved in related regulatory processes.
Ijms 26 09200 g010
Figure 11. Schematic diagram of transcriptome sampling period. Leaves at three developmental stages: first trifoliate leaf unfolded (V1), second trifoliate leaf unfolded (V2), and third trifoliate leaf unfolded (V3).
Ijms 26 09200 g011
Table 1. Results of new transcript types and quantities.
CodeNumber
i260
j33,394
o4204
u3353
x1543
Note: o represents the part on the same strand that overlaps with the reference exon; j represents at least one matching multi-exon; x represents the exon on the reverse strand that overlaps; i represents the intron that is completely contained within the reference transcript; u represents an unknown new transcript; all represents the total number of all types of new transcripts.
Disclaimer/Publisher’s Note: The statements, opinions and data contained in all publications are solely those of the individual author(s) and contributor(s) and not of MDPI and/or the editor(s). MDPI and/or the editor(s) disclaim responsibility for any injury to people or property resulting from any ideas, methods, instructions or products referred to in the content.