Article

Biphasic Adaptations of Gastric Epithelial Cells in Chronic H. pylori Infection from Stress to Tolerance

1
Beijing Key Laboratory of Cancer Invasion and Metastasis Research, Department of Medical Genetics and Developmental Biology, School of Basic Medical Science, Capital Medical University, Beijing 100069, China
2
School of Nursing, Dalian Medical University, Dalian 116044, China
3
Department of Molecular Cell Biology, Graduate School of Medical Sciences, Kyushu University, Higashi-ku, Fukuoka 812-8582, Japan
4
Division of Comparative Medicine, Massachusetts Institute of Technology, Cambridge, MA 02139, USA
5
National Key Laboratory of Intelligent Tracking and Forecasting for Infectious Diseases, Chinese Center for Disease Control and Prevention (Chinese Academy of Preventive Medicine), Beijing 102206, China
6
National Key Laboratory of Intelligent Tracking and Forecasting for Infectious Diseases, National Institute for Communicable Disease Control and Prevention, Chinese Center for Disease Control and Prevention (Chinese Academy of Preventive Medicine), Beijing 102206, China
*
Authors to whom correspondence should be addressed.
These authors contributed equally to this work.
Int. J. Mol. Sci. 2025, 26(18), 9016; https://doi.org/10.3390/ijms26189016
Submission received: 12 August 2025 / Revised: 11 September 2025 / Accepted: 13 September 2025 / Published: 16 September 2025
(This article belongs to the Special Issue Molecular Advances in Helicobacter pylori Infections and Treatments)

Abstract

Helicobacter pylori (H. pylori) is a well-known pathogen associated with chronic gastric infection, progressing from gastritis to gastric adenocarcinoma, but the dynamic phenotypic and molecular characteristics of gastric epithelial cells during sustained infection remain unclear. We established a chronic infection model using the human gastric epithelial cell line GES-1, exposed to H. pylori or its lysate across 30 generations, dynamically assessing cell proliferation, migration, invasion, apoptosis, autophagy, and epithelial–mesenchymal transition (EMT) markers, with RNA sequencing for transcriptomic changes and a Mongolian gerbil model to validate chronic pathological progression. Acute H. pylori exposure induced pronounced morphological changes; suppressed proliferation, migration, and invasion; triggered apoptosis; and blocked autophagic flux, while long-term stimulation reversed these effects. EMT markers showed progressive loss of epithelial characteristics with chronic infection. RNA sequencing revealed a dynamic shift from inflammation-driven apoptosis to adaptive survival mechanisms. In vivo, prolonged infection induced dynamic TLR expression alongside progressive gastric pathology, including atrophy and dysplasia. Our study provides new molecular evidence for dynamic cellular and immunological adaptations of gastric epithelial cells under chronic H. pylori infection, highlighting critical intervention windows for preventing gastric carcinogenesis.

1. Introduction

Helicobacter pylori (H. pylori) is a microaerophilic Gram-negative bacterium that colonizes the human gastric mucosa. Classified as a Group I carcinogen by the World Health Organization (WHO), it plays a critical role in gastric carcinogenesis—a condition that has remained a significant global health burden for decades [1,2,3]. Chronic infection with H. pylori is considered an evidential risk factor for non-cardia gastric cancer development in several cohort studies and associated with the progression from gastritis to atrophic gastritis, intestinal metaplasia, dysplasia, and, ultimately, gastric adenocarcinoma [4,5]. Numerous studies have highlighted the role of H. pylori in disrupting gastric epithelial homeostasis by delivering virulence factors such as cytotoxin-associated gene A (CagA) into host cells through its Type IV Secretion System (T4SS) [6,7,8]. These bacterial components perturb host signaling pathways, thereby influencing key cellular processes: proliferation, apoptosis, autophagy, and epithelial–mesenchymal transition (EMT) [9,10]. Toxic substances from H. pylori’s long-term metabolic lysis contribute to gastric epithelial carcinogenesis; these lysates, containing key virulence factors, recapitulate pathogen–mucosa interactions and drive host responses.
Notably, while these mechanistic insights have advanced our understanding, the experimental models used to investigate such processes require critical evaluation. Although previous studies have frequently utilized acute exposure models to investigate H. pylori-induced pathogenesis, the infection is inherently chronic in vivo, persisting for years due to H. pylori’s intrinsic colonization capacity [11,12]. Consequently, short-term in vitro models may inadequately recapitulate the sustained interactions between H. pylori and gastric epithelial cells. Several studies have successfully established chronic H. pylori infection cell models, which demonstrate altered cell morphology and EMT properties that promote the malignant transformation of gastric epithelial cells [12,13,14]. However, the dynamic functional and inflammatory changes and characteristics of gastric epithelial cells during prolonged H. pylori stimulation remain insufficiently characterized.
In this study, we aimed to characterize the dynamic biological behavior of gastric epithelial cells during long-term H. pylori infection. Using the human gastric epithelial cell line GES-1 as an in vitro model, we investigated how sustained exposure to H. pylori and its components modulates cell proliferation, migration, and invasion as well as the EMT process—along with the corresponding regulatory patterns of gene expression and associated signaling pathways. Our findings provide novel insights into the cellular dynamics underlying H. pylori-associated gastric epithelial transformation and facilitate a more comprehensive understanding of gastric cancer initiation.

2. Results and Discussion

2.1. GES-1 Cells Undergo Morphological Reversion, CagA Fluctuation, and Immune Desensitization During H. pylori Infection

To investigate the dynamic morphological and infectious responses of gastric epithelial cells to H. pylori over time, GES-1 cells were chronically co-cultured with H. pylori for 30 generations. We then analyzed cells subjected to either acute (GES-1 Hp F1) or sustained (GES-1 Hp F30) bacterial exposure.
Upon short-term H. pylori stimulation, GES-1 Hp F1 cells exhibited a characteristic hummingbird phenotype, marked by elongated morphology—consistent with CagA-mediated cytoskeletal rearrangements reported in previous studies [12]. This acute morphological alteration, however, gradually diminished with prolonged exposure. By the 30th generation (GES-1 Hp F30), infected cells had reverted to morphologies similar to those of untreated cells (Figure 1A).
IF analysis of CagA revealed that, in GES-1 Hp F1 cells, CagA signals were highly enriched in the cytoplasm. By the 10th generation, CagA fluorescence intensity decreased significantly. Notably, with further progression to the 30th generation (GES-1 Hp F30), CagA signals rebounded, indicating the development of immune tolerance with attenuated clearance of bacterial toxins (Figure 1B). During H. pylori gastric colonization, besides T4SS-mediated CagA delivery exerting cytotoxic effects, bacterially released toxic proteins continuously stimulate gastric epithelial cells.
In infected individuals, gastric epithelial Toll-like receptors (TLRs) serve as early immune sensors for bacterial components. Toxic substances released during H. pylori proliferation and lysis are recognized by TLRs; such lysates act as pathogenic facilitators in chronic H. pylori infection. We established a GES-1 co-culture model with H. pylori lysate to mimic persistent colonization; quantified TLR4, TLR5, and TLR9 RNA levels in cells at passages 1, 10, 20, and 30 post-lysate stimulation; and concurrently measured inflammatory factors and cytokines in culture supernatants. Initial lysate stimulation (Lysate-GES-1 F1) significantly upregulated TLR4, TLR5, and TLR9 mRNA in GES-1 cells, with gradual downregulation during prolonged exposure (Figure 1C). This aligned with progressive immune desensitization, as multiplex assays showed peak secretion of IL-1β, IL-8, IL-23, IFN-γ, CD66a, CD163, and Fas after first-generation H. pylori lysate stimulation, followed by gradual decline with extended treatment (Figure 1D).
While H. pylori pathogenicity and models are well-characterized [12,13,14,15,16,17,18], few studies address dynamic epithelial changes during inflammation and malignant transformation. Our 30-passage chronic model fills this gap by identifying key adaptive processes in infected GES-1 cells. Acute infection induces the “hummingbird” phenotype [19,20], but prolonged exposure drives morphological reversion—reflecting cellular adaptation to bacterial stress. This aligns with CagA dynamics: acute enrichment, mid-term F10 reduction via initial immune clearance, and late F30 rebound, matching our prior immune tolerance report and indicating attenuated toxin clearance in persistent colonization [13].
H. pylori lysates trigger TLR-mediated inflammatory adaptation [21]. Initial stimulation upregulates TLR4/5/9, which are critical for bacterial recognition, and peaks pro-inflammatory cytokine and immune molecule secretion [22,23]. Prolonged exposure reduces TLR expression and inflammation, revealing desensitization that balances tissue damage and colonization.
Collectively, morphological reversion, CagA rebound, and TLR desensitization form an adaptive state facilitating long-term H. pylori colonization, advancing understanding of host-cell adaptation in chronic infection and gastric disease progression.

2.2. GES-1 Cell Proliferation Is Impaired in Acute H. pylori Infection and Gradually Adapts upon Sustained Exposure

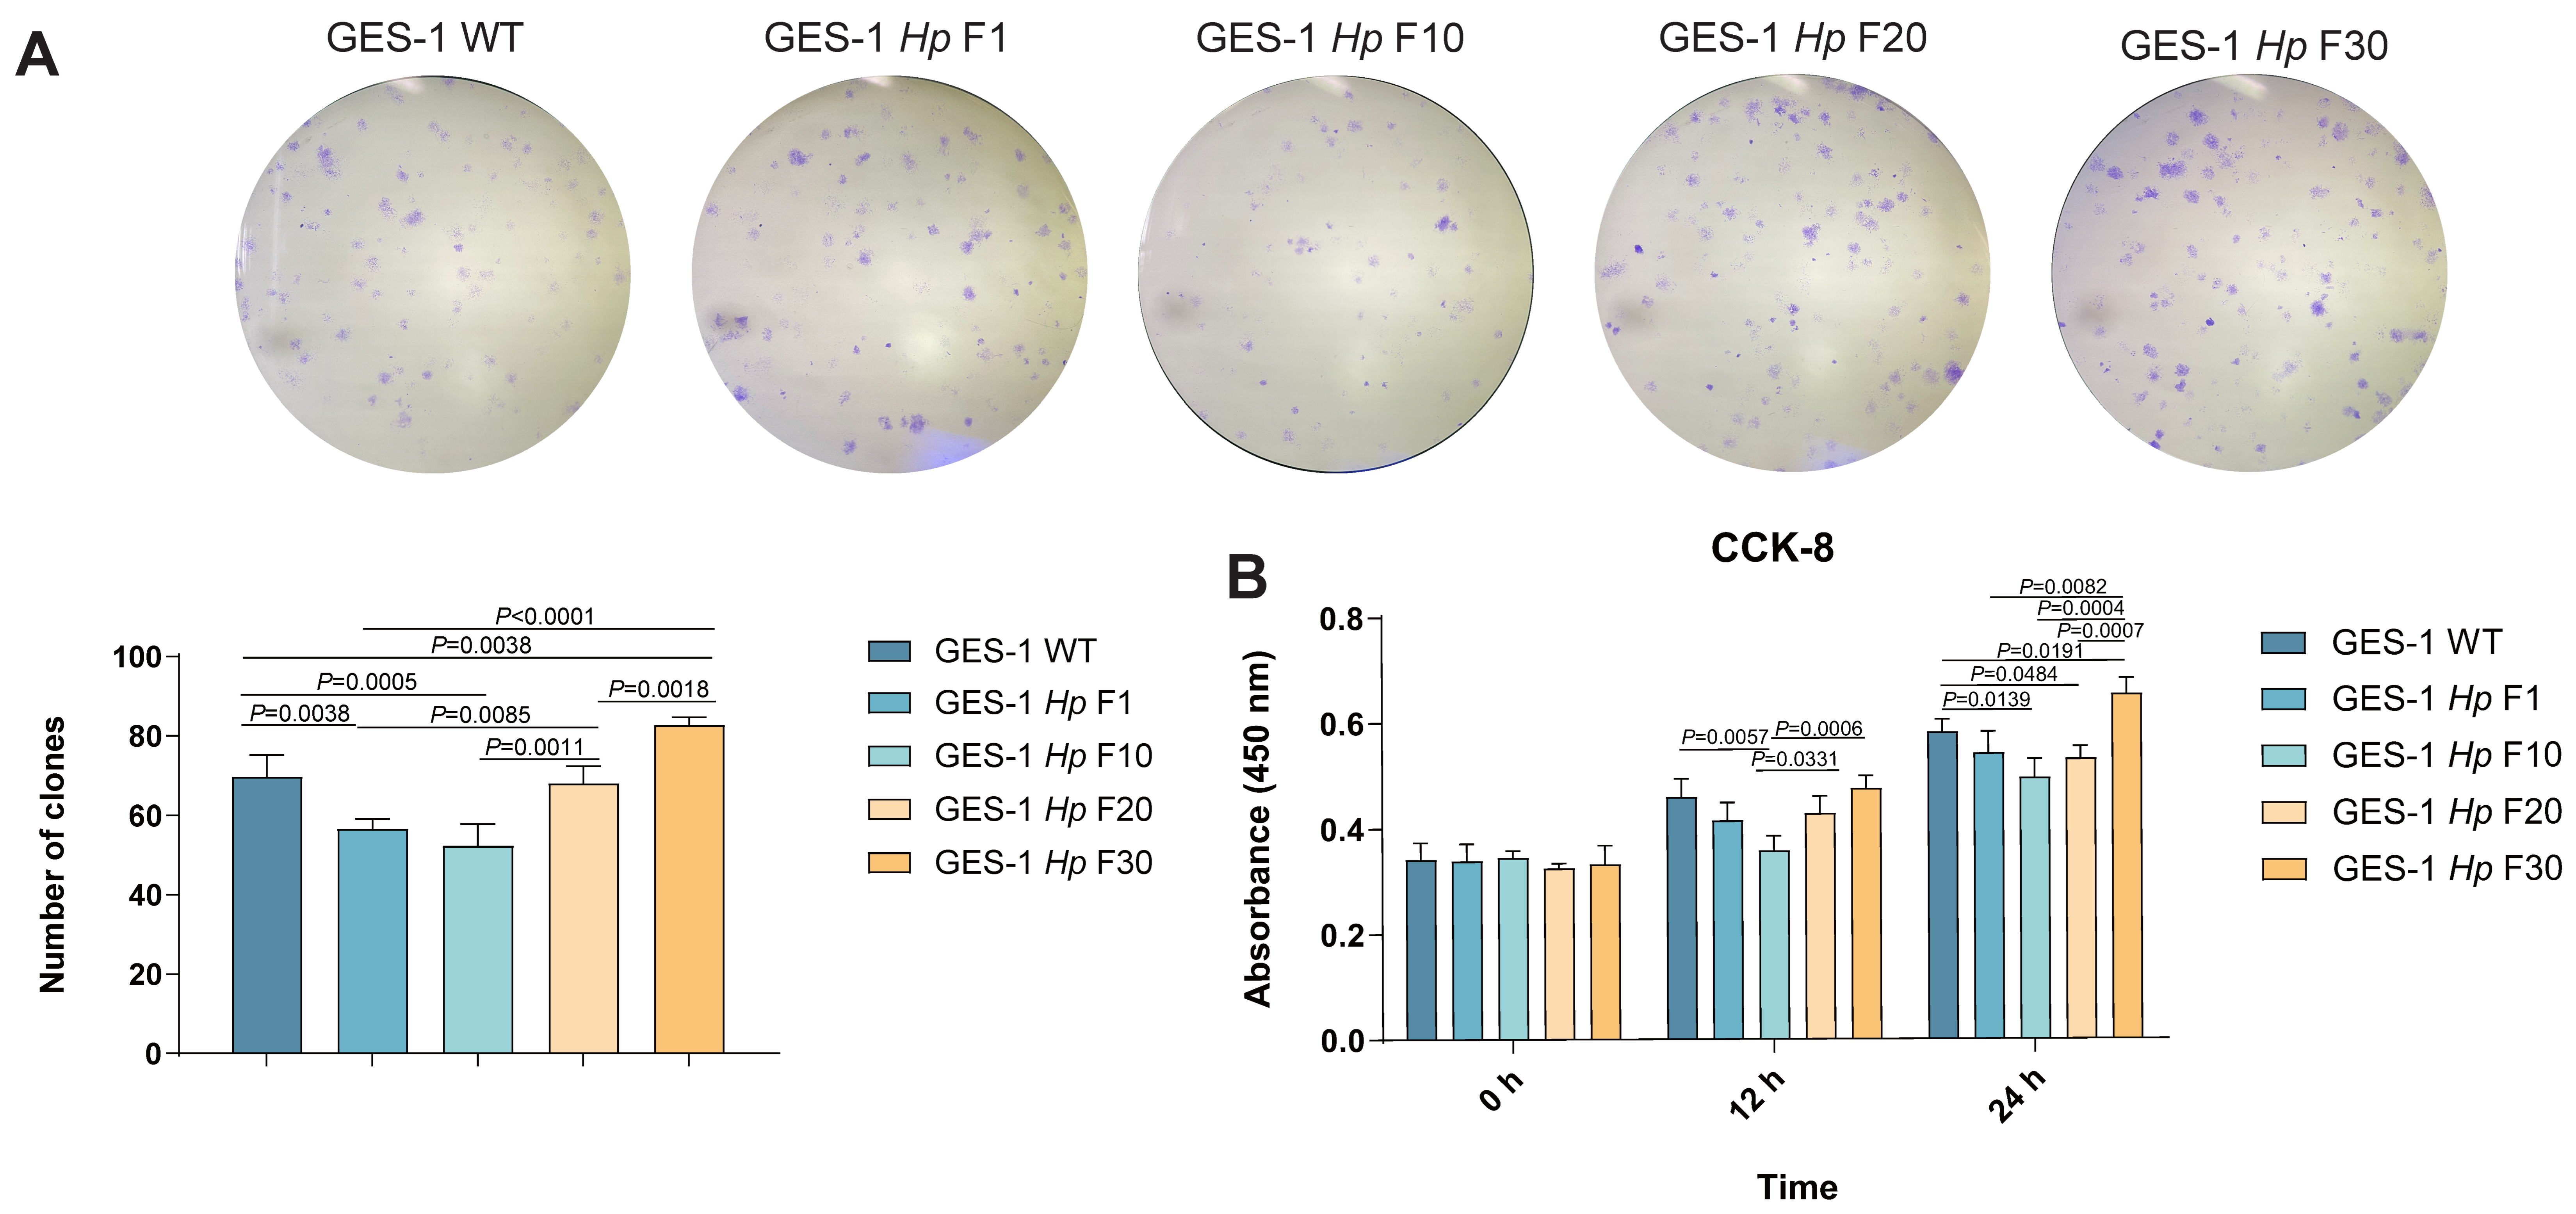
To evaluate the impact of H. pylori infection on gastric epithelial cell proliferation, we analyzed the proliferation capacity of GES-1 WT, GES-1 Hp F1, GES-1 Hp F10, GES-1 Hp F20, and GES-1 Hp F30 cells with colony formation and CCK-8 assays. In the early phase of infection (GES-1 Hp F1 and F10), GES-1 cells displayed a marked decrease in proliferation capacity compared with the untreated control group. Colony numbers were significantly reduced, and the CCK-8 assay also indicated suppressed cell viability, suggesting an acute stress response to initial bacterial exposure. However, as co-culture with H. pylori was extended over multiple passages, a gradual recovery in proliferation capacity was observed in GES-1 Hp F20 and GES-1 Hp F30 cells (Figure 2A,B).
These findings indicate that acute H. pylori exposure severely impairs GES-1 proliferation, whereas long-term infection drives gradual adaptive responses that mitigate this impairment.

2.3. Migration and Invasion Capacity of GES-1 Decreased in Acute H. pylori Infection, with Gradual Adaptation Under Sustained Exposure

To clarify H. pylori’s effect on gastric epithelial motility, we assessed migration and invasion across infection stages via wound-healing and transwell assays.
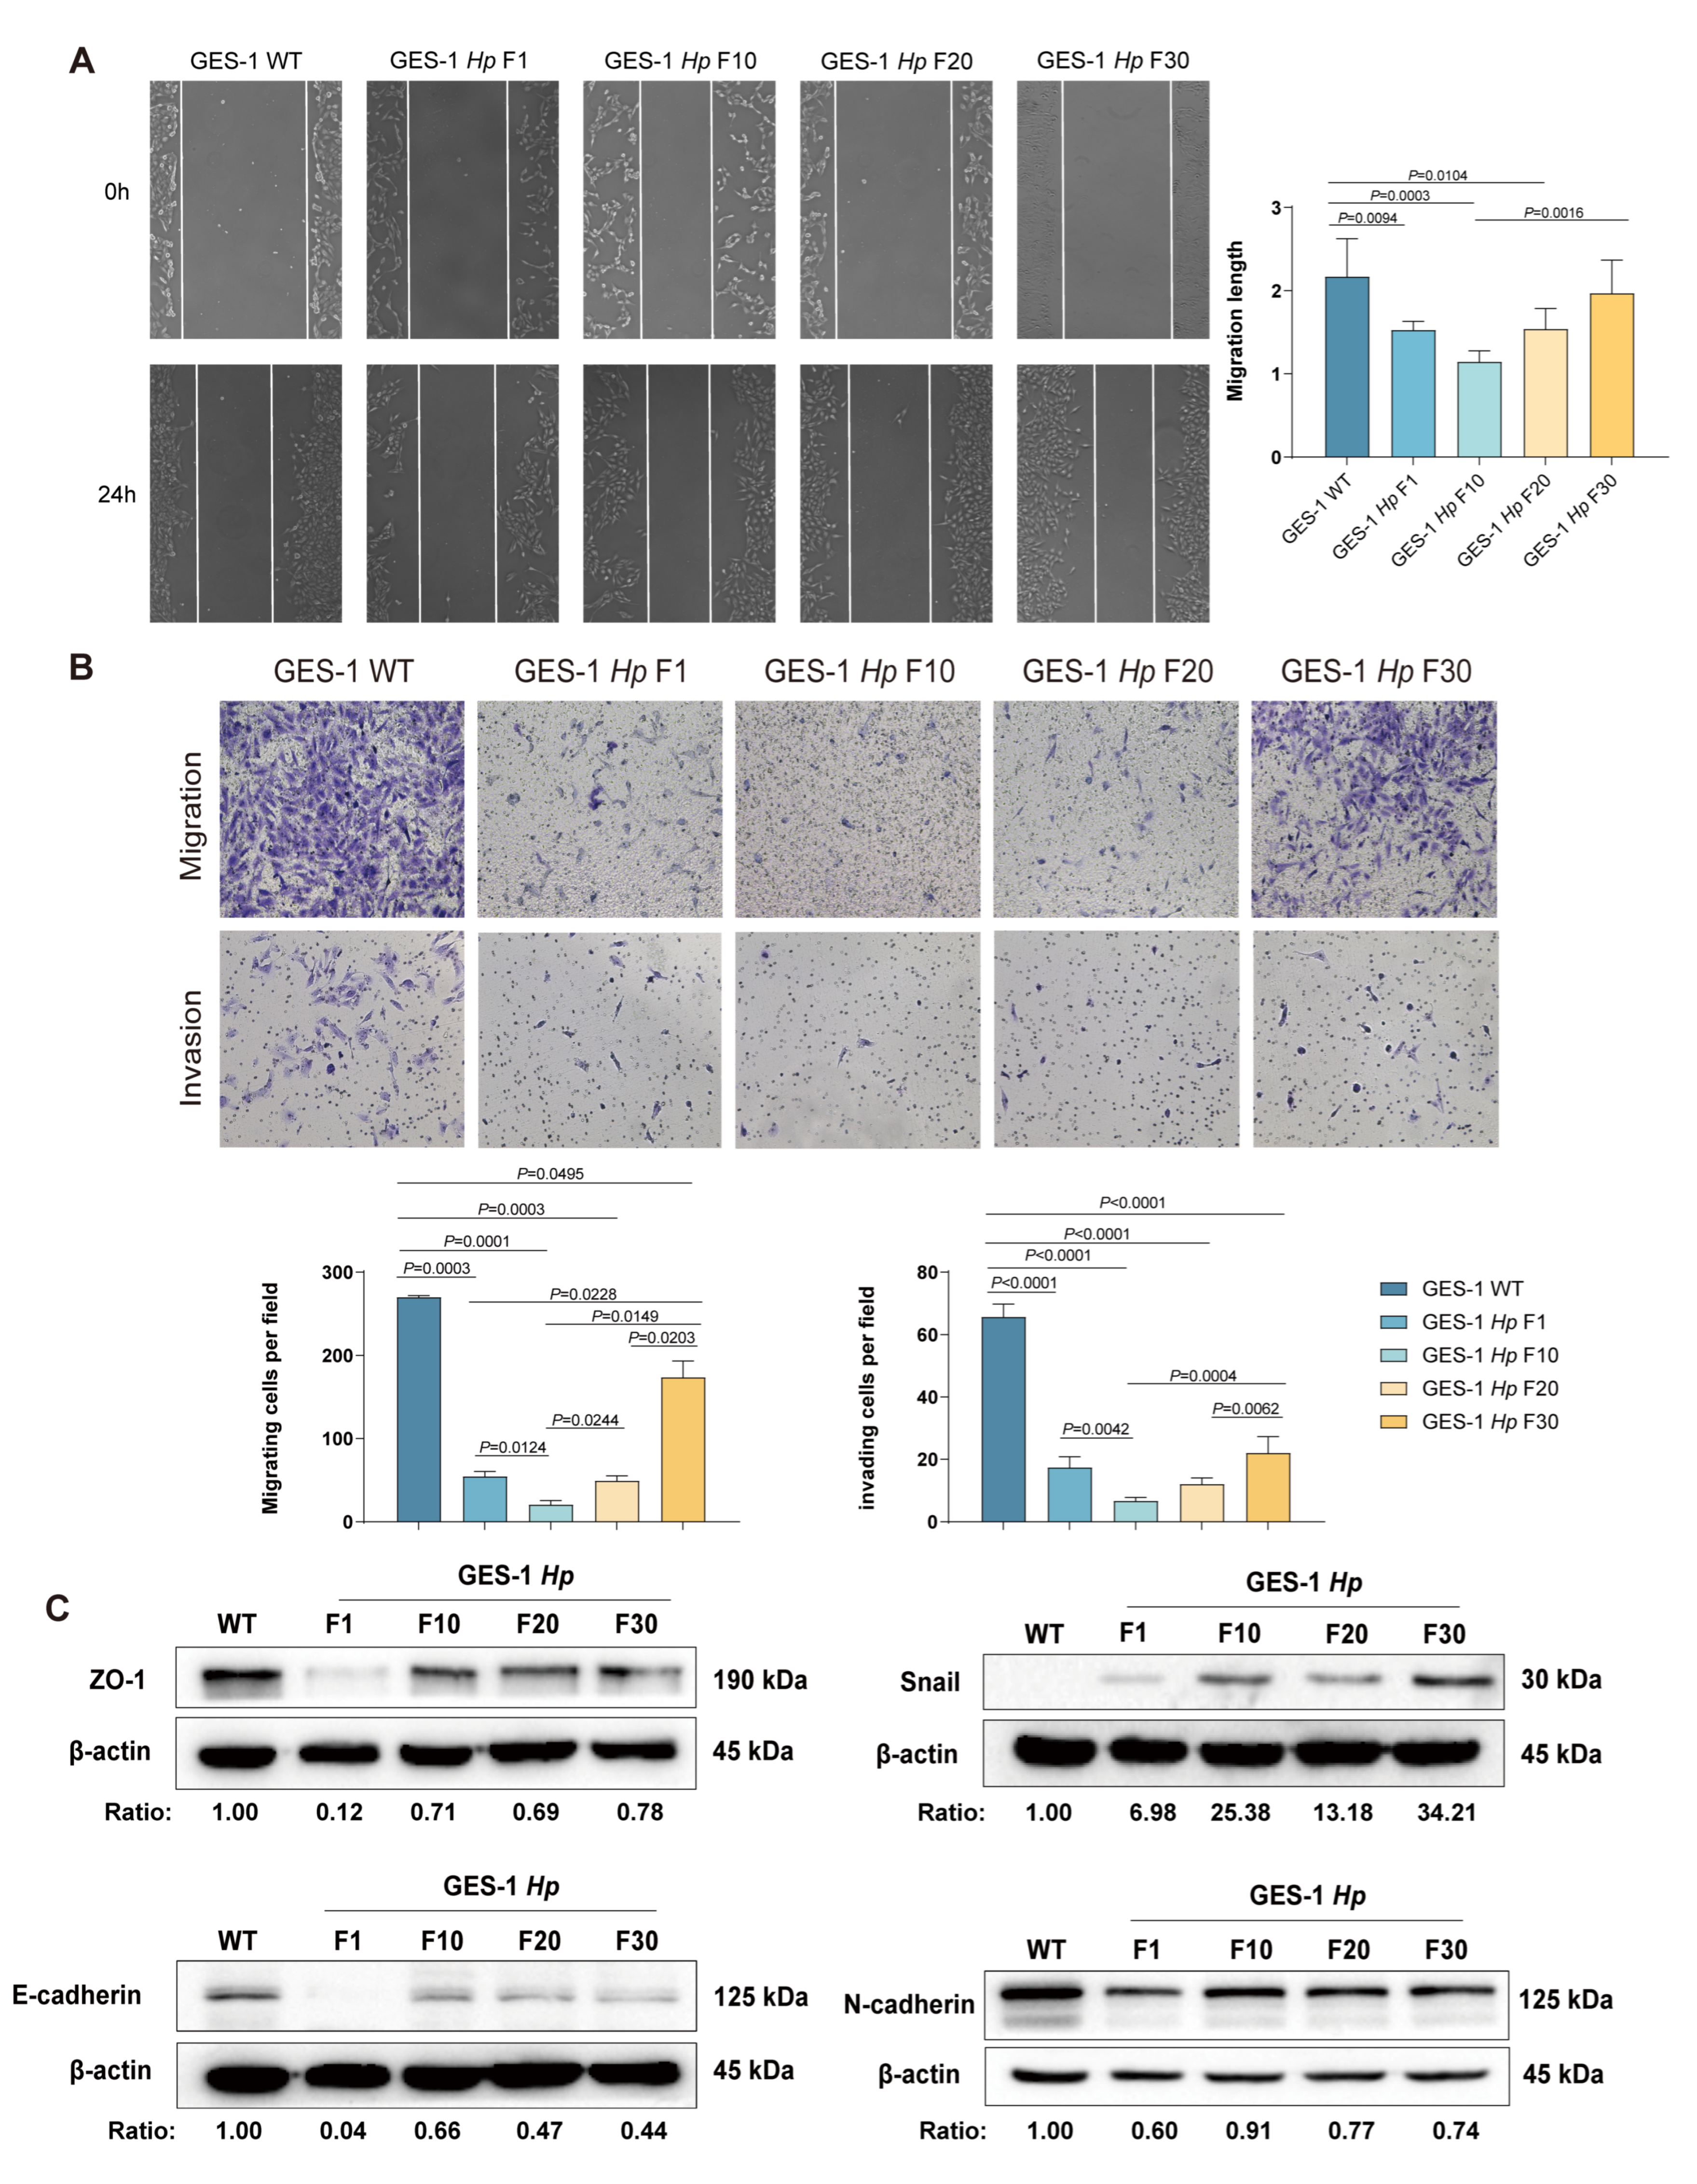
Following acute H. pylori exposure (GES-1 Hp F1), GES-1 cells exhibited a significant reduction in migration distance and transwell migration rate compared to uninfected controls (GES-1 WT), with invasion ability also significantly suppressed (Figure 3A,B), indicating early infection compromises cytoskeletal remodeling and cell viability. Interestingly, as infection was prolonged over several generations, GES-1 Hp F30 cells showed recovered wound closure and increased transwell movement compared with GES-1 Hp F1, F10, and F20 (Figure 3A,B).
We further evaluated EMT features in infected GES-1 cells for mechanisms. As shown in Figure 3C, epithelial markers E-cadherin and ZO-1 were downregulated, while the mesenchymal marker Snail was upregulated in GES-1 Hp F30 compared to GES-1 WT cells.
Decreased expression of E-cadherin with increased Snail in GES-1 Hp F30 cells also demonstrated a trend of malignant transformation and cancer initiation after long-term infection [24,25]. These results reveal a biphasic response in which initial bacterial stress dampens cell motility, while chronic infection reprograms the cellular phenotype to a more motile and invasive state, a transformation that has the potential to facilitate malignant progression.

2.4. Acute H. pylori Infection Disrupts Autophagy and Apoptosis in GES-1 Cells, with Adaptation Restoring Homeostasis in Chronic Stages

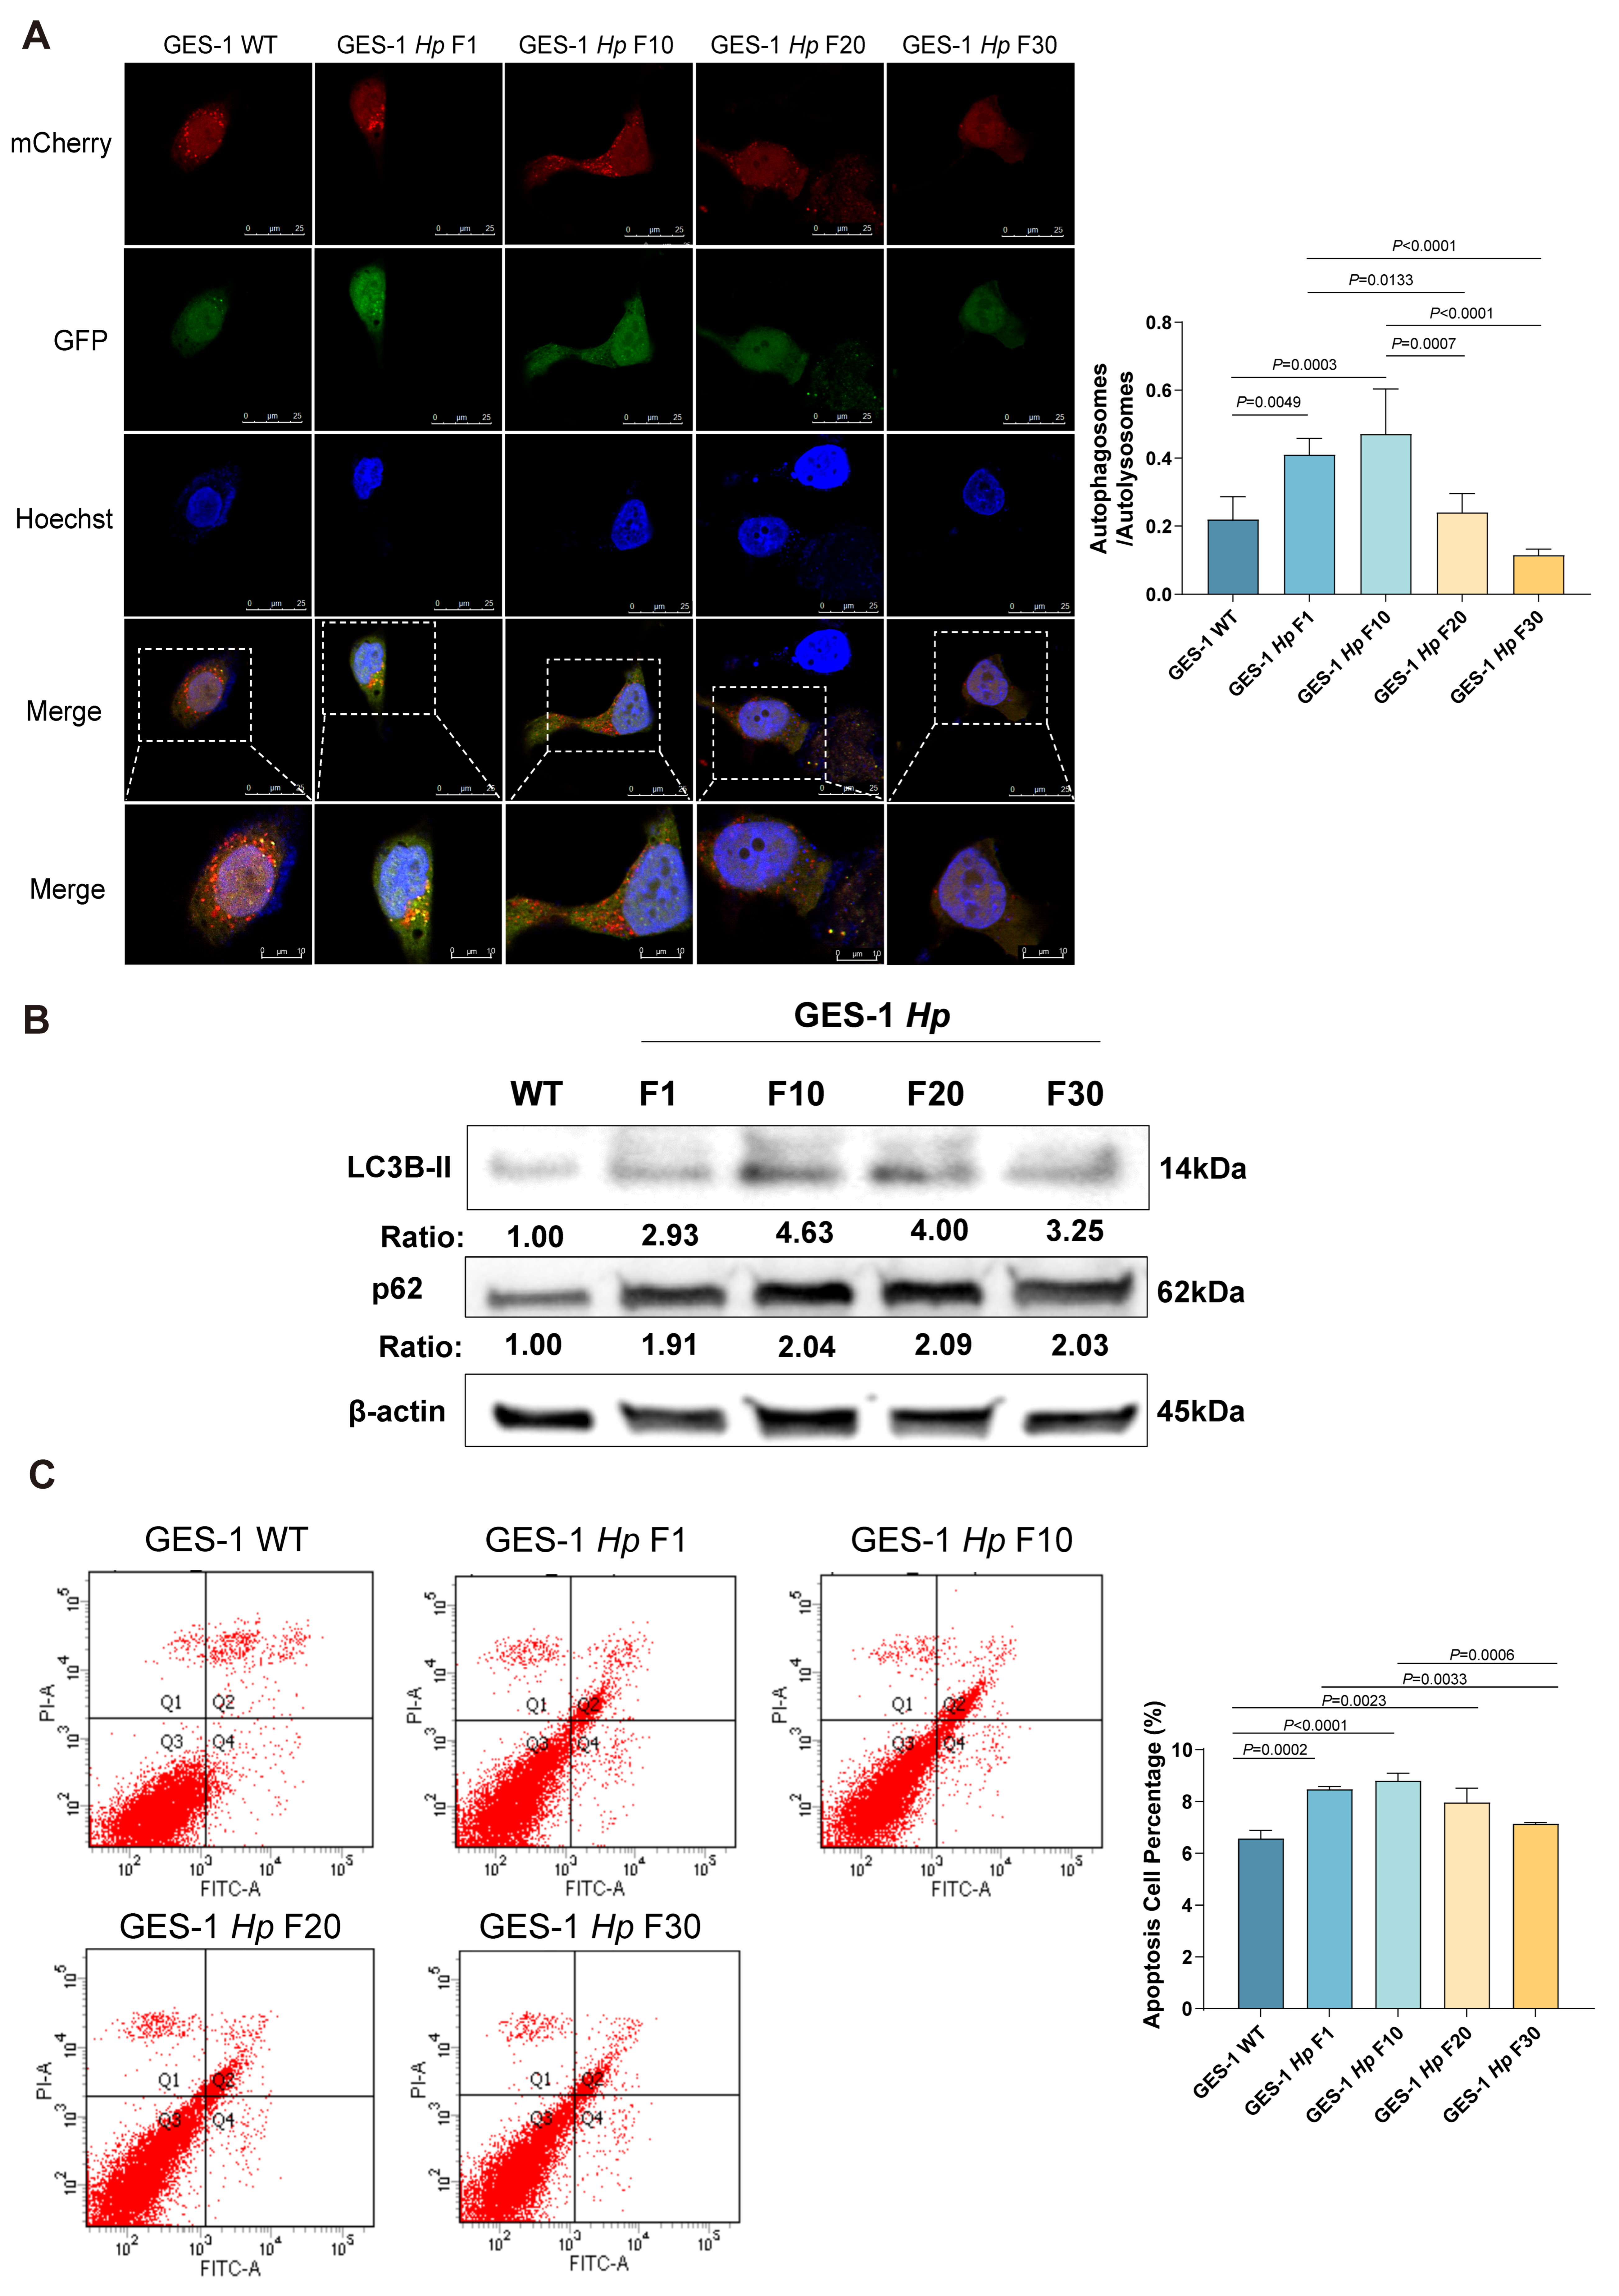
To investigate the dynamic regulation of autophagy in gastric epithelial cells during different stages of H. pylori infection, GES-1 cells were transfected with an EGFP-mCherry-LC3 lentivirus and monitored across multiple infection generations, with the number of yellow (representing autophagosomes) and red puncta (representing autolysosomes) indicated by LC3. In early-stage infection (GES-1 Hp F1), confocal imaging revealed both a quantitative and proportional increase in autophagosomes, as the ratio of autophagosome/autolysosome counts has elevated (0.41 ± 0.05) when compared with the uninfected cells (0.22 ± 0.07), indicating a blockage in autophagic flux. This inhibition was further aggravated in GES-1 Hp F10 cells, where the ratio of autophagosomes to autolysosomes significantly increased (0.47 ± 0.13), suggesting impaired fusion of autophagosome to lysosome. By the 20th and 30th generations of GES-1 cells post-infection (GES-1 Hp F20 and GES-1 Hp F30), the autophagic flux had largely recovered, with the distribution and quantity of puncta comparable to those of uninfected control cells (0.24 ± 0.06 for GES-1 Hp F20, 0.11 ± 0.02 for GES-1 Hp F30) (Figure 4A). Western blot analysis of LC3-II and p62 confirmed that, compared to controls, GES-1 Hp F1 cells showed increased LC3-II and p62 expression, with further elevation in GES-1 Hp F10. Conversely, GES-1 Hp F20 and F30 cells exhibited reduced LC3-II and p62 levels, confirming the restoration of autophagic flux in the late stage of infection (Figure 4B).
Apoptotic analysis by flow cytometry showed a transient elevation in apoptosis rates in GES-1 Hp F1 (8.47% ± 0.12%) and GES-1 Hp F10 cells (8.80% ± 0.30%). However, apoptosis levels significantly declined in GES-1 Hp F30 cells (7.13% ± 0.06%), returning to levels that were almost the same as those in untreated control cells (GES-1 WT) (6.57% ± 0.32%) (Figure 4C).
Taken together, these findings indicate that, while acute H. pylori infection disrupts both autophagy and apoptosis in GES-1 cells, long-term bacterial stimulation leads to cellular adaptation and tolerance against the infection. The restoration of autophagic flux and suppression of apoptosis at later stages may contribute to enhanced survival of gastric epithelial cells under chronic H. pylori colonization.
For the functional features of H. pylori-infected gastric epithelial cells, our study revealed how chronic infection reshapes cell fate. Autophagy blockage and increased apoptosis during the acute infection represent host defense mechanisms against stress, and this might be attributed to CagA-mediated signaling according to previous studies [26,27]. However, these processes are reversed under long-term infection, as restored autophagic flux provides a survival advantage, while inhibited apoptosis reduces cell death [28,29].

2.5. Bulk RNA-Seq Reveals Inflammation Reprogramming in GES-1 Cells During Sustained H. pylori Lysate Stimulation

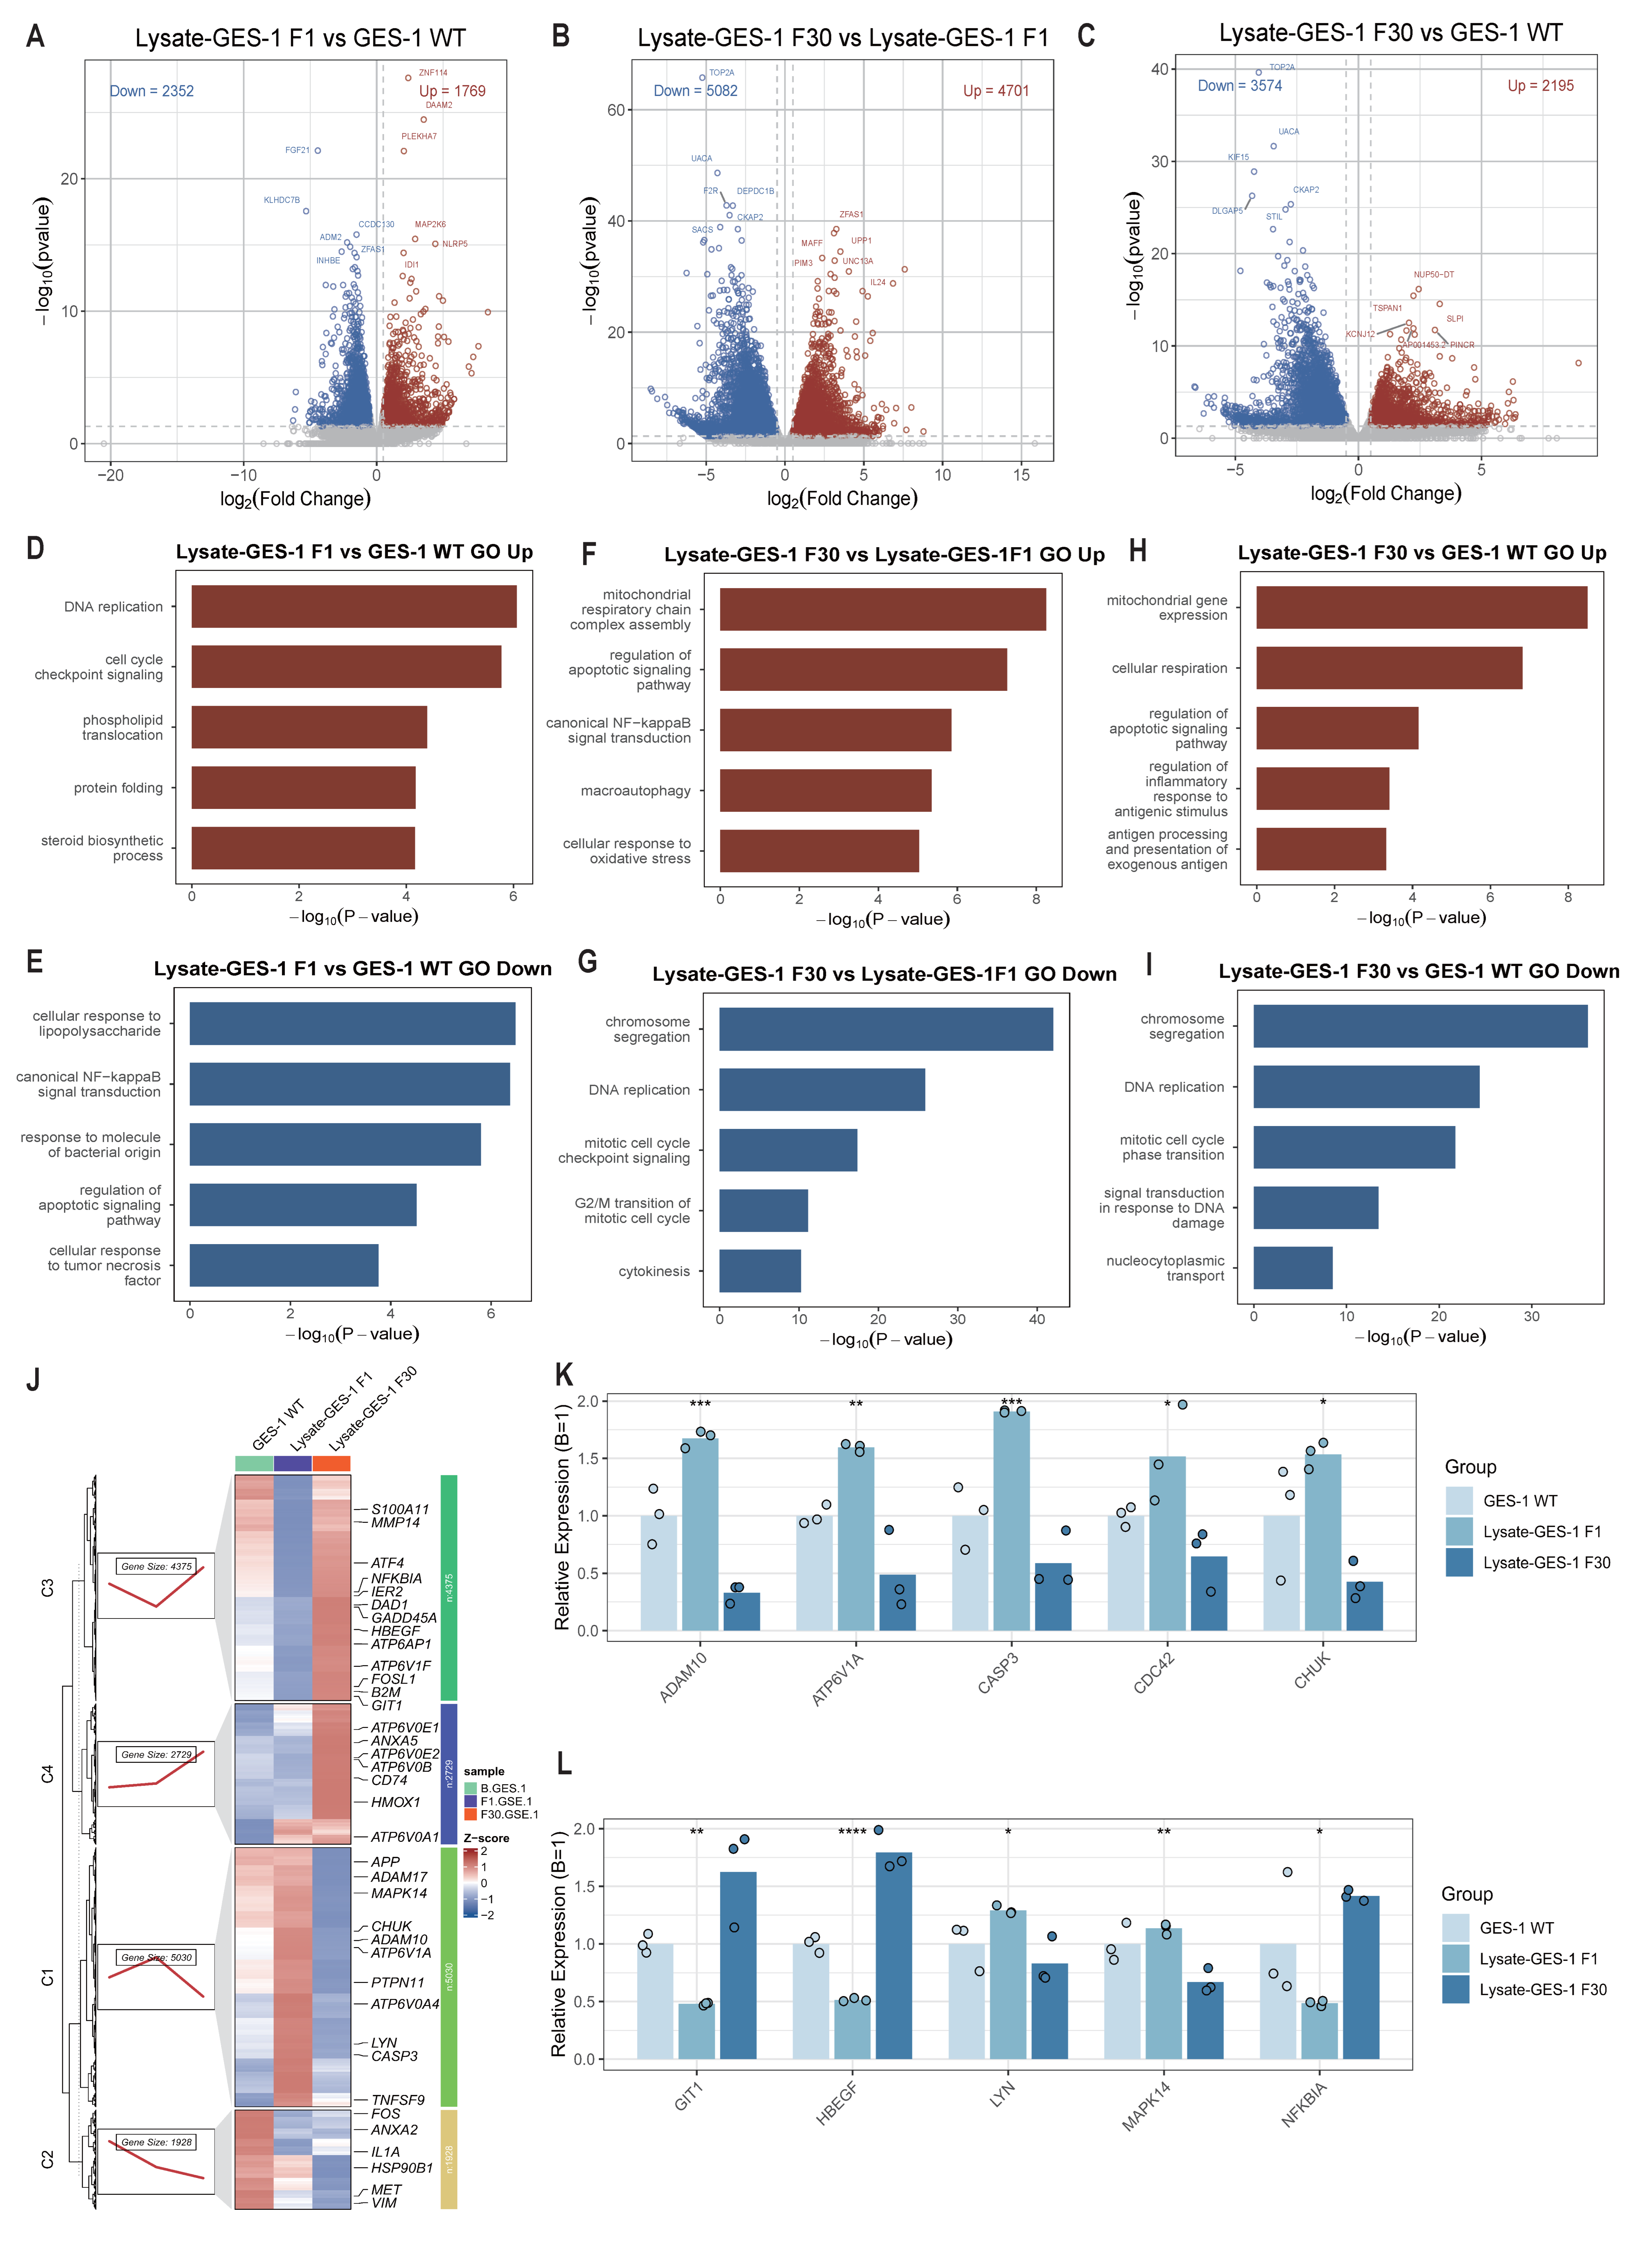
Bulk RNA sequencing was performed on gastric epithelial cells from untreated controls (GES-1 WT) and groups stimulated with H. pylori lysate for 1 (Lysate-GES-1 F1) or 30 generations (Lysate-GES-1 F30). The RNA-seq data have been uploaded to the NCBI database (GSE149092). Compared to untreated cells, Lysate-GES-1 F1 showed 4121 differentially expressed genes, while 9783 DEGs were identified in Lysate-GES-1 F30 versus Lysate-GES-1 F1, reflecting intensified transcriptional responses with prolonged lysate exposure (Figure 5A–C, Supplementary File S1).
Gene Ontology (GO) enrichment analysis revealed upregulated “DNA replication” and “cell-cycle checkpoint” pathways in Lysate-GES-1 F1, indicating activated self-repair mechanisms following acute stimulation by H. pylori components. In contrast, chronic stimulation (Lysate-GES-1 F30) activated pathways including “mitochondrial gene expression” and “canonical NF-κB signal transduction”, reflecting enhanced cellular metabolism and potential carcinogenic activation (Figure 5D–I, Supplementary File S2). Sustained H. pylori lysate stimulation induced significant transcriptional reprogramming in GES-1 cells. Acute exposure (F1) triggered DNA repair and cell-cycle checkpoint pathways, reflecting an immediate compensatory response. In contrast, chronic stimulation (F30) provoked more profound transcriptomic alterations, prominently activating mitochondrial gene expression and NF-κB signaling. These changes suggest a metabolic reorganization and sustained inflammatory activation, consistent with features of premalignant transformation driven by chronic inflammation. Our findings imply that long-term H. pylori infection may facilitate gastric carcinogenesis through NF-κB-mediated inflammatory microenvironment.
Unsupervised clustering further showed that genes in the inflammation-apoptosis C1 module were upregulated in Lysate-GES-1 F1 but downregulated in Lysate-GES-1 F30, while stress-protective C3 module genes were markedly downregulated in Lysate-GES-1 F1 and recovered after 30 generations of stimulation (Figure 5J). Notably, MMP14, IER2, HBEGF, and GIT1 were highly expressed in Lysate-GES-1 F30, indicating enhanced epithelial motility. Bar plots confirmed that sustained stimulation significantly repressed apoptosis-stress-related genes while activating those involved in migration and proliferation (Figure 5K,L).
Collectively, sustained H. pylori lysate exposure first triggers energetic compensation, followed by coordinated inflammation-cell cycle reprogramming, offering a metabolic–immunologic framework for understanding chronic gastric mucosal injury and pre-neoplastic progression.
Results from bulk RNA-seq analyses are also consistent with the dynamic phenotypes of autophagy and apoptosis, in which genes of inflammation and apoptosis were activated under acute stimulation of H. pylori lysate stimulation, with enhanced stress-protective capacity after chronic treatment.

2.6. Chronic H. pylori Infection Induces Progressive Gastric Pathology and Immune Tolerance in Mongolian gerbils

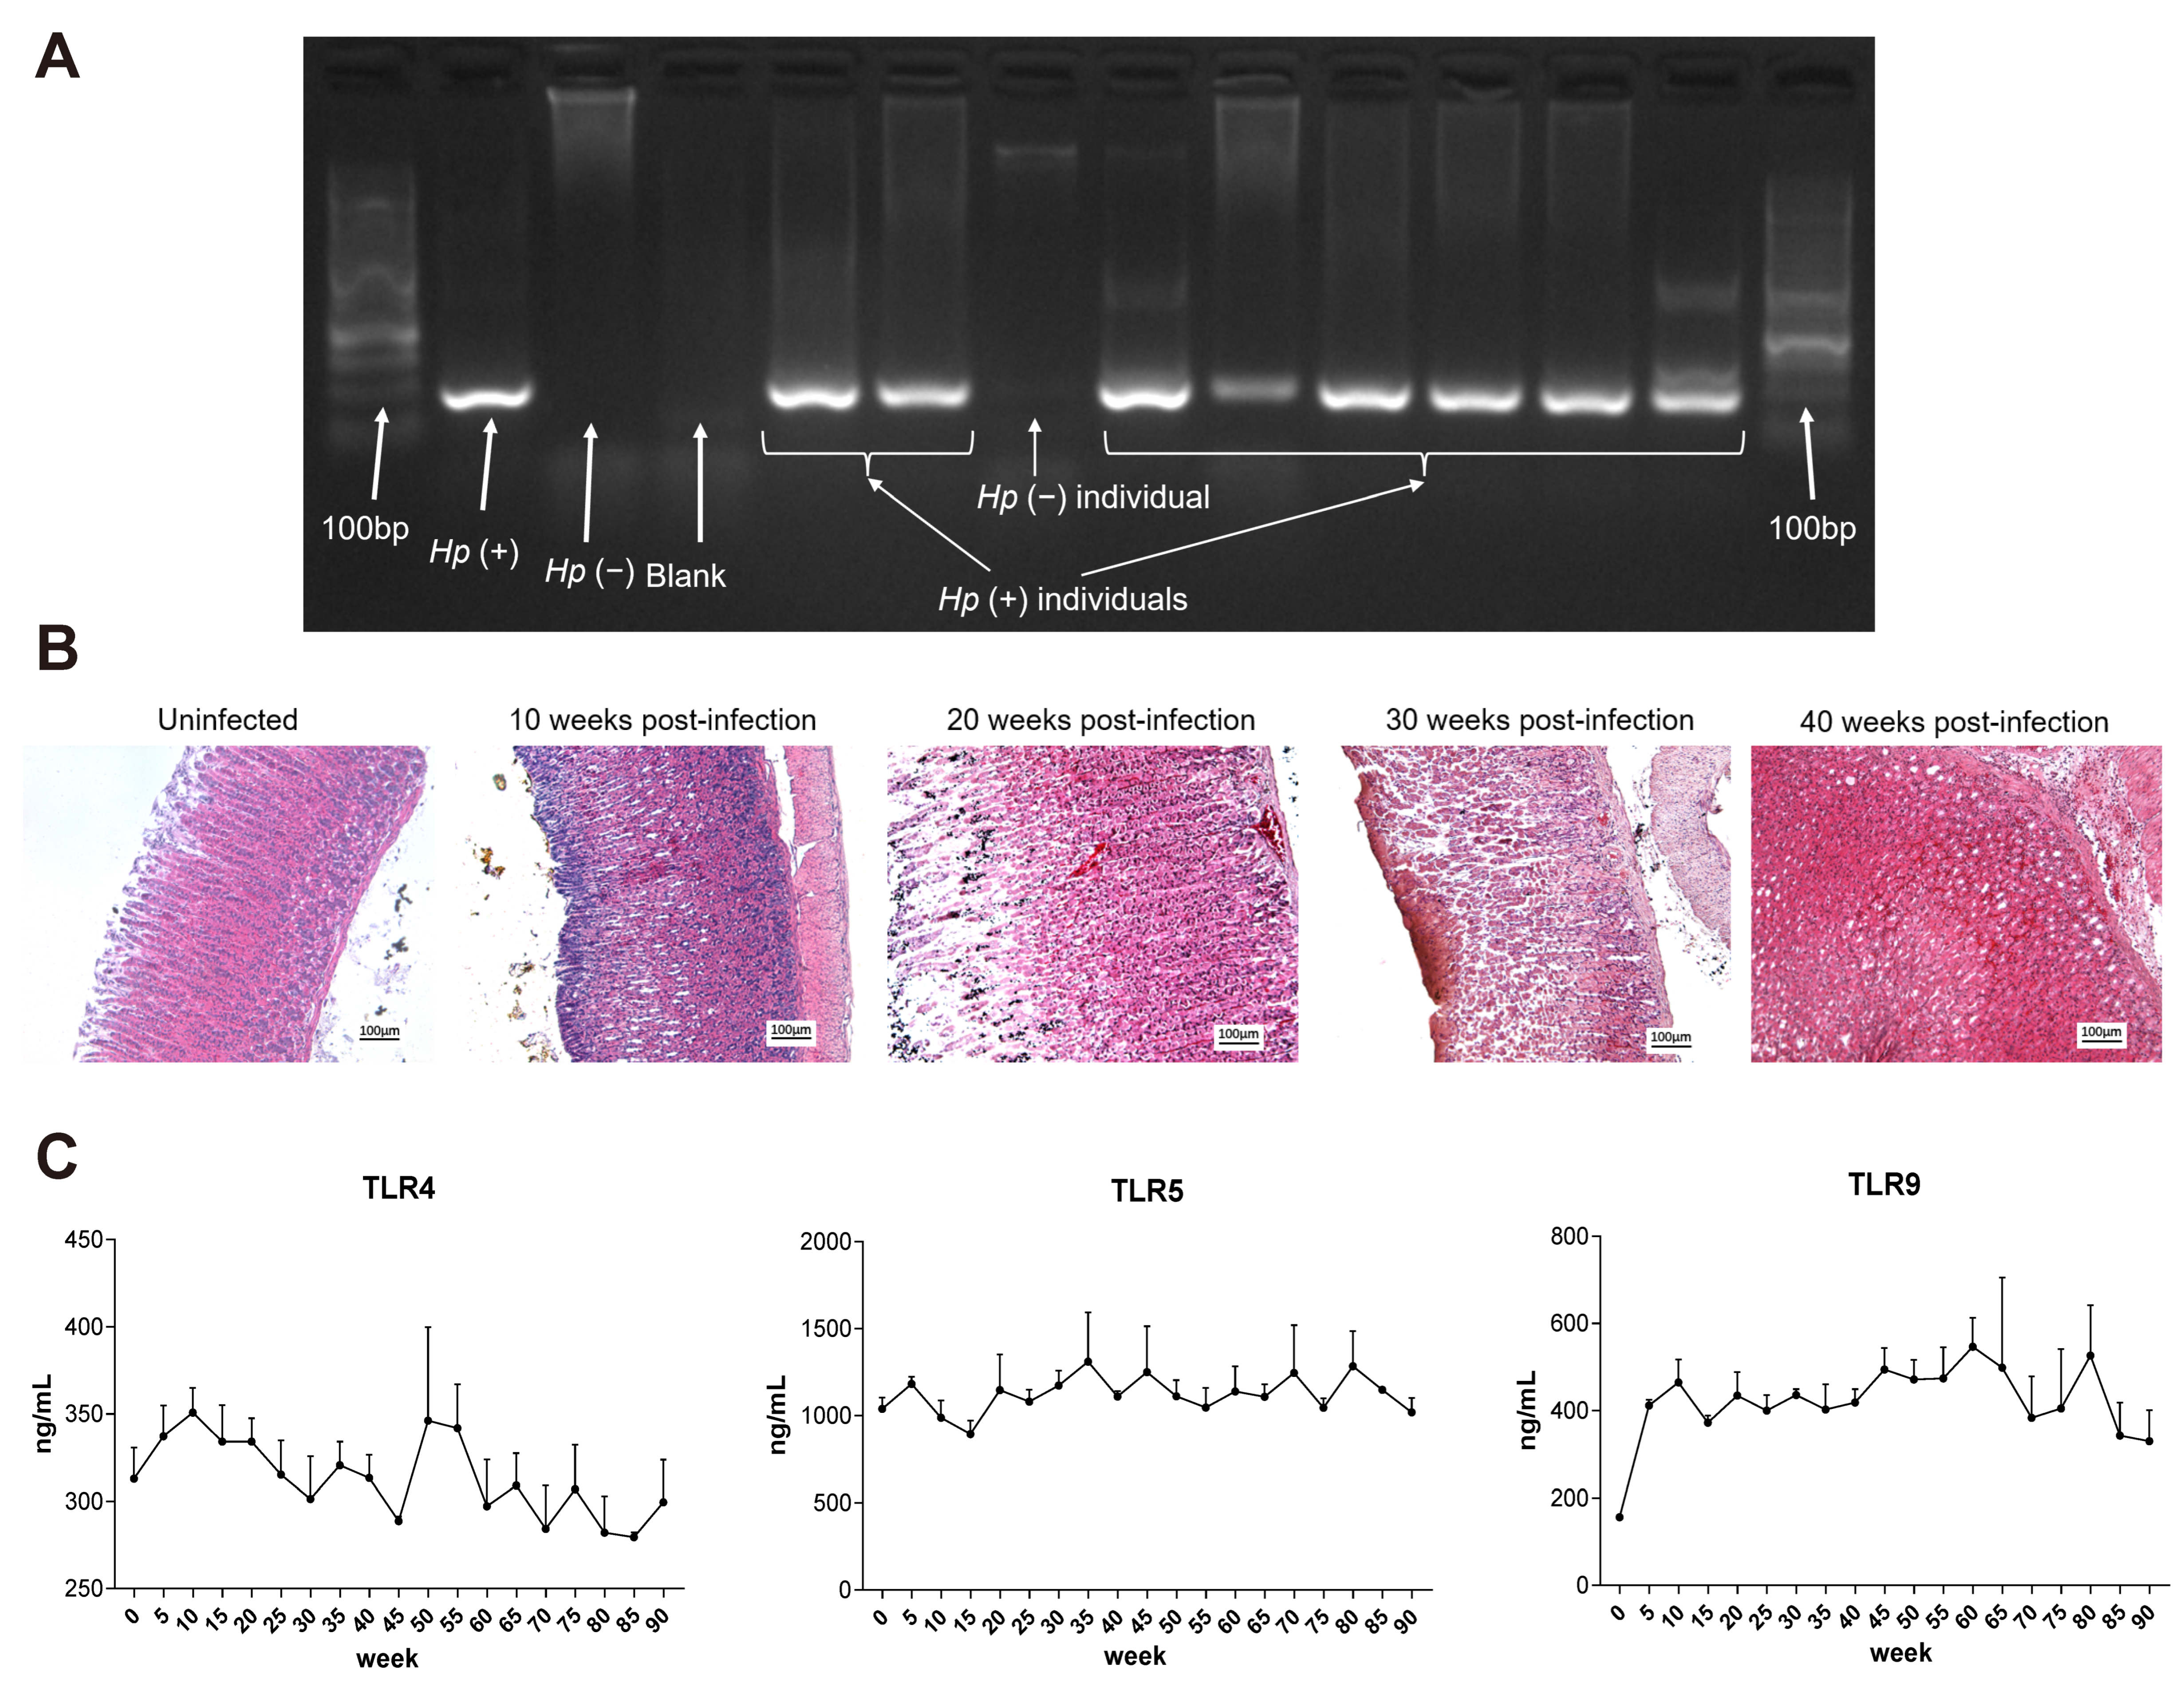
To investigate the long-term in vivo effects of H. pylori infection on gastric tissue, we established a chronic infection model in Mongolian gerbils using H. pylori strain 7.13, a gerbil-adapted strain known to induce gastric carcinogenesis in this species. After 10 weeks of infection, gastric juice was collected and subjected to nested PCR to confirm successful bacterial colonization (Figure 6A), with only H. pylori-positive animals included in subsequent analyses.
Histopathological assessment revealed progressive structural alterations in the gastric mucosa of gerbils infected with H. pylori strain 7.13 as the infection persisted. While no pathological changes were observed at 10 weeks post-infection, various lesions emerged with prolonged infection: glandular atrophy was detected in H. pylori-colonized gerbils at 20 and 30 weeks post-infection, and dysplasia appeared in the gastric tissue by 40 weeks post-infection (Figure 6B). These pathological changes closely mimic the cascade of gastric carcinogenesis observed in human H. pylori-related disease.
To further evaluate host immune responses during prolonged infection, we quantified serum expression levels of Toll-like receptors (TLR4, TLR5, and TLR9) in Mongolian gerbils infected with H. pylori strain ATCC 43504 for 90 weeks. Notably, both TLR4 and TLR9 levels increased during early infection stages but declined in later phases of the extended infection model (Figure 6C), indicating initial activation of the innate immune response followed by immunologic adaptation or tolerance as the infection became chronic.
These findings align with our previous observations that long-term H. pylori infection induces host immune desensitization, which facilitates bacterial persistence and contributes to pathological progression.
The in vivo experiments with H. pylori strain 7.13 exhibited a process of H. pylori-induced gastric pathogenesis that followed Correa’s cascade: normal (10 weeks post-infection), atrophic gastritis (20 to 30 weeks post-infection), dysplasia (40 weeks post-infection). This result demonstrated a time-dependent pathological progression that further validated our cellular-level findings and provided significant insights into the clinical identification of high-risk patients and optimal intervention timing.

3. Material and Methods

3.1. Bacteria Strain and Bacteria Culture

H. pylori strain ATCC 43504 (CagA+, VacA+) was provided by the National Institutes for Food and Drug Control, Beijing, China. H. pylori strain 7.13 (CagA+, VacA+) was kindly provided by Dr. Nonghua Lv from the Department of Gastroenterology, First Affiliated Hospital of Nanchang University, Nanchang, China. Bacteria were cultured on Karmali agar plates (OXOID, Waltham, MA, USA, CM0935) supplemented with 5% sterile and defibrinated sheep blood (MRC, Cambridge, UK, CCS30037.01) at 37 °C under the condition of 5% O2, 10% CO2, and 85% N2.

3.2. Cell Lines and Cell Treatment

Human gastric epithelial cell line GES-1 was purchased from Ningbo Mingzhoubio Biotechnology Co., Ltd. (Ningbo, China) Cells were cultured in DMEM (VISTECH, Hartford, CT, USA, VM-1101BM) supplemented with 10% fetal bovine serum (FBS) (VISTECH, SE100-011) and 1% penicillin/streptomycin antibiotics solution (KeyGen BioTECH, Nanjing, China, KGY0023).
GES-1 cells for H. pylori infection were cultured in antibiotic-free medium with H. pylori strain ATCC 43504 (CagA+, VacA+) at a multiplicity of infection (MOI) of 1000:1 at 37 °C under 5% CO2 condition for 24 h, then washed 5 times with phosphate-buffered saline (PBS) (ROBY, Beijing, China, RBR105S-500) to remove H. pylori, and cultured in bacteria-free medium at 37 °C under 5% CO2 for another 24 h as one generation (GES-1 Hp F1). Cells co-cultured with H. pylori for 10, 20, and 30 consecutive generations were marked as GES-1 Hp F10, GES-1 Hp F20, and GES-1 Hp F30, respectively. GES-1 cells without H. pylori infection were regarded as the negative control and marked as GES-1 WT.
The H. pylori strain ATCC 43504 suspension was placed on ice and sonicated at 100 W power for 30 s, repeated 10 times with 20-s intervals between each sonication cycle. The resulting suspension was centrifuged at 12,000× g for 10 min, and the supernatant was collected. Protein concentration was determined using a BCA protein quantitation kit (Thermo, Waltham, MA, USA), after which the supernatant was diluted with PBS to a final concentration of 200 μg/mL to prepare the H. pylori lysate.
GES-1 cells for H. pylori lysate treatment were cultured in medium containing lysate generated from H. pylori strain ATCC 43504 (CagA+, VacA+) at a final concentration of 2 μg/mL at 37 °C under 5% CO2 condition for 24 h, then washed once with PBS to remove the medium with H. pylori lysate, and cultured in normal medium for another 24 h as one generation (Lysate-GES-1 F1). Cells co-cultured with H. pylori lysate for 30 consecutive generations were marked as Lysate-GES-1 F30.

3.3. Animal Infection

All Mongolian gerbils used for H. pylori infection were 6–8 weeks old, with a body weight of 50–60 g. Gerbils without H. pylori infection served as the uninfected control group. For the 40-week infection experiment using H. pylori strain 7.13, gerbils were infected for 10–40 weeks and analyzed at consecutive time points (0, 10, 20, 30, and 40 weeks post-infection). In the 90-week infection experiment with H. pylori strain ATCC 43504 (CagA+, VacA+), gerbils were infected for 5–90 weeks and analyzed at consecutive time points (every 5 weeks from 0 to 90 weeks post-infection). The animal study was reviewed and approved by the Animal Experiments and Experimental Animal Welfare Committee of CMU (protocol: AEEI-2015-179; 20 September 2018). All procedures were conducted in accordance with the institutional Guidelines for the Care and Use of Laboratory Animals.

3.4. Immunofluorescence

Cells and stomach tissue sections were incubated overnight at 4 °C with mouse anti-CagA antibody (Santa Cruz, Dallas, TX, USA, sc-28368, 1:200 dilution for immunofluorescence (IF)), followed by incubation with Alexa Fluor® 555-conjugated goat anti-mouse IgG (HUABIO, Hangzhou, China, HA1117, 1:200 dilution). The cell nuclei were counterstained with Hoechst33342 (Solarbio, Beijing, China, C0021, 10 μg/mL).

3.5. CCK-8 Cell Proliferation Assay

The cell proliferation capacity was analyzed using Cell Counting Kit-8 (CCK-8) solution (Vazyme, Nanjing, China, A311-01). GES-1 WT, GES-1 Hp F10, GES-1 Hp F20, and GES-1 Hp F30 cells were counted and seeded into a 96-well plate at a density of 3 × 10³ cells/well. At 0 h, 12 h, and 24 h time points post-cell attachment, 10% CCK-8 solution was added to each well, and cells were incubated at 37 °C under 5% CO2 condition for another 2 h. The absorbance was read by a microplate reader at 450 nm (Bio Tek, Santa Clara, CA, USA, Elx800).

3.6. Wound-Healing Assay

Cells were seeded into 6-well plates and cultured in medium supplemented with 10% FBS until reaching approximately 90% confluence. A sterile pipette tip was used to create a linear wound across the monolayer. Detached and floating cells were removed by washing once with PBS. Then, cells were incubated in FBS-free medium (2 mL per well) for 24 h. The wound closure was monitored and imaged at designated time points, and the gap distances were measured to evaluate cell migration capacity.

3.7. Colony Formation Assay

Cells were seeded into 6-well plates at a concentration of 500 cell/well and cultured in DMEM supplemented with 10% FBS at 37 °C under 5% CO2 condition for 14 days. Then, cells were fixed with 4% polyformaldehyde and stained with 0.1% crystal violet (Aladdin, Shanghai, China, C110703). Visible colonies were counted with ImageJ 1.53 software. The assays were performed in triplicate.

3.8. Transwell Migration and Invasion Assay

Cells were seeded into the upper chamber of a Transwell cell culture insert at a density of 3 × 10⁴ cells for both migration and invasion assays in 200 μL of FBS-free medium. The lower chamber was filled with 500 μL of medium containing 10% FBS. After 24 h of incubation, non-migrated or non-invaded cells in the upper chamber were carefully removed using a cotton swab. Cells that had migrated or invaded to the lower side of the membrane were fixed with 4% paraformaldehyde and stained with 0.1% crystal violet (Aladdin, Shanghai, China, C110703). The stained cells were visualized and counted under a microscope. The assays were performed in triplicate.

3.9. mCherry-EGFP-LC3 Lentivirus Transfection

GES-1 WT, GES-1 Hp F10, GES-1 Hp F20, and GES-1 Hp F30 cells were seeded into 6-well plates with a density of 2.5 × 10⁴ cells/mL. After cell attachment, the old medium was discarded, and the cells were washed with PBS. Transfection was conducted for 48 h with medium containing a 50 mL titer of 108 TU/mL mCherry-EGFP-LC3 lentivirus (Hanbio Biotechnology Co., Ltd., Shanghai, China) and 8 mg/mL Polybrene. The fluorescence expression of cells was observed to check the efficiency of transfection. When the ratio of fluorescent cells reached approximately 80%, the cells were used for the following experiments.

3.10. Apoptosis Assay

The apoptosis level of GES-1 WT, GES-1 Hp F1, GES-1 Hp F10, GES-1 Hp F20, and GES-1 Hp F30 cells were analyzed by flow cytometry with an LSR Fortessa Flow Cytometer (BD, San Jose, CA, USA) at 488 nm. Cells were stained using an Annexin V-PE/7-AAD Apoptosis Detection Kit (Vazyme, Nanjing, China, A213-01) according to the manufacturer’s instructions.

3.11. RNA Extraction and Real-Time PCR Analysis

Total mRNA was isolated from GES-1 cells and gastric tissues using RNA Isolater Total RNA Extraction Reagent (Vazyme, Nanjing, China; cat. no. R401-01), followed by reverse transcription with 5× All-In-One RT MasterMix (ABM, Richmond, BC, Canada). Quantitative real-time PCR (qPCR) was conducted on a CFX96 Real-Time PCR Detection System (Bio-Rad Laboratories, Inc., Hercules, CA, USA; cat. no. 185-5195) using AceQ qPCR SYBR Green Master Mix or Taqprobe qPCR Master Mix (ABM, Richmond, BC, Canada). All reactions were run in triplicate. Relative transcript levels were normalized to GAPDH mRNA and calculated using the ΔΔCt method. Sequence-specific primers are listed in Supplementary Table S1.

3.12. Western Blotting

Cells and tissues were collected and lysed by RIPA Lysis Buffer (Solarbio, R0010) with 1% phenylmethanesulfonyl fluoride (PMSF) (Solarbio, P0100), 1% Phosphatase Inhibitor Cocktail I (MCE, Monmouth Junction, NJ, USA, HY-K0021), and 1% Phosphatase Inhibitor Cocktail II (MCE, HY-K0022). The lysates were centrifuged at 15,000 rpm at 4 °C for 15 min, and the supernatants were collected as protein samples. Protein concentration was determined using a BCA protein assay kit (CWBIO, Beijing, China, CW0014S). Protein samples were diluted with PBS to a unified final concentration, mixed with 6× SDS loading buffer (ROBY, Beijing, China, RBU114-2), and then heated at 99 °C for 10 min. Then, proteins were separated by 10% SDS-PAGE at 80 V for 30 min and then 120 V for 1 h. The separated proteins were electro-transferred onto nitrocellulose membranes (Pall, Port Washington, NY, USA, 66485) at 200 mA for 1 h 45 min. Membranes were then blocked in 10% non-fat milk (OXOID, Waltham, MA, USA, LP0033B) at room temperature for 1 h, followed by overnight incubation at 4 °C with primary antibodies. After washing, membranes were incubated with the appropriate secondary antibodies at room temperature for 1 h.
The following antibodies were purchased: rabbit anti-E-cadherin antibody (Proteintech, Rosemont, IL, USA, 20874-1-AP, 1:5000 dilution), rabbit anti-N-cadherin antibody (Proteintech, Rosemont, IL, USA, 22018-1-AP, 1:2000 dilution), rabbit anti-ZO-1 antibody (Abcam, Cambridge, UK, ab216880, 1:1000 dilution), rabbit anti-Snail antibody (CST, Danvers, MA, USA, 3879T, 1:1000 dilution), rabbit anti-β-actin antibody (HUABIO, R1102-1, 1:1000 dilution), Nod1 (CST, Danvers, MA, USA, USA, 3545S, diluted 1:1000), Mouse monoclonal to p62 (Abcam, UK, ab56416, 1:1000 dilution), anti-LC3B-II antibody (CST, USA 2775, 1:1000 dilution), and HRP-linked goat anti-rabbit IgG antibody (Solarbio, SE134, 1:5000 dilution).

3.13. H&E Staining

Stomach tissues were fixed in 4% polyformaldehyde, dehydrated through a serial alcohol gradient, embedded in paraffin, and cut into 4 μm-thick sections. Sections were stained with hematoxylin and eosin (H&E), followed by identification of the pathological status of the sample.

3.14. ELISA Analysis

The serum levels of TLR4, TLR5, and TLR9 in gerbils were measured by enzyme linked immunosorbent assay (ELISA) using the Gerbil ELISA kits purchased from Jiangsu Meibiao Biotechnology Co., Ltd. (Yanchen, China) following the manufacturer’s instructions.

3.15. Multiplex Assay

The supernatants of wild-type GES-1 cells (GES-1 WT), GES-1 cells exposed to H. pylori lysate for 1 generation (Lysate-GES-1 F1), and GES-1 cells with sustained exposure to H. pylori lysate for 10 (Lysate-GES-1 F10) and 30 (Lysate-GES-1 F30) consecutive generations were collected, respectively, and used for cytokine determination in Luminex assays. The levels of H. pylori infection-induced pro-inflammatory cytokines were measured using technical microspheres with a Luminex X-200 instrument (LUMINEX, Austin, TX, USA).

3.16. RNA Sequencing

RNA sequencing was performed by Beijing Novogene Technology Co., LTD. (Beijing, China). Sequencing libraries were generated using NEBNext® UltraTM RNA Library Prep Kit for Illumina® (NEB, Ipswich, MA, USA). The clustering of the index-coded samples was performed on a cBot Cluster Generation System using TruSeq PE Cluster Kit v3-cBot-HS (Illumia, San Diego, CA, USA). Illumina Casava1.8 software was used for base calling.

3.17. Statistical Analysis

Data were analyzed and visualized in GraphPad Prism 8. Independent sample t-test, one-way analysis of variance (ANOVA), and two-way ANOVA were used to determine statistical significance depending on the data type and experimental design. All data represents means ± SD, and statistical significance was defined as p < 0.05 (ns represents no significant difference, * p < 0.05, ** p < 0.01, *** p < 0.001, **** p < 0.0001).

4. Conclusions

In conclusion, this study elucidates a biphasic adaptive process in gastric epithelial cells during H. pylori infection. Initially, GES-1 cells undergo stress-induced dysfunction, characterized by suppressed proliferation, impaired motility, blocked autophagic flux, and elevated apoptosis. However, with prolonged bacterial exposure, the cells gradually recover essential functions and develop both phenotypic and immunological tolerance to H. pylori (Table 1). Our work provides a cellular-level characterization of the dynamic phenotypic and transcriptional alterations underlying chronic H. pylori infection, offering novel molecular insights that underscore the critical importance of early intervention to prevent H. pylori-associated gastric pathogenesis.

Supplementary Materials

The supporting information can be downloaded at: https://www.mdpi.com/article/10.3390/ijms26189016/s1.

Author Contributions

Conceptualization, X.Z. (Xiulin Zhang), Y.H., Z.C., J.Z. and C.L.; Methodology, X.Z. (Xiulin Zhang), Y.H., X.Z. (Xiaolu Zhang), Z.L., Z.G., X.L. (Xuancheng Lu), J.Z. and C.L.; Validation, X.Z. (Xiulin Zhang), X.Z. (Xiaolu Zhang), Z.L., W.W. and Z.D.; Formal analysis, X.Z. (Xiulin Zhang), Y.H., X.Z. (Xiaolu Zhang), W.W., Z.D. and J.L. (Jing Lu); Investigation, X.Z. (Xiulin Zhang), Y.H., Z.L., W.W., Z.D., J.L. (Jianyi Lv), M.G., X.H., X.L. (Xin Liu), J.L. (Jing Lu) and L.C.; Resources, Y.H., J.L. (Jing Lu), L.C., X.D., Z.C., X.L. (Xuancheng Lu), J.Z. and C.L.; Data curation, X.Z. (Xiulin Zhang), Y.H., X.Z. (Xiaolu Zhang), J.L. (Jianyi Lv), M.G., X.H. and X.L. (Xin Liu); Writing—original draft, X.Z. (Xiaolu Zhang); Writing—review & editing, X.Z. (Xiulin Zhang) and C.L.; Visualization, Y.H. and X.Z. (Xiaolu Zhang); Supervision, X.D., Z.G., Z.C., X.L. (Xuancheng Lu), J.Z. and C.L.; Project administration, J.Z. and C.L.; Funding acquisition, C.L. All authors have read and agreed to the published version of the manuscript.

Funding

This work was supported by the National Natural Science Foundation of China (No. 32070537); The Key Research and Development Program sponsored by Ministry of Science and Technology of the People’s Republic of China (No. 2022YFF0711005); Chinese Institutes for Medical Research, Beijing (No. CX24PY04); and R&D Program of Beijing Municipal Education Commission (No. KZ20210025037).

Institutional Review Board Statement

The animal study was reviewed and approved by the Animal Experiments and Experimental Animal Welfare Committee of CMU (protocol: AEEI-2015-179; 20 September 2018). All procedures were conducted in accordance with the institutional Guidelines for the Care and Use of Laboratory Animals.

Data Availability Statement

The data presented in this study are available on request from the corresponding author.

Acknowledgments

We also thank the National Institutes for Food and Drug Control for providing the H. pylori strain ATCC 43504 and Nonghua Lv from the Department of Gastroenterology, First Affiliated Hospital of Nanchang University for providing the H. pylori strain 7.13.

Conflicts of Interest

No commercial or financial relationships existed during the conduct of this research that could be interpreted as presenting a potential conflict of interest.

References

  1. Savoldi, A.; Carrara, E.; Graham, D.Y.; Conti, M.; Tacconelli, E. Prevalence of antibiotic resistance in Helicobacter pylori: A systematic review and meta-analysis in world health organization regions. Gastroenterology 2018, 155, 1372–1382.e17. [Google Scholar] [CrossRef]
  2. Salahi-Niri, A.; Nabavi-Rad, A.; Monaghan, T.M.; Rokkas, T.; Doulberis, M.; Sadeghi, A.; Zali, M.R.; Yamaoka, Y.; Tacconelli, E.; Yadegar, A. Global prevalence of Helicobacter pylori antibiotic resistance among children in the world health organization regions between 2000 and 2023: A systematic review and meta-analysis. BMC Med. 2024, 22, 598. [Google Scholar] [CrossRef] [PubMed]
  3. Park, J.Y.; Georges, D.; Alberts, C.J.; Bray, F.; Clifford, G.; Baussano, I. Global lifetime estimates of expected and preventable gastric cancers across 185 countries. Nat. Med. 2025. [Google Scholar] [CrossRef]
  4. National Toxicology Program. 15th report on carcinogens. Rep. Carcinog. 2021, 15, roc15. [Google Scholar] [CrossRef]
  5. Correa, P. Human gastric carcinogenesis: A multistep and multifactorial process—First american cancer society award lecture on cancer epidemiology and prevention. Cancer Res. 1992, 52, 6735–6740. [Google Scholar] [PubMed]
  6. Cover, T.L.; Lacy, D.B.; Ohi, M.D. The Helicobacter pylori cag type iv secretion system. Trends Microbiol. 2020, 28, 682–695. [Google Scholar] [CrossRef]
  7. Tran, S.C.; Bryant, K.N.; Cover, T.L. The Helicobacter pylori cag pathogenicity island as a determinant of gastric cancer risk. Gut Microbes 2024, 16, 2314201. [Google Scholar] [CrossRef] [PubMed]
  8. Shuman, J.; Lin, A.S.; Westland, M.D.; Bryant, K.N.; Fortier, G.E.; Piazuelo, M.B.; Reyzer, M.L.; Judd, A.M.; Tsui, T.; Mcdonald, W.H.; et al. Helicobacter pylori caga and cag type iv secretion system activity have key roles in triggering gastric transcriptional and proteomic alterations. Infect. Immun. 2025, 93, e0059524. [Google Scholar] [CrossRef]
  9. Yamaoka, Y.; Graham, D.Y. Helicobacter pylori virulence and cancer pathogenesis. Future Oncol. 2014, 10, 1487–1500. [Google Scholar] [CrossRef]
  10. Takahashi Kanemitsu, A.; Knight, C.T.; Hatakeyama, M. Molecular anatomy and pathogenic actions of Helicobacter pylori CagA that underpin gastric carcinogenesis. Cell Mol. Immunol. 2020, 17, 50–63. [Google Scholar] [CrossRef]
  11. Karayiannis, I.; Martinez-Gonzalez, B.; Kontizas, E.; Kokkota, A.V.; Petraki, K.; Mentis, A.; Kollia, P.; Sgouras, D.N. Induction of mmp-3 and mmp-9 expression during Helicobacter pylori infection via mapk signaling pathways. Helicobacter 2023, 28, e12987. [Google Scholar] [CrossRef]
  12. Malfertheiner, P.; Camargo, M.C.; El-Omar, E.; Liou, J.M.; Peek, R.; Schulz, C.; Smith, S.I.; Suerbaum, S. Helicobacter pylori infection. Nat. Rev. Dis. Primers. 2023, 9, 1–53. [Google Scholar] [CrossRef] [PubMed]
  13. Zhang, X.; He, Y.; Zhang, X.; Fu, B.; Song, Z.; Wang, L.; Fu, R.; Lu, X.; Xing, J.; Lv, J.; et al. Sustained exposure to Helicobacter pylori induces immune tolerance by desensitizing tlr6. Gastric Cancer 2024, 27, 324–342. [Google Scholar] [CrossRef]
  14. He, Y.; Zhang, X.; Zhang, X.; Fu, B.; Xing, J.; Fu, R.; Lv, J.; Guo, M.; Huo, X.; Liu, X.; et al. Hypoxia exacerbates the malignant transformation of gastric epithelial cells induced by long-term H. pylori infection. Microbiol. Spectr. 2024, 12, e0031124. [Google Scholar] [CrossRef] [PubMed]
  15. Ansari, S.; Yamaoka, Y. Helicobacter pylori virulence factors exploiting gastric colonization and its pathogenicity. Toxins 2019, 11, 677. [Google Scholar] [CrossRef]
  16. Baj, J.; Forma, A.; Sitarz, M.; Portincasa, P.; Garruti, G.; Krasowska, D.; Maciejewski, R. Helicobacter pylori virulence factors-mechanisms of bacterial pathogenicity in the gastric microenvironment. Cells 2020, 10, 27. [Google Scholar] [CrossRef]
  17. Martinelli, G.; Fumagalli, M.; Piazza, S.; Maranta, N.; Genova, F.; Sperandeo, P.; Sangiovanni, E.; Polissi, A.; Dell’Agli, M.; De Fabiani, E. Investigating the Molecular Mechanisms Underlying Early Response to Inflammation and Helicobacter pylori Infection in Human Gastric Epithelial Cells. Int. J. Mol. Sci. 2023, 24, 15147–15169. [Google Scholar] [CrossRef]
  18. Amalia, R.; Panenggak, N.; Doohan, D.; Rezkitha, Y.; Waskito, L.A.; Syam, A.F.; Lubis, M.; Yamaoka, Y.; Miftahussurur, M. A comprehensive evaluation of an animal model for Helicobacter pylori-associated stomach cancer: Fact and controversy. Helicobacter 2023, 28, e12943. [Google Scholar] [CrossRef]
  19. Tohidpour, A.; Gorrell, R.J.; Roujeinikova, A.; Kwok, T. The middle fragment of Helicobacter pylori caga induces actin rearrangement and triggers its own uptake into gastric epithelial cells. Toxins 2017, 9, 237. [Google Scholar] [CrossRef] [PubMed]
  20. Tohidpour, A. Caga-mediated pathogenesis of Helicobacter pylori. Microb. Pathog. 2016, 93, 44–55. [Google Scholar] [CrossRef]
  21. He, Y.; Wang, C.; Zhang, X.; Lu, X.; Xing, J.; Lv, J.; Guo, M.; Huo, X.; Liu, X.; Lu, J.; et al. Sustained exposure to Helicobacter pylori lysate inhibits apoptosis and autophagy of gastric epithelial cells. Front. Oncol. 2020, 10, 581364. [Google Scholar] [CrossRef]
  22. Pachathundikandi, S.K.; Tegtmeyer, N.; Backert, S. Masking of typical TLR4 and TLR5 ligands modulates inflammation and resolution by Helicobacter pylori. Trends Microbiol. 2023, 3, 903–915. [Google Scholar] [CrossRef] [PubMed]
  23. Dooyema, S.D.R.; Noto, J.M.; Wroblewski, L.E.; Piazuelo, M.B.; Krishna, U.; Suarez, G.; Romero-Gallo, J.; Delgado, A.G.; Peek, R.M. Helicobacter pylori actively suppresses innate immune nucleic acid receptors. Gut Microbes 2022, 14, 2105102. [Google Scholar] [CrossRef]
  24. Choi, Y.J.; Kim, N.; Chang, H.; Lee, H.S.; Park, S.M.; Park, J.H.; Shin, C.M.; Kim, J.M.; Kim, J.S.; Lee, D.H.; et al. Helicobacter pylori-induced epithelial-mesenchymal transition, a potential role of gastric cancer initiation and an emergence of stem cells. Carcinogenesis 2015, 36, 553–563. [Google Scholar] [CrossRef]
  25. Lee, D.G.; Kim, H.S.; Lee, Y.S.; Kim, S.; Cha, S.Y.; Ota, I.; Kim, N.H.; Cha, Y.H.; Yang, D.H.; Lee, Y.; et al. Helicobacter pylori CagA promotes Snail-mediated epithelial-mesenchymal transition by reducing GSK-3 activity. Nat. Commun. 2014, 5, 4423. [Google Scholar] [CrossRef] [PubMed]
  26. Zheng, H.; Zhang, T.; Zhang, J.; Ning, J.; Fu, W.; Wang, Y.; Shi, Y.; Wei, G.; Zhang, J.; Chen, X.; et al. AUF1-mediated inhibition of autophagic lysosomal degradation contributes to CagA stability and Helicobacter pylori-induced inflammation. Gut Microbes 2024, 1, 2382766. [Google Scholar] [CrossRef] [PubMed]
  27. Saberi, S.; Douraghi, M.; Azadmanesh, K.; Shokrgozar, M.A.; Zeraati, H.; Hosseini, M.E.; Mohagheghi, M.A.; Parsaeian, M.; Mohammadi, M. A potential association between Helicobacter pylori caga epiya and multimerization motifs with cytokeratin 18 cleavage rate during early apoptosis. Helicobacter 2012, 17, 350–357. [Google Scholar] [CrossRef]
  28. Wang, X.; Wang, B.; Gao, W.; An, Y.; Dong, G.; Jia, J.; Yang, Q. Helicobacter pylori inhibits autophagic flux and promotes its intracellular survival and colonization by down-regulating sirt1. J. Cell. Mol. Med. 2021, 25, 3348–3360. [Google Scholar] [CrossRef] [PubMed]
  29. Chen, D.; Wu, L.; Liu, X.; Wang, Q.; Gui, S.; Bao, L.; Wang, Z.; He, X.; Zhao, Y.; Zhou, J.; et al. Helicobacter pylori CagA mediated mitophagy to attenuate the NLRP3 inflammasome activation and enhance the survival of infected cells. Sci. Rep. 2024, 1, 21648. [Google Scholar] [CrossRef]
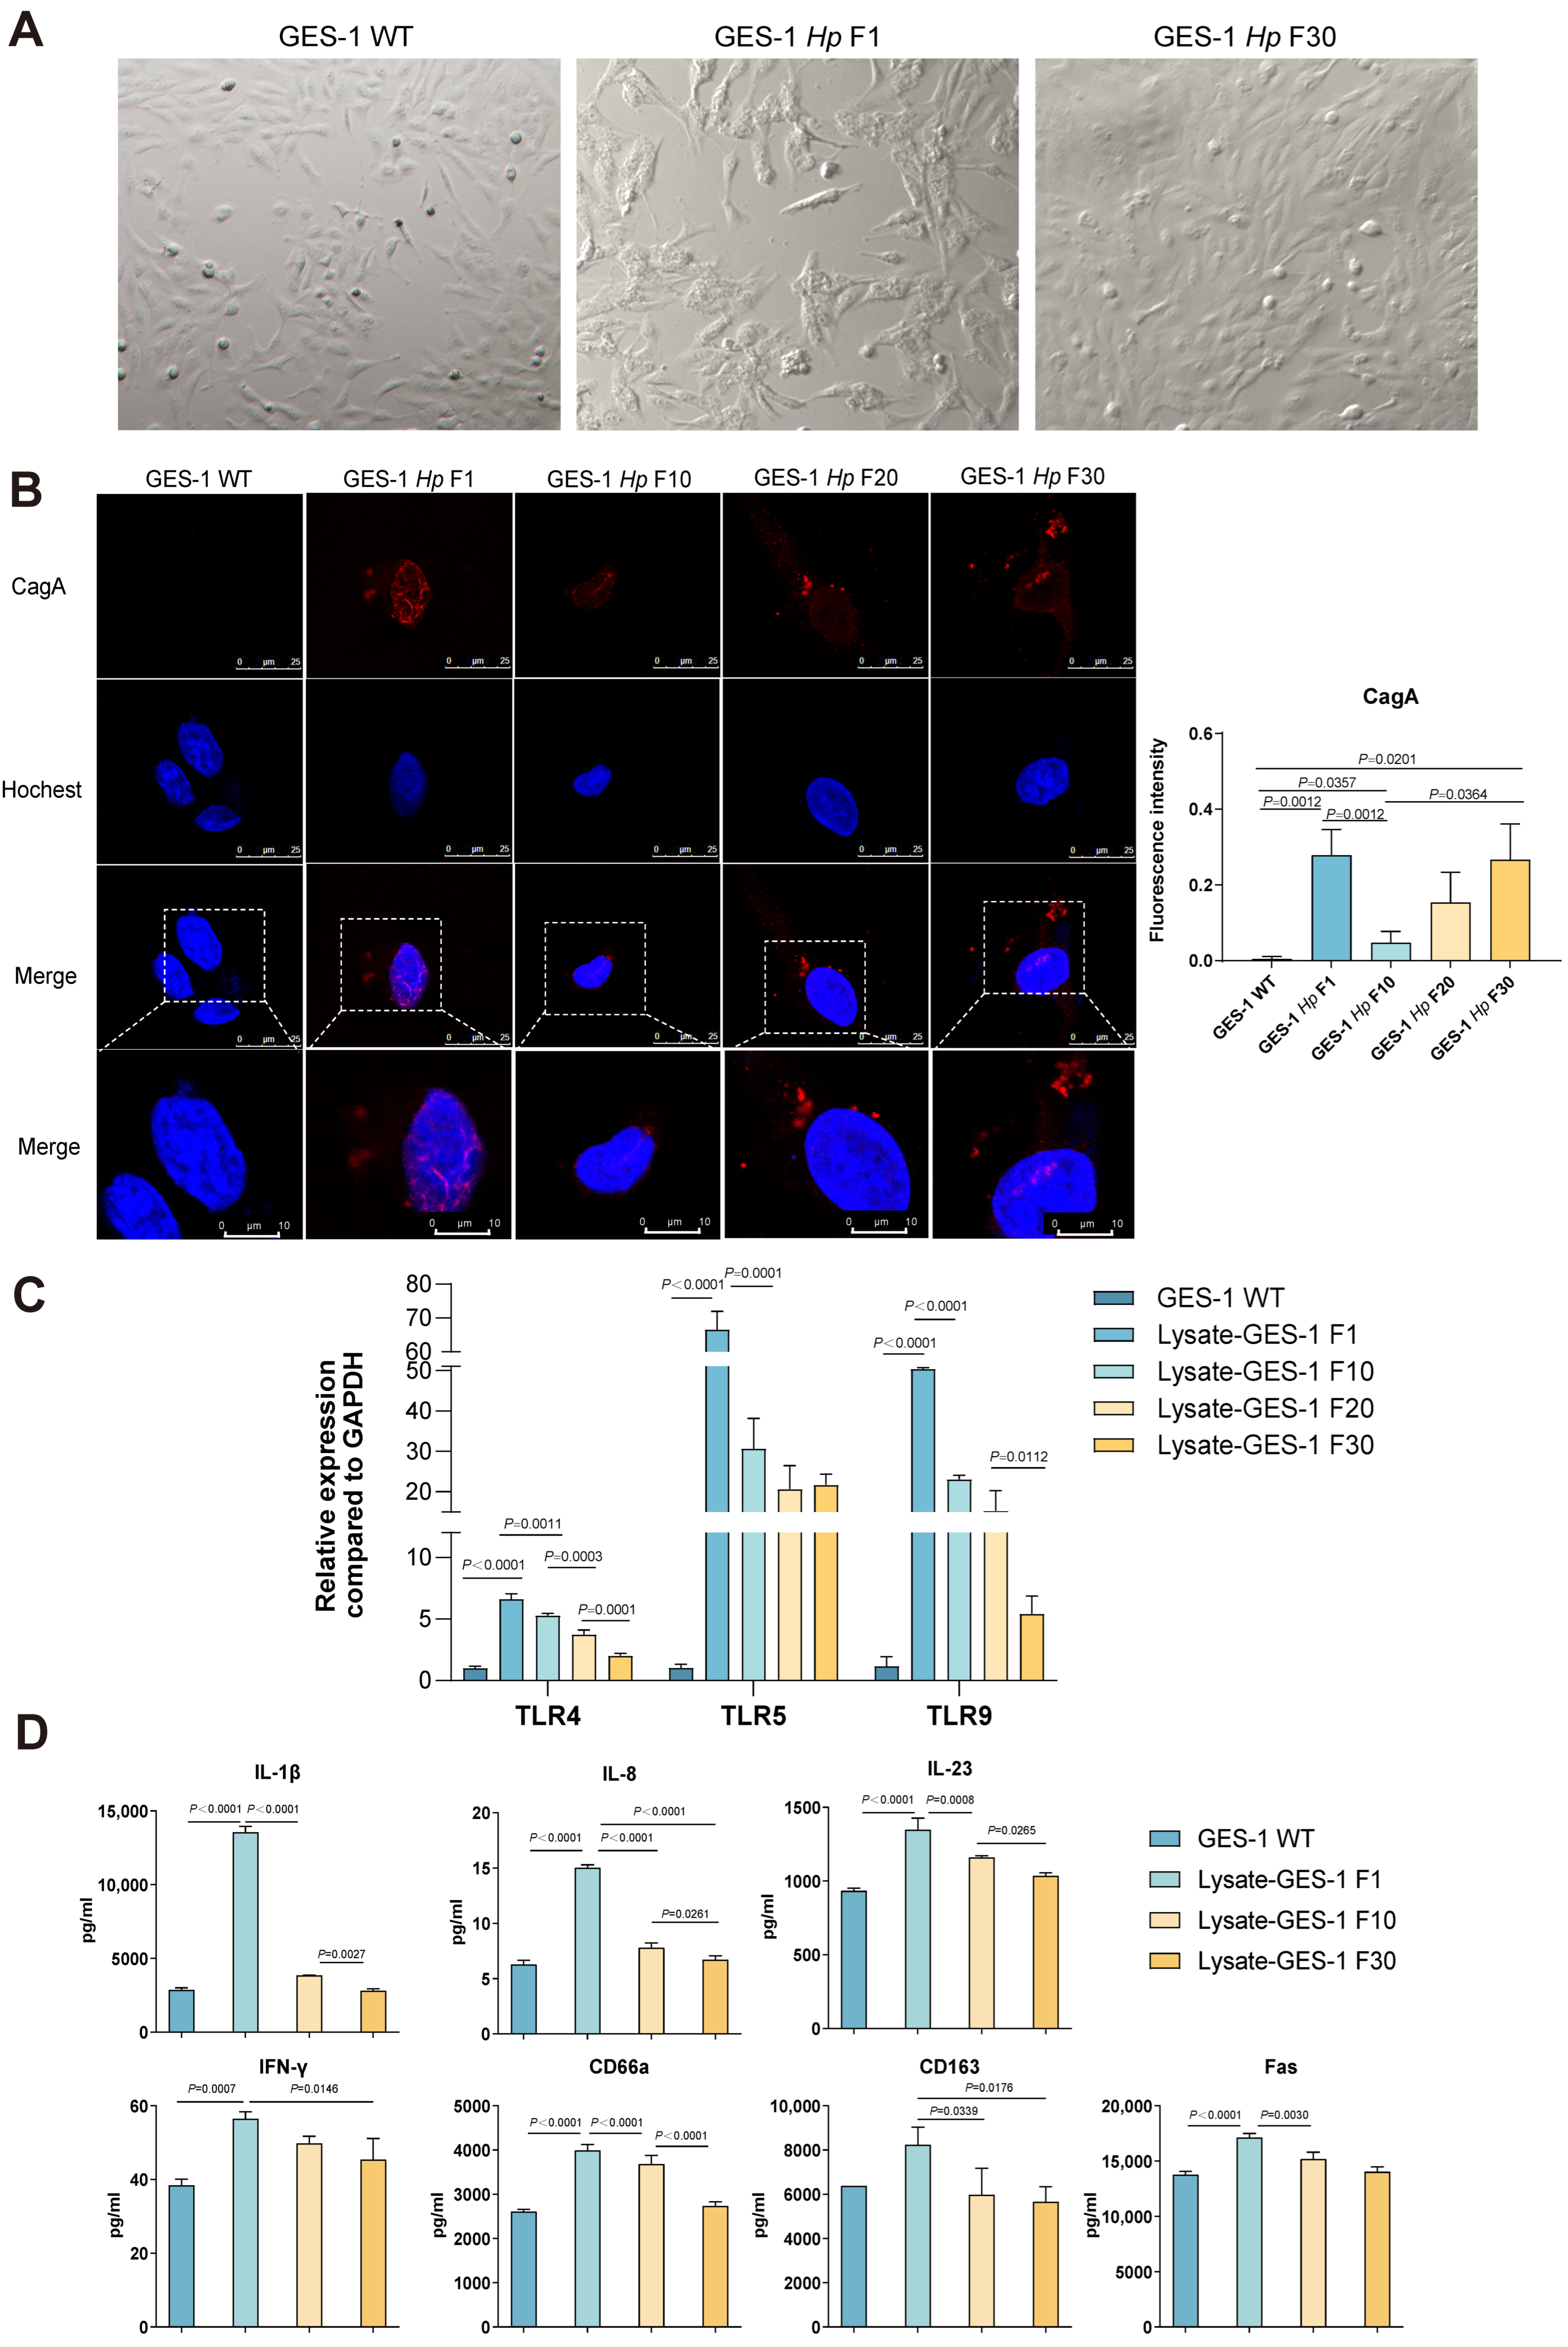
Figure 1. The morphology and infectious characteristics of GES-1 cells under H. pylori infection. (A) The morphology of normal gastric epithelial cells (GES-1 WT) and H. pylori short-term (GES-1 Hp F1) or long-term (GES-1 Hp F30) infected gastric epithelial cells. Magnification: 1000×. (B) IF staining of CagA delivered to GES-1 cells as H. pylori infection prolonged. Red represents CagA protein, blue represents the nucleus. (C) The mRNA level of TLR4, TLR5, and TLR9 in GES-1 WT cells and H. pylori lysate-stimulated GES-1 cells (Lysate-GES-1 F1, Lysate-GES-1 F10, Lysate-GES-1 F20, Lysate-GES-1 F30). (D) The expression of pro-inflammatory cytokines (IL-1β, IL-8, IL-23, IFN-γ) and molecules (CD66a, CD163, Fas) in GES-1 WT, Lysate-GES-1 F1, Lysate-GES-1 F10, and Lysate-GES-1 F30 cells detected by multiplex assay. All experiments were performed with 3 biological replicates. One-way ANOVA was used to determine statistical significance in (BD).
Ijms 26 09016 g001
Figure 2. The proliferation capacity of GES-1 cells under H. pylori infection. (A) The proliferation capacity of GES-1 WT, GES-1 Hp F1, GES-1 Hp F10, GES-1 Hp F20, and GES-1 Hp F30 cells analyzed by colony formation assay. (B) The proliferation capacity of GES-1 WT, GES-1 Hp F1, GES-1 Hp F10, GES-1 Hp F20, and GES-1 Hp F30 cells analyzed by CCK-8 cell proliferation assay. All experiments were performed with 3 biological replicates. One-way ANOVA was used to determine statistical significance in (A). Two-way ANOVA was used to determine statistical significance in (B).
Ijms 26 09016 g002
Figure 3. The migration, invasion capacity, and EMT features of GES-1 cells under H. pylori infection. (A) The proliferation capacity of GES-1 WT, GES-1 Hp F1, GES-1 Hp F10, GES-1 Hp F20, and GES-1 Hp F30 cells analyzed by colony formation assay. (B) The proliferation capacity of GES-1 WT, GES-1 Hp F1, GES-1 Hp F10, GES-1 Hp F20, and GES-1 Hp F30 cells analyzed by CCK-8 cell proliferation assay. (C) The expression of EMT markers (ZO-1, E-cadherin, Snail and N-cadherin) detected by Western blotting. All experiments were performed with 3 biological replicates. One-way ANOVA was used to determine statistical significance in (A,B).
Ijms 26 09016 g003
Figure 4. The autophagy and apoptosis of GES-1 cells under H. pylori infection. (A) The fluorescence image of autophagosomes and autolysosomes and the ratio of autophagosome counts/autolysosome counts in GES-1 WT, GES-1 Hp F1, GES-1 Hp F10, GES-1 Hp F20, and GES-1 Hp F30 cells (calculated with 5 cells for each group). (B) The expression of autophagy markers (LC3-II and p62) detected by Western blotting (performed in triplicate). (C) The apoptosis level of GES-1 WT, GES-1 Hp F1, GES-1 Hp F10, GES-1 Hp F20, and GES-1 Hp F30 cells detected by flow cytometry (performed in triplicate). All analyses used one-way ANOVA with Tukey’s test.
Ijms 26 09016 g004
Figure 5. Transcriptomic remodeling of gastric epithelial cells in response to incremental H. pylori lysate stimulation. (AC) Volcano plots for Lysate-GES-1 F1 vs. GES-1 WT, Lysate-GES-1 F30 vs. GES-1 WT, and Lysate-GES-1 F30 vs. Lysate-GES-1 F1. Red dots indicate genes upregulated in the first-named group, and blue dots indicate downregulated genes (|log2FC| ≥ 1, p < 0.05). Numbers in the plot corners denote the counts of up- and downregulated genes. (DI) Gene Ontology enrichment generated with clusterProfiler, ranked by −log10(p); red bars represent pathways enriched for upregulated genes, and blue bars represent pathways enriched for downregulated genes. (J) Unsupervised TCseq clustering heatmap showing DEGs with dynamic expression patterns across infection stages; representative gene names are annotated on the right. (K,L) Relative expression of selected core genes (normalized to GES-1 WT = 1). Points represent biological replicates (n = 3). One-way ANOVA was used to determine statistical significance in (K,L). (* p < 0.05, ** p < 0.01, *** p < 0.001, **** p < 0.0001).
Ijms 26 09016 g005
Figure 6. The progressive pathologic changes in the gastric tissues of Mongolian gerbils. (A) The colonization of H. pylori detected by nested PCR with gastric fluid from infected Mongolian gerbils. (B) The representative pathologic changes in gastric tissue from Mongolian gerbils during long-term H. pylori infection. (C) The expression of TLR4, TLR5, and TLR9 in the serum of H. pylori-infected Mongolian gerbils.
Ijms 26 09016 g006
Table 1. Comparison of Acute vs. Chronic H. pylori Infection.
CategoryAcute PhaseChronic PhaseOutcome of Chronic H. pylori Infection
MorphologyHummingbird phenotypeMorphology reverts to normalCellular adaptation and immune tolerance
CagA DeliveryHigh cytoplasmic enrichmentCagA signal decreases then reboundsImpaired toxin clearance
TLR ExpressionTLR4/5/9 upregulatedDownregulatedImmune desensitization is established
Cytokine SecretionIL-1β, IL-8, IL-23, IFN-γ peakDeclinesAttenuated inflammatory response
Cell ProliferationDecreasedRecoversOvercoming of stress-induced growth arrest
Migration and InvasionReducedRecovers and then enhancedAcquisition of motile, invasive phenotype
EMT Markers ExpressionUnaffectedE-cadherin/ZO-1 down; Snail upEMT initiation promotes malignancy
Autophagic FluxBlockedRestoredShift to pro-survival autophagy
Apoptosis LevelElevatedDeclinesAccumulation of damaged cells
Transcriptomic ProfileDNA repair and apoptosis pathways activeNF-κB and pro-migration genes activeReprogramming to pro-carcinogenic signaling
In Vivo PathologyNo significant changesProgressive atrophy to dysplasiaRecapitulation of Correa’s cascade
In Vivo TLR ExpressionTLR4/9 increasedTLR4/9 declineSystemic immune tolerance
Disclaimer/Publisher’s Note: The statements, opinions and data contained in all publications are solely those of the individual author(s) and contributor(s) and not of MDPI and/or the editor(s). MDPI and/or the editor(s) disclaim responsibility for any injury to people or property resulting from any ideas, methods, instructions or products referred to in the content.