Article

Biological and Behavioral Responses of Drosophila melanogaster to Dietary Sugar and Sucralose

1
Animal and Veterinary Research Center (CECAV), Associate Laboratory for Animal and Veterinary Sciences (AL4AnimalS), University of Trás-os-Montes and Alto Douro (UTAD), 5000-801 Vila Real, Portugal
2
Centre for the Research and Technology of Agro-Environmental and Biological Sciences (CITAB), University of Trás-os-Montes and Alto Douro (UTAD), 5000-801 Vila Real, Portugal
*
Authors to whom correspondence should be addressed.
Int. J. Mol. Sci. 2025, 26(18), 8951; https://doi.org/10.3390/ijms26188951
Submission received: 31 July 2025 / Revised: 3 September 2025 / Accepted: 12 September 2025 / Published: 14 September 2025
(This article belongs to the Special Issue Drosophila: A Versatile Model in Biology and Medicine—2nd Edition)

Abstract

Sugar and sucralose are frequently used together and separately in human food and beverages, which is the reason why studying their biological action on different organisms is really important. Nevertheless, the effect of highly concentrated sugar diet on male infertility is still under evaluation. The most important is that biological activity of sucralose, a chloroorganic synthetic sweetener, is highly persistent and difficultly altered in the environment, as its influence on the biological activity of other substances has not been completely elucidated yet. For this reason, in this work, sugar and sucralose–sugar mixtures, frequently used in beverages and other food products, influence Drosophila melanogaster behavior, longevity, reproductive performance, and genomic integrity is investigated. It has been demonstrated that an increase in sugar concentration promotes biological viability by enhancing prolificacy, lifespan, and locomotor performance. However, this only occurs up to a certain threshold concentration; beyond this, metabolic imbalance occurs. The presence of sucralose in solutions further augments the toxic effect, indicating high genotoxicity of the sweetener at doses over 0.5%, leading to significant DNA alterations and changing the Drosophila melanogaster behavior pattern. Therefore, either sugar or sucralose metabolic impact and toxicity is dose-related and their common presence in the solution might lead to the synergetic effect.

1. Introduction

The term “sweetener” generally refers to a substance added to food and drinks with purpose of sweetening them [1,2,3,4]. Common sugar or sucrose is the most used sweetener in the world. Nevertheless, the abusive consumption of sugar may lead to complexities like diabetes mellitus type I and II, which is the reason why sugar substitutes are widely used as dietetic sweeteners.
Sucralose (Figure 1) is one of the most used dietetic sweeteners in Portugal and throughout the European Union in the alimentary and pharmaceutical industries as a flavor corrector [5,6,7,8,9,10]. In the USA, it is also known by its registered trademark, Splenda®. In Codex Alimentarius, it is registered as E955. It is a trichloro-substituted derivative of galactosucrose, which has twice the sweetness of saccharin, triple the sweetness of aspartame, and is up to a thousand times as sweet as common sugar. When it comes to its physical properties, free sucralose is a white, shiny, odorless substance that is soluble in water. Contrary to other traditional sweeteners, like aspartame, acesulfame K, saccharin, and stevia, it is a carbohydrate derivative and is the reason why it is extremely sweet, contrarily to the above-mentioned sweeteners.
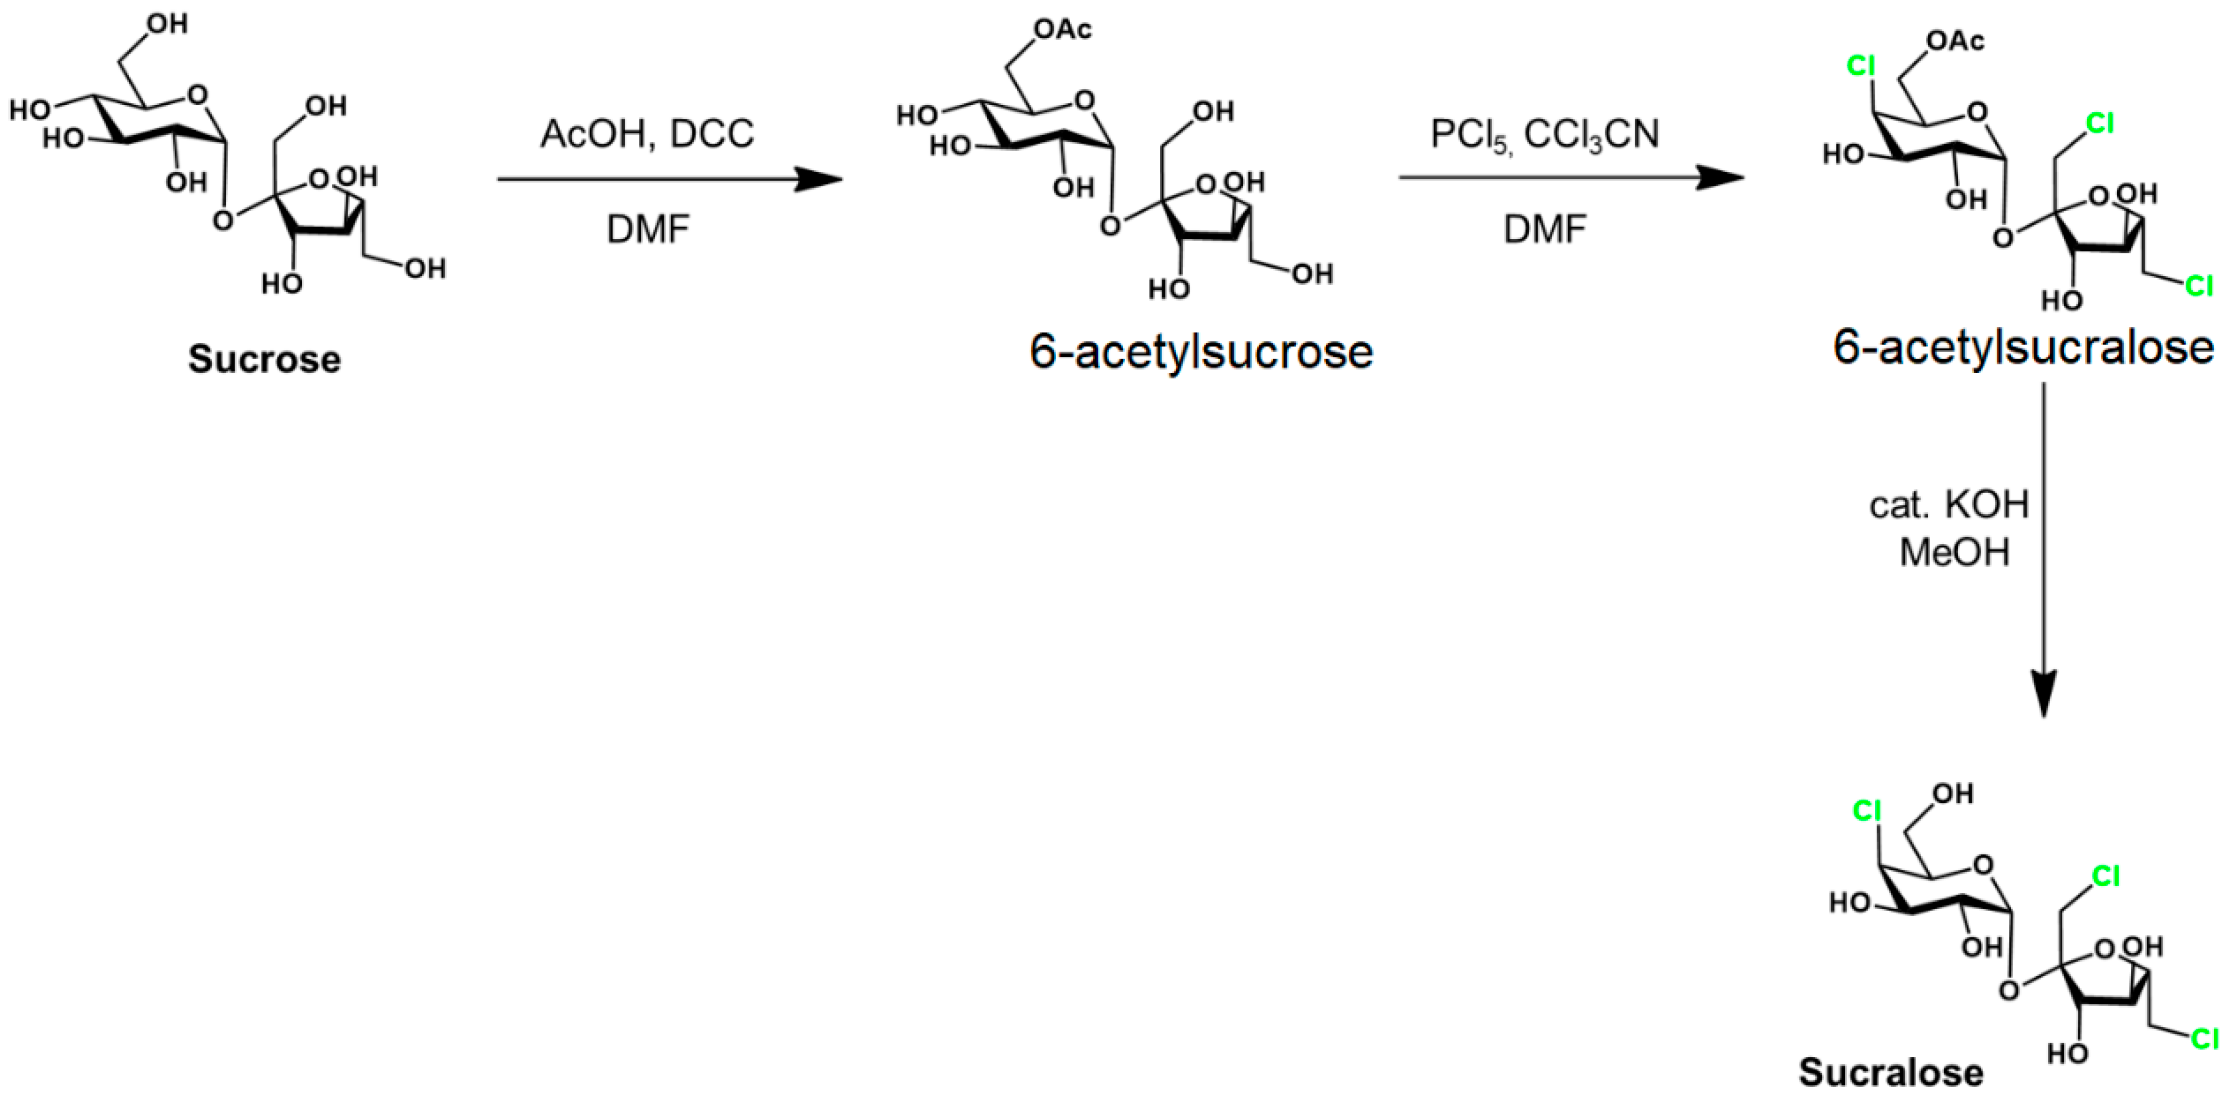
Sucralose is synthetized in food industry from common sugar through several steps (Figure 2).
The acylation in the first stage may also be made by diethylazodicarboxylate. The C4 epimerization is realized in the second stage. This synthesis involves either the toxic reagents (DCC, DAAD, and PCl5) or the intermediate (6-acetyl sucralose), as mentioned below.
Despite being considered safe for use by diabetics and athletes, its harmful effects on human health and the environment are still unknown, and some of its negative effects have only begun to be studied now. A recent study involving pregnant and breastfeeding women [11,12,13] confirms that sucralose enters breast milk, causing irreparable damage to the development of the gut microbiota of the human fetus in the last months of pregnancy, as well as in neonates and babies, and is the reason why its safety for use during pregnancy and breastfeeding is still questioned.
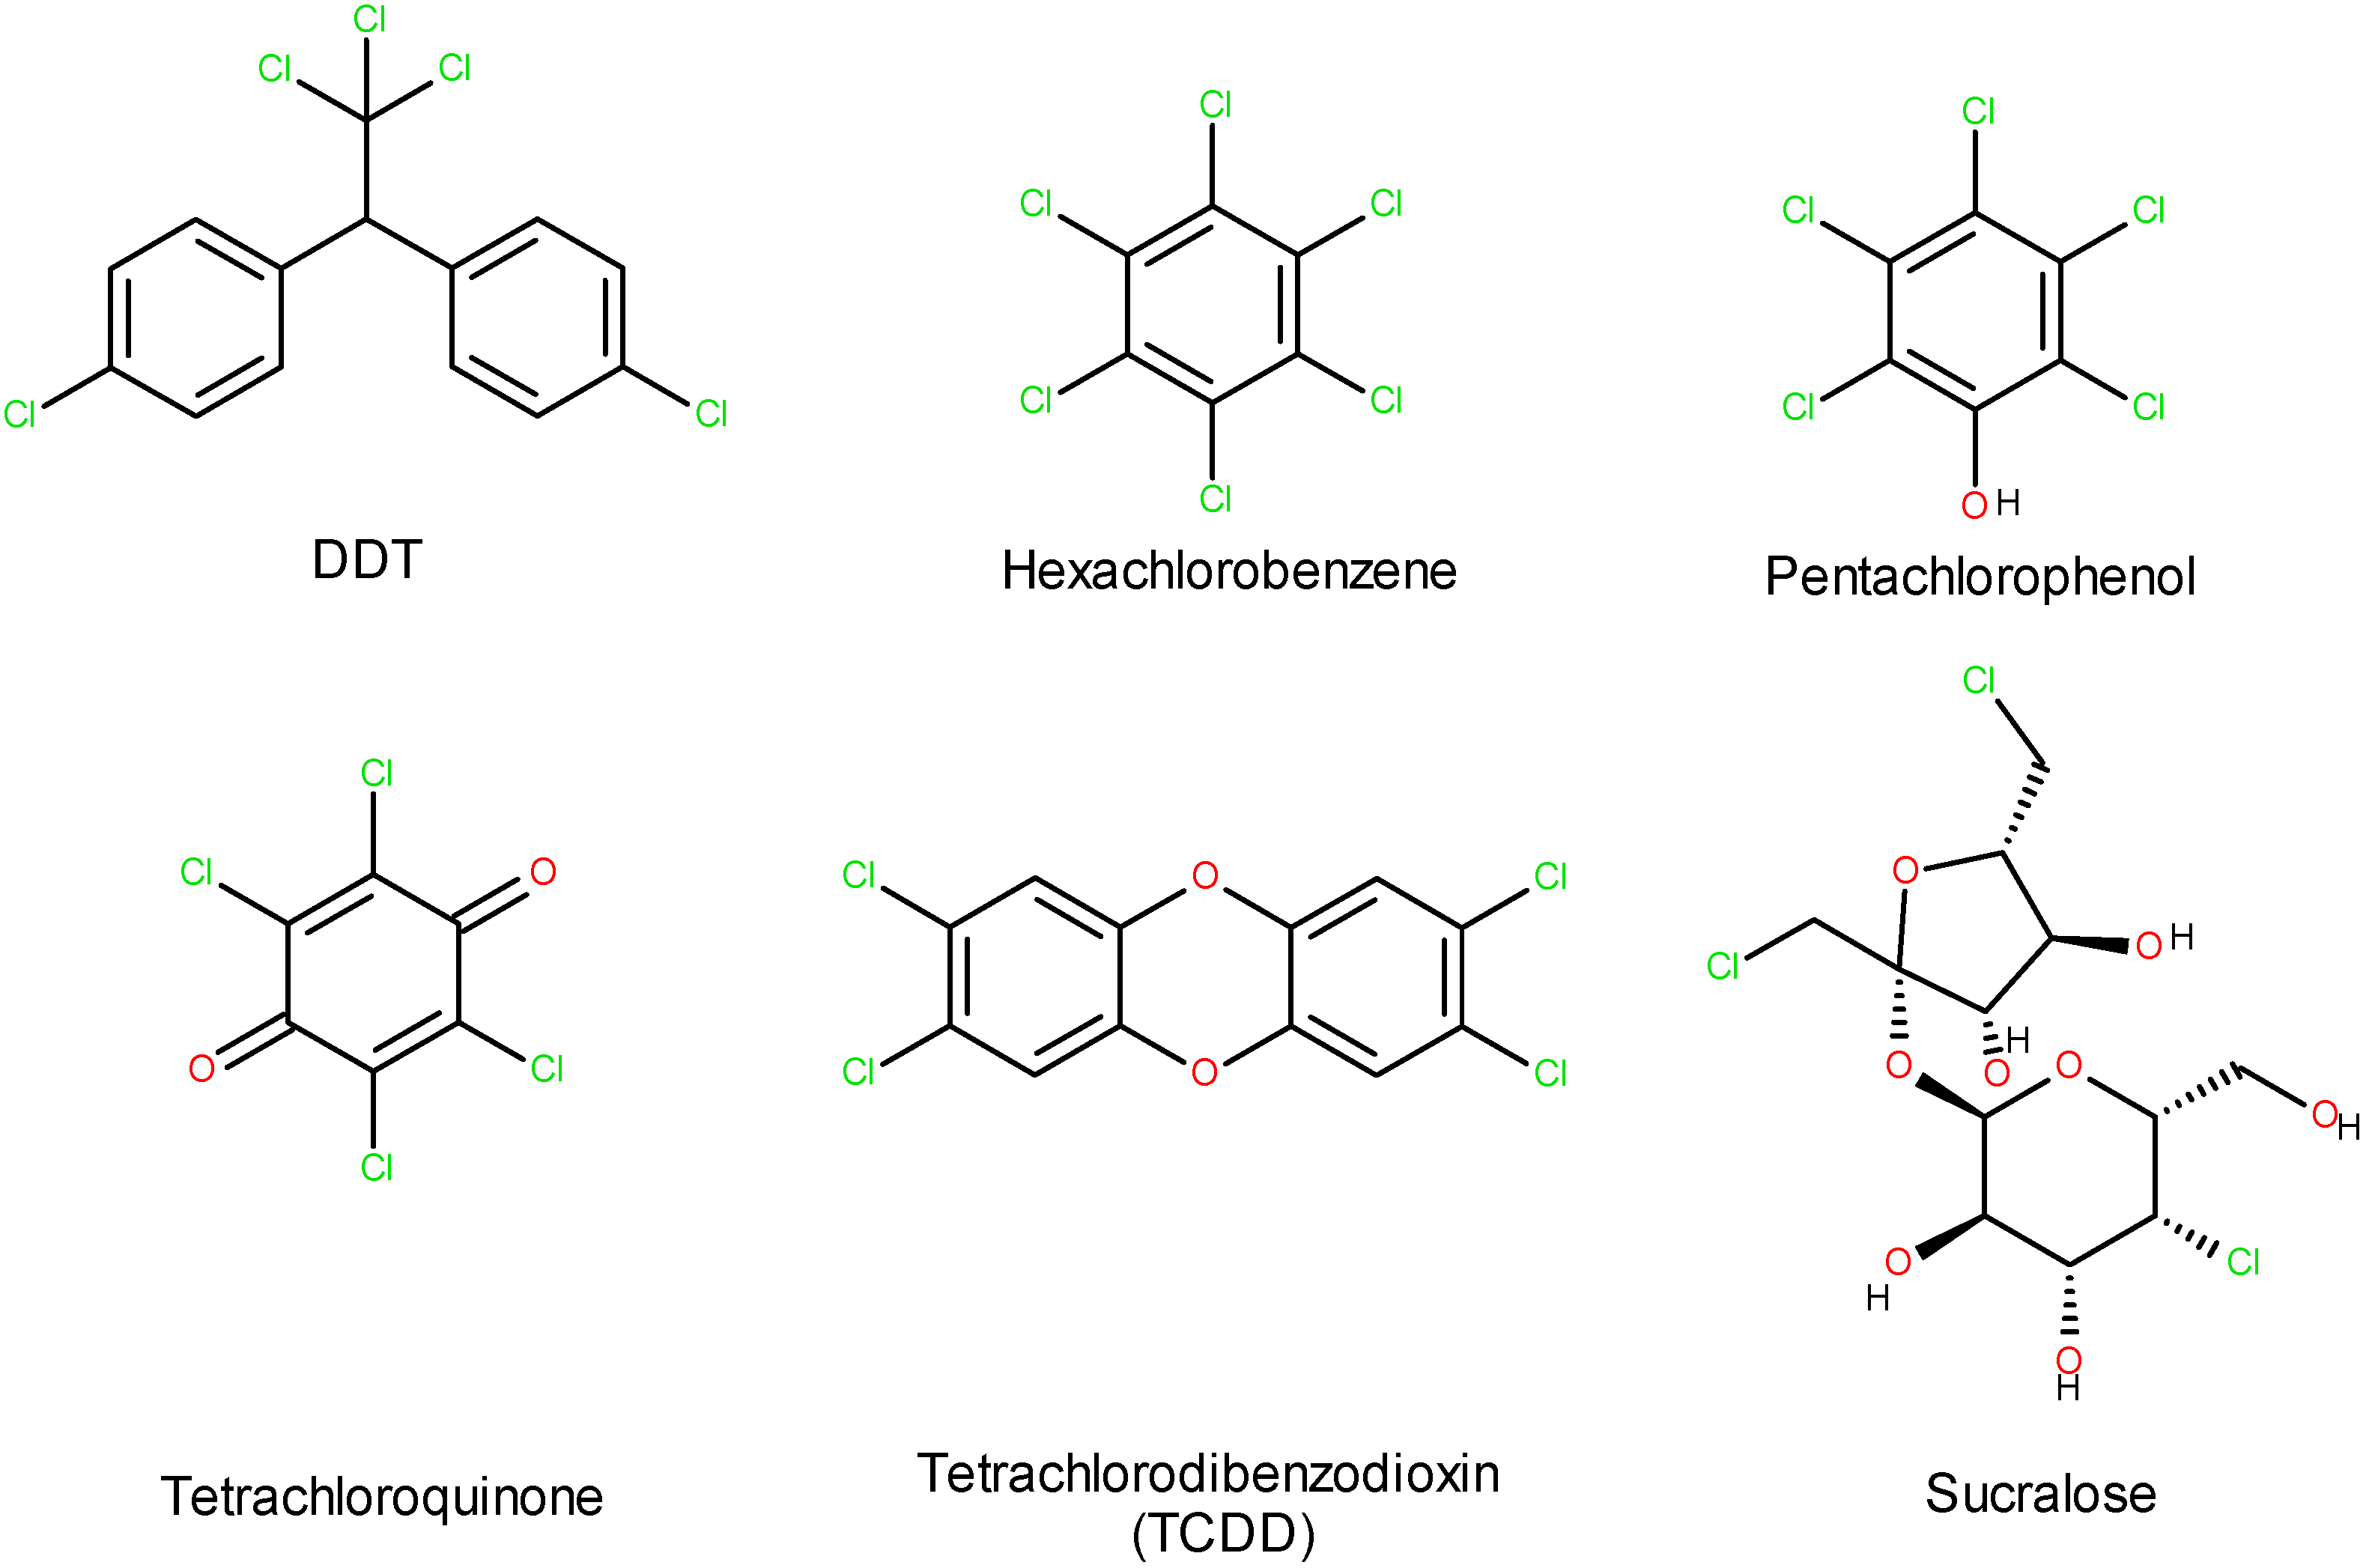
Moreover, as sucralose is nearly not biodegradable, it accumulates in the environment [14,15,16]. Furthermore, when sucralose decomposes thermally or by some bacterial action, it transforms into toxic compounds such as dioxins and tetrachlorodibenzofurans. It should not be forgotten that sucralose is also part of the group of halogen organic compounds (Figure 3).
Another critical issue yet to be addressed about this compound is the presence of 6-acetyl sucralose, the industrial precursor of the sweetener (Figure 2), in reasonable concentrations in industrial product samples. Furthermore, its appearance in the human intestine is also likely, where it is esterified precisely by the hydroxyl linked to the C6 carbon atom. Recent research has proven either the genotoxicity of 6-acetyl sucralose [17,18,19,20] or the formation of acetylated metabolites in significant concentrations in the human body [21,22].
Toxicological studies of the steric derivative of sucralose proved that the mechanism of its genotoxicity can be considered clastogenic (initiator of breaks in the DNA structure). Even microscopic concentrations of 6-acetyl sucralose, which can be detected in industrial samples and beverages, exceed the safe threshold of 0.15 μg/person/day. The 6-acetyl sucralose ester increases in intestinal epithelial cells, expressing genes linked to inflammation, oxidative stress, and carcinogenesis, including MT1G and SHMT2 [23,24,25].
Another harmful action of the steric derivative is impeding the action of CYP1A2 and CYP2C19, proteins of the cytochrome P450 family, that are responsible for the transformation of various food substances to their more accessible form, which leads to secondary toxic effects [26,27,28,29]. The increase in the genotoxicity of 6-acetyl sucralose concerning sucralose is due to the more significant activity of the secondary organic chloride, linked to the C4 carbon atom, activated by the accepting action of the steric group. The activation of this same atom is also responsible for the mutagenic action of the substance. The sucralose genotoxicity may be realized by either direct interaction with DNA or by indirect induction (generally, by oxidative or metabolic stress, which may lead to secondary oxidative damage). Nevertheless, the investigation of genotoxicity of this sweetener, alone or in the presence of another food components, is still object of an extensive study. A review article [30] describes in detail the state-of-the-art of toxicological effects of sucralose.
Sucralose is frequently used in beverages (soft drinks, fuse teas, dietetic drinks), pharmaceuticals, and dietetic food alongside sugar and other sweeteners (acesulfame K, aspartame, sorbitol, mannitol). This use is aimed to make sweet sensorial properties more expressed in order to enhance the consumer reaction. The same sweeteners are also used in electronic cigarettes, in which they mask the nicotine scent [29].
On the other hand, as for now, few to no studies are known to describe the sucralose biological activity, including genotoxicity, in the presence of other substances, including natural and synthetic sweeteners [31,32,33,34,35,36,37,38,39,40], food contaminants, and food contact substances, showing the influence of sucralose mixtures with other substances on oxidative, genomic, and environmental stress. The cases of synergism in oxidative and genomic stress of sucralose and other compounds (including aspartame and benzo[a]pyrene) have already been observed [31,32,33,34,35]. For this reason, the influence of sucralose on the biological impact of these substances is an object of an extensive study.
In this aspect, D. melanogaster is suitable for biological, behavioral, and genotoxicity essays of sucralose mixtures with other substances [41,42,43,44,45,46,47,48,49,50]. It is a widely used model organism in genotoxicity assays due to its unique genetic and biological characteristics due to six main reasons:
-
Shares a substantial proportion of its genome with humans, with approximately 60% of human disease-associated genes having identifiable homologs. Its fully sequenced and extensively annotated genome makes it a valuable model for assessing the impact of mutagens on specific genes and regulatory pathways that are conserved across species, including humans.
-
It has a short life cycle (approximately 10–12 days at 25 °C) and produces large numbers of offspring, making it particularly suitable for large-scale genetic screens and statistical analyses of mutagenic effects across generations. These features are essential for the efficient and cost-effective assessment of genotoxic risk.
-
There is an extensive collection of mutant lines, which enables the study of a wide range of biological conditions and responses. This genetic diversity allows researchers to investigate the effects of genotoxic agents under different genetic backgrounds, contributing to a more comprehensive understanding of mechanisms involved in DNA damage and repair.
-
Compared to mammalian models, the use of D. melanogaster raises fewer ethical concerns and is significantly more cost-effective, and its small size and ease of handling make it well suited for high-throughput screening of chemicals, radiation, and environmental pollutants for genotoxic potential.
-
Despite frequent application of Caenorhabditis elegans as a model for food additive safety genotoxicity tests, Drosophila is a much more versatile tool, capable of being applied to the genotoxicity test of sucralose as both a food additive and an environmental contaminant.
-
It has a simple and well-characterized gut microbiota that can be experimentally manipulated, allowing the investigation of how diet, environmental agents, or genetic factors influence microbial composition and host physiology.
In this study, D. melanogaster was used to perform biological, behavioral, and genotoxicity assays with different concentrations of sugar, both alone and in combination with sucralose, administered chronically through the diet throughout larval development. The aim was to characterize for the first time the concentration-dependent effects of each compound individually and to explore potential synergistic interactions between them, leading to DNA damage, as well as behavioral and biological changes, resulting from the genomic stress. Such interactions could result in enhanced metabolic dysregulation and increased toxicity, thereby providing insight into their combined biological impact.

2. Results

2.1. Proficiency

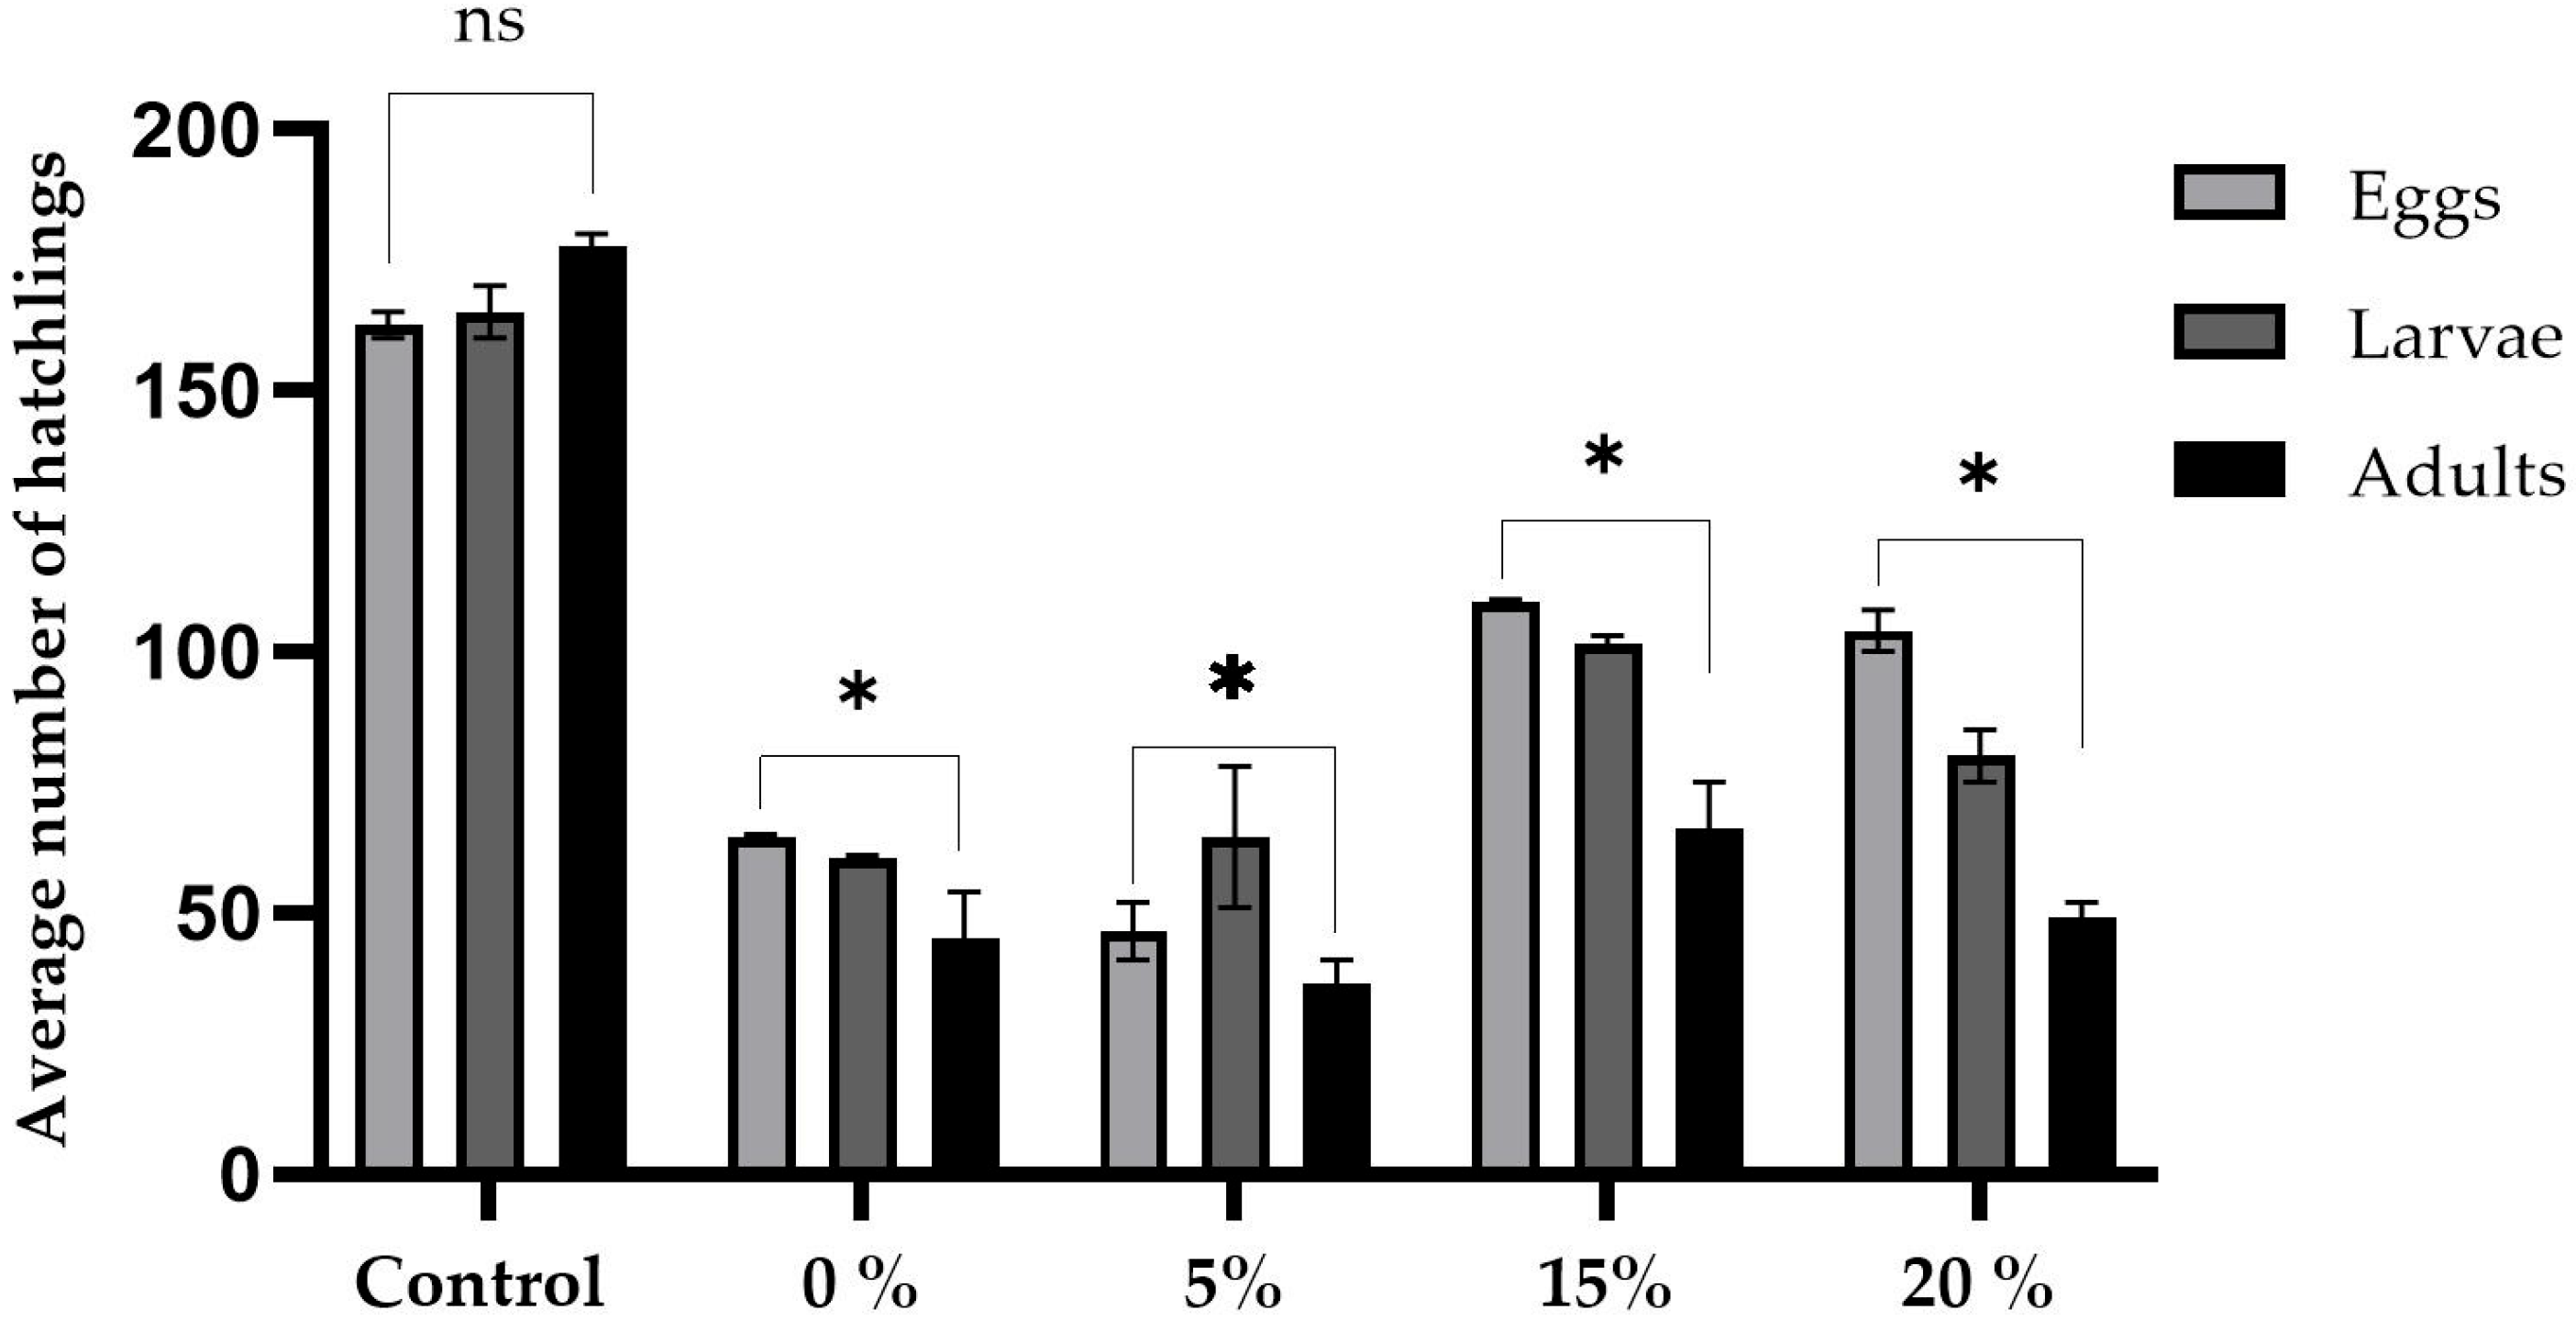
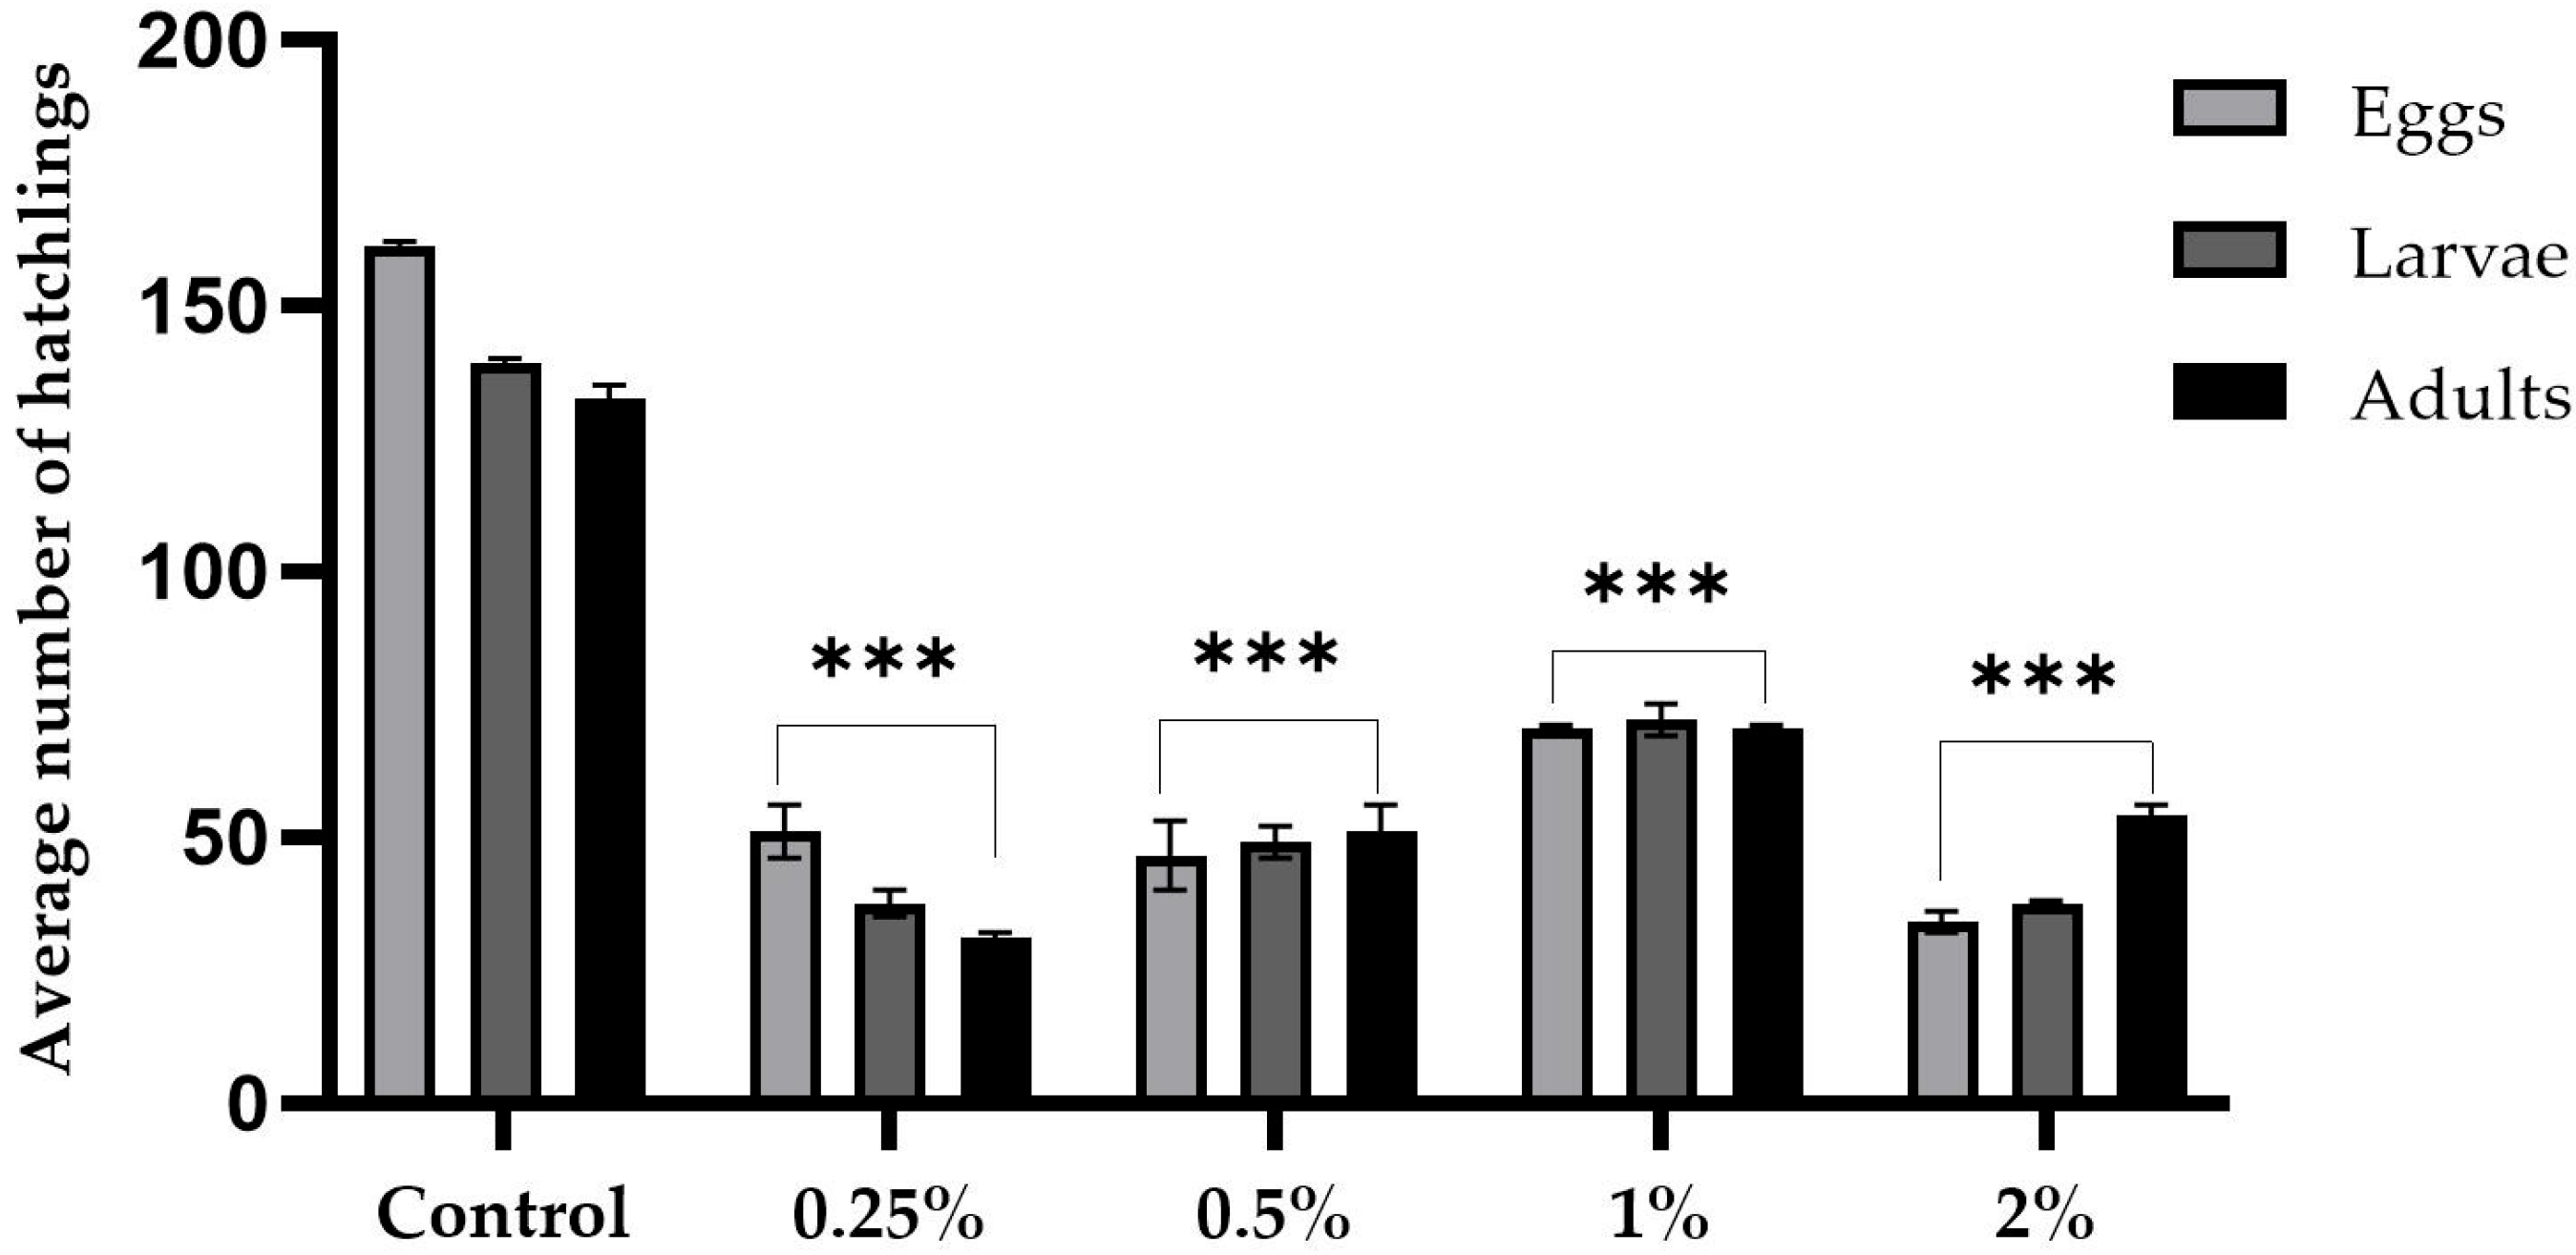
Figure 4 and Figure 5 summarize the prolificacy results for the sugar and sucralose–sugar treatments and their respective concentrations and control. Five males and five virgin females were used per tube. A total of 15 tubes for each concentration, with three independent replicates.
An analysis of the reproductive capacity of Drosophila melanogaster exposed to different concentrations of sucrose revealed statistically significant differences among the three evaluated stages: eggs, larvae, and adults (Figure 4). The sucrose control group produced an average of 162 eggs, 165 larvae, and 177 adults. The absence of sucrose drastically reduced these values to an average of 64 eggs, 60 larvae, and 45 adults. These values were significantly different from those of the control group (p < 0.0001 at all stages). The 5% sucrose group produced an average of 46 eggs, 64 larvae, and 36 adults. These values were also significantly lower than those of the control group (p < 0.001). In contrast, 15% of the sucrose group had fecundity similar to that of the control group, with averages of 109.0 eggs, 101 larvae, and 66 adults (p > 0.05). However, the 20% concentration caused a significant reduction: 104 eggs, 80 larvae, and 49 adults (p < 0.001).
Adding sucralose to a medium containing 10% sucrose negatively impacted prolificacy in a dose-dependent manner (Figure 2). The control group had an average of 161 eggs, 139 larvae, and 132 adults. However, 0.25% sucralose concentration resulted in a significant reduction, with an average of 51 eggs, 37 larvae, and 31 adults (p < 0.001). At 0.5%, the values were 46 eggs, 49 larvae, and 51 adults (p < 0.001). Concentrations of 1% and 2% further aggravated the effects. There were 70 eggs, 72 larvae, and 70 adults at 1%, and 34 eggs, 37 larvae, and 54 adults at 2% (all p-values < 0.0001).

2.2. Longevity

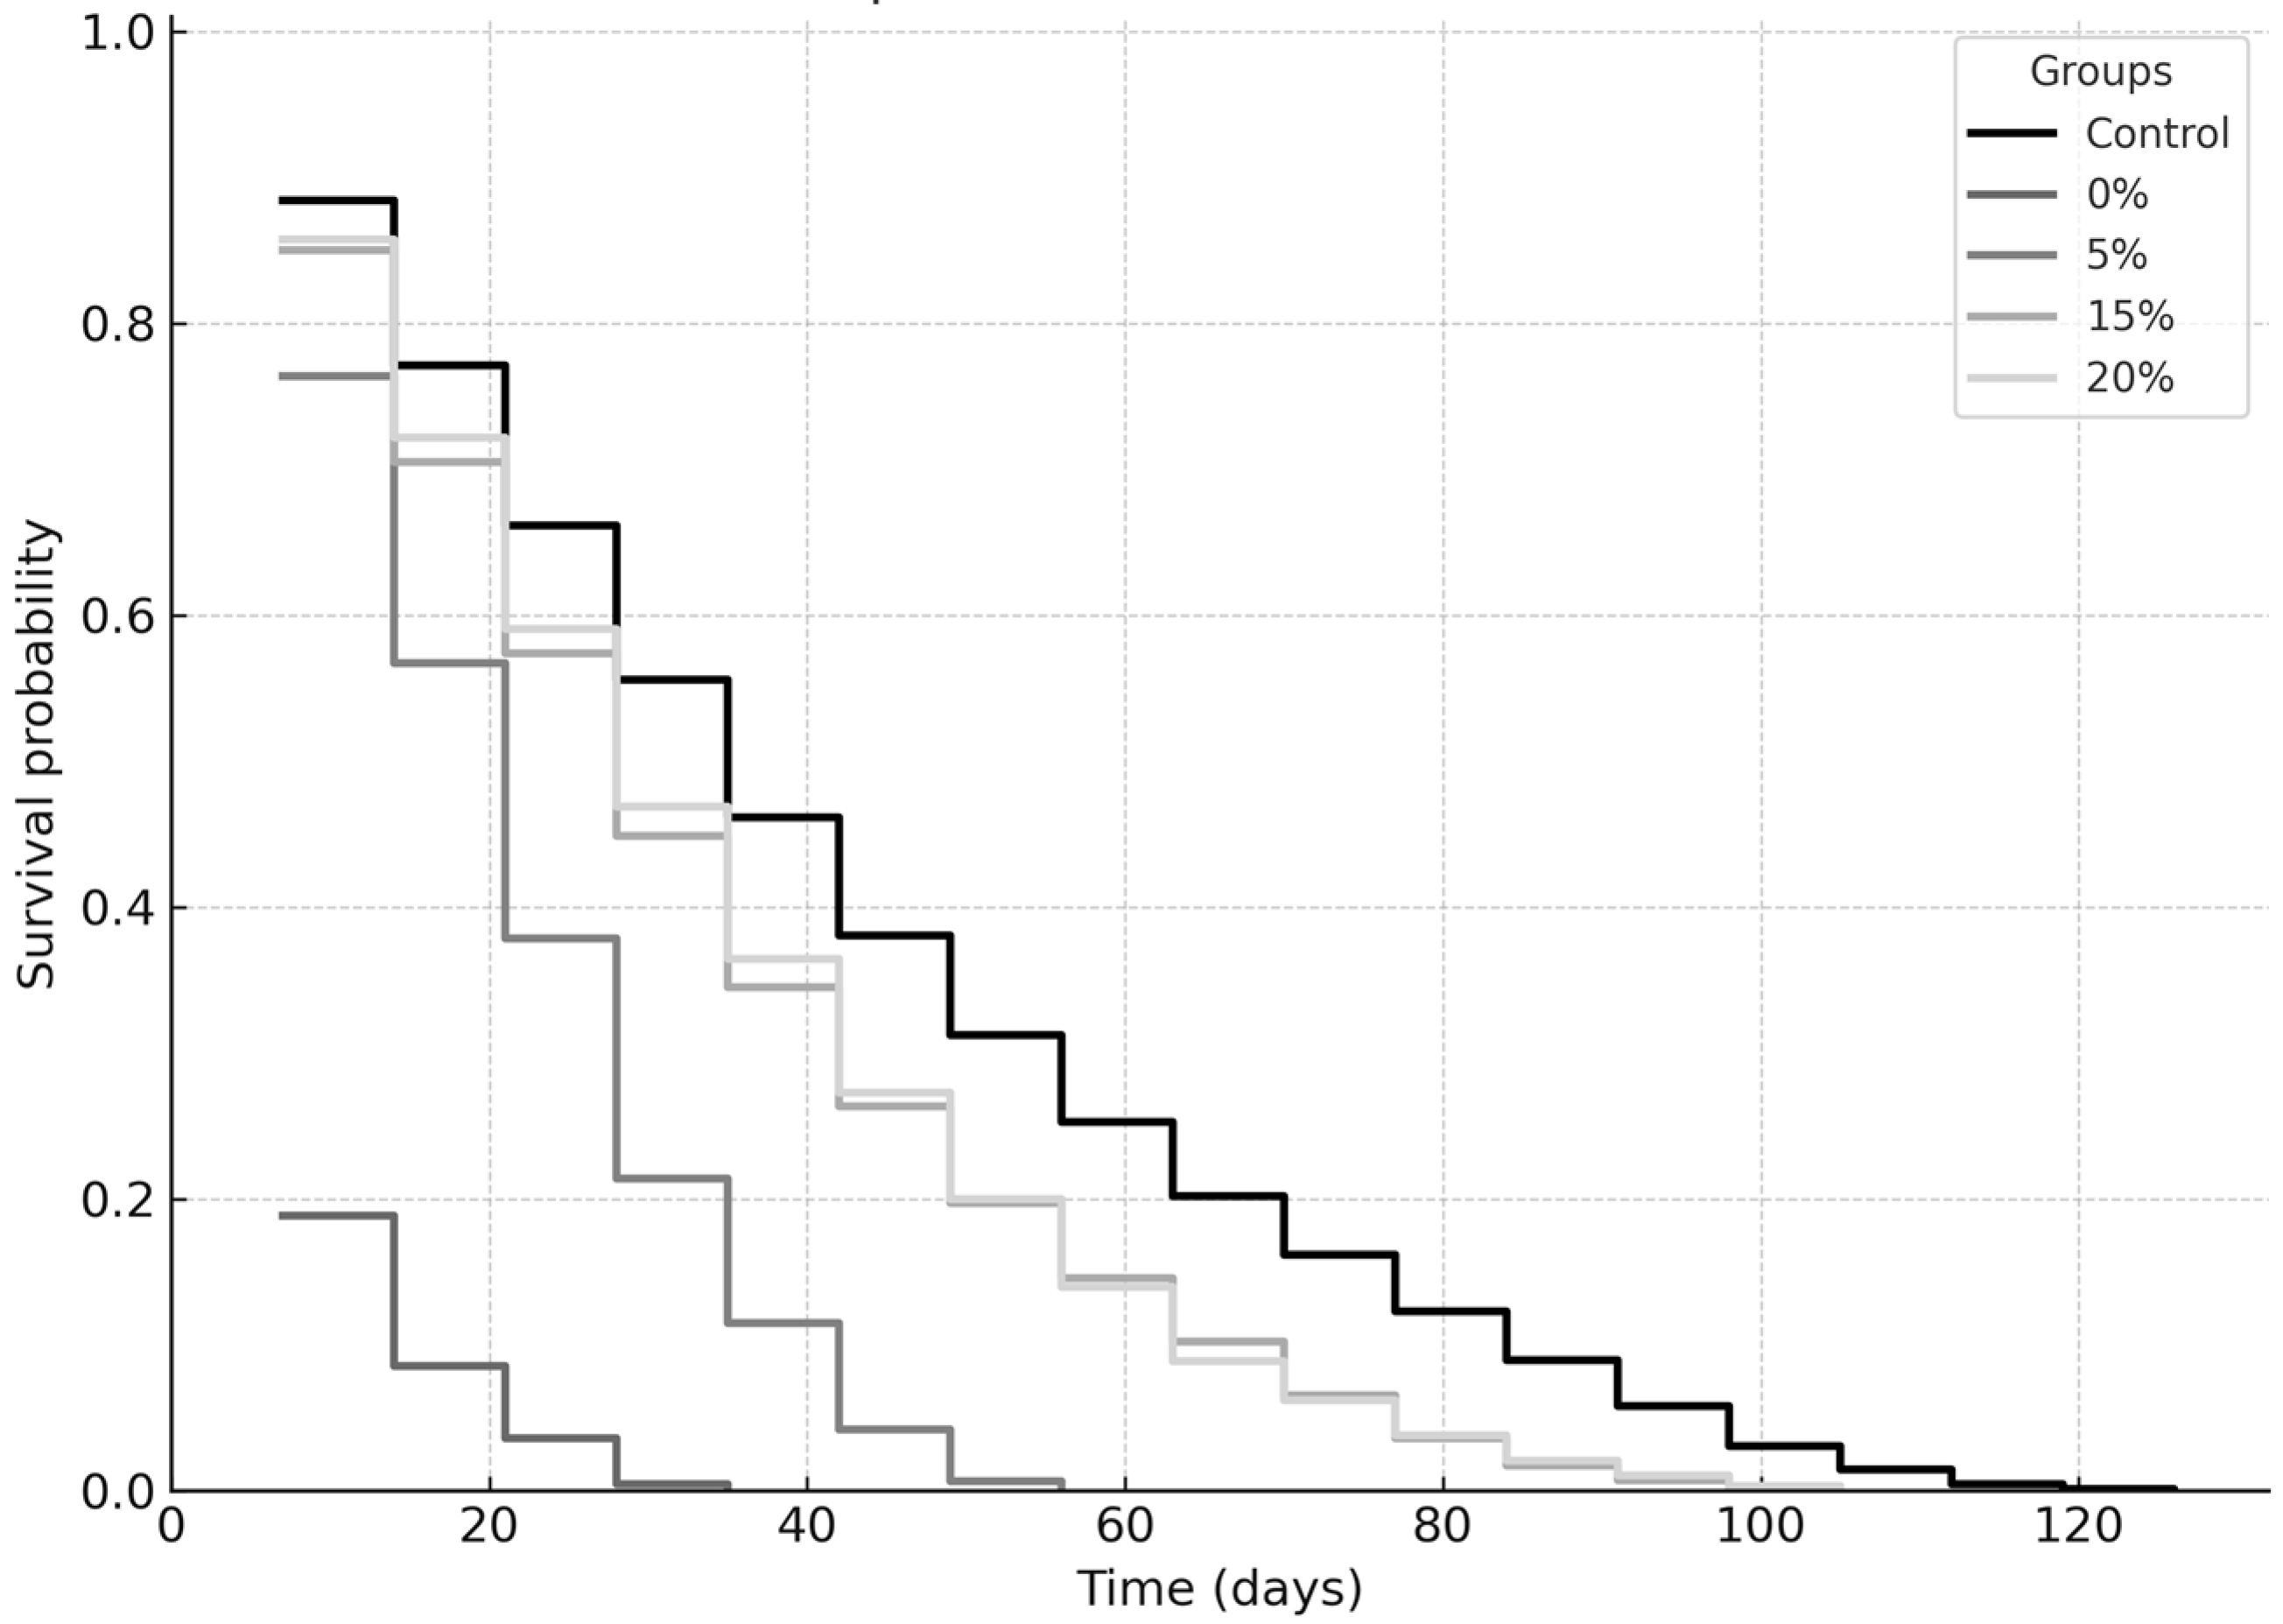
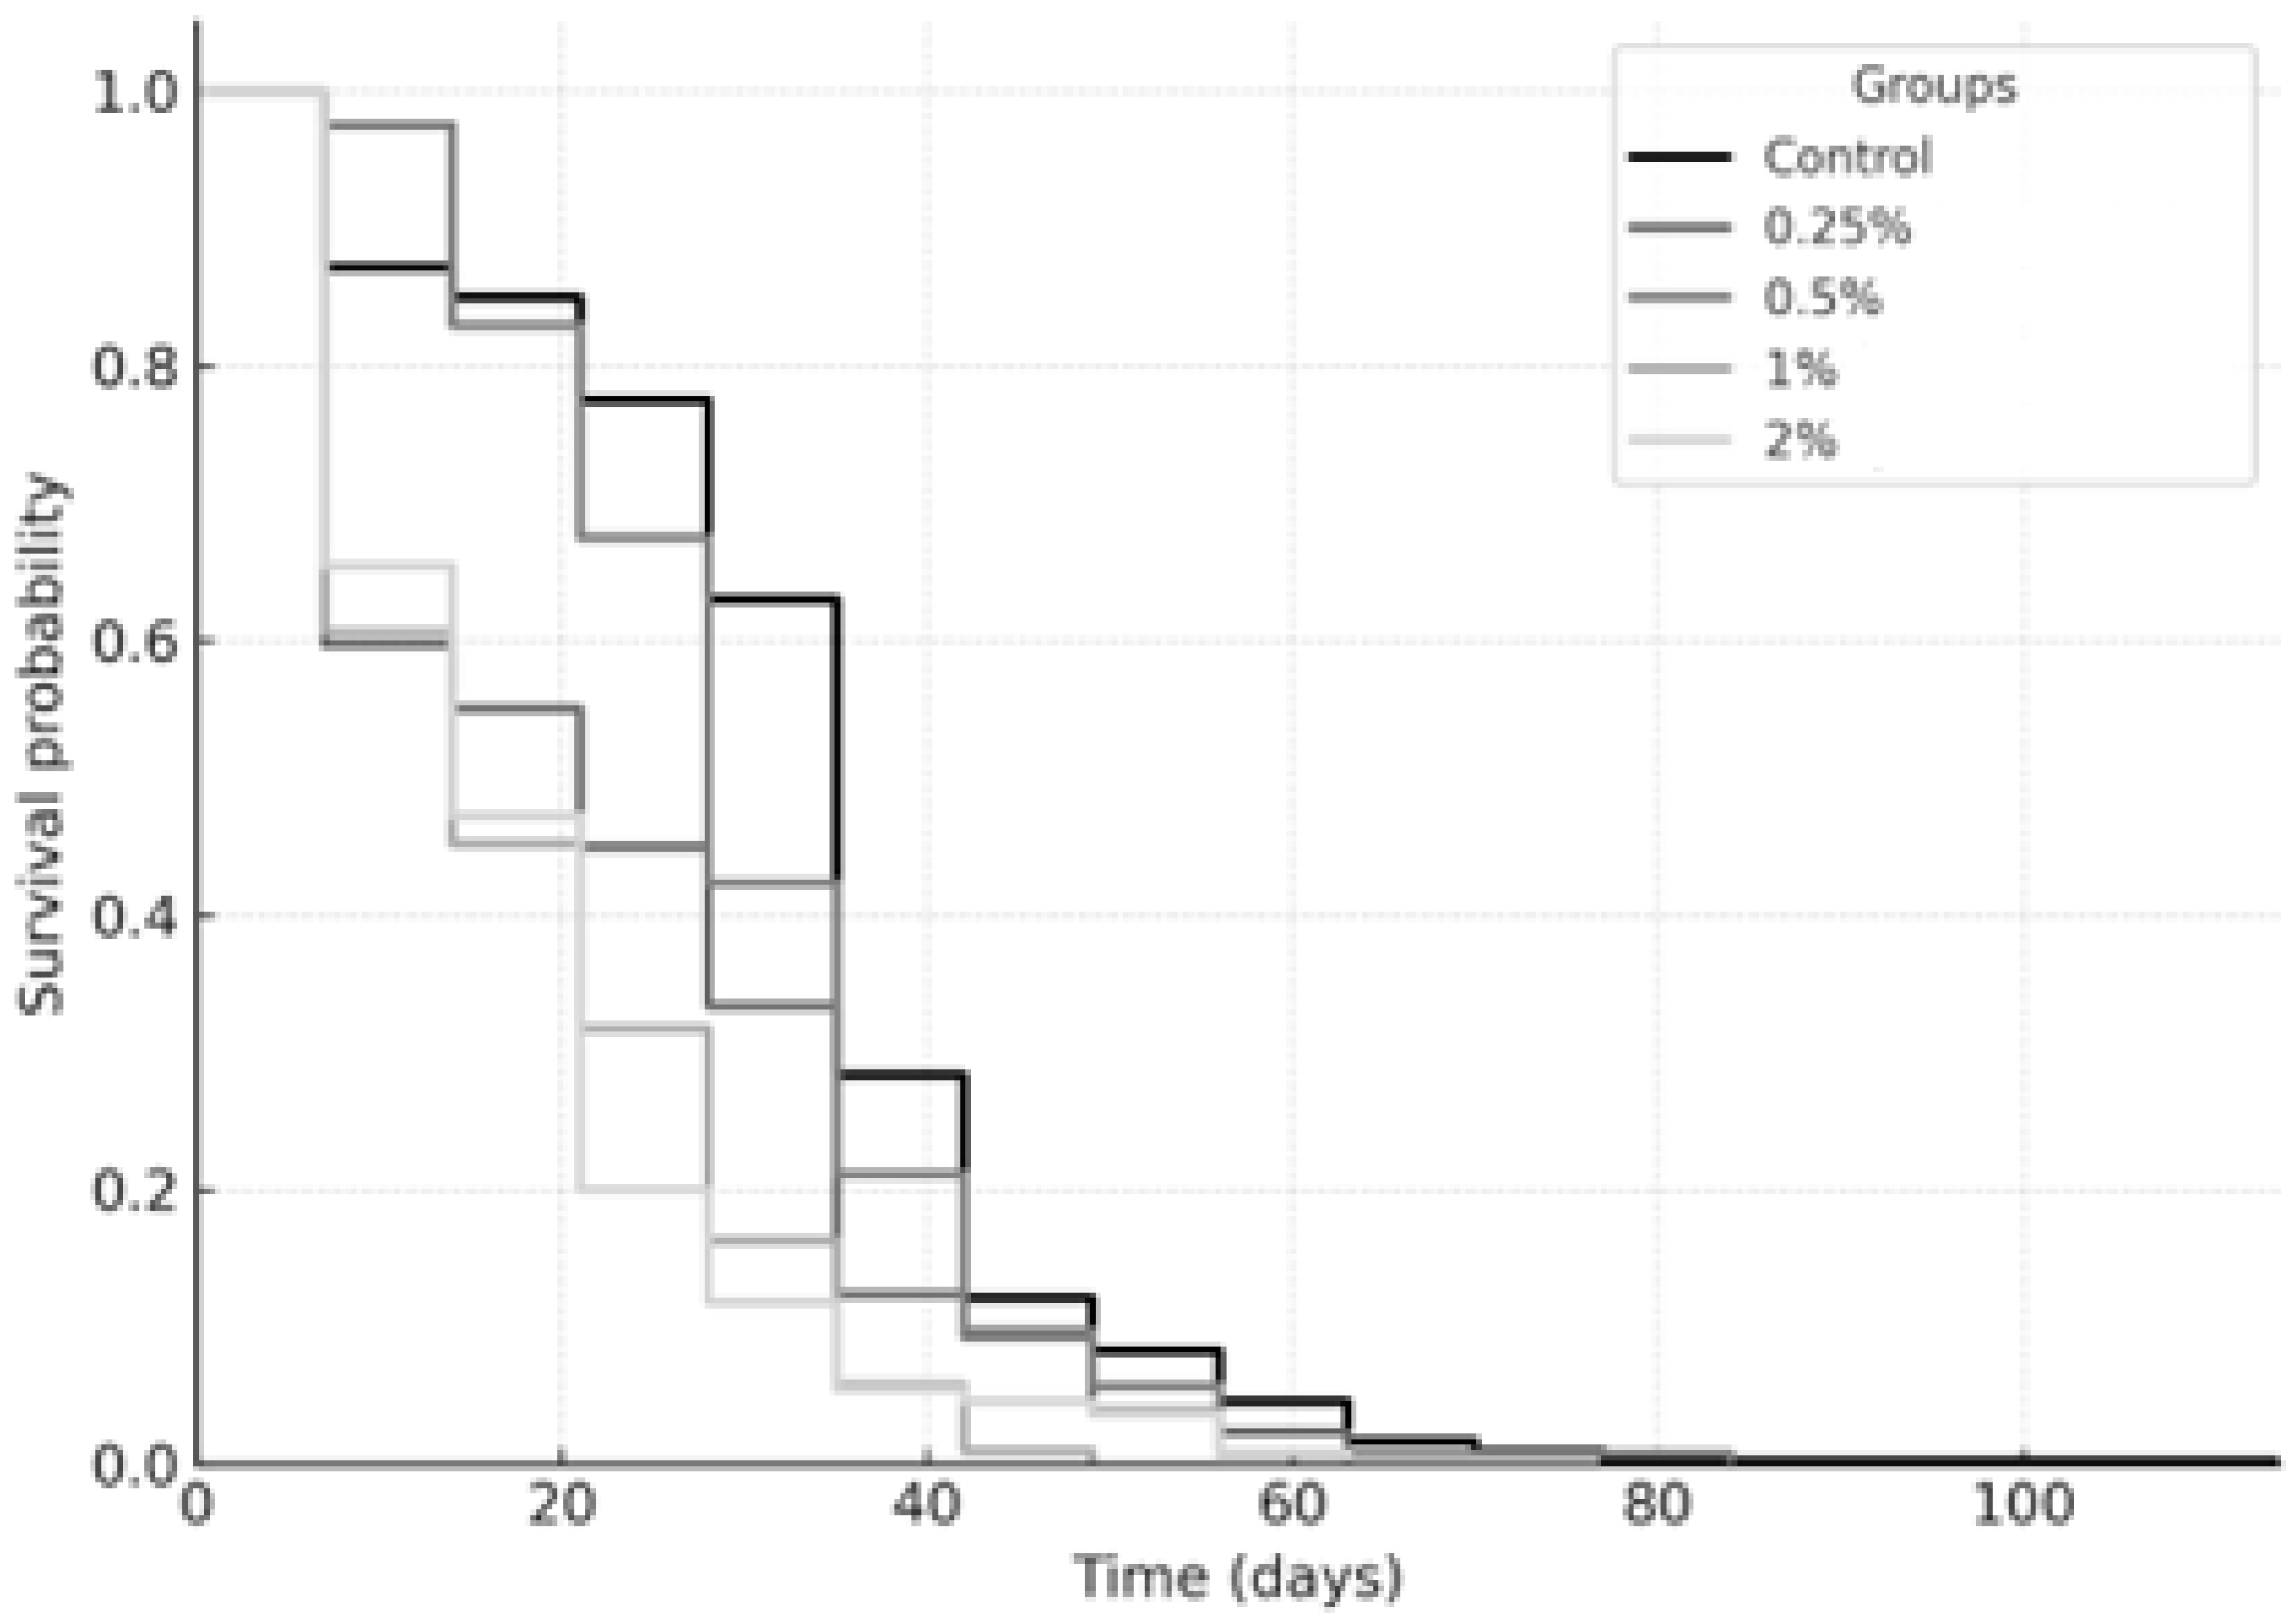
Figure 6 and Figure 7 summarize the longevity average (Kaplan–Meier survival curves), results for the sugar and sucralose–sugar treatments and their respective concentrations and control. A total of 15 tubes for each concentration, with three independent replicates.
The Kaplan–Meier survival analysis revealed that sucralose and sugar supplementation both significantly reduced the survival of Drosophila melanogaster. Sucralose (Figure 4) was tested at the following concentrations: control, 0.25%, 0.5%, 1%, and 2%. The survival curves showed a clear, concentration-dependent decline in longevity. Flies exposed to 0.25% sucralose (log-rank, p = 0.041), 0.5% (p = 0.008), 1% (p < 0.001), or 2% (p < 0.0001) exhibited progressively reduced survival probabilities compared with control. The strongest effect was observed at 2%, indicating that higher concentrations of the non-caloric sweetener markedly accelerated mortality. For sugar (control, 0%, 5%, 15%, 20%), as shown in Figure 3, a similar dose–response relationship was observed. All tested concentrations significantly shortened lifespan compared to the control group: 0% (p = 0.037), 5% (p = 0.012), 15% (p < 0.001), and 20% (p < 0.0001). The most pronounced reduction occurred at 20% sugar, confirming the deleterious effect of high-calorie sweetener concentrations. Taken together, these results demonstrate that both caloric (sugar) and non-caloric (sucralose) sweeteners modulate survival dynamics in fruit flies, with increasing concentrations consistently associated with reduced longevity.

2.3. Negative Geotaxis Test

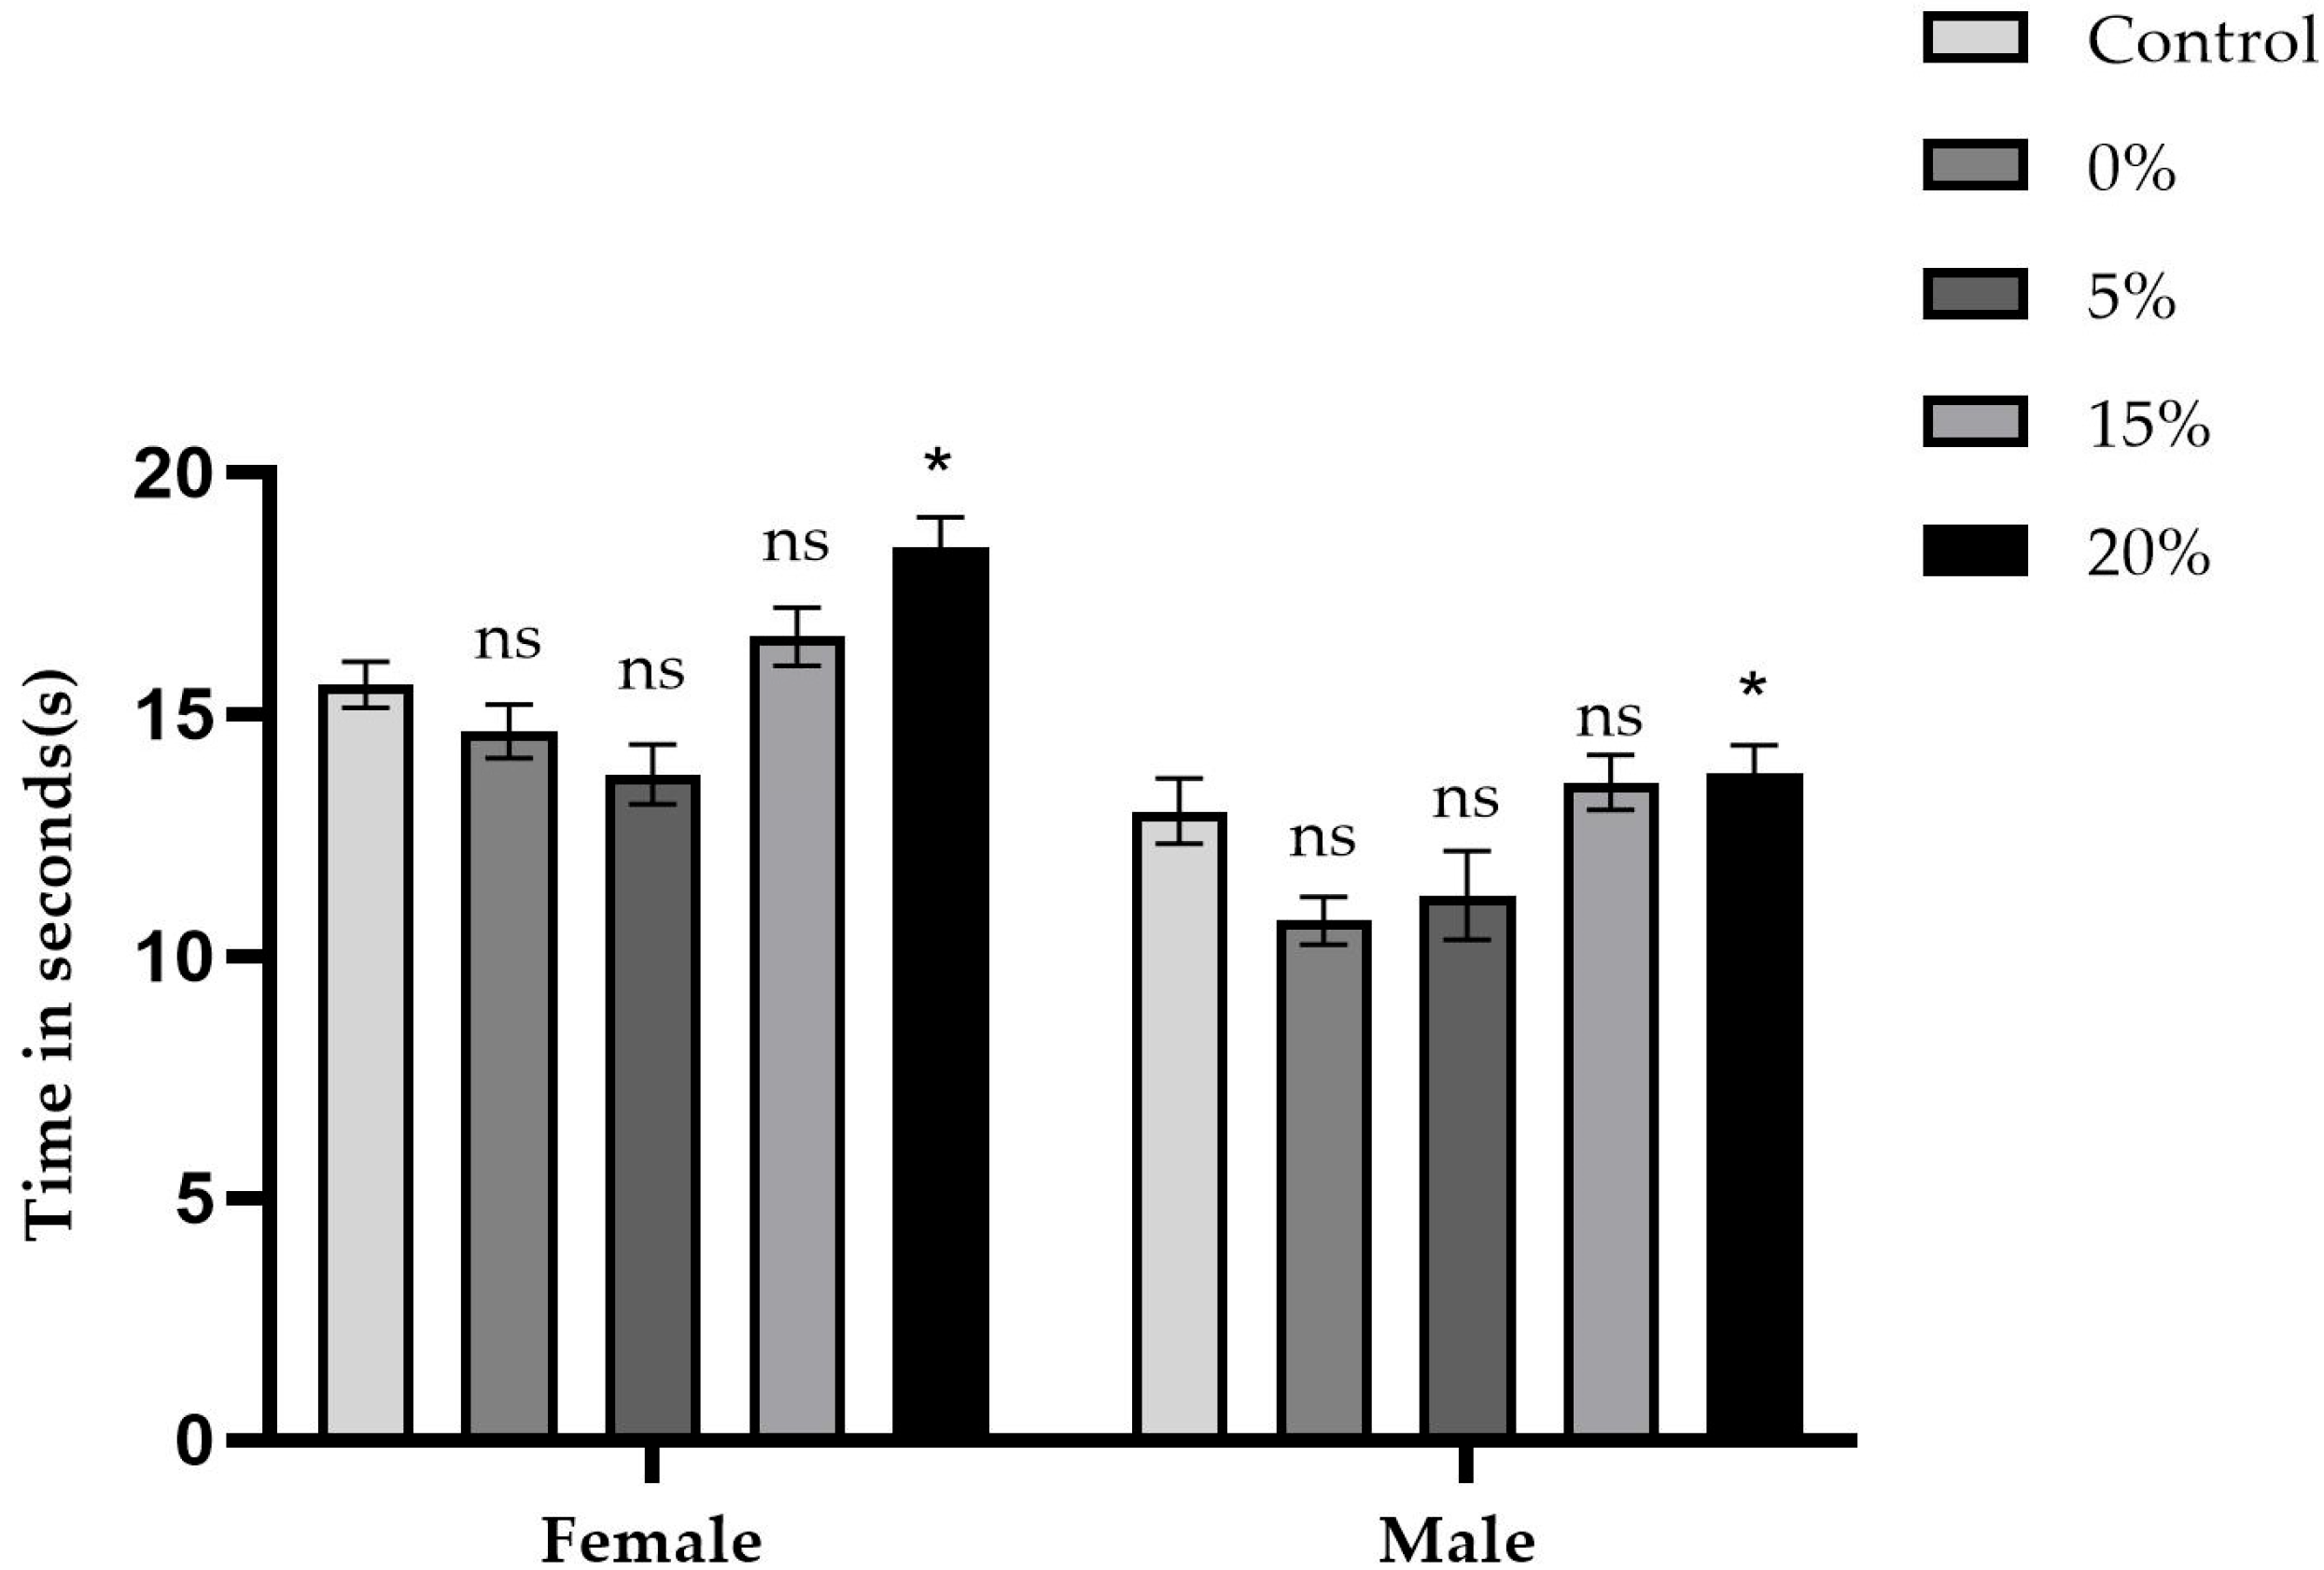
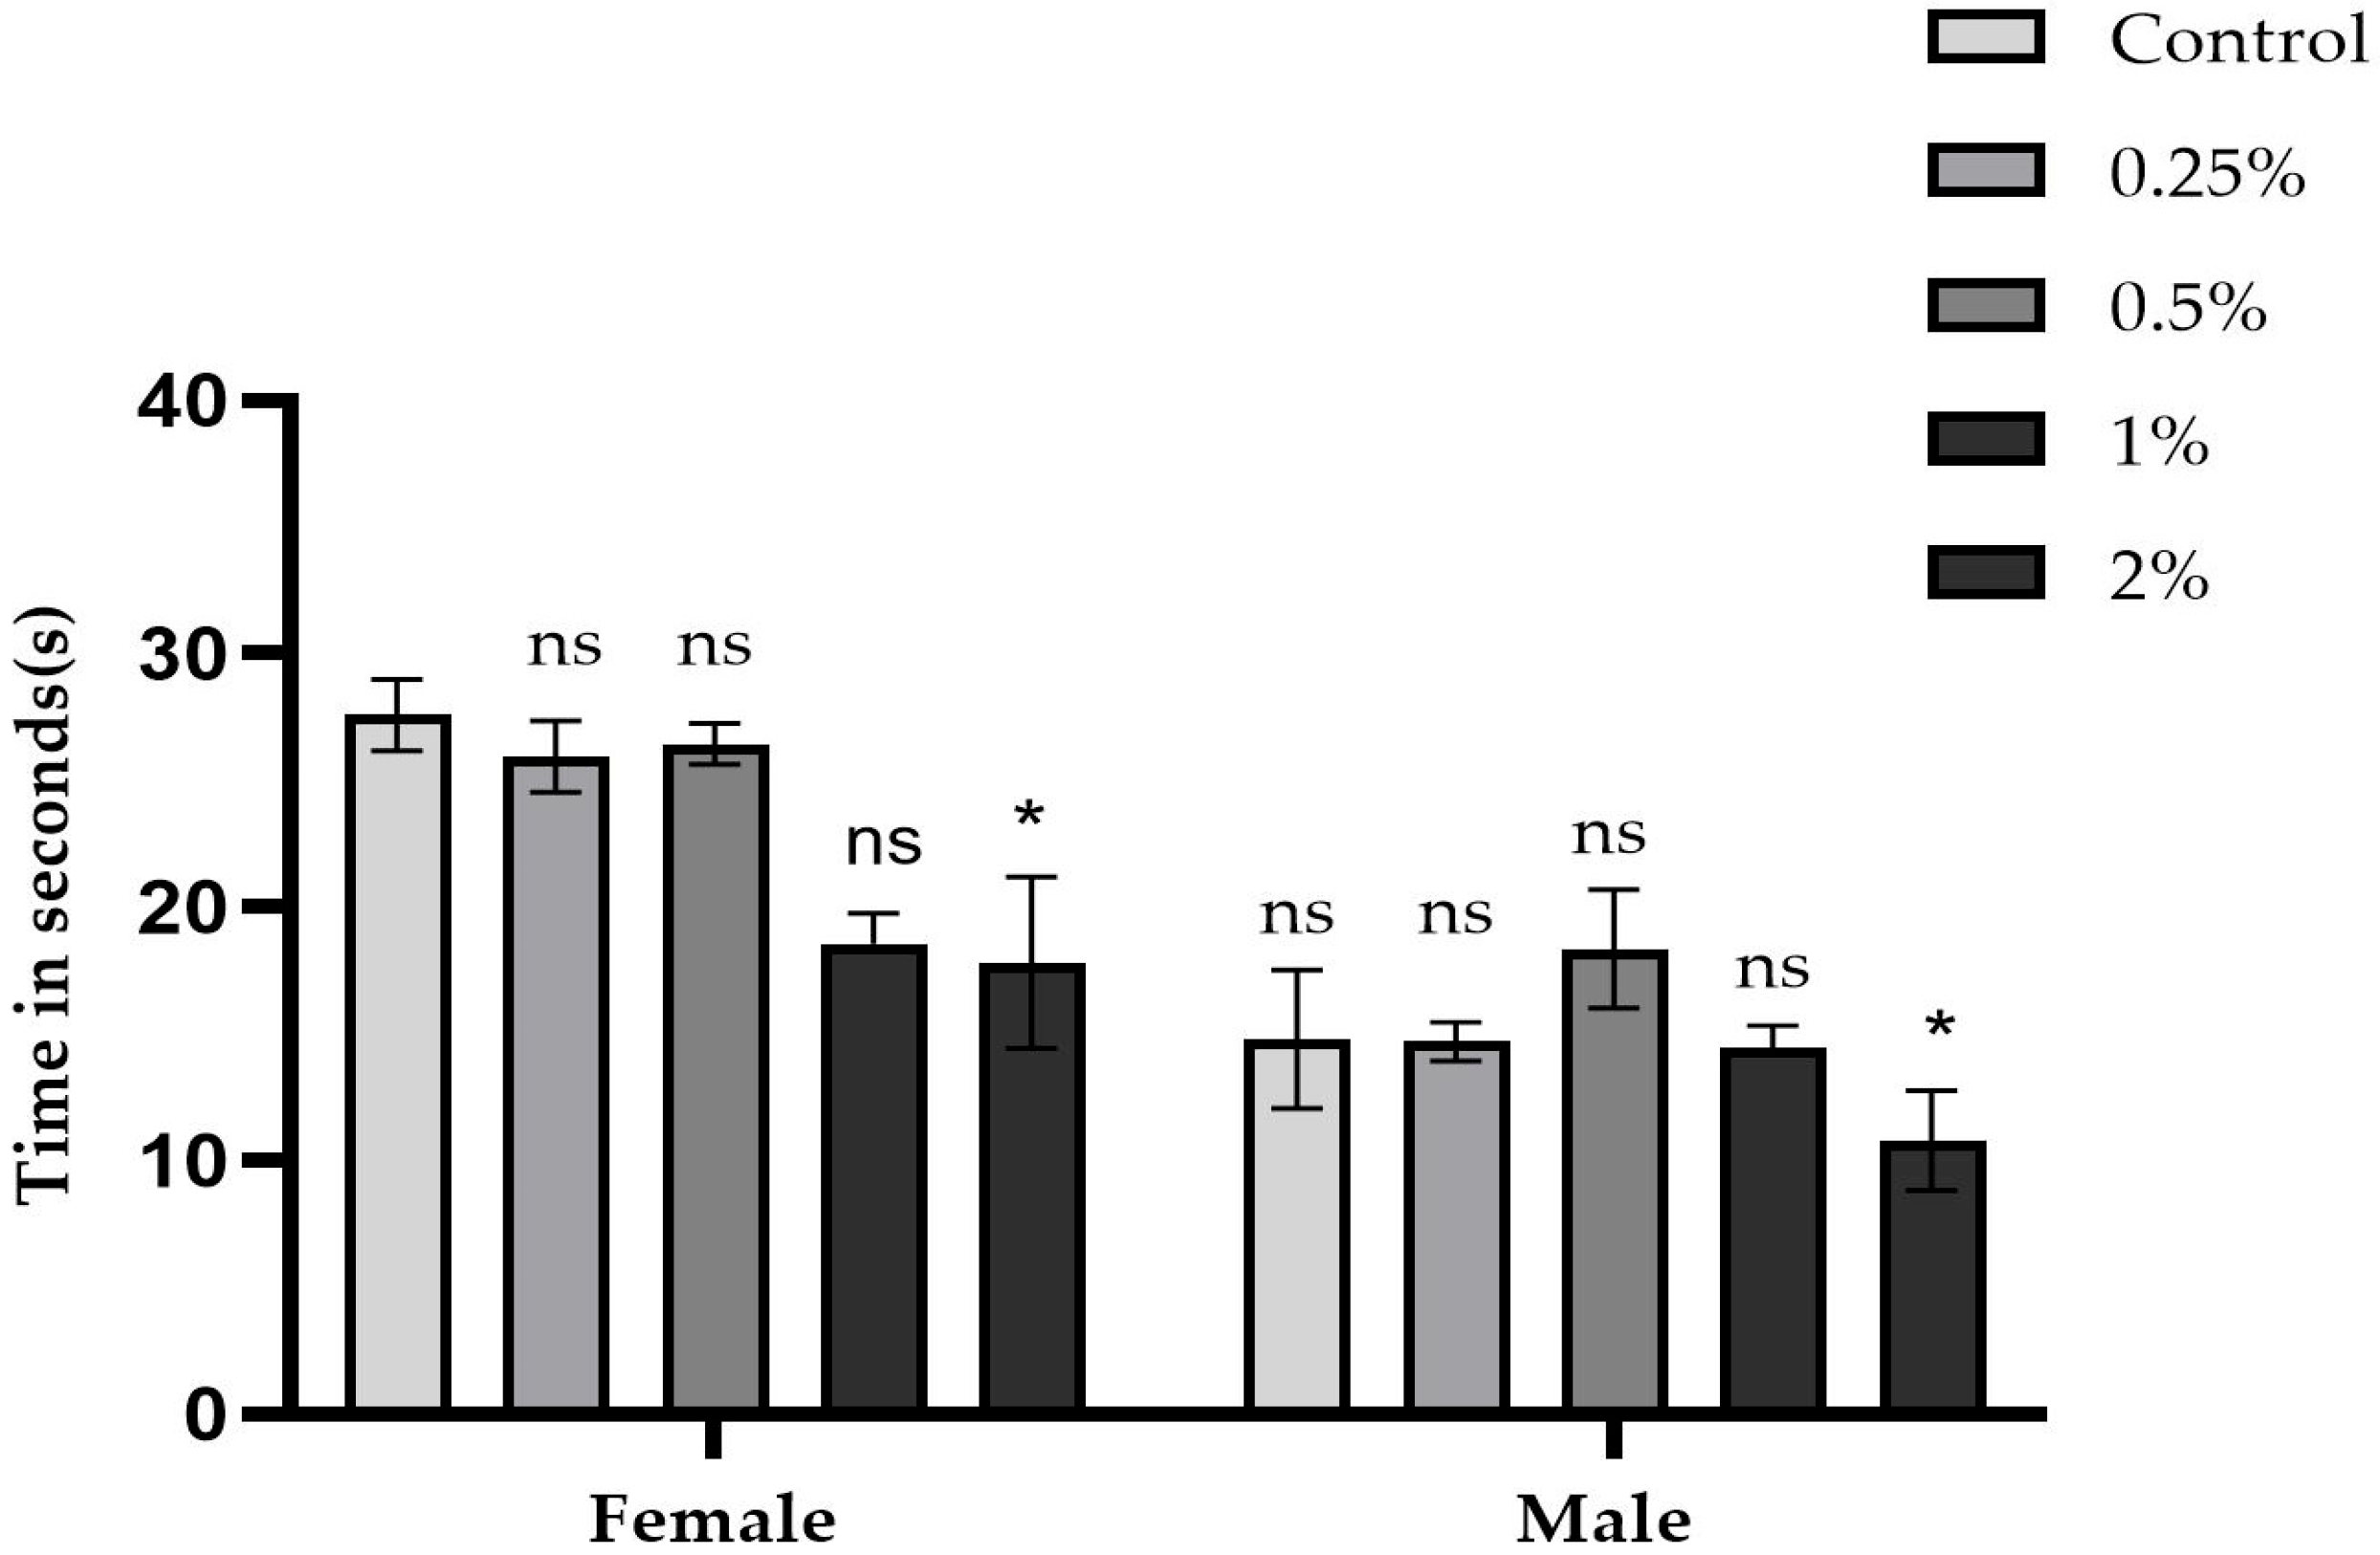
Figure 8 and Figure 9 summarize the average time, in seconds, that five male and five female flies took to climb tubes marked at 8 cm, as well as the respective concentrations of the sugar, sucralose–sugar, and control treatments. A total of 15 tubes were used for each concentration, with three independent replicates.
Vertical locomotor performance (Figure 8), as measured by the negative geotaxis test, was significantly impacted by the concentrations of both sucrose and sucralose. The sucrose control group had average climbing times of 12.9 s for males and 15.6 s for females. Removing sucrose entirely (0%) decreased the times to 10.7 s (males) and 14.6 s (females), p < 0.0001. At 5%, the times were similar to those of the control group (11.7 and 13.7 s, respectively; p > 0.05). However, at 15% and 20% concentrations, climbing times increased significantly: 13.5 s (males) and 16.6 s, and 18.6 s (females) (p < 0.01).
For groups exposed to sucralose (Figure 9), control times were 14.7 s (males) and 27.7 s (females). The 0.25% (14.7 s for males and 25.9 s for females) and 0.5% (18.4 s for males and 26 s for females) concentrations did not statistically differ from the control (p > 0.05). At 1% and 2% concentrations, however, the times were 11.7–14.4 s (males) and 17.8–18.5 s (females), respectively. For the 1% concentration, the difference was statistically significant (p < 0.05), while for the 2% concentration the difference was also significant (p < 0.05).

2.4. Exploration Test

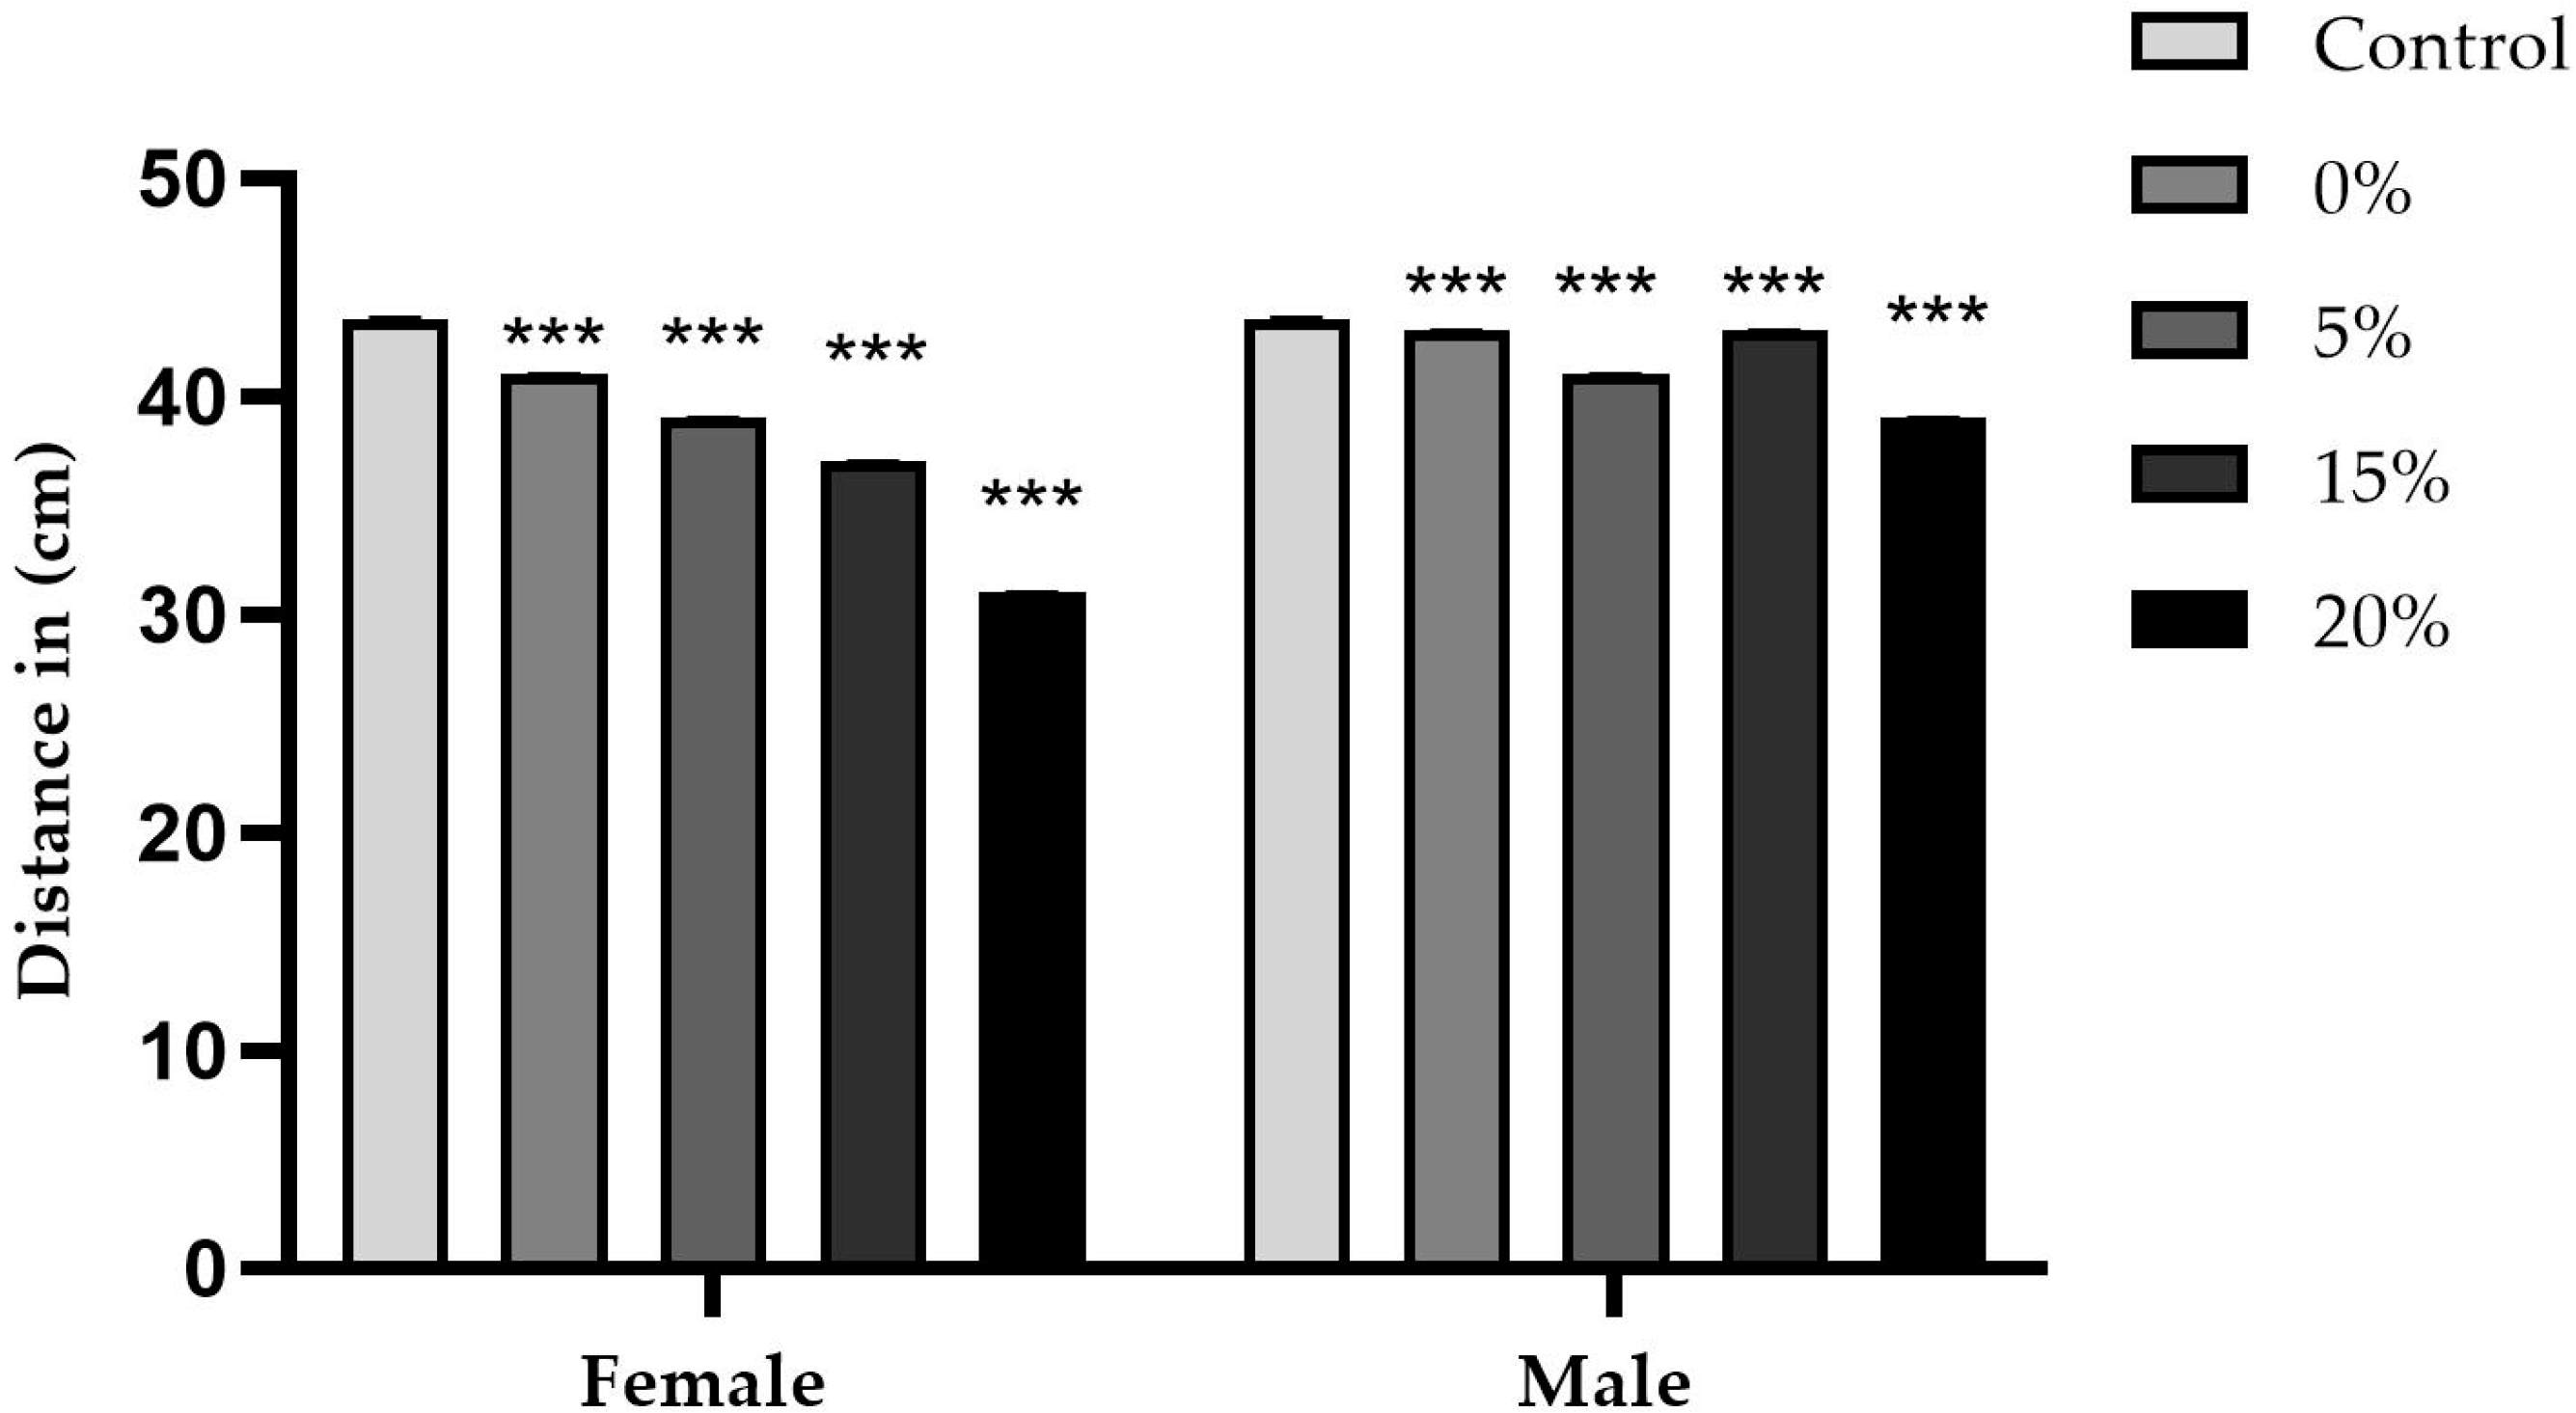
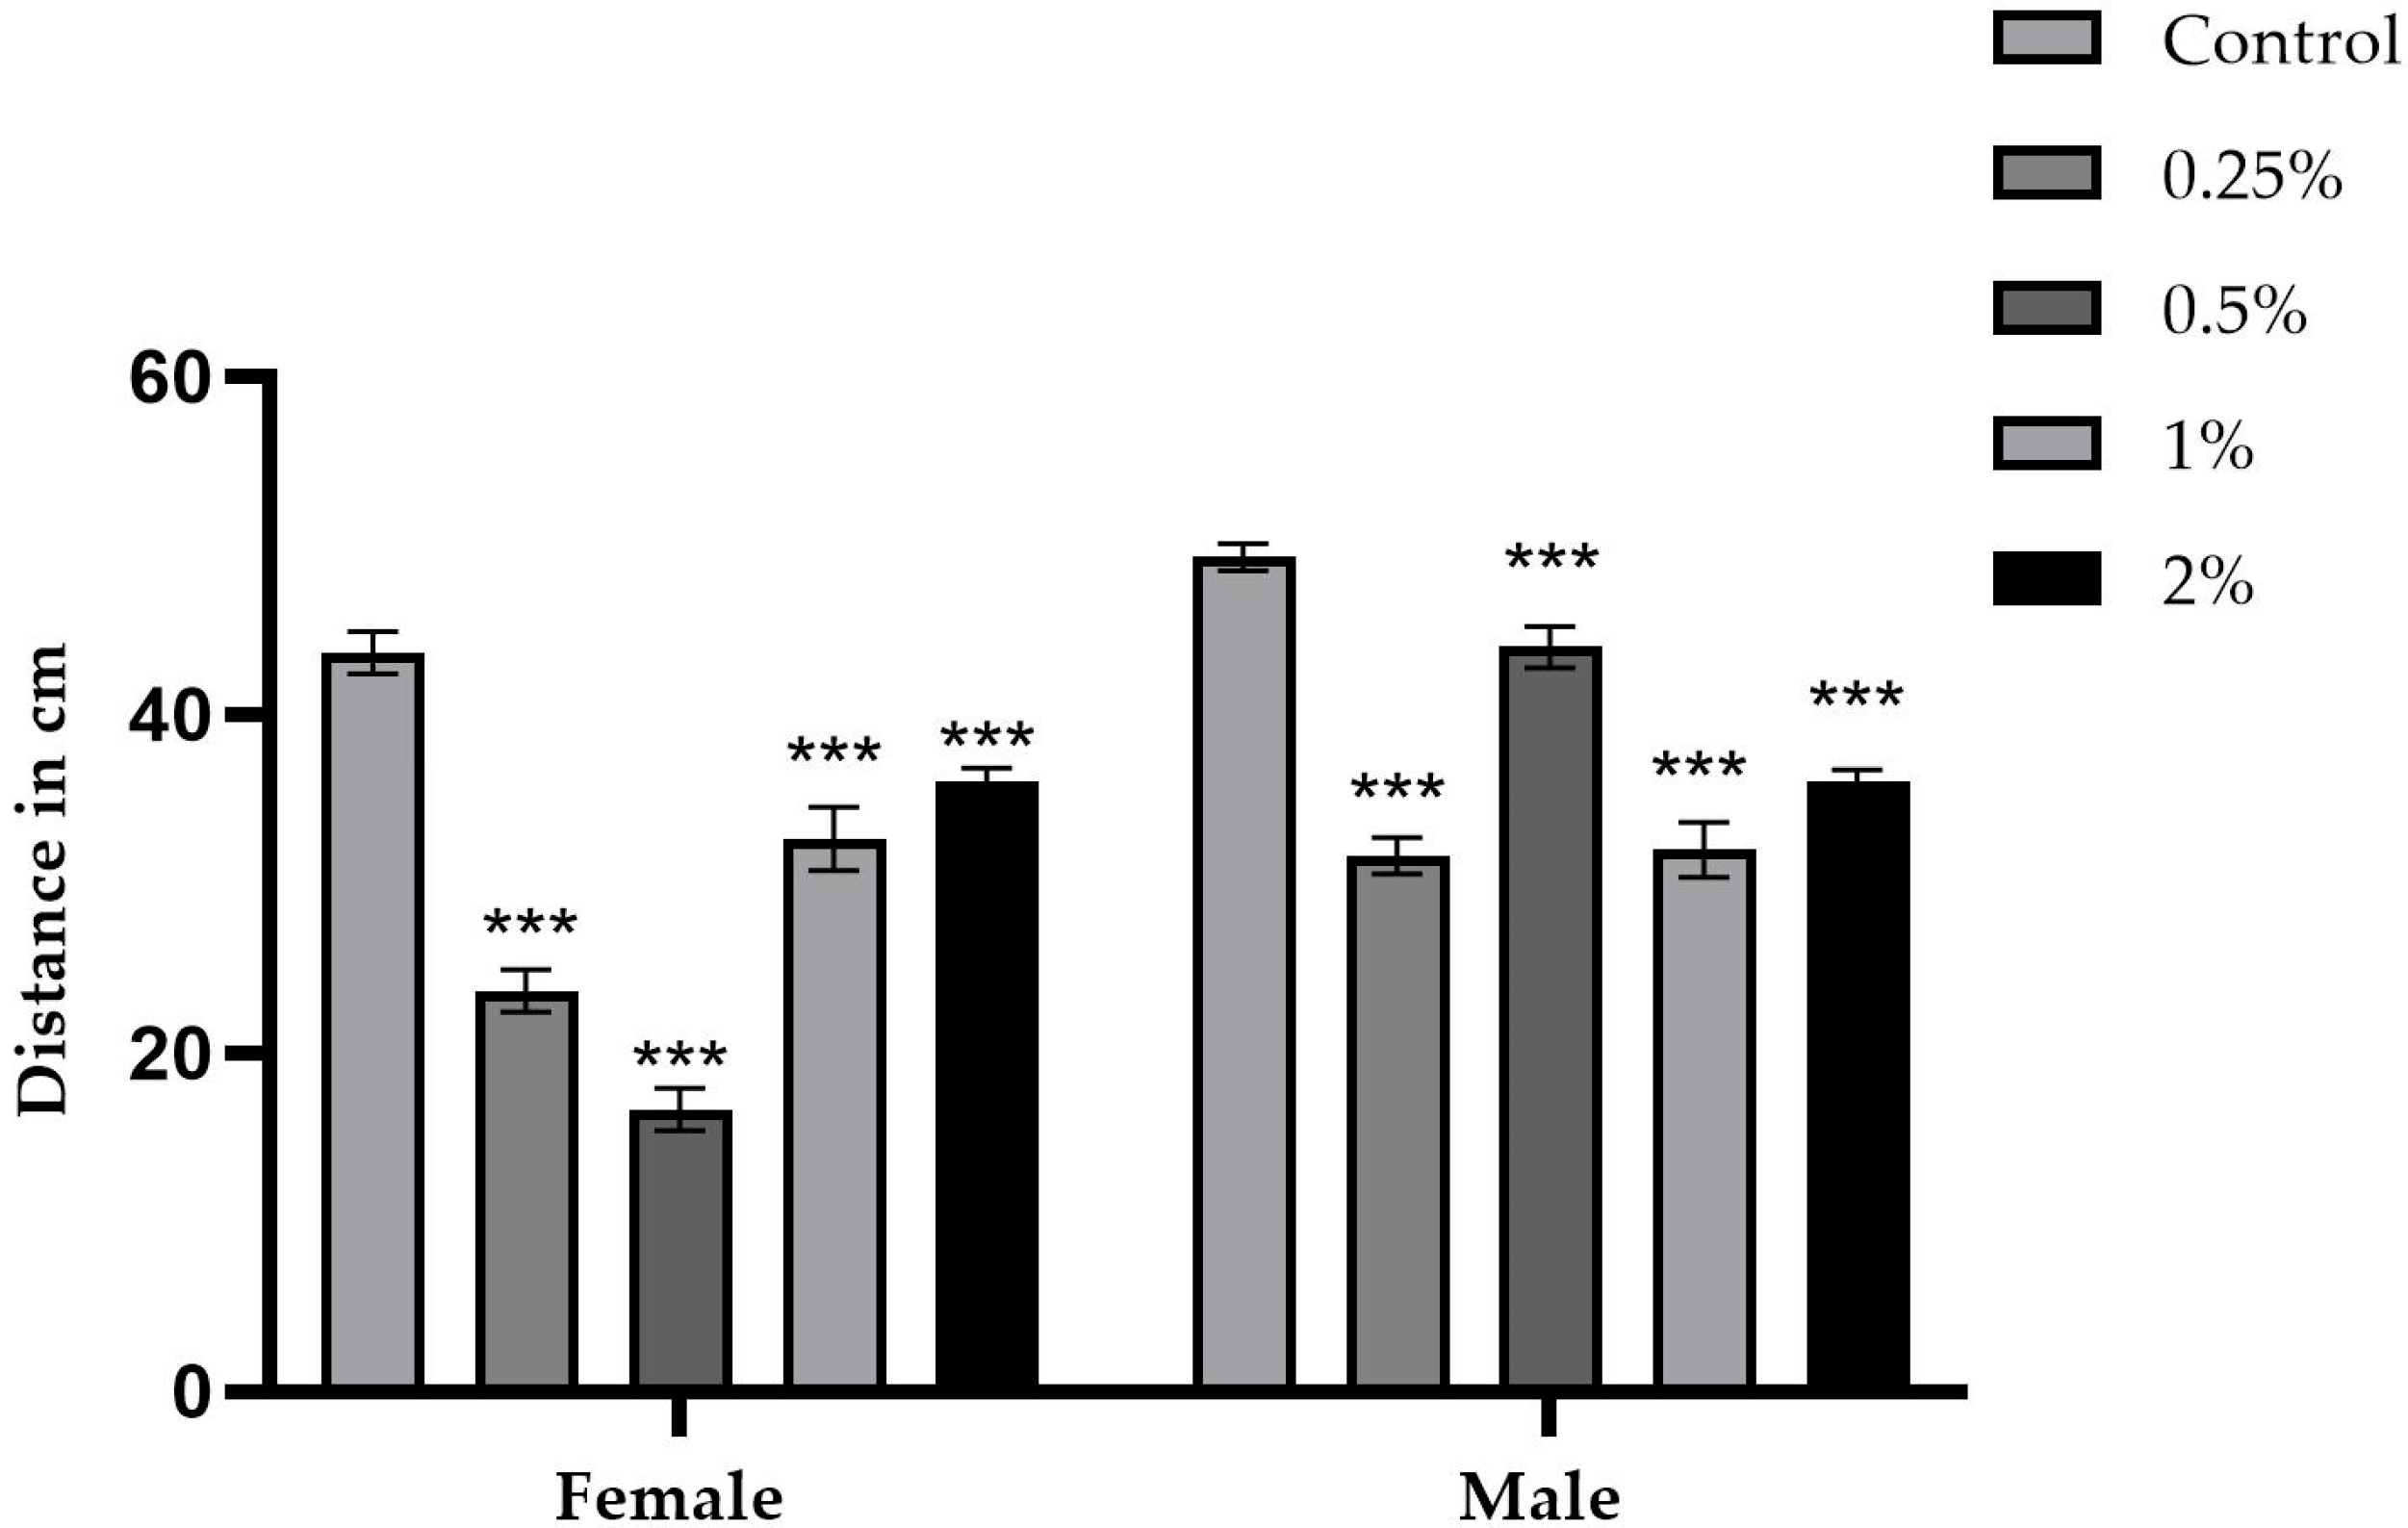
Figure 10 and Figure 11 summarize the average distance traveled by five male and five female flies per cm explored in 1 min in a Petri dish, as well as the respective concentrations of the sugar and sucralose–sugar treatments and the control. A total of 15 tubes for each concentration, with three independent replicates, were performed.
Exploratory behavior was assessed by measuring the average distance traveled in one minute, in square centimeters. In the sucrose control group (Figure 10), males and females traveled an average of 43.5 cm per min. The absence of sucrose slightly reduced these distances to 41 cm for males and 43 cm for females (p < 0.0001). At 5% concentration, performance remained the same; however, concentrations of 15% and 20% resulted in significant reductions in females: 37.5 and 31 cm, respectively (p < 0.005). Meanwhile, males remained between 43 and 39 cm, respectively.
In the sucralose-treated groups (Figure 11), controls covered an average distance of 49 cm for males and 43 cm for females. At the 0.25% concentration, males covered an average distance of 31 cm and females 23 cm. At the 0.5% concentration, males covered an average distance of 44 cm and females 16 cm, compared to the control group. The 0.25% and 0.5% concentrations showed statistically significant differences (p < 0.001). In the 1% and 2% concentrations, values decreased to 32 cm, compared to the control group. The difference was statistically significant in all tested sucralose concentrations, with p < 0.001.

2.5. Comet Assay Results

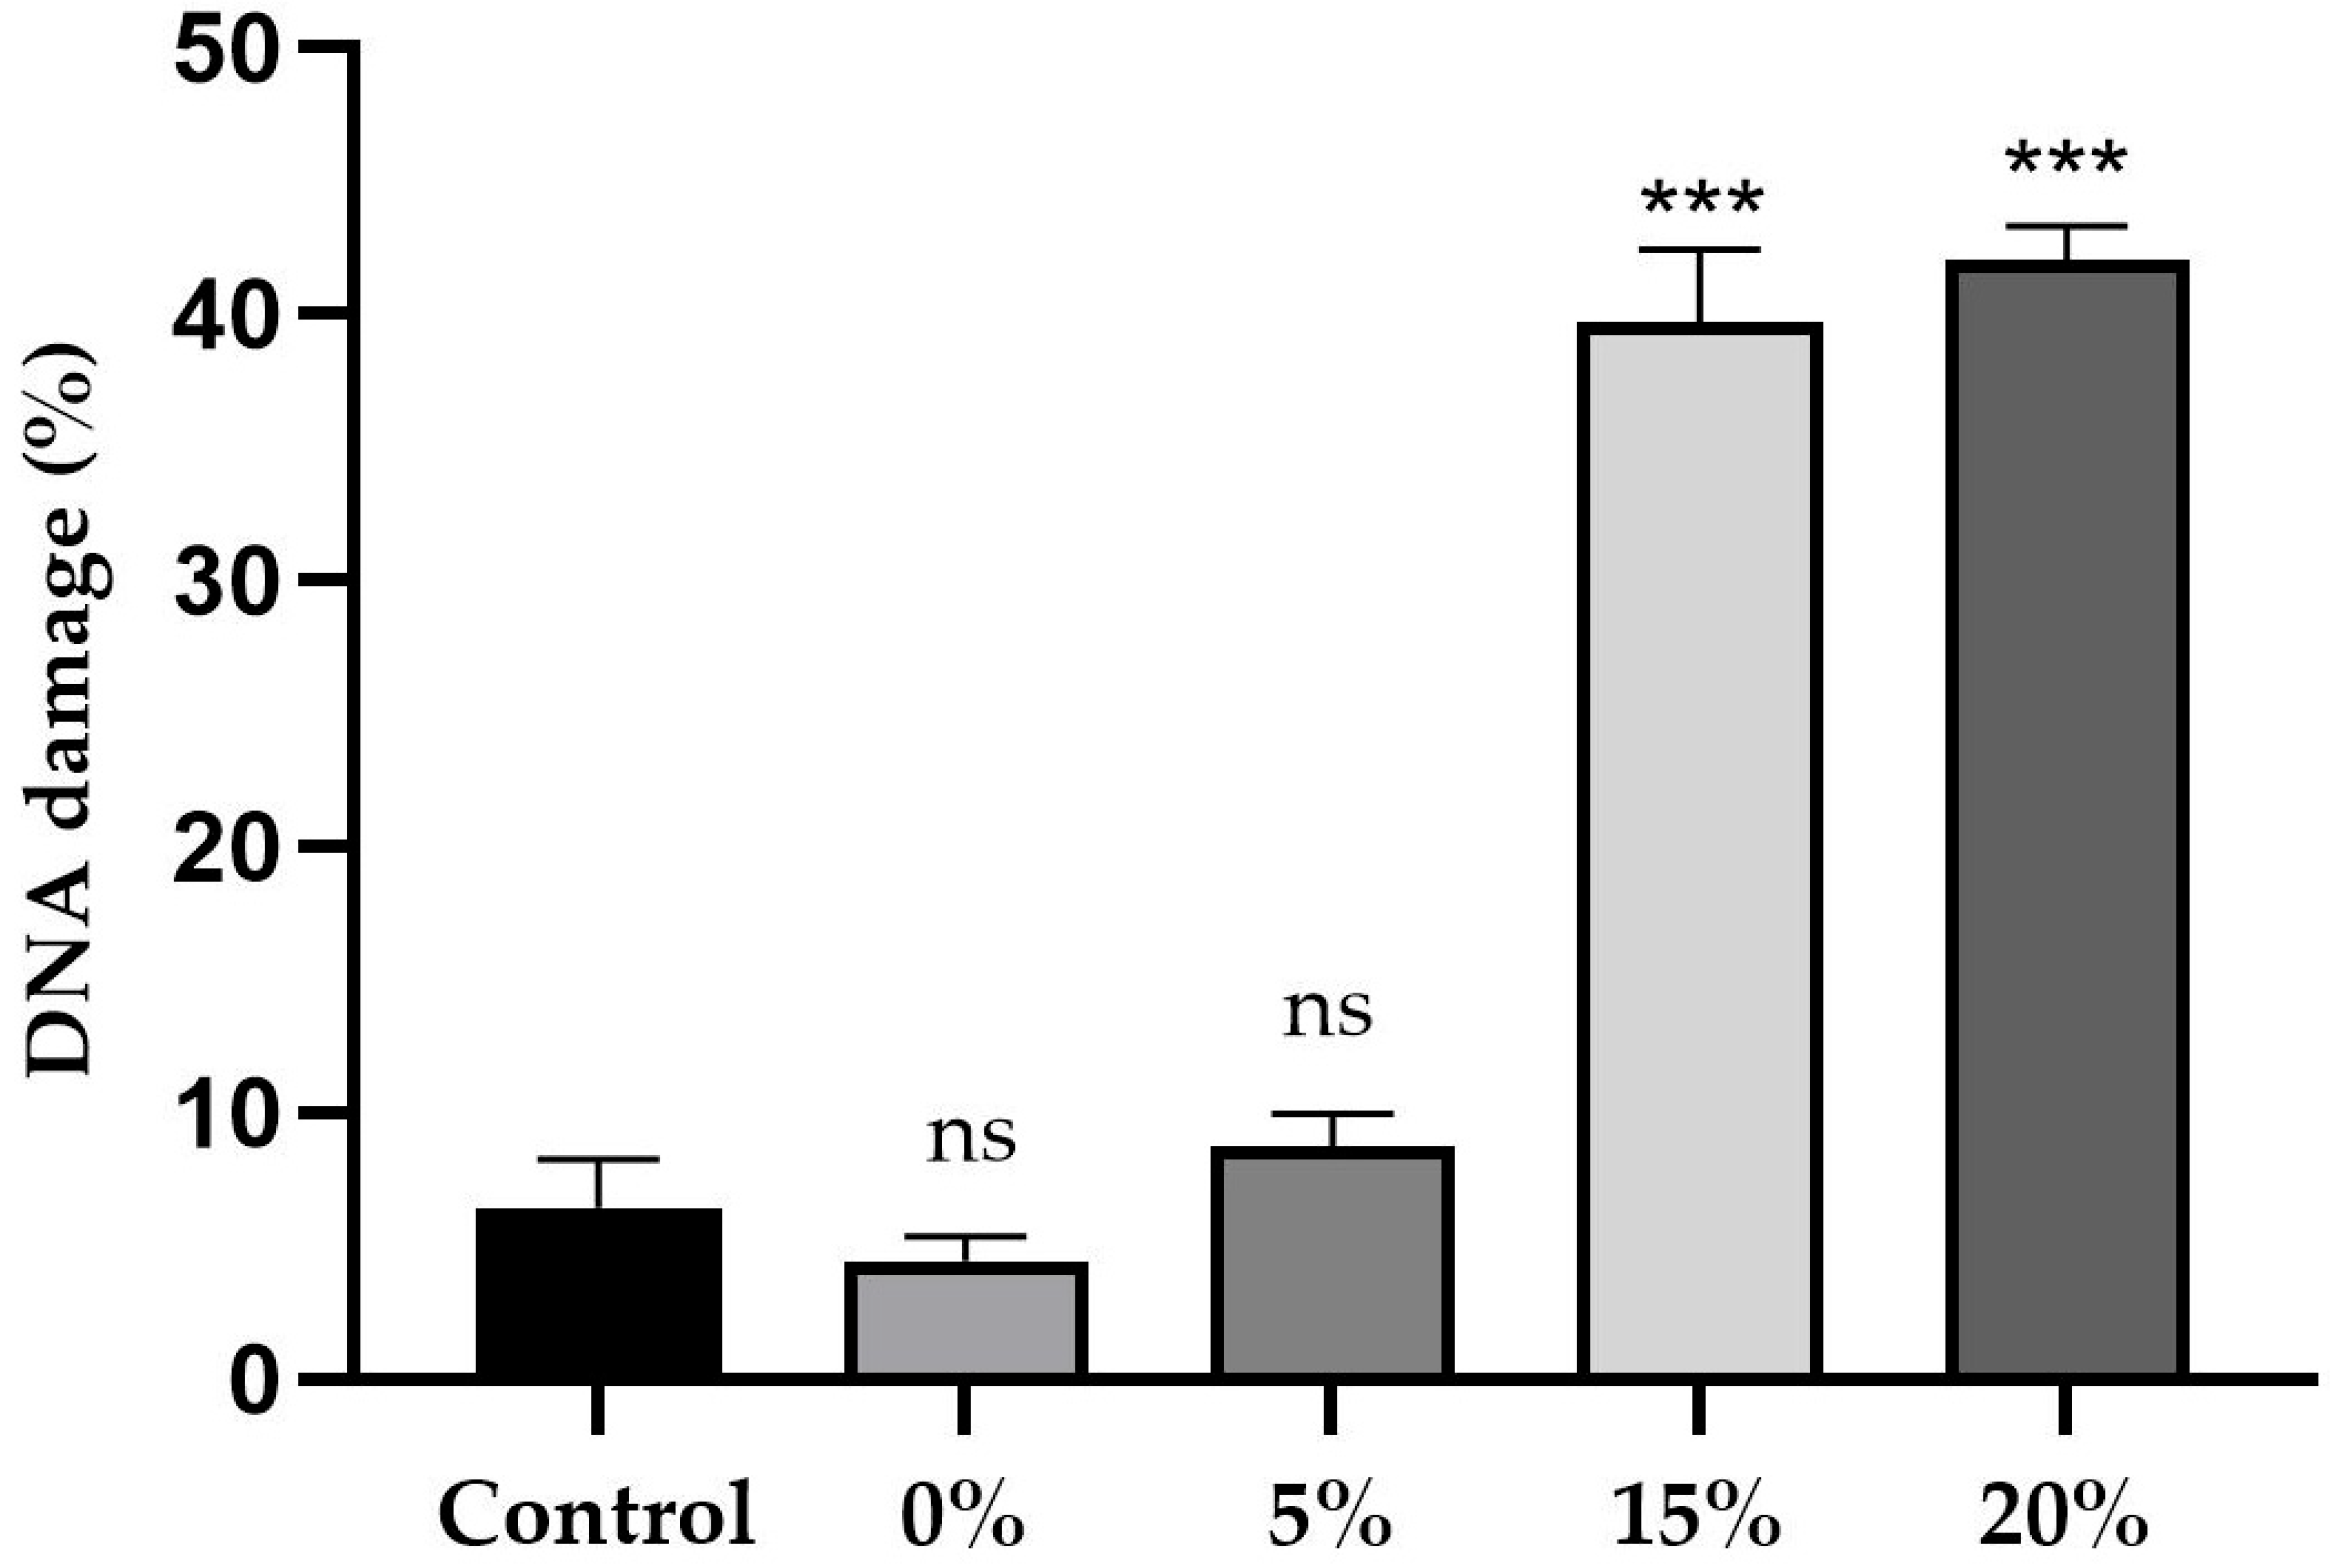
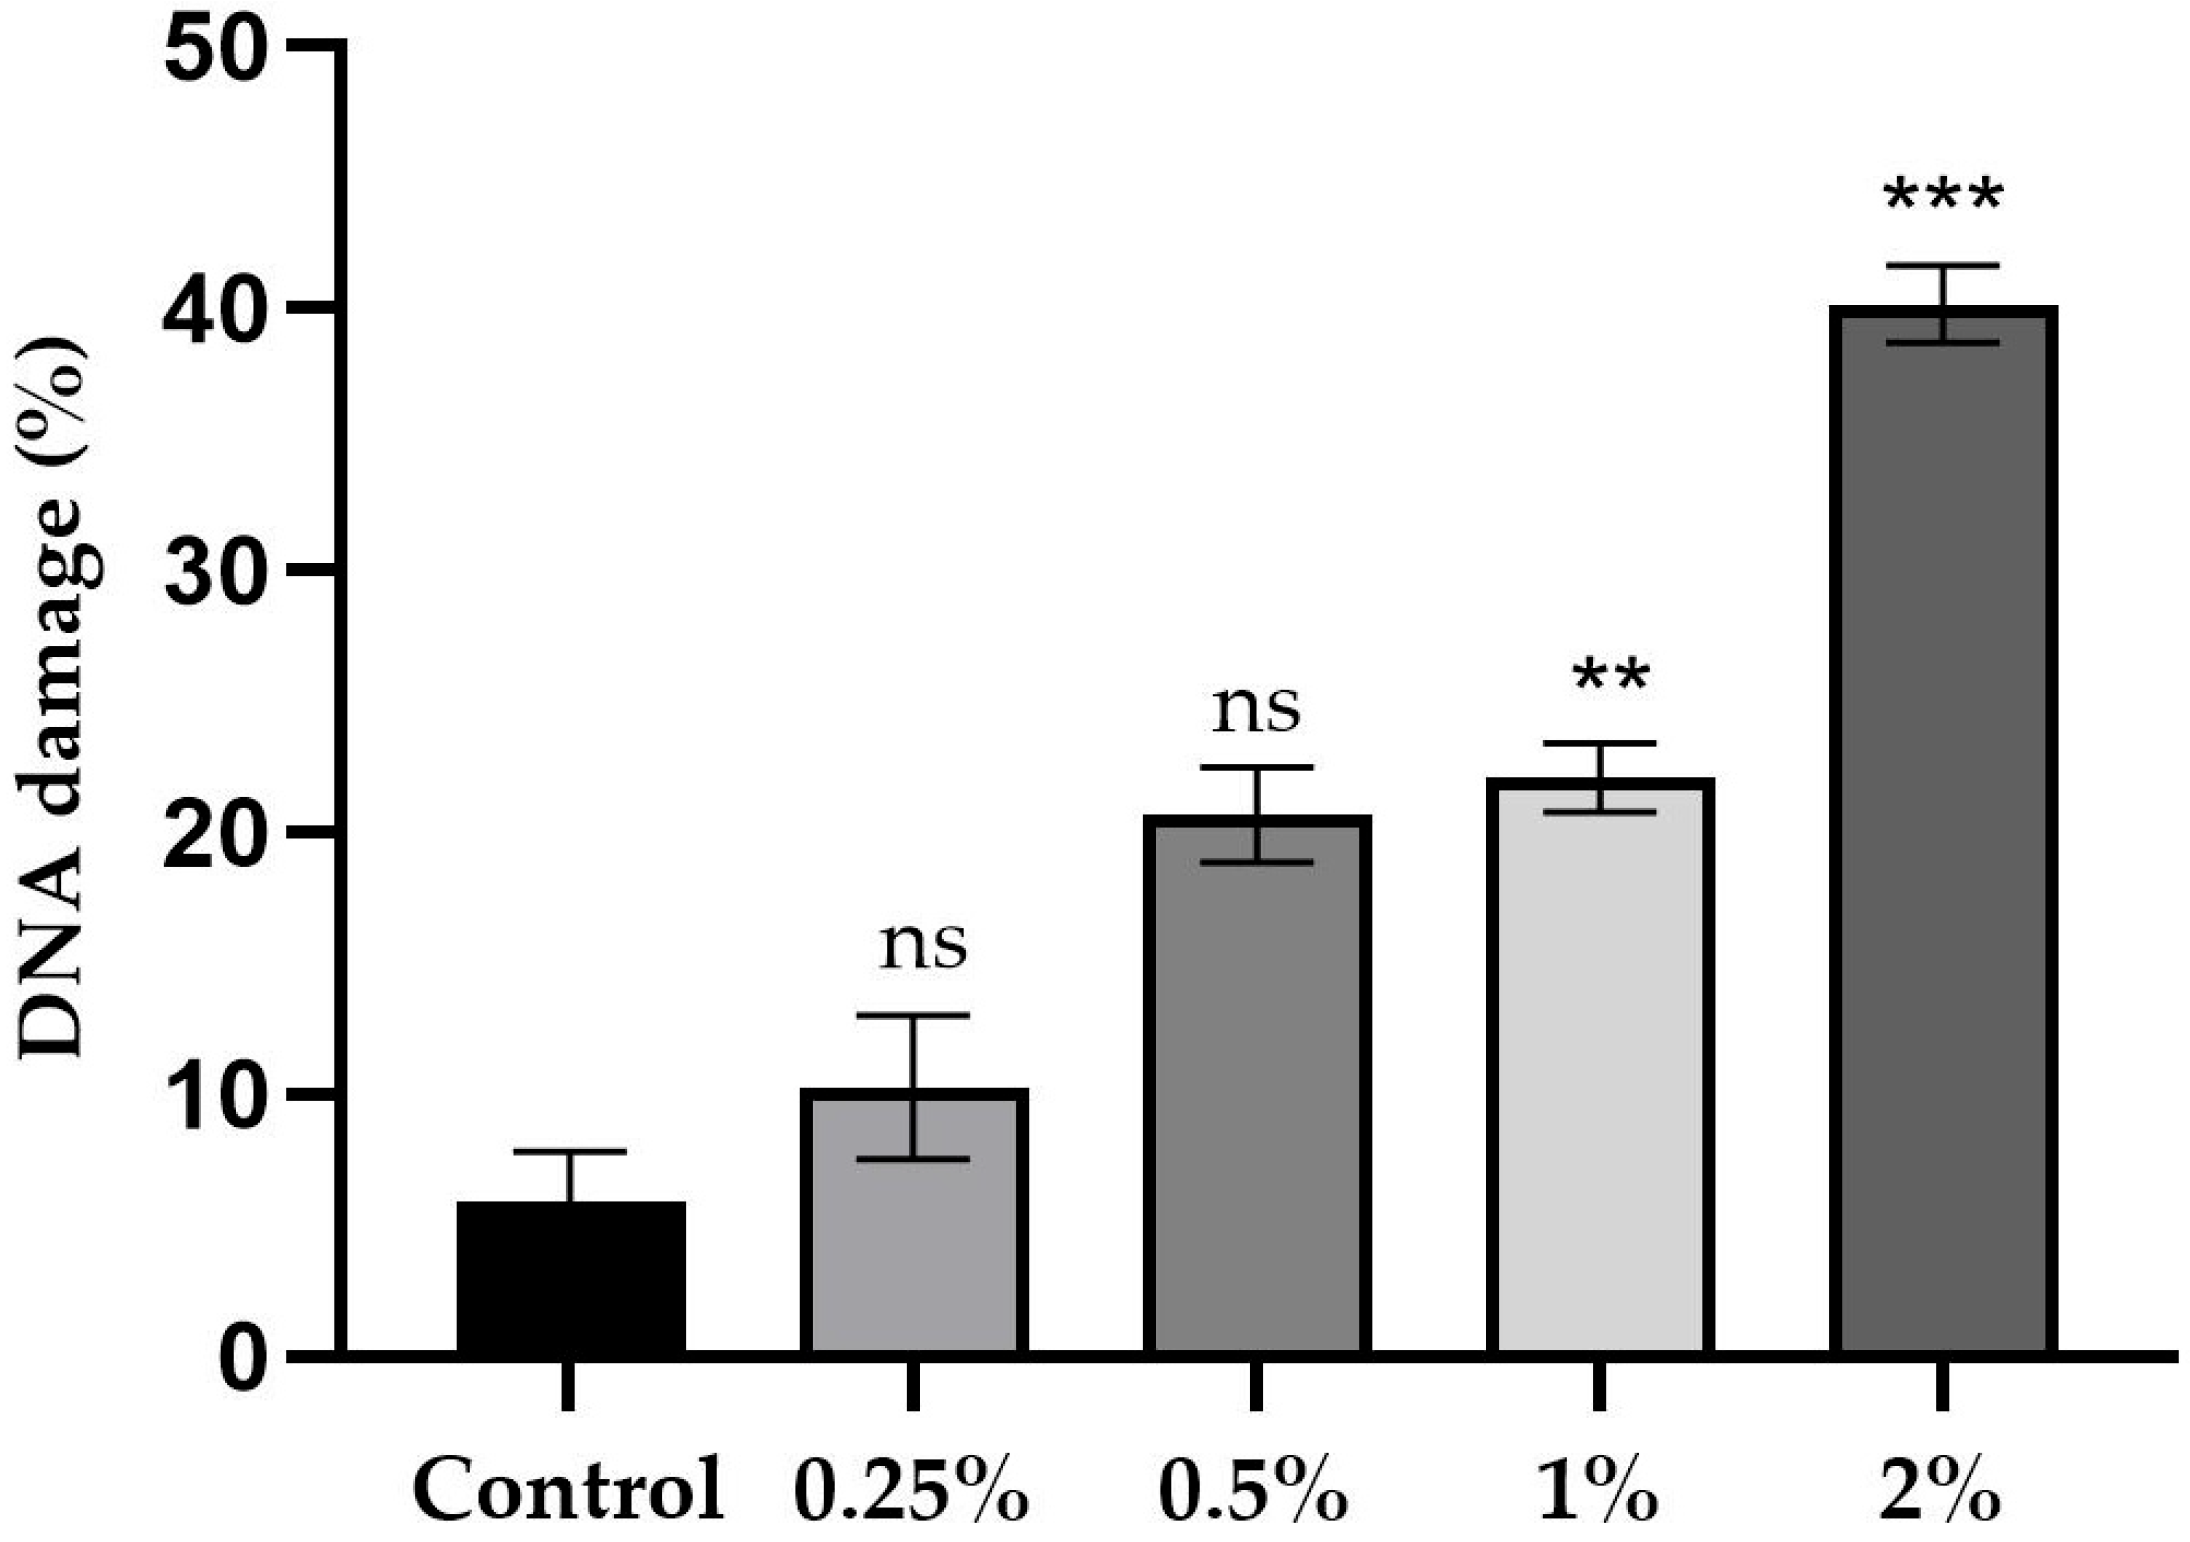
Figure 12 and Figure 13 summarize the results of the in vivo comet assay, showing the percentage of DNA damage in brain neuroblasts of third-stage larvae. The figures show neuroblasts exposed to a culture medium containing concentrations of sugar and sucralose–sugar, as well as the respective control groups. A total of 15 tubes were used, with three independent replicates.
Assessments of DNA damage in larval neuroblasts revealed significant genotoxic effects related to sucrose and sucralose concentrations. The sucrose control group (Figure 12) exhibited 6.5% DNA damage in the comet tail assay. Sucrose deprivation (0%) resulted in 4.6% damage (p < 0.0001). At 5%, the value was 8.7% (p > 0.05). However, at concentrations of 15% and 20%, the values increased to 39.6% and 42%, respectively (p < 0.01), indicating significant genetic material damage.
As for sucralose (Figure 13), the control group showed 5.9% damage. Concentrations of 0.25% and 0.5% resulted in 10.5% and 20% damage, respectively (p > 0.05). However, damage increased substantially to 22% and 40%, respectively, at concentrations of 1% and 2% (p < 0.001), indicating sucralose’s high genotoxicity at concentrations above 0.5%.

3. Discussion

This study reveals the significant effects of different sucrose and sucralose concentrations on various biological and behavioral parameters of D. melanogaster, including prolificacy, longevity, locomotion, exploratory behavior, and DNA integrity. These findings corroborate and in some respects contrast with previously reported data, providing a more comprehensive understanding of the mechanisms underlying metabolic and genotoxic toxicity induced by natural and artificial sweeteners.
With regard to prolificacy, the data show that the absence (0% and 5%) or excess of sucrose (20%) significantly reduces the number of eggs, larvae, and adults, with peak performance observed at 10–15% sucrose. This dose-dependent pattern is consistent with the findings of Skorupa et al. [51], who demonstrated that the composition of the diet directly influences feeding behavior, obesity, and fecundity in D. melanogaster. Similarly, Piper et al. [52] showed that excessively high-calorie or low-calorie diets negatively affect energy balance and reproduction. Notably, sucralose induced a more abrupt and severe drop in prolificacy than total sucrose deprivation, suggesting that its impact extends beyond caloric imbalance to potentially interfere with key reproductive or metabolic pathways. This pattern is consistent with the observations of Pepino [53], who described the adverse metabolic effects of artificial sweeteners, and of Rogers and Appleton [54], who reported that sucralose disrupts the gut microbiota and may impair reproductive function in non-mammalian models.
Longevity analysis revealed that both sucrose deprivation and excess decreased the mean lifespan of individuals, with the most significant impact observed in the absence of sucrose. These findings align with those of Partridge et al. [55], who linked unbalanced diets to a shorter lifespan due to increased oxidative stress and metabolic dysfunction. Katewa and Kapahi [56] also demonstrated that mild caloric restriction can be beneficial, whereas severe deficiency can compromise survival. This explains the adverse outcomes observed in groups without sucrose supplementation. The progressive reduction in lifespan with increasing sucralose concentrations, even at 0.5%, raises concerns about its cumulative toxicity, possibly linked to chronic disruption of gut microbiota and metabolic homeostasis. Data from Abou-Donia et al. [57] on rats are consistent with these findings, showing that sucralose alters gut microbiome and induces chronic metabolic inflammation impacting lifespan.
Both negative geotaxis and exploration assays reveal sex-specific and dose-dependent locomotor deficits, especially under sucralose exposure. These deficits are likely to reflect underlying neurometabolic disruption, consistent with previous reports of dopamine impairment and oxidative stress caused by excessive sugar intake or artificial sweeteners. Females generally exhibited greater sensitivity to sucralose exposure, with significant performance impairment occurring at 0.25% exposure. These results are consistent with those of Gargano et al. [58], who developed the RING method to detect early locomotor decline in Drosophila and demonstrated that dietary changes significantly affect motor function. Musselman et al. [59] also demonstrated that high-sugar diets reduce dopamine levels in Drosophila, thereby impairing locomotor and exploratory activity, which explains the decreased climbing times and exploratory distances observed in this study.
The comet assay revealed a significant increase in DNA strand breaks in larval neuroblasts exposed to high concentrations of sucrose (≥15%) or any concentration of sucralose (starting at 0.5%). The observed genotoxicity with elevated sucrose may be linked to increased production of reactive oxygen species (ROS), as described by Diniz et al. [60], who reported on oxidative stress in rats on high-sugar diets. The DNA damage observed, particularly with sucralose exposure, may result from oxidative lesions and impaired repair mechanisms. Studies from Schiffman and Rother [61] have shown modulation of key DNA repair genes (e.g., APTX, EID1), supporting a mechanistic basis for sucralose-induced genotoxicity. Bornemann et al. [62] recently reinforced these findings by demonstrating that chronic sucralose exposure in human colon cells results in elevated oxidative stress and direct DNA strand breakage, thus supporting the genotoxicity observed in Drosophila.
Other direct and indirect genotoxicity issues for sucralose have been conducted recently [38,63,64,65,66,67]. In a 2019 study [38], in Cyprinus carpio, chronic exposure led to DNA damage, increased ROS, and apoptosis in blood cells.
Other studies have raised more serious concerns. For instance, ref. [64] reported that thermal degradation products of sucralose are toxic and capable of reacting with DNA. This study, which evaluated sucralose’s cyto-, geno-, and immunotoxicity through in vitro and in silico methods, found a non-selective reduction in CD4+ and CD8+ lymphocyte populations, along with dose-dependent DNA alterations and chromosomal structural changes in lymphocytes. These effects were associated with the modulation of genes such as MAPK8, APTX, and EID1. Studies on Allium cepa provided further evidence of sucralose’s genotoxic potential. Exposure to aspartame, sorbitol, and sucralose resulted in various chromosomal abnormalities [65], most notably micronuclei formation during interphase and mitosis in root tip cells—a key indicator of mutagenesis. A follow-up study [66] that examined sucralose, aspartame, and their combination revealed synergistic genotoxic effects in the same plant model. Animal studies have also supported these findings. One of the earliest detailed investigations [67] exposed male Swiss mice prenatally to sucralose, observing a dose-dependent increase in hematopoietic neoplasms when sucralose was administered along with its hydrolysis product 6-CF at concentrations of 2000 ppm and 16,000 ppm. These findings suggest that sucralose may influence epithelial and glandular tissues in both benign and malignant processes. These studies are among the few known investigations of sucralose genotoxicity in the presence of other sweeteners and on the plant organisms, which becomes highly important, due to the chloroorganic nature of sucralose, similar to herbicides and insecticides.
Therefore, the present study on D. melanogaster confirms the general trend of assessing sucralose genotoxicity in the presence of sugar and other sweeteners and food contact substances, which deserves to be studied in depth. This becomes even more important due to the tendency for sucralose accumulation in the environment.
In summary, our findings suggest that moderate doses of sucrose support normal physiological parameters in D. melanogaster, whereas deprivation or excess has harmful effects. In contrast, sucralose exhibited significant toxicity even at low concentrations, impairing reproductive viability, lifespan, motor function, and genomic integrity, with more pronounced effects observed in females. Given the widespread presence of sucralose in aquatic systems and its apparent bioaccumulation potential, these findings in D. melanogaster—a model organism with conserved metabolic and genetic pathways—call for urgent reevaluation of regulatory thresholds for artificial sweeteners in food and the environment. Future studies should investigate the molecular mechanisms underlying sucralose toxicity, including alterations in antioxidant gene expression, DNA repair pathways, and neuroendocrine signaling, as well as potential transgenerational effects. More profound studies, including RT, qPCR, ROS quantification (which may be realized both chemically and electrochemically), providing explicit mechanisms of direct or indirect sucralose genotoxicity with and without the presence of sugar and other sweeteners are also important and will be exposed in our further studies.

4. Materials and Methods

4.1. Strains

The Oregon-K (OK) strain was used in this study. It is a wild-type line proficient in all major DNA repair pathways, including homologous recombination (HR), classical non-homologous end joining (c-NHEJ), and microhomology-mediated end joining (MMEJ). Additionally, this strain has been biochemically characterized and shown to have low antioxidant enzyme activity, which makes it particularly sensitive for studies involving oxidative damage [68,69].

4.2. Culture Medium Conditions and Sample Preparation with Drosophila

All flies were maintained in a climate-controlled chamber at 24 °C with a 12:12 h light–dark cycle. To maintain the population, newly eclosed adults were transferred to glass vials containing standard culture medium. The composition of this medium is detailed in Table 1. Vials were sealed with cotton plugs to allow airflow and prevent contamination.
Flies were divided into experimental groups according to the treatment regimen. The control group consisted of flies maintained on standard medium (containing 10% sugar), treatment groups included flies exposed to sugar concentrations of 0%, 5%, 15%, and 20%, as well as flies maintained on a culture medium with 10% sugar supplemented with sucralose at concentrations of 0.25%, 0.5%, 1%, 2%, and 10%. Virgin males and females aged between 0 and 3 days were selected for the experiments. For each group, five mating vials were prepared, each containing ten virgin males and ten virgin females. Males in the treatment groups were exposed to the respective sugar and sucralose concentrations for 2 to 3 days under standard conditions (24 °C). Immediately following exposure, males were introduced to females for mating.

4.3. Prolificacy Evaluation

Prolificacy was assessed using a standard culture medium (described in Table 1) supplemented with 0.5% activated charcoal (Sigma-Aldrich, St. Louis, MO, USA). This medium was added to both treatment and control vials as previously described. Following exposure and mating, the numbers of eggs, larvae, and viable adults were recorded. Activated charcoal was added to darken the culture medium, providing contrast that facilitated accurate eggs counting [70,71]. All assays were conducted in triplicate, with three independent replicates of 15 mating vials per group.

4.4. Longevity Assay

After offspring counting, individuals from each experimental group (control and treatment with sugar or sucralose) were transferred to three replicate vials per group. Each vial consisted of a 200 mL glass container with approximately 25 mL of culture medium. Flies were transferred to fresh vials every seven to nine days to maintain food quality and avoid generational overlap. Mortality was recorded at each transfer until all individuals in each group had died. Longevity was calculated as the number of days from hatching to death for each fly [72].

4.5. Open Field Exploration Test (Evaluation of Exploratory)

Approximately five adult flies, separated by sex, from both treatment and control groups (as described in Section 2.3), were introduced into a transparent 10 cm diameter circular arena marked with quadrants of 1 cm. Following exposure to sugar and sucralose treatments, the flies’ spontaneous locomotion was recorded on video. Their movement trajectories were then analyzed by measuring the total distance traveled over a 1 min period [73].

4.6. Negative Geotaxis Test (Locomotion)

Groups of ten adult flies, separated by sex, from both treatment and control groups (as described in Section 2.3), were placed in glass transparent tubes, 15 cm in height. The tubes were held vertically and tapped firmly three times against a flat surface. The time taken for each fly to climb to a height of 8 cm was recorded in seconds, and the average climbing speed was calculated as a percentage per second. Three trials were conducted per group, with a one-minute interval between each trial [74,75].

4.7. Comet Assay

The comet assay was carried out to assess DNA strand breaks, alkali-labile sites, and general genomic integrity in neuroblasts. Approximately 2 to 3 third-stage larvae were collected from each experimental group and the neuroblasts were isolated by dissection using a drop of ringer’s solution (150 mM NaCl, 35 mM KCl, and 2 mM CaCl, adjust the pH to 6.5 with NaOH). The extracted tissues were gently dissociated using forceps into a 1.5 mL microtube with about 100 uL of insect ringer’s solution (130 mM NaCl, 35 mM KCl, 2 mM CaCl2; pH adjusted to 6.5 with NaOH) and subsequently centrifuged at 300× g for 5 min. After centrifugation, the supernatant was discarded, and 140 µL of 1% low-melting-point agarose (Pronadisa Micro and Molecular Biology, Madrid, Spain), in PBS, maintained at 37 °C, was added to each microtube. Two 70 µL drops of the resulting cell–agarose suspension were then placed onto pre-coated microscope slides with 1% normal-melting-point agarose (Sigma-Aldrich, St. Louis, MO, USA). Each drop was immediately covered with an 18 × 18 mm coverslip and left to solidify at 4 °C for five min. The coverslips were then carefully removed. The slides were then immersed in a lysis buffer (2.5 M NaCl, 0.1 M EDTA, 10 mM Tris-base, 1% Triton X-100, pH 10) for 1 h at 4 °C. Following lysis, the slides were transferred to an electrophoresis buffer (0.3 M NaOH, 1 mM EDTA, pH 12.6) and incubated for 30 min at 4 °C to allow DNA unwinding. Electrophoresis was then performed at 25 V/cm and 300 mA for 20 min at 4 °C using a standard electrophoresis unit. After electrophoresis, the slides were neutralized by sequential washes with 1× PBS and distilled water for 10 min each at 4 °C. DNA was stained with 20 μL of DAPI solution (1 μg/mL in H2O) per gel. One hundred nuclei per gel were scored visually using a fluorescence microscope (Olympus BX41, 40× magnification, by Olympus, Hachioji, Japan). Comets were visually categorized into five damage classes based on tail intensity, with scores ranging from 0 (no damage) to 4 (maximum damage) [76]. The cumulative score for each gel was calculated by summing the scores of the 100 comets, resulting in a scale from 0 to 400 arbitrary units (AU). DNA damage was expressed as the percentage of DNA in the tail, calculated by dividing the AU value by 4, as described by Azqueta et al., 2011. The scoring was performed blindly to ensure an unbiased assessment [77].

4.8. Data Evaluation and Statistical Analysis

The DNA damage data obtained through the comet assay (expressed as the percentage of DNA in the comet tail) were analyzed using a one-way analysis of variance (ANOVA). Statistical comparisons were performed only on the percentage of DNA damage.
Graphical representation organized in bars, showing the mean distance traveled by males and females in seconds and centimeters were used to present data from the negative geotaxis test and fly exploration. Prolificacy was assessed based on the number of adults, larvae, and hatched eggs. Quantitative data are presented as the mean ± standard deviation (SD). An independent samples t-test was performed to determine statistically significant differences between groups. This was done for the negative geotaxis test and for comparisons between adults, larvae, and hatched eggs. To assess longevity among Drosophila groups, survival curves were calculated using the Kaplan–Meier method with 95% confidence intervals. The log-rank (Mantel–Cox) test was used to compare survival curves between groups and to assess paired differences in survival distributions. All statistical analyses were performed using GraphPad Prism software (version 9.0, GraphPad Software, San Diego, CA, USA). All results are expressed as the mean ± standard deviation (SD) from three independent replicates.

5. Conclusions

The present investigation demonstrates that the effects of sucrose and sucralose on the physiology, behavior, and genome of D. melanogaster are complex, dose-dependent, and, in some cases, synergistic. Moreover, the synergism between the two can also be observed. Moderate sucrose concentrations supported biological viability, enhancing reproductive output, lifespan, and locomotor function. In contrast, both deprivation and excessive intake of sucrose elicited detrimental outcomes, reflecting underlying metabolic imbalances. In contrast, deprivation or excess of this carbohydrate led to significant impairments indicative of metabolic imbalance. Sucralose, however, exhibited marked toxicity even at low concentrations, leading to reduced prolificacy and lifespan, impaired exploratory behavior, and significant genomic damage as evidenced by comet assay results. Given the increasing prevalence of artificial sweeteners in human diets and their accumulation in the environment, these findings raise important concerns regarding their long-term biological safety. Moreover, they highlight the value of D. melanogaster as a sensitive and robust model for assessing dietary toxicity and genotoxic risk, providing insights that may support future regulatory assessments and public health policies.

Author Contributions

N.M., A.M.-B. and I.G., methodology; V.V.T., N.M., A.M.-B., A.N.B. and I.G., validation; V.V.T., N.M., A.M.-B., A.N.B. and I.G., formal analysis; V.V.T., N.M., A.M.-B. and I.G., investigation; A.M.-B., A.N.B. and I.G., resources; V.V.T., N.M., A.M.-B., A.N.B. and I.G., data curation; V.V.T., N.M., A.M.-B., A.N.B. and I.G., writing—original draft preparation; V.V.T., N.M., A.M.-B., A.N.B. and I.G., writing—review and editing; V.V.T., N.M., A.M.-B., A.N.B. and I.G., visualization; A.M.-B., A.N.B. and I.G., supervision; A.N.B. and I.G., project administration; A.N.B. and I.G., funding acquisition. All authors have read and agreed to the published version of the manuscript.

Funding

This work was supported by the National Funds by the FCT, the Portuguese Foundation for Science and Technology, under project UIDB/00772/2020 (https://doi.org/10.54499/UIDB/00772/2020) by the Veterinary and Animal Research Centre (CECAV), (https://doi.org/10.54499/UIDB/00772/2020) and the project AL4AnimalS (LA/P/0059/2020) and Centre for the Research and Technology of Agro-Environmental and Biological Sciences (CITAB) under project UID/04033 and LA/P/0126/2020 (https://doi.org/10.54499/LA/P/0126/2020).

Institutional Review Board Statement

Not applicable.

Data Availability Statement

All the new data obtained in this research may be accessed and explained by contacting the correspondent authors.

Acknowledgments

Volodymyr V. Tkach acknowledges the Engineering Faculty of the University of Porto and the University of Trás-os-Montes and Alto Douro for their support during these difficult times for Ukraine and its research.

Conflicts of Interest

The authors declare no conflicts of interest.

References

  1. Debras, C.; Chazelas, E.; Sellem, L.; Porcher, R.; Druesne-Pecollo, N.; Esseddik, Y.; de Edelenyi, F.S.; Agaësse, C.; De Sa, A.; Lutchia, R.; et al. Artificial Sweeteners and Risk of Cardiovascular Diseases: Result from the Prospective NutriNet-Sante Cohort. BMJ 2022, 378, e71204. [Google Scholar] [CrossRef]
  2. Juárez, G.; Sanz-Novo, M.; Alonso, J.L.; Alonso, E.R.; León, I. Rotational Spectrum and Conformational Analysis of Perillartine: Insights into the Structure—Sweetness Relationship. Molecules 2022, 27, 1924. [Google Scholar] [CrossRef]
  3. Xiao, Y.; Xiao, L.; Li, M.; Liu, S.; Wang, Y.; Huang, L.; Liu, S.; Jiang, T.; Zhou, L.; Li, Y. Perillartine Protects Against Metabolic Associated Fatty Liver in High Fat Diet Induced Obese Mice. Food Funct. 2023, 14, 961–977. [Google Scholar] [CrossRef] [PubMed]
  4. Xiao, Y.; Jia, M.; Jiang, T.; Zhang, C.; Qi, X.; Sun, Y.; Gao, J.; Zhou, L.; Li, Y. Dietary Supplementation with Perillartine Ameliorates Lipid Metabolism Disorder Induced by a High-Fat Diet in Broiler Chickens. Biochem. Biophys. Res. Commun. 2022, 625, 66–74. [Google Scholar] [CrossRef] [PubMed]
  5. del Pozo, S.; Gómez-Martínez, S.; Díaz, L.E.; Nova, E.; Urrialde, R.; Marcos, A. Potential Effects of Sucralose and Saccharin on Gut Microbiota: A Review. Nutrients 2022, 14, 1682. [Google Scholar] [CrossRef] [PubMed]
  6. Available online: https://www.sciencesnail.com/science/the-synthesis-of-sucralose-from-sucrose (accessed on 10 March 2025).
  7. Méndez-García, L.A.; Bueno-Hernández, N.; Cid-Soto, M.A.; De León, K.L.; Mendoza-Martínez, V.M.; Espinosa-Flores, A.J.; Carrero-Aguirre, M.; Esquivel-Velázquez, M.; León-Hernández, M.; Viurcos-Sanabria, R.; et al. Ten-Week Sucralose Consumption Induces Gut Dysbiosis and Altered Glucose and Insulin Levels in Healthy Young Adults. Microorganisms 2022, 10, 434. [Google Scholar] [CrossRef]
  8. Huang, H.; Liu, S.; Peng, Z.; Wang, B.; Zhan, S.; Huang, S.; Li, W.; Liu, D.; Yang, X.; Zhu, Y.; et al. Comparative Effects of Different Sugar Substitutes: Mongroside V, Stevioside, Sucralose and Erythritol on Intestinal Health in a Type 2 Diabetes Mellitus Mouse. Food Funct. 2025, 16, 2108–2123. [Google Scholar] [CrossRef]
  9. Ashwell, M.; Gibson, S.; Bellisle, F.; Buttriss, J.; Drewnowski, A.; Fantino, M.; Gallagher, A.M.; de Graaf, K.; Goscinny, S.; Hardman, C.A.; et al. Expert consensus on low-calorie sweeteners: Facts, research gaps and suggested actions. Nutr. Res. Rev. 2020, 33, 145–154. [Google Scholar] [CrossRef]
  10. Plaza-Diaz, J.; Pastor-Villaescusa, B.; Rueda-Robles, A.; Abadia-Molina, F.; Ruiz-Ojeda, F.J. Plausible Biological Interactions of Low-and Non-Calorie Sweeteners with the Intestinal Microbiota: An Update of Recent Studies. Nutrients 2020, 12, 1153. [Google Scholar] [CrossRef]
  11. Singh, A.; Singh, S.; Begum, R.F.; Vijayan, S.; Vellapandian, C. Unveiling the Profound Influence of Sucralose on Metabolism and Its Role in Shaping Obesity Trends. Front. Nutr. 2024, 11, 1378646. [Google Scholar] [CrossRef]
  12. Aguayo-Guerrero, J.A.; Méndez-García, L.A.; Manjarrez-Reyna, A.N.; Esquivel-Velázquez, M.; León-Cabrera, S.; Meléndez, G.; Zambrano, E.; Ramos-Martínez, E.; Fragoso, J.M.; Briones-Garduño, J.C.; et al. Newborns from Mothers Who Intensely Consumed Sucralose during Pregnancy Are Heavier and Exhibit Markers of Metabolic Alteration and Low-Grade Systemic Inflammation: A Cross-Sectional, Prospective Study. Biomedicines 2023, 11, 650. [Google Scholar] [CrossRef]
  13. Stampe, S.; Leth-Møller, M.; Greibe, E.; Hoffmann-Lücke, E.; Pedersen, M.; Ovesen, P. Artificial Sweeteners in Breast Milk: A Clinical Investation with a Kinetical Perspective. Nutrients 2022, 14, 2635. [Google Scholar] [CrossRef]
  14. Yang, Y.; Liu, Z.; Zheng, H.; Zhu, S.; Zhang, K.; Li, X.; Ma, X.; Dietrich, A.M. Sucralose, a persistent artificial sweetener in the urban water cycle: Insights into occurrence, chlorinated byproducts formation, and human exposure. J. Environ. Chem. Eng. 2021, 9, 105293. [Google Scholar] [CrossRef]
  15. Colín-García, K.; Elizalde-Velázquez, G.A.; Gómez-Oliván, L.M.; Islas-Flores, H.; García-Medina, S.; Galar-Martínez, M. Acute Exposure to Environmentally Relevant Concentrations of Sucralose Disrupts Embryonic Development and Leads to an Oxidative Stress in Danio Rerio. Sci. Total Environ. 2022, 829, 154689. [Google Scholar] [CrossRef]
  16. Mattoli, L.; Fodaroni, G.; Proietti, G.; Flamini, E.; Paoli, B.; Massa, L.; Ferrara, G.C.; Giovagnoni, E.; Gianni, M. Biodegradability of Dietary Supplements: Advanced Analytical Methods to Study the Environmental Fate of Artificial Sweeteners and Dyes. J. Pharm. Biomed. Anal. 2025, 255, 116575. [Google Scholar] [CrossRef]
  17. Tilg, H.; Adolph, T.E. Sucralose and Erythritol—Not Too Sweet. N. Engl. J. Med. 2023, 389, 859–861. [Google Scholar] [CrossRef]
  18. Schiffmann, S.; Scholl, E.; Furey, T.S.; Nagle, H.T. Toxicological and pharmacokinetic properties of sucralose-6-acetate and its parent sucralose: In vitro screening assays. J. Toxicol. Environ. Health 2023, 26, 307–341. [Google Scholar] [CrossRef]
  19. Blenkley, E.; Suckling, J.; Morse, S.; Murphy, R.; Raats, M.; Astley, S.; Halford, J.C.G.; Harrold, J.A.; Le-Bail, A.; Koukouna, E.; et al. Environmental life cycle assessment of production of the non-nutritive sweetener sucralose (E955) derived from cane sugar produced in the United States of America: The SWEET project. Int. J. Life Cycle Assess. 2023, 28, 1689–1704. [Google Scholar] [CrossRef]
  20. Bornemann, V.; Werness, S.; Buslinger, L.; Schiffman, S.S. Intestinal Metabolism and Bioaccumulation of Sucralose in Adipose Tissue in the Rat. J. Toxicol. Environ. Health Part A 2018, 81, 913–923. [Google Scholar] [CrossRef] [PubMed]
  21. Suez, J.; Cohen, Y.; Valdés-Mas, R.; Mor, U.; Dori-Bachash, M.; Federici, S.; Zmora, N.; Leshem, A.; Heinemann, M.; Linevsky, R.; et al. Personalized Microbiom-Driven Effects of Non-Nutritive Sweeteners on Human Glucose Tolerance. Cell 2022, 185, 3307–3328. [Google Scholar] [CrossRef] [PubMed]
  22. Hosseini, A.; Barlow, G.M.; Leite, G.; Rashid, M.; Parodi, G.; Wang, J.; Morales, W.; Weitsman, S.; Rezaie, A.; Pimentel, M.; et al. Consuming Artificial Sweeteners May Alter the Structure and Function of Duodenal Microbial Communities. iScience 2023, 26, 108530. [Google Scholar] [CrossRef]
  23. Jarmakiewicz-Czaja, S.; Sokal-Dembowska, A.; Filip, R. Effects of Selected Food Additives on the Gut Microbiome and Metabolic Disfunction-Associated Steatotic Liver Disease (MASLD). Medicina 2025, 61, 192. [Google Scholar] [CrossRef] [PubMed]
  24. Harpaz, D.; Yeo, L.P.; Cecchini, F.; Koon, T.H.P.; Kushmaro, A.; Tok, A.I.Y.; Marks, R.S.; Eltzov, E. Measuring Artificial Sweeteners Toxicity Using a Bioluminescent Bacterial Panel. Molecules 2018, 23, 2454. [Google Scholar] [CrossRef]
  25. Ahmad, S.Y.; Friel, J.K.; Mackay, D.S. Effect of sucralose and aspartame on glucose metabolism and gut hormones. Nutr. Rev. 2020, 78, 725–746. [Google Scholar] [CrossRef]
  26. Zani, F.; Blagih, J.; Gruber, T.; Buck, M.D.; Jones, N.; Hennequart, M.; Newell, C.L.; Pilley, S.E.; Soro-Barrio, P.; Kelly, G.; et al. The Dietary Sweetener Sucralose is a Negative Modulator of T-Cell-Mediated Response. Nature 2023, 615, 705–711. [Google Scholar] [CrossRef]
  27. Risdon, S.; Battault, S.; Romo-Romo, A.; Roustit, M.; Briand, L.; Meyer, G.; Almeda-Valdes, P.; Walther, G. Sucralose and Cardiometabolic Health: Current Understanding from Receptors to Clinical Investigations. Adv. Nutr. 2021, 12, 1500–1513. [Google Scholar] [CrossRef] [PubMed]
  28. Zhai, Y.; Bai, D.; Yang, H.; Li, X.; Zhu, D.; Cao, X.; Ma, H.; Li, X.; Zheng, X. Hazardous Effects of Sucralose and its Disinfection Byproducts Identified From an E. coli Whole-Cell Array Analysis. Front. Environ. Sci. 2021, 9, 724685. [Google Scholar] [CrossRef]
  29. dos Santos, C.A.; Pedrosa, D.S.; Da Silva Santos, M. Adoçantes Sintéticos e Seus Riscos à Saúde. Rev. Ciên. Saúde 2023, 27, 122. (In Portuguese) [Google Scholar] [CrossRef]
  30. Aguayo-Guerrero, J.A.; Méndez-García, L.A.; Solleiro-Villavicencio, H.; Viurcos-Sanabria, R.; Escobedo, G. Sucralose: From Sweet Success to Metabolic Controversies—Unraveling the Global Health Implications of a Pervasive Non-Caloric Artificial Sweetener. Life 2024, 14, 323. [Google Scholar] [CrossRef]
  31. Hu, J.; Feng, J.; Bai, Y.; Yao, Z.-S.; Wu, X.-Y.; Hong, X.-Y.; Lu, G.D.; Xue, K. Sucralose Promotes Benzo(a)Pyrene-Induced Renal Toxicity in Mice by Regulating P-Glycoprotein. Antioxidants 2025, 14, 474. [Google Scholar] [CrossRef]
  32. Shil, A.; Olusanya, O.; Ghufoor, Z.; Forson, B.; Marks, J.; Chichger, H. Artificial Sweeteners Disrupt Tight Junctions and Barrier Function in the Intestinal Epithelium through Activation of the Sweet Taste Receptor, T1R3. Nutrients 2020, 12, 1862. [Google Scholar] [CrossRef]
  33. Yan, X.; Chen, Z.; Rong, X.; Chen, Z.; Wu, G.; Dong, Z.; Fu, Y.; Hai, T. The Impact of Sucralose and Neotame on the Safety of Metal Precipitation in Electronic Cigarettes. Front. Physiol. 2024, 15, 1437042. [Google Scholar] [CrossRef]
  34. Moser, D.; Leitner, P.; Filipek, P.; Hussain, S.; Rainer, M.; Jakschitz, T.; Rode, B.; Bonn, G.K. Quantification and Cytotoxicity of Degradation Products (Chloropropanols) in Sucralose Containing E-Liquids with Propylene Glycol and Glycerol as Base. Toxicol. Appl. Pharmacol. 2021, 430, 115727. [Google Scholar] [CrossRef] [PubMed]
  35. Haq, N.; Saqib, S.; Tafweez, R.; Ali, I.; Syami, A.F. Effects of Artificial Sweeteners Aspartame and Sucralose on the Size of Hepatocytes in Rat Liver. PJMHS 2022, 16, 359–362. [Google Scholar] [CrossRef]
  36. Wu, H.-T.; Lin, C.-H.; Pai, H.-L.; Chen, Y.-C.; Cheng, K.-P.; Kuo, H.-Y.; Li, C.-H.; Ou, H.-Y. Sucralose, a Non-nutritive Artificial Sweetener Exacerbates High Fat Diet-Induced Hepatic Steatosis Through Taste Receptor Type 1 Member 3. Front. Nutr. 2022, 9, 823723. [Google Scholar] [CrossRef]
  37. Borquez, J.C.; Hidalgo, M.; Rodriguez, J.M.; Montaña, A.; Porras, O.; Troncoso, R.; Bravo-Sagua, R. Sucralose Stimulates Mitochondrial Bioenergetics in Caco-2 Cells. Front. Nutr. 2021, 7, 585484. [Google Scholar] [CrossRef]
  38. Heredia-García, G.; Gómez-Oliván, L.M.; Orozco-Hernández, J.M.; Luja-Mondragón, M.; Islas-Flores, H.; SanJuan-Reyes, N.; Galar-Martínez, M.; García-Medina, S.; Dublán-García, O. Alterations to DNA, apoptosis and oxidative damage induced by sucralose in blood cells of Cyprinus carpio. Sci. Total Environ. 2019, 692, 411–421. [Google Scholar] [CrossRef] [PubMed]
  39. El-Tahan, H.M.; Elmasry, M.E.; Madian, H.A.; Alhimaidi, A.R.; Kim, I.H.; Park, J.H.; El-Tahan, H.M. Sucralose Influences the Productive Performance, Carcass Traits, Blood Components, and Gut Microflora Using 16S rRNA Sequencing of Growing APRI-Line Rabbits. Animals 2024, 14, 1925. [Google Scholar] [CrossRef]
  40. Stepanov, I.; Berman, M.; Brinkman, M.C.; Carll, A.; Exil, V.; Hansen, E.G.; El Hellani, A.; Jabba, S.V.; Kassem, N.O.F.; Rezk-Hanna, M.; et al. Sugars in Tobacco Products: Toxicity Research and Implications for Tobacco Product Regulation. Chem. Res. Toxicol. 2025, 38, 747–758. [Google Scholar] [CrossRef]
  41. Kaur, K.; Simon, A.F.; Chauhan, V.; Chauhan, A. Effect of bisphenol A on Drosophila melanogaster behavior—A new model for the studies on neurodevelopmental disorders. Behav. Brain Res. 2015, 284, 77–84. [Google Scholar] [CrossRef] [PubMed]
  42. Chen, Z.; Wang, F.; Wen, D.; Mu, R. Exposure to Bisphenol A Induced Oxidative Stress, Cell Death and Impaired Epithelial Homeostasis in the Adult Drosophila melanogaster Midgut. Ecotoxicol. Environ. Safety 2022, 248, 114285. [Google Scholar] [CrossRef]
  43. Adesanoye, O.A.; Abolaji, A.O.; Faloye, T.R.; Olaoye, H.O.; Adedara, A.O. Luteolin/Supplemented Diets Ameliorates Bisphenol A-Induced Toxicity in Drosophila melanogaster. Food Chem. Toxicol. 2020, 142, 111478. [Google Scholar] [CrossRef]
  44. Sarkar, A.; Mahendran, T.S.; Meenakshisundaram, A.; Christopher, R.V.; Dan, P.; Sundararajan, V.; Jana, N.; Venkatasubbu, D.; Mohideen, S.S. Role of Cerium Oxide Nanoparticles in Improving Oxidative Stress and Developmental Delays in Drosophila melanogaster as an In Vivo Model for Bisphenol A Toxicity. Chemosphere 2021, 284, 131363. [Google Scholar] [CrossRef]
  45. Musachio, E.A.S.; de Freitas Couto, S.; Poetini, M.R.; Bortolotto, V.C.; Dahleh, M.M.M.; Janner, D.E.; Araujo, S.M.; Ramborger, B.P.; Rohers, R.; Guerra, G.P.; et al. Bisphenol A Exposure During the Embryonic Period: Insights into Dopamine Relationship and Behavioral Disorders in Drosophila melanogaster. Food Chem. Toxicol. 2021, 157, 112526. [Google Scholar] [CrossRef]
  46. Nguyen, U.; Tinsley, B.; Sen, Y.; Stein, J.; Palacios, Y.; Ceballos, A.; Welch, C.; Nzenkue, K.; Penn, A.; Murphy, L.; et al. Exposure to Bisphenol A Differentially Impacts Neurodevelopment and Behavior in Drosophila melanogaster from Distinct Genetic Backgrounds. Neurotoxicology 2021, 82, 146–157. [Google Scholar] [CrossRef]
  47. Begum, M.; Pallab, P.; Das, D.; Ghosh, S. Endocrine-Disrupting Plasticizer Bisphenol A Exposure Causes Changes in Behavioral Attributes in Drosophila melanogaster. Toxicol. Environ. Health Sci. 2020, 12, 237–246. [Google Scholar] [CrossRef]
  48. Ramadhan, M.J.; Kharomah, S.; Zahrah, N.A.; Maghfiroh, H.; Fahmi, M.I.N.; Zubaidah, S.; Fauzi, A. Negative Geotaxis Assay in Three Drosophila Strains Consuming Bisphenol A: Duration and Number of Climbing Successes. IOP Conf. Ser. Earth Environ. Sci. 2021, 1439, 012010. [Google Scholar] [CrossRef]
  49. Fishburn, J.L.; Larson, H.L.; Nguyen, A.; Welch, C.J.; Moore, T.; Penn, A.; Newman, J.; Mangino, A.; Widman, E.; Ghobashy, R.; et al. Bisphenol F Affects Neurodevelopmental Gene Expression, Mushroom Body Development and Behavior in Drosophila melanogaster. Neurotoxicol. Teratol. 2024, 102, 107331. [Google Scholar] [CrossRef]
  50. Rani, L.; Saini, S.; Thakur, R.S.; Patel, D.K.; Chowdhuri, D.K.; Gautam, N.K. Single and Combined Effect of Bisphenol A with High Sucrose Diet on the Diabetic and Renal Tubular Dysfunction Phenotypes in Drosophila melanogaster. Environ. Toxicol. Pharmacol. 2022, 96, 103977. [Google Scholar] [CrossRef] [PubMed]
  51. Skorupa, D.A.; Dervisefendic, A.; Zwiener, J.; Pletcher, S.D. Dietary composition specifies consumption, obesity, and lifespan in Drosophila melanogaster. Aging Cell 2008, 7, 478–490. [Google Scholar] [CrossRef]
  52. Piper, M.D.W.; Partridge, L. Dietary restriction in Drosophila: Delayed aging or experimental artefact? PLoS Genet. 2007, 3, e57. [Google Scholar] [CrossRef]
  53. Pepino, M.Y. Metabolic effects of non-nutritive sweeteners. Physiol. Behav. 2015, 152, 450–455. [Google Scholar] [CrossRef]
  54. Rogers, P.J.; Appleton, K.M. The effects of low-calorie sweeteners on energy intake and body weight: A systematic review and meta-analyses of sustained intervention studies. Int. J. Obes. 2021, 45, 464–478. [Google Scholar] [CrossRef]
  55. Partridge, L.; Gems, D.; Withers, D.J. Sex and death: What is the connection? Cell 2005, 120, 461–472. [Google Scholar] [CrossRef] [PubMed]
  56. Katewa, S.D.; Kapahi, P. Dietary restriction and aging. Aging Cell 2010, 9, 105–112. [Google Scholar] [CrossRef]
  57. Abou-Donia, M.B.; El-Masry, E.M.; Abdel-Rahman, A.A.; McLendon, R.E.; Schiffman, S.S. Splenda alters gut microflora and increases intestinal p-glycoprotein and cytochrome P-450 in male rats. J. Toxicol. Environ. Health Part A 2008, 71, 1415–1429. [Google Scholar] [CrossRef] [PubMed]
  58. Zhang, M.; Chen, S.; Dai, Y.; Duan, T.; Xu, Y.; Li, X.; Yang, J.; Zhu, X. Aspartame and sucralose extend the lifespan and improve the health status of C. elegans. Food Funct. 2021, 12, 9912–9921. [Google Scholar] [CrossRef] [PubMed]
  59. Gaivão, I.; Santos, R.A.; Morozova, T.V.; Tkach, V.V. Biological and Behavioural Effects of Bisphenol A (BPA) Exposure: An In Vivo Study in Drosophila Melanogaster. Appl. Sci. 2025, 15, 5588. [Google Scholar] [CrossRef]
  60. Musselman, L.P.; Fink, J.L.; Narzinski, K.; Ramachandran, P.V.; Hathiramani, S.S.; Cagan, R.L.; Baranski, T.J. A high-sugar diet produces obesity and insulin resistance in wild-type Drosophila. Dis. Models Mech. 2011, 4, 842–849. [Google Scholar] [CrossRef]
  61. Schiffman, S.S.; Rother, K.I. Sucralose, a synthetic organochlorine sweetener: Overview of biological issues. J. Toxicol. Environ. Health Part B Crit. Rev. 2013, 16, 399–451. [Google Scholar] [CrossRef]
  62. Bornemann, V.; Wörner, T.; Fiedler, H.; Weidauer, A.; Poetzsch, M.; Huetteroth, W. Chronic exposure to sucralose induces oxidative stress and DNA damage in human colon cells. Toxicol. Lett. 2023, 377, 39–50. [Google Scholar] [CrossRef]
  63. Atalay, E.Ç.; Demirhan, B.E.; Celep, A.G.S. Low-Calorie Sweeteners and Reproductive Health: Evidence and Debates. Curr. Nutr. Food Sci. 2025, 21, 309–332. [Google Scholar] [CrossRef]
  64. Pasqualli, T.; Chaves, P.E.E.; Pereira, L.V.; Serpa, E.A.; Souza de Oliveira, L.F.; Mansur Machado, M. Sucralose causes non-selective CD4 and CD8 lymphotoxicity via probable regulation of the MAPK8/APTX/EID1 genes: An in vitro/in silico study. Clin. Exp. Pharmacol. Physiol. 2020, 47, 1751–1757. [Google Scholar] [CrossRef]
  65. Rizk, R.M.; Soliman, M.I.; Rashed, A.A. Potential Mutagenicity of Some Artificial Sweeteners Using Allium Test. Asian J. Adv. Basic Sci. 2016, 4, 27–40. [Google Scholar]
  66. Samoilov, A.V.; Suraeva, N.M.; Zaitseva, M.V.; Kurbanova, M.N.; Stolbova, V.V. Comparative Assessment of Artificial Sweeteners Toxicity via Express Biotest. Health Risk Anal. 2019, 2019, 83–90. [Google Scholar] [CrossRef]
  67. Soffritti, M.; Padovani, M.; Tibaldi, E.; Falcioni, L.; Manservisi, F.; Lauriola, M.; Bua, L.; Manservigi, M.; Belpoggi, F. Sucralose administered in feed, beginning prenatally through lifespan, induces hematopoietic neoplasias in male swiss mice. Int. J. Occup. Environ. Health 2016, 22, 7–17. [Google Scholar] [CrossRef]
  68. Rodríguez, R.; Gaivão, I.; Aguado, L.; Espina, M.; Garcia, J.; Martínez-Camblor, P.; Sierra, L.M. The Comet Assay in Drosophila: A Tool to Study Interactions between DNA Repair Systems in DNA Damage Responses In Vivo and Ex Vivo. Cells 2023, 12, 1979. [Google Scholar] [CrossRef]
  69. Gaivão, I.; Comendador, M.A. The w/w+ somatic mutation and recombination test (SMART) of Drosophila melanogaster for detecting reactive oxygen species: Characterization of 6 strains. Mutat. Res. 1996, 360, 145–151. [Google Scholar] [CrossRef]
  70. Kacsoh, B.Z.; Lynch, Z.R.; Mortimer, N.T.; Schlenke, T.A. Fruit flies medicate offspring after seeing parasites. Science 2015, 347, 1036–1039. [Google Scholar] [CrossRef] [PubMed]
  71. Hevia, A.; Delgado, S.; Sánchez, B.; Margolles, A. Molecular players involved in the interaction between beneficial bacteria and the immune system. Front. Microbiol. 2015, 6, 1285. [Google Scholar] [CrossRef] [PubMed]
  72. Han, S.K.; Lee, D.; Lee, H.; Kim, D.; Son, H.G.; Yang, J.-S.; Lee, S.-J.V.; Kim, S. OASIS 2: Online application for survival analysis 2 with features for the analysis of maximal lifespan and healthspan in aging research. Oncotarget 2016, 7, 35. [Google Scholar] [CrossRef]
  73. Woods, J.K.; Kowalski, S.; Rogina, B. Determination of the Spontaneous Locomotor Activity in Drosophila melanogaster. J. Vis. Exp. 2014, 86, 51449. [Google Scholar] [CrossRef]
  74. Nichols, C.D.; Becnel, J.; Pandey, U.B. Methods to Assay Drosophila Behavior. JoVE Neurosci. 2012, 61, 3795. [Google Scholar] [CrossRef]
  75. Gargano, J.W.; Martin, I.; Bhandari, P.; Grotewiel, M.S. Rapid iterative negative geotaxis (RING): A new method for assessing age-related locomotor decline in Drosophila. Exp. Gerontol. 2005, 40, 386–395. [Google Scholar] [CrossRef] [PubMed]
  76. Collins, A.R.; Oscoz, A.A.; Brunborg, G.; Gaivao, I.; Giovannelli, L.; Kruszewski, M.; Smith, C.C.; Stetina, R. The comet assay: Topical issues. Mutagenesis 2008, 23, 143–151. [Google Scholar] [CrossRef]
  77. Azqueta, A.; Meier, S.; Priestley, C.; Gutzkow, K.B.; Brunborg, G.; Sallette, J.; Soussaline, F.; Collins, A. The influence of scoring method on variability in results obtained with the comet assay. Mutagenesis 2011, 26, 393–399. [Google Scholar] [CrossRef]
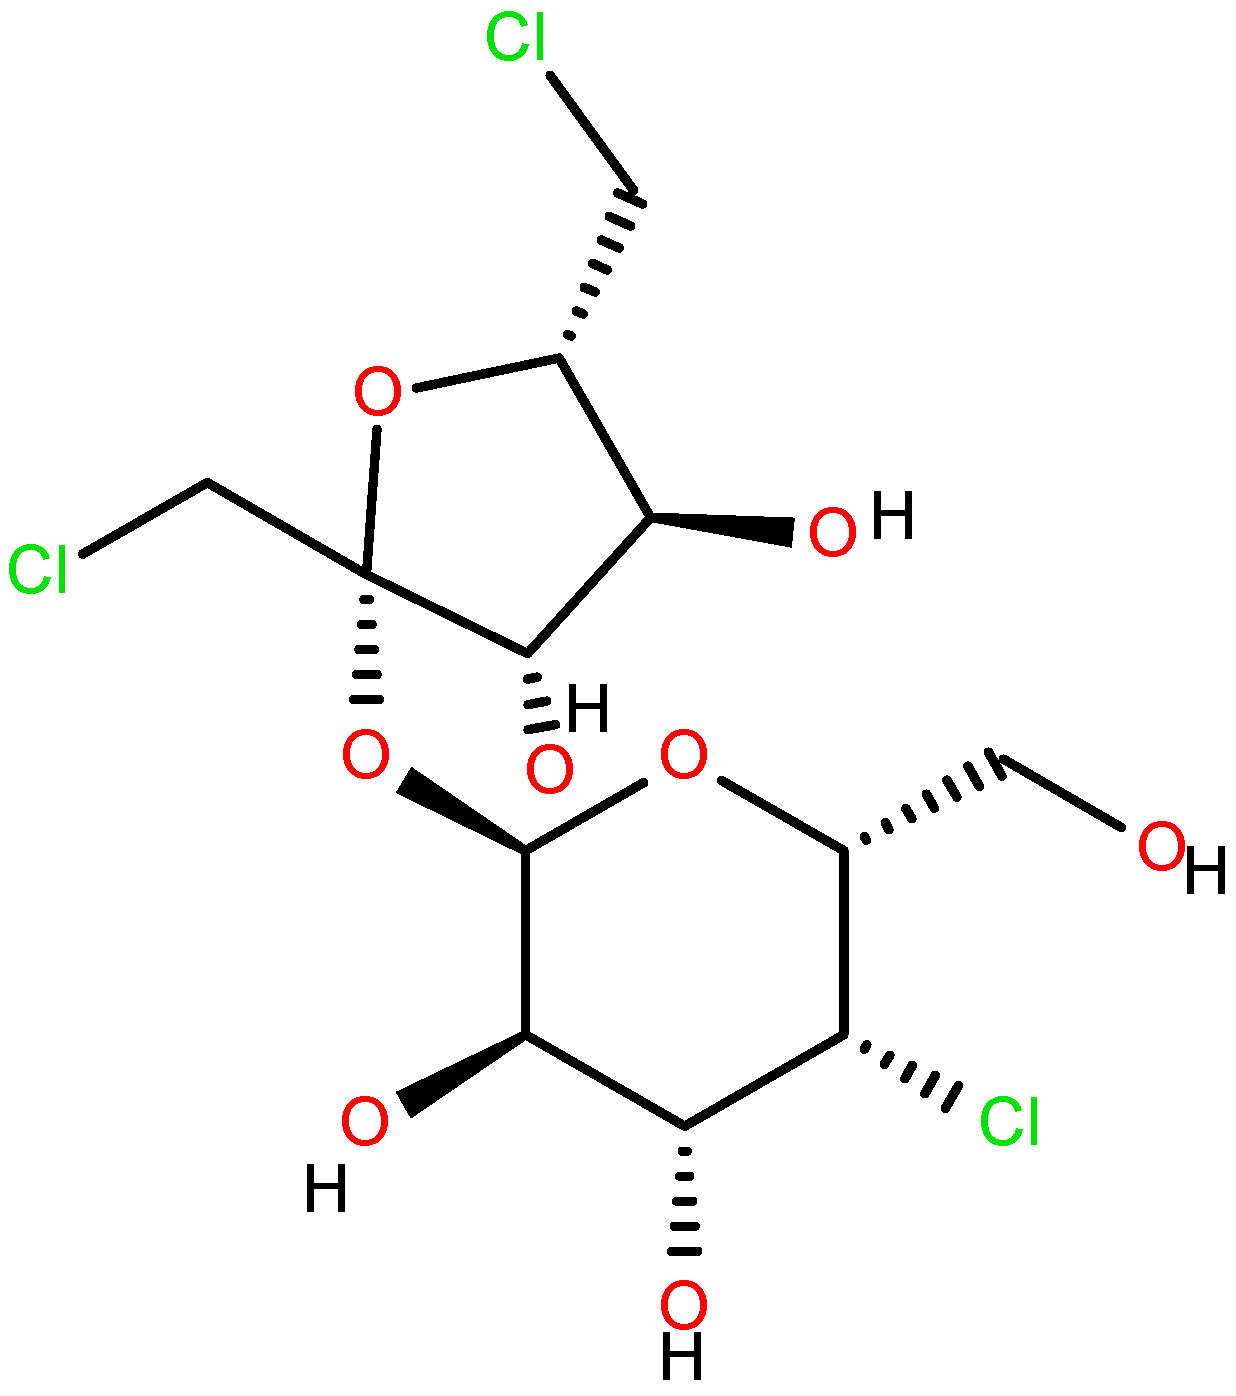
Figure 1. Sucralose.
Ijms 26 08951 g001
Figure 2. Sucralose synthesis from sucrose. Adapted from [6] with the corresponding permission.
Ijms 26 08951 g002
Figure 3. Sucralose among halogen organic compounds.
Ijms 26 08951 g003
Figure 4. Prolificacy assay showing the average number of eggs, larvae, and adult flies obtained from D. melanogaster cultures exposed to different dietary concentrations of sugar (sucrose): 0%, 5%, 15%, and 20%, compared to the control group (10% sucrose, standard medium). Data are presented as the mean ± standard deviation. * p < 0.05, ns p > 0.05.
Ijms 26 08951 g004
Figure 5. Prolificacy assay showing the average number of eggs, larvae, and adult flies obtained from D. melanogaster cultures exposed to dietary sucralose at concentrations of 0.25%, 0.5%, 1%, and 2%, compared to the control group (10% sucrose only). Data are presented as the mean ± standard deviation. *** p < 0.001.
Ijms 26 08951 g005
Figure 6. Kaplan–Meier survival curves for Drosophila melanogaster containing different concentrations of sucrose: 0%, 5%, 15%, and 20%, compared to the control group (10% sucrose). The survival probability is plotted over time (days).
Ijms 26 08951 g006
Figure 7. Kaplan–Meier survival curves for Drosophila melanogaster containing sucralose at concentrations of 0.25%, 0.5%, 1%, and 2%, compared to the control group (10% sucrose only). The survival probability is plotted over time (days).
Ijms 26 08951 g007
Figure 8. Results of the negative geotaxis assay in D. melanogaster cultured on media containing sucrose at concentrations of 0%, 5%, 15%, and 20% compared to the control group (10% sucrose). The average climbing time (in seconds) ± SD is presented separately for males and females. An asterisk (*) indicates a statistically significant difference (p < 0.05) compared to the control group. ‘ns’ indicates no statistically significant difference.
Ijms 26 08951 g008
Figure 9. Results of the negative geotaxis assay in D. melanogaster cultured on media containing sucralose at concentrations of 0.25%, 0.5%, 1%, and 2% compared to the control group (10% sucrose only). Average climbing time (in seconds) ± SD is shown separately for males and females. Data are presented as the mean ± standard deviation. * p < 0.05, ns p > 0.05.
Ijms 26 08951 g009
Figure 10. Exploration test from cultures containing sugar (sucrose) at concentrations of 0%, 5%, 15%, and 20%, as well as control data. Data are presented as the average distance (in cm) traveled in one minute in a Petri dish, separated by sex and presented as mean ± SD. “An asterisk (***) indicates a statistically significant difference (p < 0.001) compared to the control group”.
Ijms 26 08951 g010
Figure 11. Exploration test from cultures containing sucralose at concentrations of 0.25%, 0.5%, 1%, and 2%, as well as control data. Data are presented as the mean distance in cm traveled in one minute in a Petri dish. Data are presented as the mean ± standard deviation. *** p < 0.001.
Ijms 26 08951 g011
Figure 12. The results of the in vivo comet assay show the percentage of DNA damage in the neuroblasts of larval brains in cultures with 0%, 5%, 15% and 20% sucrose, alongside control data (10%). Data are presented as the mean ± standard deviation (SD). An asterisk (***) indicates a statistically significant difference (p < 0.001) compared to the control group. ‘ns’ indicates no statistically significant difference.
Ijms 26 08951 g012
Figure 13. Comet assay results show the percentage of DNA damage in neuroblasts from D. melanogaster larval brains in cultures with 0.25%, 0.5%, 1%, and 2% sucralose, along with control data. Data are presented as mean ± standard deviation (SD). An asterisk (** and ***) indicates a statistically significant difference (p < 0.001) compared to the control group. ‘ns’ indicates no statistically significant difference.
Ijms 26 08951 g013
Table 1. Constituents of the standard culture medium.
IngredientsAmount (Per Liter in Distilled Water)
Sucrose100 g
Agar-agar12 g
Inactive yeast100 g
Propionic acid5 mL
Disclaimer/Publisher’s Note: The statements, opinions and data contained in all publications are solely those of the individual author(s) and contributor(s) and not of MDPI and/or the editor(s). MDPI and/or the editor(s) disclaim responsibility for any injury to people or property resulting from any ideas, methods, instructions or products referred to in the content.