Article

The Odorant-Binding Proteins AspiOBP1 and AspiOBP2 in Aleurocanthus spiniferus Are Involved in the Perception of Host Volatiles

State Key Laboratory of Wheat Improvement, College of Plant Protection, Shandong Agricultural University, Tai’an 271000, China
*
Author to whom correspondence should be addressed.
Int. J. Mol. Sci. 2025, 26(18), 8784; https://doi.org/10.3390/ijms26188784
Submission received: 11 August 2025 / Revised: 1 September 2025 / Accepted: 7 September 2025 / Published: 9 September 2025
(This article belongs to the Section Molecular Plant Sciences)

Abstract

Aleurocanthus spiniferus, an invasive pest native to Southeast Asia, exhibits rapid dispersal capacity and high eradication resistance. In recent years, there have been continuous records of its invasion into new host plants. Odorant-binding proteins (OBPs) are essential at the peripheral level of olfaction, and their olfactory function has been partially confirmed by research. This study explores the functions of key OBPs mediating host selection by measuring the in vivo and in vitro binding capabilities of OBPs from A. spiniferus to host volatiles. Under exposure to more than five host volatiles, the two OBPs, AspiOBP1 and AspiOBP2, exhibited significant differential transcriptional regulation. AspiOBP1 exhibited good binding affinity to (Z)-3-hexenol and 3-carene, and with binding energies greater than −3 kcal/mol, ARG-79 might be the critical amino acid site for AspiOBP1 binding to host volatiles. AspiOBP2 exhibited no binding to any of the six tested volatiles in fluorescent competitive binding assays. Adults fed with dsAspiOBP1 showed significantly reduced behavioral and EAG responses to the attractant 3-carene and two repellents [(Z)-3-hexenol and nonanal]. Adults fed with dsAspiOBP2 lost both behavioral and EAG responses to the attractant 3-carene and the repellent (Z)-3-hexenol. The findings of this study not only elucidate the binding mechanisms between OBPs of A. spiniferus and host volatiles but also provide new targets for the future development of novel plant-derived insecticides and RNA-based pesticides to control this pest.

1. Introduction

Aleurocanthus spiniferus (Quaintance) belongs to the order Hemiptera, family Aleyrodidae. Adults congregate and pierce-suck on tender leaves, while all larval stages except the first-instar larvae remain stationary on the undersides of leaves, feeding by piercing and sucking [1]. The honeydew excreted by this pest promotes the growth of sooty mold, which significantly reduces the photosynthetic efficiency of leaves [1]. These characteristics present significant control and management challenges. It has been recognized as an invasive pest native to Southeast Asia. Within a century, it had spread rapidly to Asia, Africa, the Americas, Australia, the Pacific Islands, and other regions [2,3,4,5]. The first detection of this species in the EPPO (European and Mediterranean Plant Protection Organization) regions occurred in 2008 in the Lecce district of the Apulia region, located in southeastern Italy, marking its initial reported presence in these areas [6]. Since then, the pest rapidly expanded to the southwestern regions of Italy and was also detected in the Balkan Peninsula, showing a trend of further northward invasion towards France [7,8]. It is considered one of the major threats to citrus production in Asia, Australasia, and the Nearctic zone [5,7,9]. Except for the main elective hosts Citrus spp. and Theaceae, A. spiniferus was recorded on several botanical families, e.g., Rosaceae, Leguminosae, Moraceae, Vitaceae, Punicaceae, Simaroubaceae, Ericaceae, Ranunculaceae, Anacardiaceae, and is still in the process of adapting to new hosts [1,7,10].
Odorant-binding proteins (OBPs) are small extracellular proteins whose main function is to capture odors and pheromones, and transport them to receptors [11,12]. Recently, olfactory-related proteins in A. spiniferus have been identified through transcriptomic analysis, with five OBPs being detected. These OBP genes are predominantly expressed in the head (including the antennae) [13]. OBPs are capable of recognizing a variety of volatile compounds [14,15] and act as chemosensory solubilizers, transporters, and ligand filters, mediating the activation of odorant receptors (ORs) [16]. Access to recombinant proteins has generated comprehensive data on OBPs’ binding affinities, molecular docking with bioactive compounds, and their well-characterized three-dimensional crystal structures [17,18,19]. Classic OBPs are defined by their structural feature of six α-helices linked by three disulfide bonds [20] and represent the most extensively studied and reviewed subfamily of OBPs to date [14,21,22,23,24]. The sequence motif patterns can vary significantly among different OBP subfamilies. For instance, the atypical OBP subfamily features additional cysteines in the C-terminal region [20], the minus-C OBP subfamily is characterized by only four cysteine residues [25,26], and the plus-C OBP subfamily contains three extra cysteines along with a conserved proline [21]. The diversity and non-homology of OBPs among insect genera can serve as an advantage for developing species-specific semiochemicals and even insecticides. This will further advance the use of OBPs as targets and tools for designing pest control agents.
Host volatiles play a crucial role as signaling chemicals in the interactions between insects and their host plants [27,28]. (E)-2-hexenal, linalool, nonanal, 3-carene, hexanol, and (Z)-3-hexenol have been confirmed to be present in the volatile compounds emitted by the leaves or fruits of the host plants of A. spiniferus [29,30,31,32,33,34,35]. Previous studies have demonstrated that (E)-2-hexenal, linalool, 3-carene, and hexanol act as attractants for A. spiniferus, while nonanal and (Z)-3-hexenol function as repellents [36]. These compounds influence the host-selection behavior of A. spiniferus across tea cultivars, identifying them as key chemicals for exploring this pest’s chemical ecology [37]. Nevertheless, the precise role of OBPs in A. spiniferus in detecting these volatile organic compounds remains mechanistically elusive.
In this study, volatile-induced expression alteration was used to preliminarily screen key AspiOBPs that may be involved in the perception of six volatiles. Fluorescence binding assay and molecular docking were used to validate the in vitro binding ability of key AspiOBPs with six ligands and to predict the key binding sites. Finally, we explored the role of AspiOBPs in sensing host volatiles. This study aims to provide deeper insights into the olfactory mechanisms whereby A. spiniferus identifies host volatiles, which will contribute to the advancement of new control strategies such as RNA pesticides and innovative synthetic compounds.

2. Results

2.1. Host Volatiles-Induced Changes in AspiOBPs Expression

When exposed to the attractant 3-carene, AspiOBP3 was significantly upregulated, while AspiOBP1, AspiOBP2, and AspiOBP7 were significantly downregulated (Figure 1a and Table A1). The attractant (E)-2-hexenal induced a notable upregulation of AspiOBP1, while AspiOBP2, AspiOBP3, and AspiOBP5 were significantly downregulated (Figure 1b and Table A1). Exposure to the attractant linalool resulted in significant downregulation of AspiOBP1 and AspiOBP3 (Figure 1c and Table A1). The attractant hexanol induced a marked downregulation of AspiOBP2 (Figure 1d and Table A1). AspiOBP1, AspiOBP2, and AspiOBP5 were significantly downregulated under the influence of the repellent (Z)-3-hexenol (Figure 1e and Table A1). The repellent nonanal induced significant downregulation of AspiOBP1, AspiOBP2, AspiOBP3, and AspiOBP5 (Figure 1f and Table A1). After treatment with more than five compounds, the relative expression levels of AspiOBP1 and AspiOBP2 underwent significant changes.

2.2. Fluorescence Binding Property Analysis

After removing the signal peptide and terminator, the recombinant AspiOBP1 and AspiOBP2 were successfully induced and expressed in E. coli (Figure 2). Their predicted molecular weights were approximately 16 and 27 kDa, respectively. However, due to the extremely low expression level of AspiOBP1, binding analysis could not be performed. Therefore, we only evaluated the binding affinity of recombinant AspiOBP2 with six host volatiles. The results showed that the Kd value of the AspiOBP2/bis-ANS complex was 2.26 ± 0.47 μmol/L (Figure 3). AspiOBP2 did not bind to any of the tested ligands (Figure 3).

2.3. Three-Dimensional Modeling and Molecular Docking

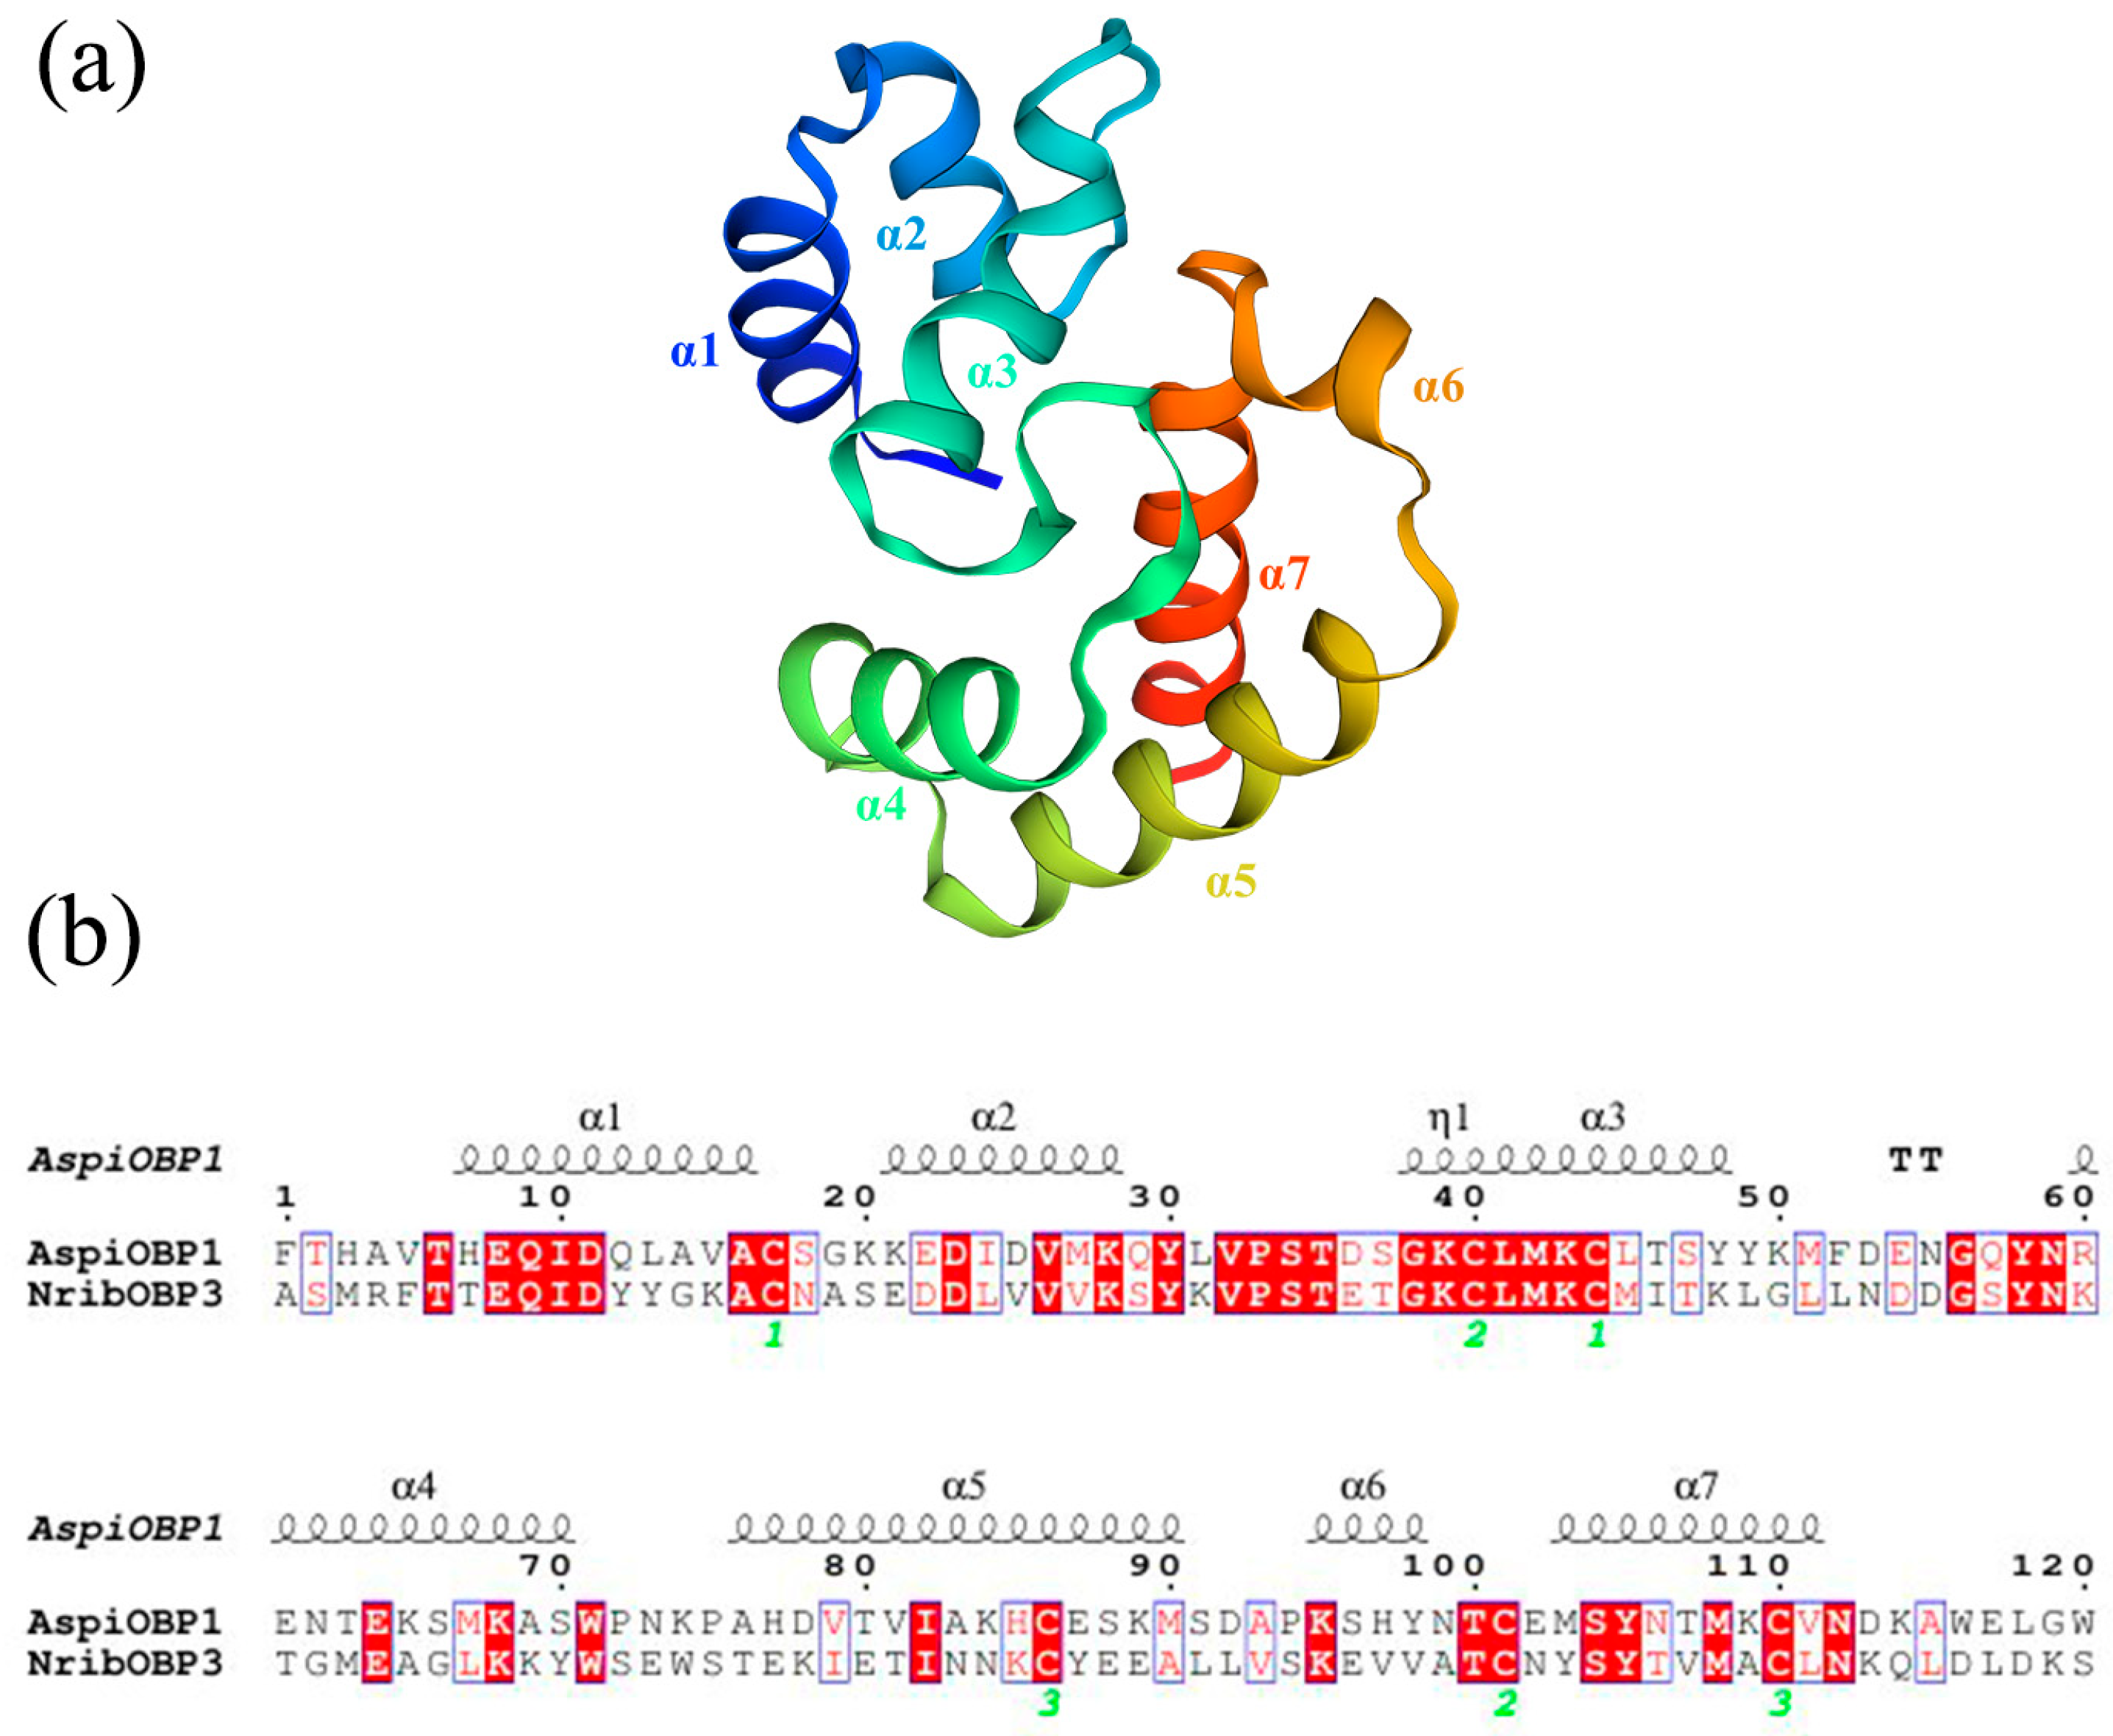
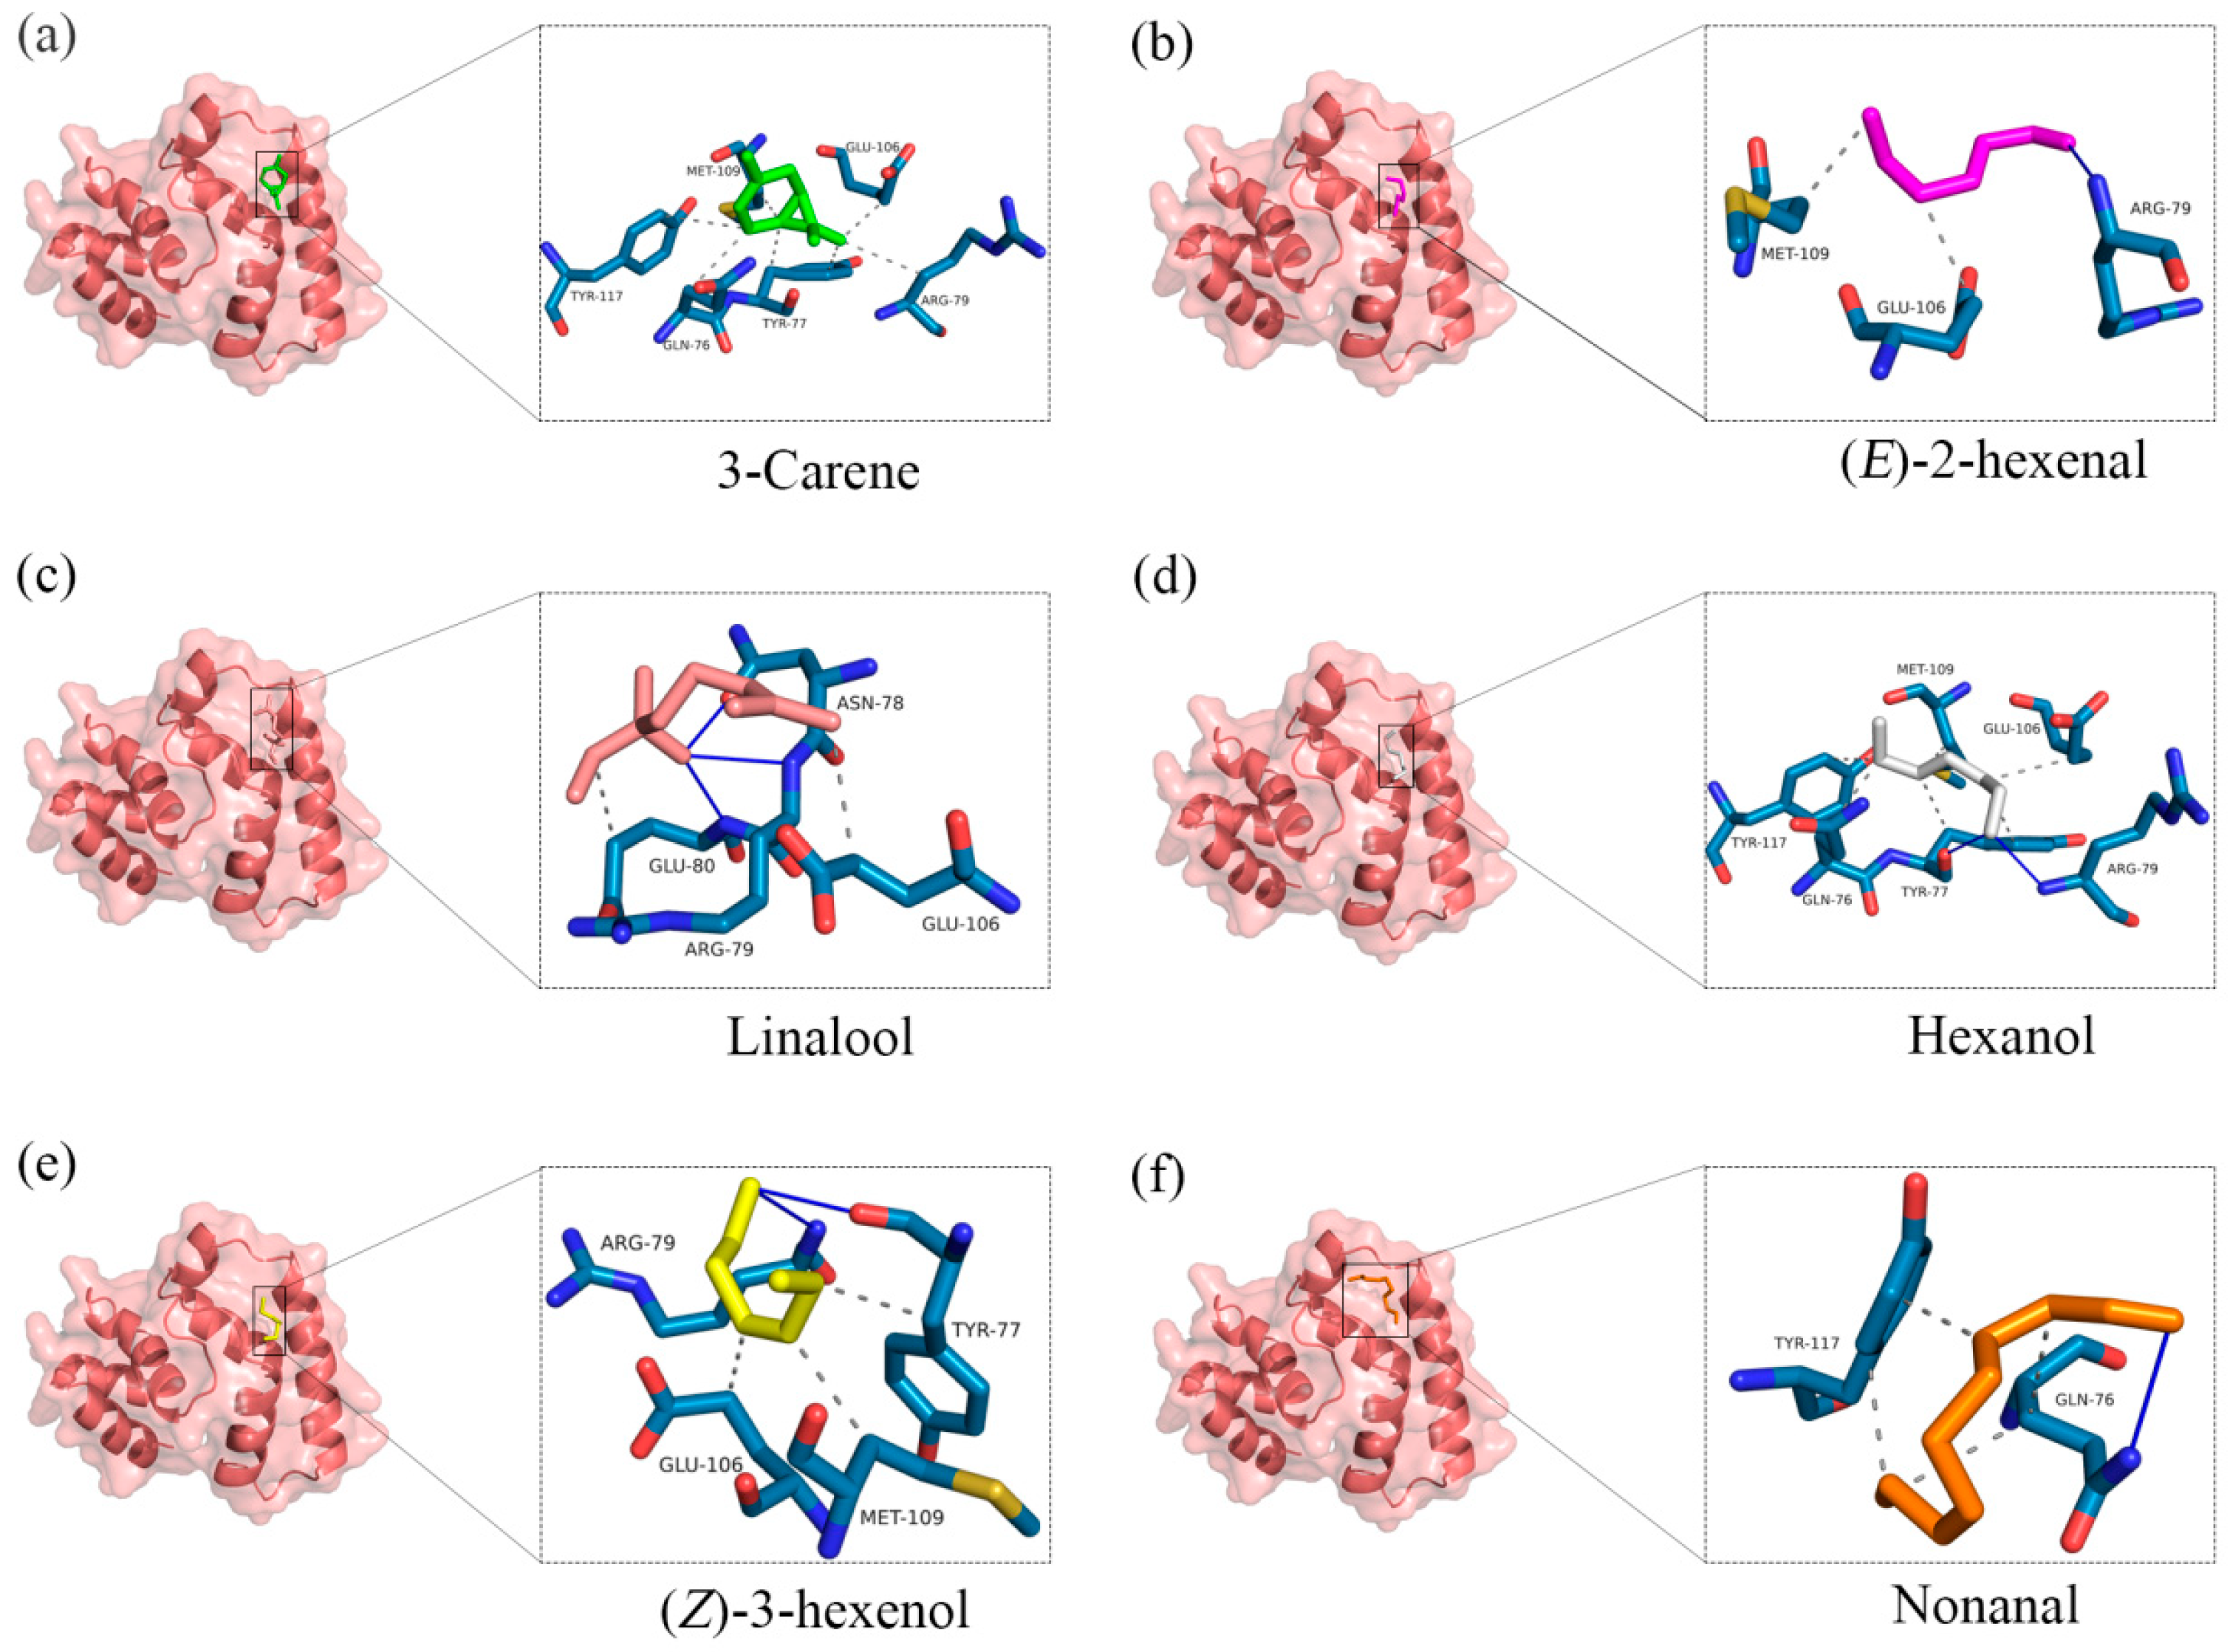
Due to the low expression level of AspiOBP1, it was not possible to evaluate its in vitro binding capacity using the fluorescence competitive binding assay. Therefore, this study conducted protein model prediction and molecular docking for AspiOBP1. Furthermore, this study did not obtain a qualified protein model for AspiOBP2. The protein model of AspiOBP1 was constructed using the SWISS-MODEL website (Figure 4), and its secondary structure was analyzed (Table A2). Molecular docking experiments were performed using Autodock 4.2.6 software to dock 3-carene, hexanol, (E)-2-hexenal, (Z)-3-hexenol, nonanal, and linalool with the three-dimensional model of AspiOBP1 (Figure 5). The docking energies between AspiOBP1 and each ligand were calculated (Table 1). The hydrophobic interactions and hydrogen bonds between AspiOBP1 and each ligand were analyzed using the “Protein-Ligand Interaction Profiler” website (Table A4 and Table A5).
The results showed that all docking binding energies were negative, with the binding energy between AspiOBP1 and (Z)-3-hexenol being −3.1 kcal/mol (Table 1), indicating the best binding characteristics. This was followed by 3-carene and (E)-2-hexenal, with binding energies of −3.07 and −2.47 kcal/mol, respectively (Table 1). The potential interacting residues of AspiOBP1 within a 4 Å range around the ligands were all hydrophobic residues, mainly including TYR-77, ARG-79, GLU-106, and MET-109 (Figure 5; Table A4). Additionally, ARG-79 formed hydrogen bonds with two attractants [hexanol, (E)-2-hexenal, and linalool] and one repellent [(Z)-3-hexenol], with bond lengths of 2.03, 1.85, 2.53, and 2.23 Å, respectively (Figure 5; Table A5).

2.4. RNAi Experiments of AspiOBP1 and AspiOBP2

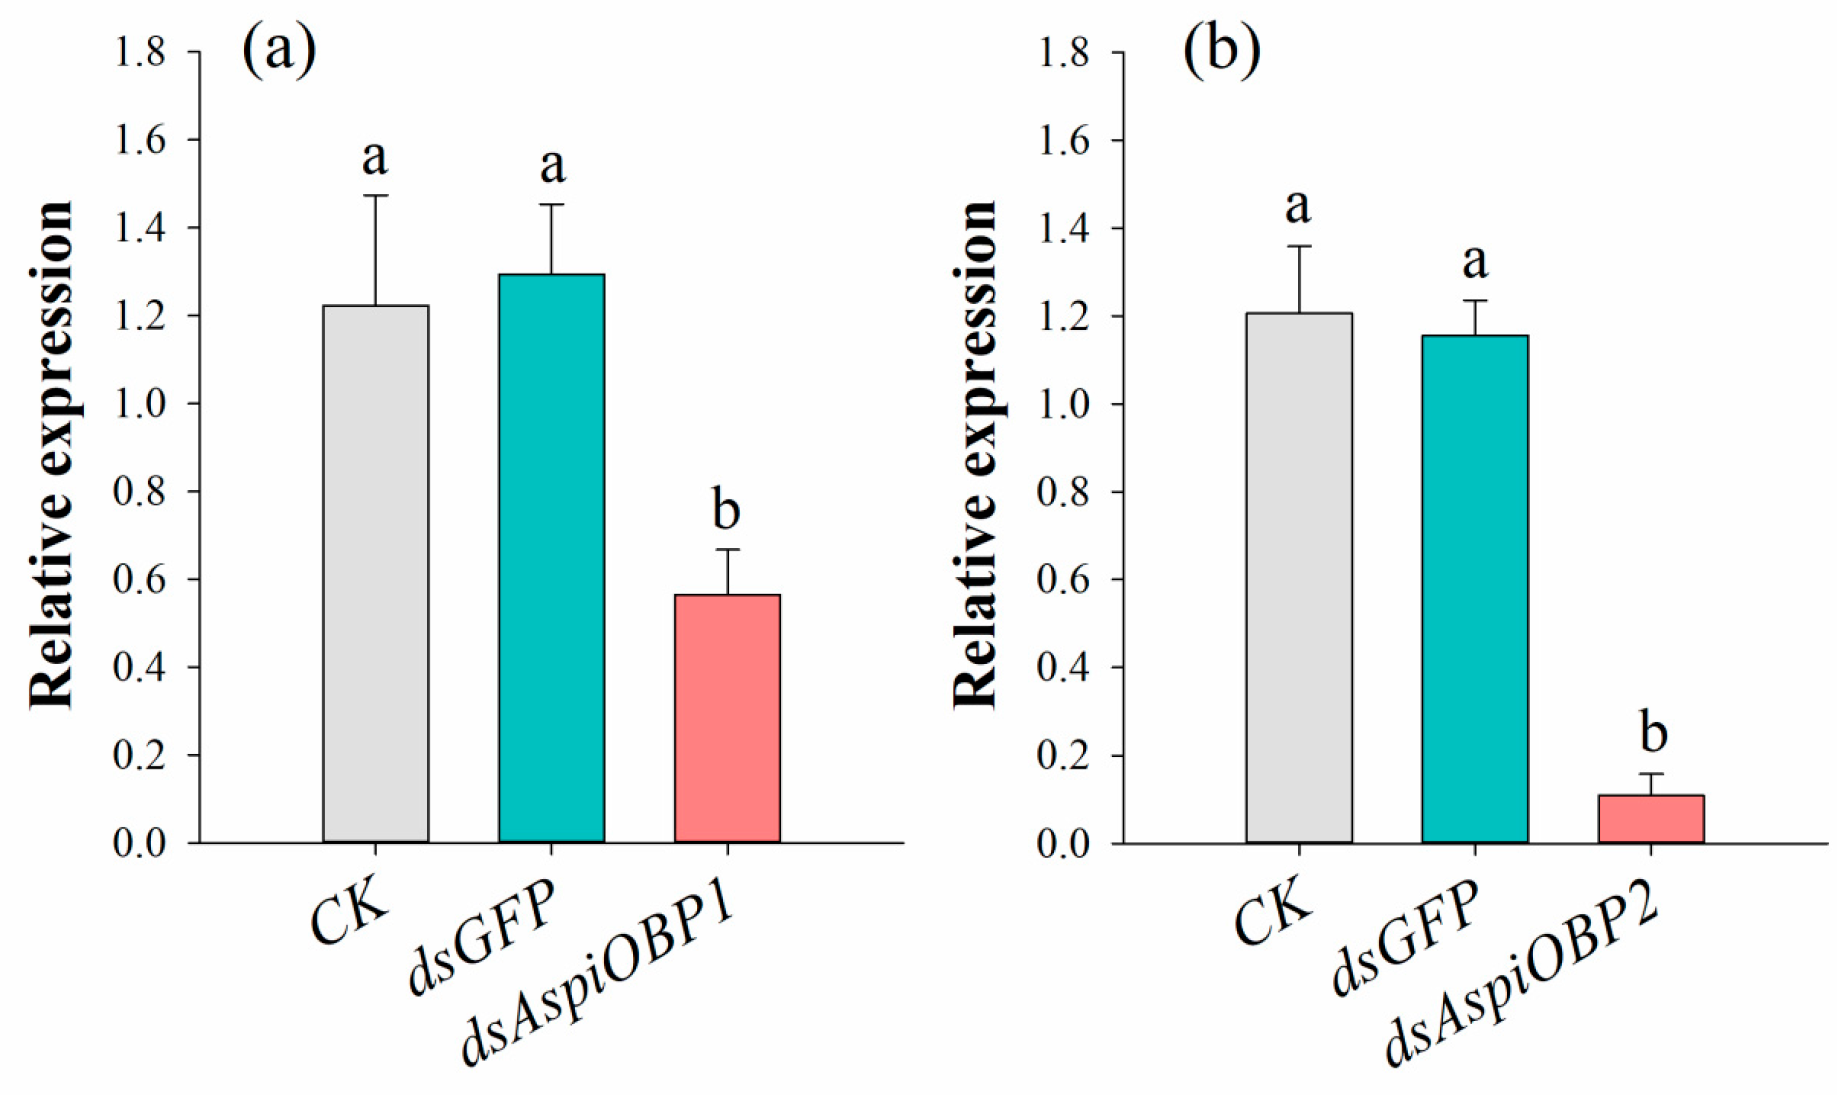
As shown in Figure 6, compared to the control treated with distilled water (CK), the expression levels of AspiOBP1 and AspiOBP2 were significantly reduced by 53.82% and 90.97%, respectively, following treatment with dsAspiOBP1 and dsAspiOBP2.
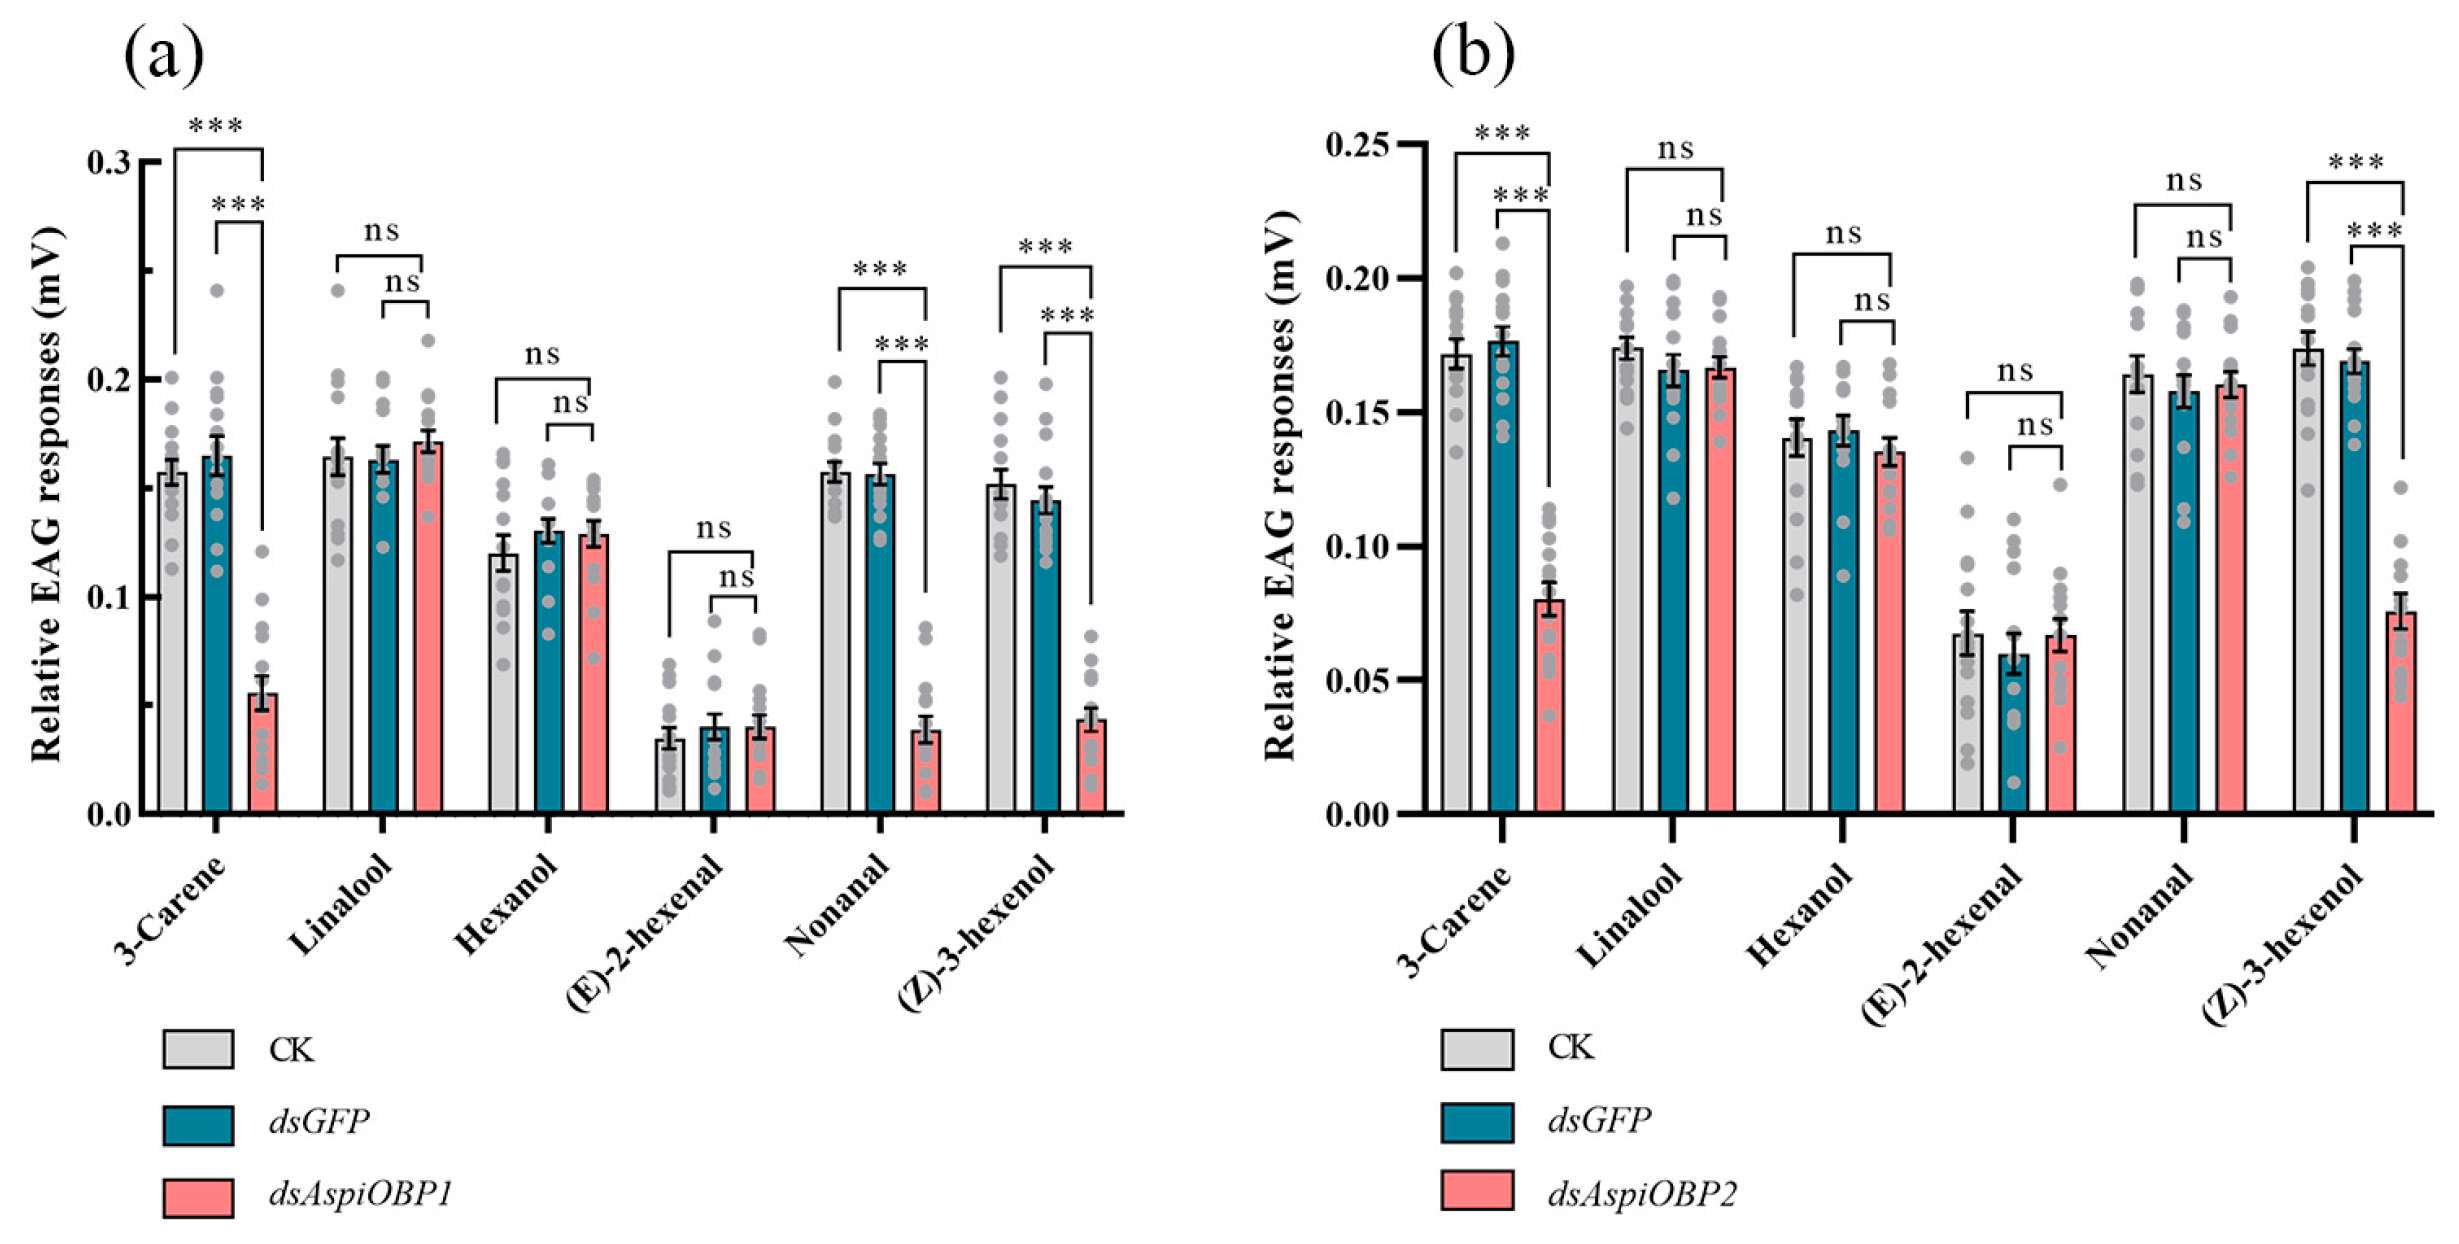
EAG tests revealed that, compared to the control (CK and dsGFP), adults fed with dsAspiOBP1 exhibited significantly reduced EAG responses to 3-carene, nonanal, and (Z)-3-hexenol, while adults fed with dsAspiOBP2 showed significantly reduced EAG responses to 3-carene and (Z)-3-hexenol. However, both the control and the dsAspiOBPs-treated treatments displayed low EAG responses to (E)-2-hexenal (Figure 7).
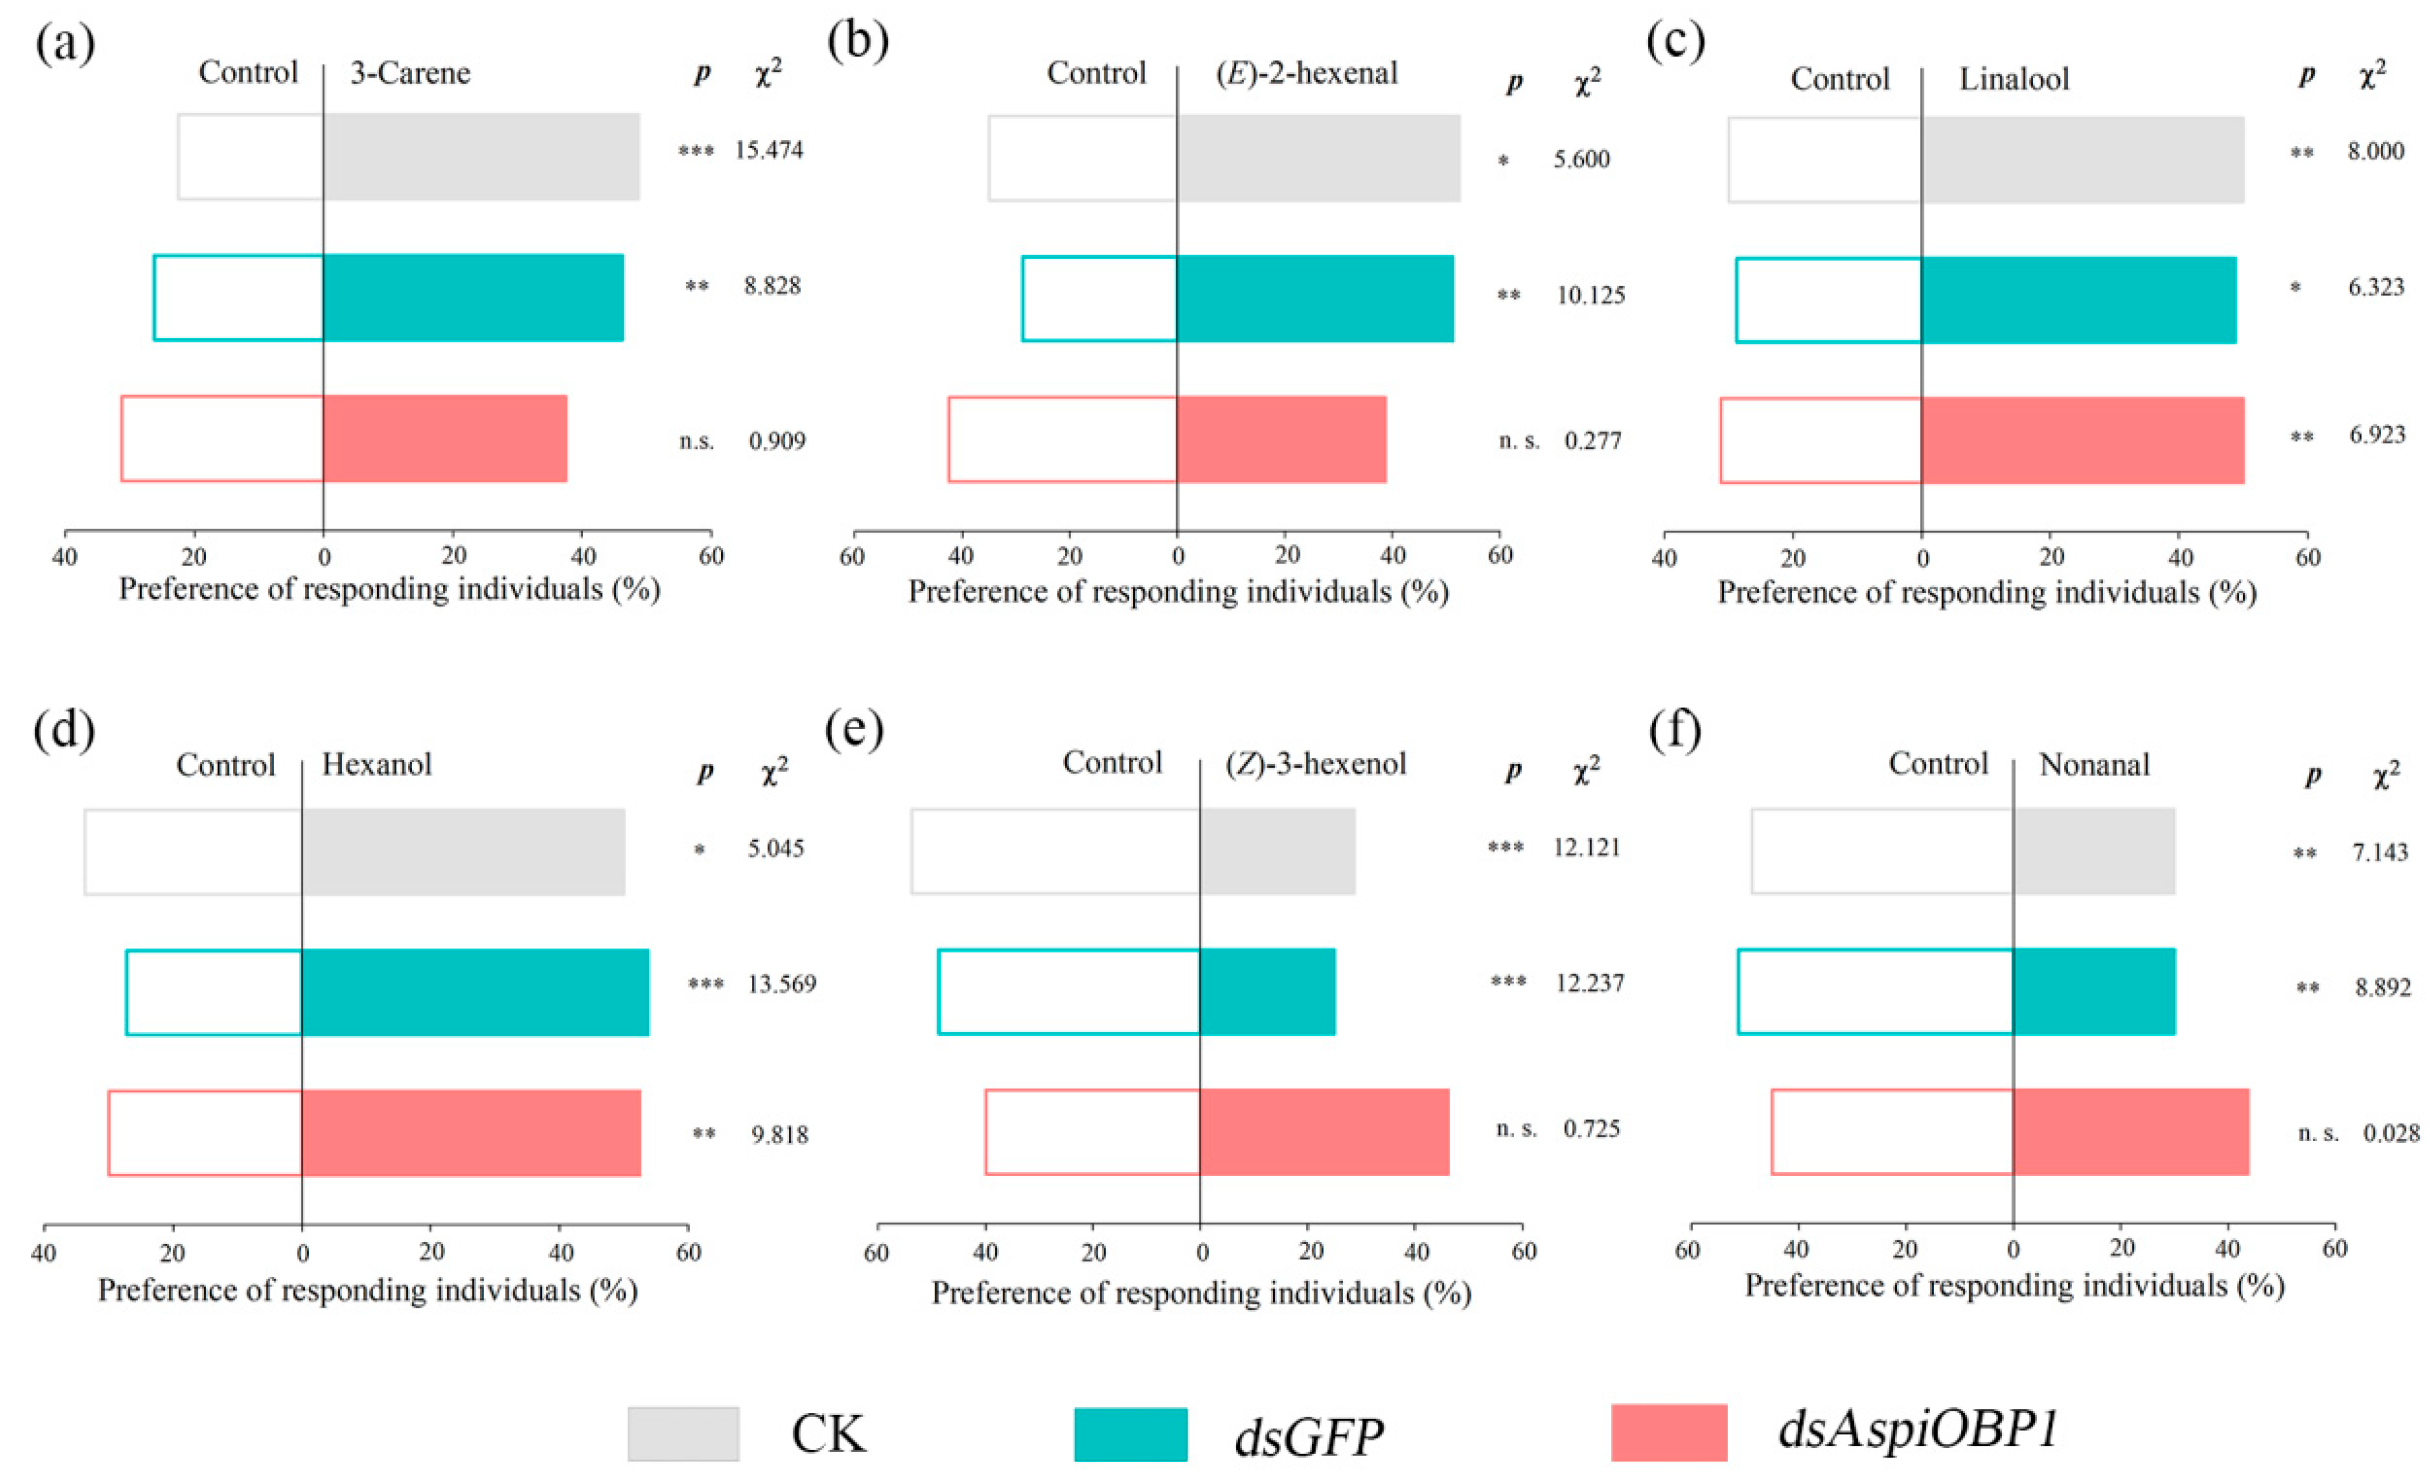
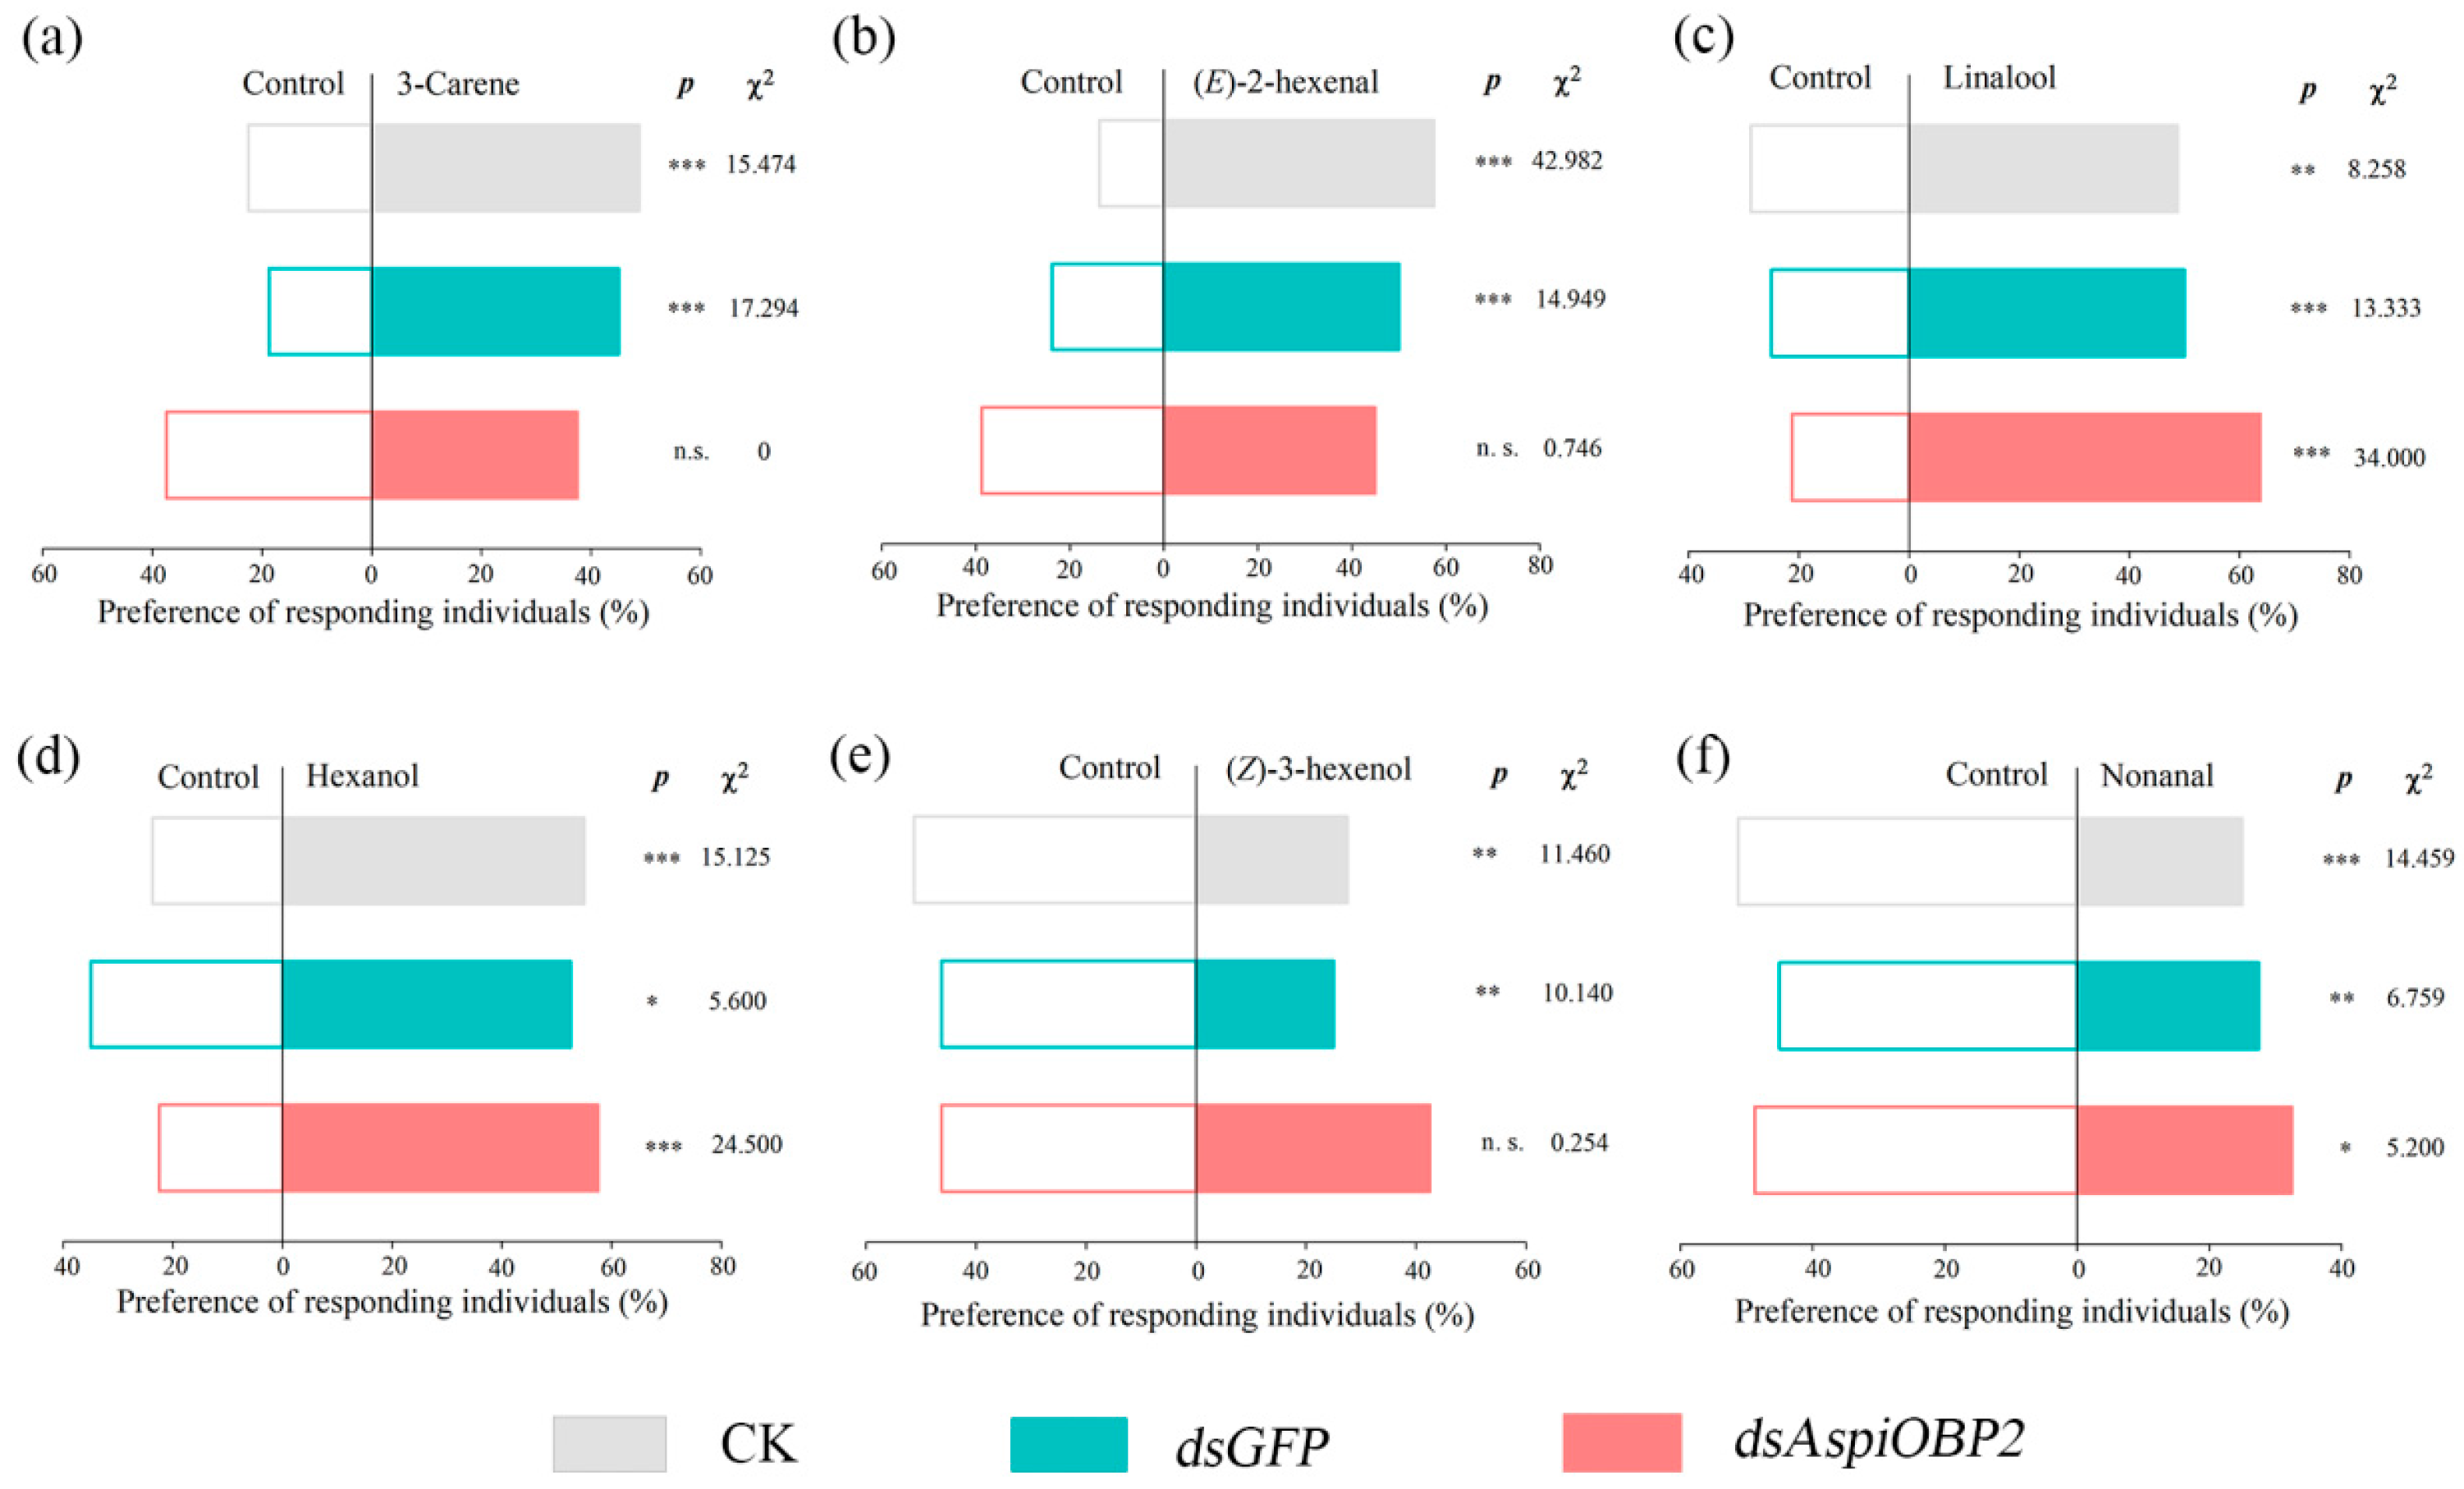
Y-tube olfactometer tests showed that, compared to the control (CK and dsGFP), adults fed with dsAspiOBP1 exhibited reduced behavioral responses to two attractants [3-carene, (E)-2-hexenal] and two repellents [(Z)-3-hexenol, nonanal] (Figure 8). Adults fed with dsAspiOBP2 lost behavioral responses to two attractants [3-carene, (E)-2-hexenal] and one repellent [(Z)-3-hexenol] (Figure 9).

3. Discussion

Recent studies have shown that exposure to odorants can lead to changes in the transcription of olfactory receptor genes associated with the reception of these odorants [38]. This technique is referred to as deorphanization of receptors based on expression alteration of mRNA levels (DREAM) [38]. Previous studies have utilized this method for the preliminary screening of key CSPs in A. spiniferus [36], as well as for the functional characterization of OBPs in other insects, such as HoblOBP and DcitOBP [39,40]. In this study, we analyzed the changes in the transcriptional levels of AspiOBPs induced by six host volatiles. The results revealed that the transcriptional levels of AspiOBP1 and AspiOBP2 were significantly up- or down-regulated after treatment with more than five compounds. Therefore, we focused on AspiOBP1 and AspiOBP2 to analyze their roles in the recognition of plant volatiles. Most importantly, changes in gene expression following exposure to significant plant volatiles can provide a pathway for identifying key plant volatiles that interact with crucial olfactory proteins among a vast array of plant volatiles [41].
Fluorescence competitive binding assays are commonly used to analyze the interactions between insect OBPs and ligands [22,42,43], and their reliability has been demonstrated through in vivo experiments [44,45]. Since AspiOBP2 is known to be highly expressed in the heads of A. spiniferus adults [13], we employed the fluorescence competitive binding assay to analyze the binding properties of recombinant AspiOBP2 protein with host volatiles. Unfortunately, AspiOBP2 does not bind to any of the six host volatiles. However, when the expression of the AspiOBP2 gene was knocked down, A. spiniferus adults lost their behavioral responses to two attractants [3-carene, (E)-2-hexenal] and one repellent [(Z)-3-hexenol]. In insects, various types of OBPs contribute to olfactory perception, often exhibiting combinatorial recognition through functional complementation or interaction [46,47]. Therefore, disrupting the expression of a single OBP may have complex effects on the expression of other OBPs. Nevertheless, fully understanding the intricate mechanisms of olfactory reception remains a significant challenge.
Some key residues located within the hydrophobic cavity are believed to facilitate the odorant-binding interactions between OBPs and their ligands [48,49]. Due to the inability to obtain highly expressed AspiOBP1 for in vitro binding assays, we utilized SWISS-MODEL to generate a structural model of AspiOBP1 and evaluated its binding energy with selected odorants. 3-Carene and (Z)-3-hexenol exhibited good binding affinities, with binding energies of −3.07 and −3.1 kcal/mol, respectively. 3-Carene was found to reside within a hydrophobic cavity formed by six amino acid residues (GLN-76, TYR-77, ARG-79, GLU-106, MET-109, TYR-117) without forming hydrogen bonds. This suggests that hydrophobic interactions alone can achieve good binding affinity. Hydrophobic interactions play a crucial role in mediating ligand binding, as their function is not constrained by the strict geometric requirements of intermolecular interactions such as hydrogen bonding [50,51,52]. Although the binding energy between AspiOBP1 and linalool is the lowest at −1.78 kcal/mol, it still forms hydrophobic interactions with two amino acid residues (GLU-80, GLU-106) and establishes hydrogen bonds with three amino acid residues (ASN-78, ARG-79, GLU-80). This demonstrates that the binding capability between proteins and ligands is influenced by multiple factors and is not solely dependent on the number of hydrophobic interactions or hydrogen bonds formed.
RNA interference (RNAi) triggered by dsRNA represents a groundbreaking technology for investigating the functions of specific target genes and is regarded as an effective tool for pest control [53]. Feeding is the most efficient method for delivering dsRNA into adult insects [40]. Although the transcription of AspiOBP1 could not be completely silenced, partial knockdown significantly reduced the EAG and behavioral responses of A. spiniferus adults to certain tested volatiles [3-carene, nonanal, and (Z)-3-hexenol]. Similar results have also been observed in AgosOBP2, AlinOBP4, and DcitOBP7 [40,54,55].
Irrespective of OBP gene interference, the EAG responses to (E)-2-hexenal remained consistently low, aligning with the findings of our prior research [36]. Research has shown that not all insect OBP genes involved in olfactory functions are specifically expressed in the antennae [13]. Some OBPs are also widely expressed in non-olfactory tissues, such as mouthparts, legs, midguts, glands, and other non-olfactory tissues [56]. Similar to TcOBPC12, which exhibits high expression levels in the epidermis, this suggests that OBPs might play roles in additional physiological processes beyond olfactory detection [57]. The OBPs responsible for sensing (E)-2-hexenal could potentially be located in tissues other than the antennae, and further investigations, such as immunolocalization analyses, are necessary to confirm this hypothesis.
In the EAG tests, the antennal responses of A. spiniferus to each tested volatile were generally weak, with an average amplitude below 0.2 mV. Similar results have been observed in the responses of Diaphorina citri to host volatiles, which may be related to the relatively low number of olfactory receptors on their antennae. Only 11 receptors were found on each antenna of both female and male D. citri [40]. This conclusion, however, does not seem to apply to A. spiniferus, as its antennae possess a rich variety and quantity of sensilla [13]. An almost possible explanation is that the shorter antennae (Female: 296 ± 11 μm; Male: 247 ± 7 μm) of A. spiniferus limit their chances of getting good EAGs [13].

4. Materials and Methods

4.1. Insect Collection and Chemicals

Adult A. spiniferus specimens were collected from tea plants at Shandong Qianrun Ecological Agriculture Development Co., Ltd. in Tai’an, Shandong Province, China (32°08′ N, 117°43′ E). After collection, the adults were acclimated in environmental incubators set to 26 ± 2 °C, 70 ± 5% RH, and a 16 L: 8 D photoperiod for 24 h. During this period, approximately 90% of the adults were able to survive. Because the male sex ratio was low, preventing us from obtaining sufficient males for experiments, 1-day-old adult females and males were combined for testing. Hexane (analytical grade; Tianjin Kaitong Chemical Reagent Co. Ltd., Tianjin, China) served as the solvent. The following compounds were purchased from Macklin Inc. (Shanghai, China): 3-Carene (90%, CAS: 13466-78-9), (Z)-3-hexenol (98%, CAS: 928-96-1), hexanol (99%, CAS: 111-27-3), linalool (98%, CAS: 78-70-6), (E)-2-hexenal (98%, CAS: 6728-26-3), and nonanal (96%, CAS: 124-19-6).

4.2. Formatting of Mathematical Components

The volatile induction experiment was conducted following the methodology described by Jia et al. [36]. The tested compounds were prepared at a concentration of 100 μg/μL, with hexane used as the solvent. In a 20 mL glass vial, 100 adults were introduced. A filter paper strip (1 × 1 cm) soaked with 10 μL of the compound solution was placed inside the vial. The control group was treated with hexane alone. Both the control and experimental groups were maintained in an incubator under conditions of 26 ± 2 °C, 70 ± 5% relative humidity, and a photoperiod of 16 L: 8 D. After 4 h of exposure, the adults were transferred to cryotubes, flash-frozen in liquid nitrogen, and stored at −80 °C. Each treatment was replicated four times.
The relative transcript abundance of five AspiOBPs before and after compound induction was detected using the CFX96 Real-Time System (Bio-Rad, Hercules, CA, USA). The reaction mixture (20 μL) consisted of 10 μL of 2× ChamQ SYBR qPCR Master Mix (Vazyme, Nanjing, China), 1 μL each of forward and reverse primers, and 8 μL of cDNA (diluted 10-fold). A three-step PCR protocol was employed: initial denaturation at 94 °C for 30 s (1 cycle), followed by 40 cycles of amplification at 95 °C for 5 s and 60 °C for 30 s. The melting curve of the PCR products was measured under the conditions of 95 °C for 15 s, 60 °C for 1 min, and 95 °C for 15 s. Each sample was subjected to four technical replicates and four biological replicates. Gene expression levels were quantified using the 2−ΔΔCt relative quantification method [58]. The relative expression levels after the control (CK) and compound treatments were analyzed using a two-tailed Student’s t-test.

4.3. Gene Cloning and Sequence Analysis

All gene sequences and expression data were obtained from the NCBI Sequence Read Archive (SRA) database under the accession number PRJNA792195. The signal peptide-coding sequences of AspiOBP genes were removed. Based on the open reading frame (ORF) sequences of the genes and the restriction sites of the expression vector pET-30a (+), protective base sequences and specific restriction enzyme recognition sequences were added to the 5′ end of the primers (Table A3). The recognition sequences for EcoRI and BamHI enzymes (Vazyme, Nanjing, China) were G^AATTC and G^GATCC, respectively.
Total RNA was extracted from adult A. spiniferus using a total RNA extraction kit (Vazyme, Nanjing, China). RNA integrity was verified by 1% agarose gel electrophoresis, and its purity was preliminarily assessed. The RNA concentration was measured using an Eppendorf BioPhotometer D30 (Eppendorf AG, Hamburg, Germany). An RNA sample was considered qualified if both the A260/A230 and A260/A280 ratios fell within the range of 1.8 to 2.2. cDNA was synthesized using a cDNA synthesis kit (Vazyme, Nanjing, China) in a total reaction volume of 20 μL. The target gene fragments were amplified from the cDNA. The 50 μL PCR reaction consisted of 25 μL of 2× Taq Plus Master Mix II, 1 μL each of forward and reverse primers, 5 μL of template DNA, and 18 μL of ddH2O. The PCR amplification program included an initial denaturation at 95 °C for 3 min, followed by 35 cycles of denaturation at 95 °C for 15 s, annealing at 60 °C for 20 s, and extension at 72 °C for 45 s, with a final extension at 72 °C for 10 min. The PCR products were purified and verified by 1% agarose gel electrophoresis. Qualified PCR products were stored at −20 °C for subsequent recombination experiments.
The pET-30a (+) vector was digested with the selected enzymes. The 50 μL digestion reaction consisted of 1 μg of plasmid, 5 μL of 10× rcutsmart Buffer, 1 μL each of BamHI and EcoRI, and ddH2O to make up the volume. The reaction was carried out at 37 °C for 90 min, followed by 65 °C for 20 min. The linearized vector obtained was used for recombination experiments. The target fragments were recombined with the vector using the Clon Express® II One Step Cloning Kit (Vazyme, Nanjing, China). The 20 μL recombination reaction consisted of 4 μL of linearized vector, 4 μL of the target gene, 4 μL of Buffer, 2 μL of Exnase II, and 6 μL of ddH2O. The reaction was performed at 37 °C for 30 min. The recombinant plasmids were transformed into DH5α competent cells (Vazyme, Nanjing, China). Bacterial cultures with correct amino acid sequences were selected and added to Luria–Bertani (LB) liquid medium containing kanamycin (50 mg/L), followed by shaking at 37 °C for 15 h at 210 rpm. The bacterial culture (1 mL) was sent to BGI Genomics Co., Ltd. (Beijing, China) for sequencing verification. The sequencing results were compared against the ORF amino acid sequences on the official NCBI website. Finally, the recombinant plasmids containing the correct sequences were extracted from Escherichia coli and transformed into BL21 competent cells.

4.4. Expression and Purification of Recombinant Proteins

Positive clones were selected from the LB plate containing bacteria transformed with the recombinant plasmid. Due to the low protein expression level, the his-tag was not removed to ensure the smooth running of the binding experiment. Protein expression was induced by adding 1.0 mmol/L isopropyl-β-d-thiogalactoside (IPTG) and incubating at 37 °C for 8 h in LB medium. After induction, the bacterial culture was centrifuged at 4 °C and 5000 rpm for 10 min to collect the target-expressing bacterial cells. The proteins were analyzed using 15% SDS-PAGE and subsequently purified using affinity chromatography with a nickel column (GE Healthcare, Waukesha, WI, USA). The protein samples were eluted stepwise with 20 mmol/L, 50 mmol/L, 100 mmol/L, 250 mmol/L, and 500 mmol/L imidazole solutions. The elution fraction containing the highest concentration of the target protein with minimal impurities was selected for dialysis and ultrafiltration. The dialysis was carried out using a standard cellulose membrane (MWCO: 8–10 kDa) from Spectrum Labs, Inc. (Repligen Corporation, Waltham, MA, USA) against a 20 mmol Tris-HCl buffer (pH 8.0) at 4 °C for 12 h with three buffer changes. Ultrafiltration was subsequently performed using Amicon® Ultra-15 centrifugal filters (MWCO: 10 kDa, Merck KGaA, Darmstadt, Germany) at 4000× g and 4 °C to concentrate the protein sample. The quality of the proteins was assessed using SDS-PAGE gel electrophoresis, and the protein concentration was determined using the BCA assay. The purified proteins were stored at −80 °C.

4.5. Fluorescence Competitive Binding Assay

The fluorescence competitive binding assays for six volatiles were conducted using a Cary Eclipse fluorescence spectrophotometer (Agilent Technologies, Palo Alto, CA, USA). 4,4′-Dianilino-1,1′-binaphthyl-5,5′-disulfonic acid, dipotassium salt (bis-ANS) was used as the fluorescent probe. The instrument parameters were set as follows: emission wavelength scanning range of 300–550 nm and excitation wavelength of 295 nm. The recombinant proteins were dissolved in 50 mmol/L Tris-HCl buffer (pH 7.4) at a final concentration of 2 µmol/L. The fluorescent probe and ligands were dissolved in chromatographically pure methanol at a final concentration of 1 mmol/L. The dissociation constant (Kd) of bis-ANS was determined using the Scatchard equation, and the binding affinity of the recombinant proteins to the six ligands was evaluated based on previous studies [59]. GraphPad Prism 9.0 was used to calculate and analyze the IC50 values (ligand concentration at 50% reduction in fluorescence intensity) and the inhibition constants (Ki) [60,61,62]. Each treatment was replicated three times.

4.6. Three-Dimensional Modeling and Molecular Docking

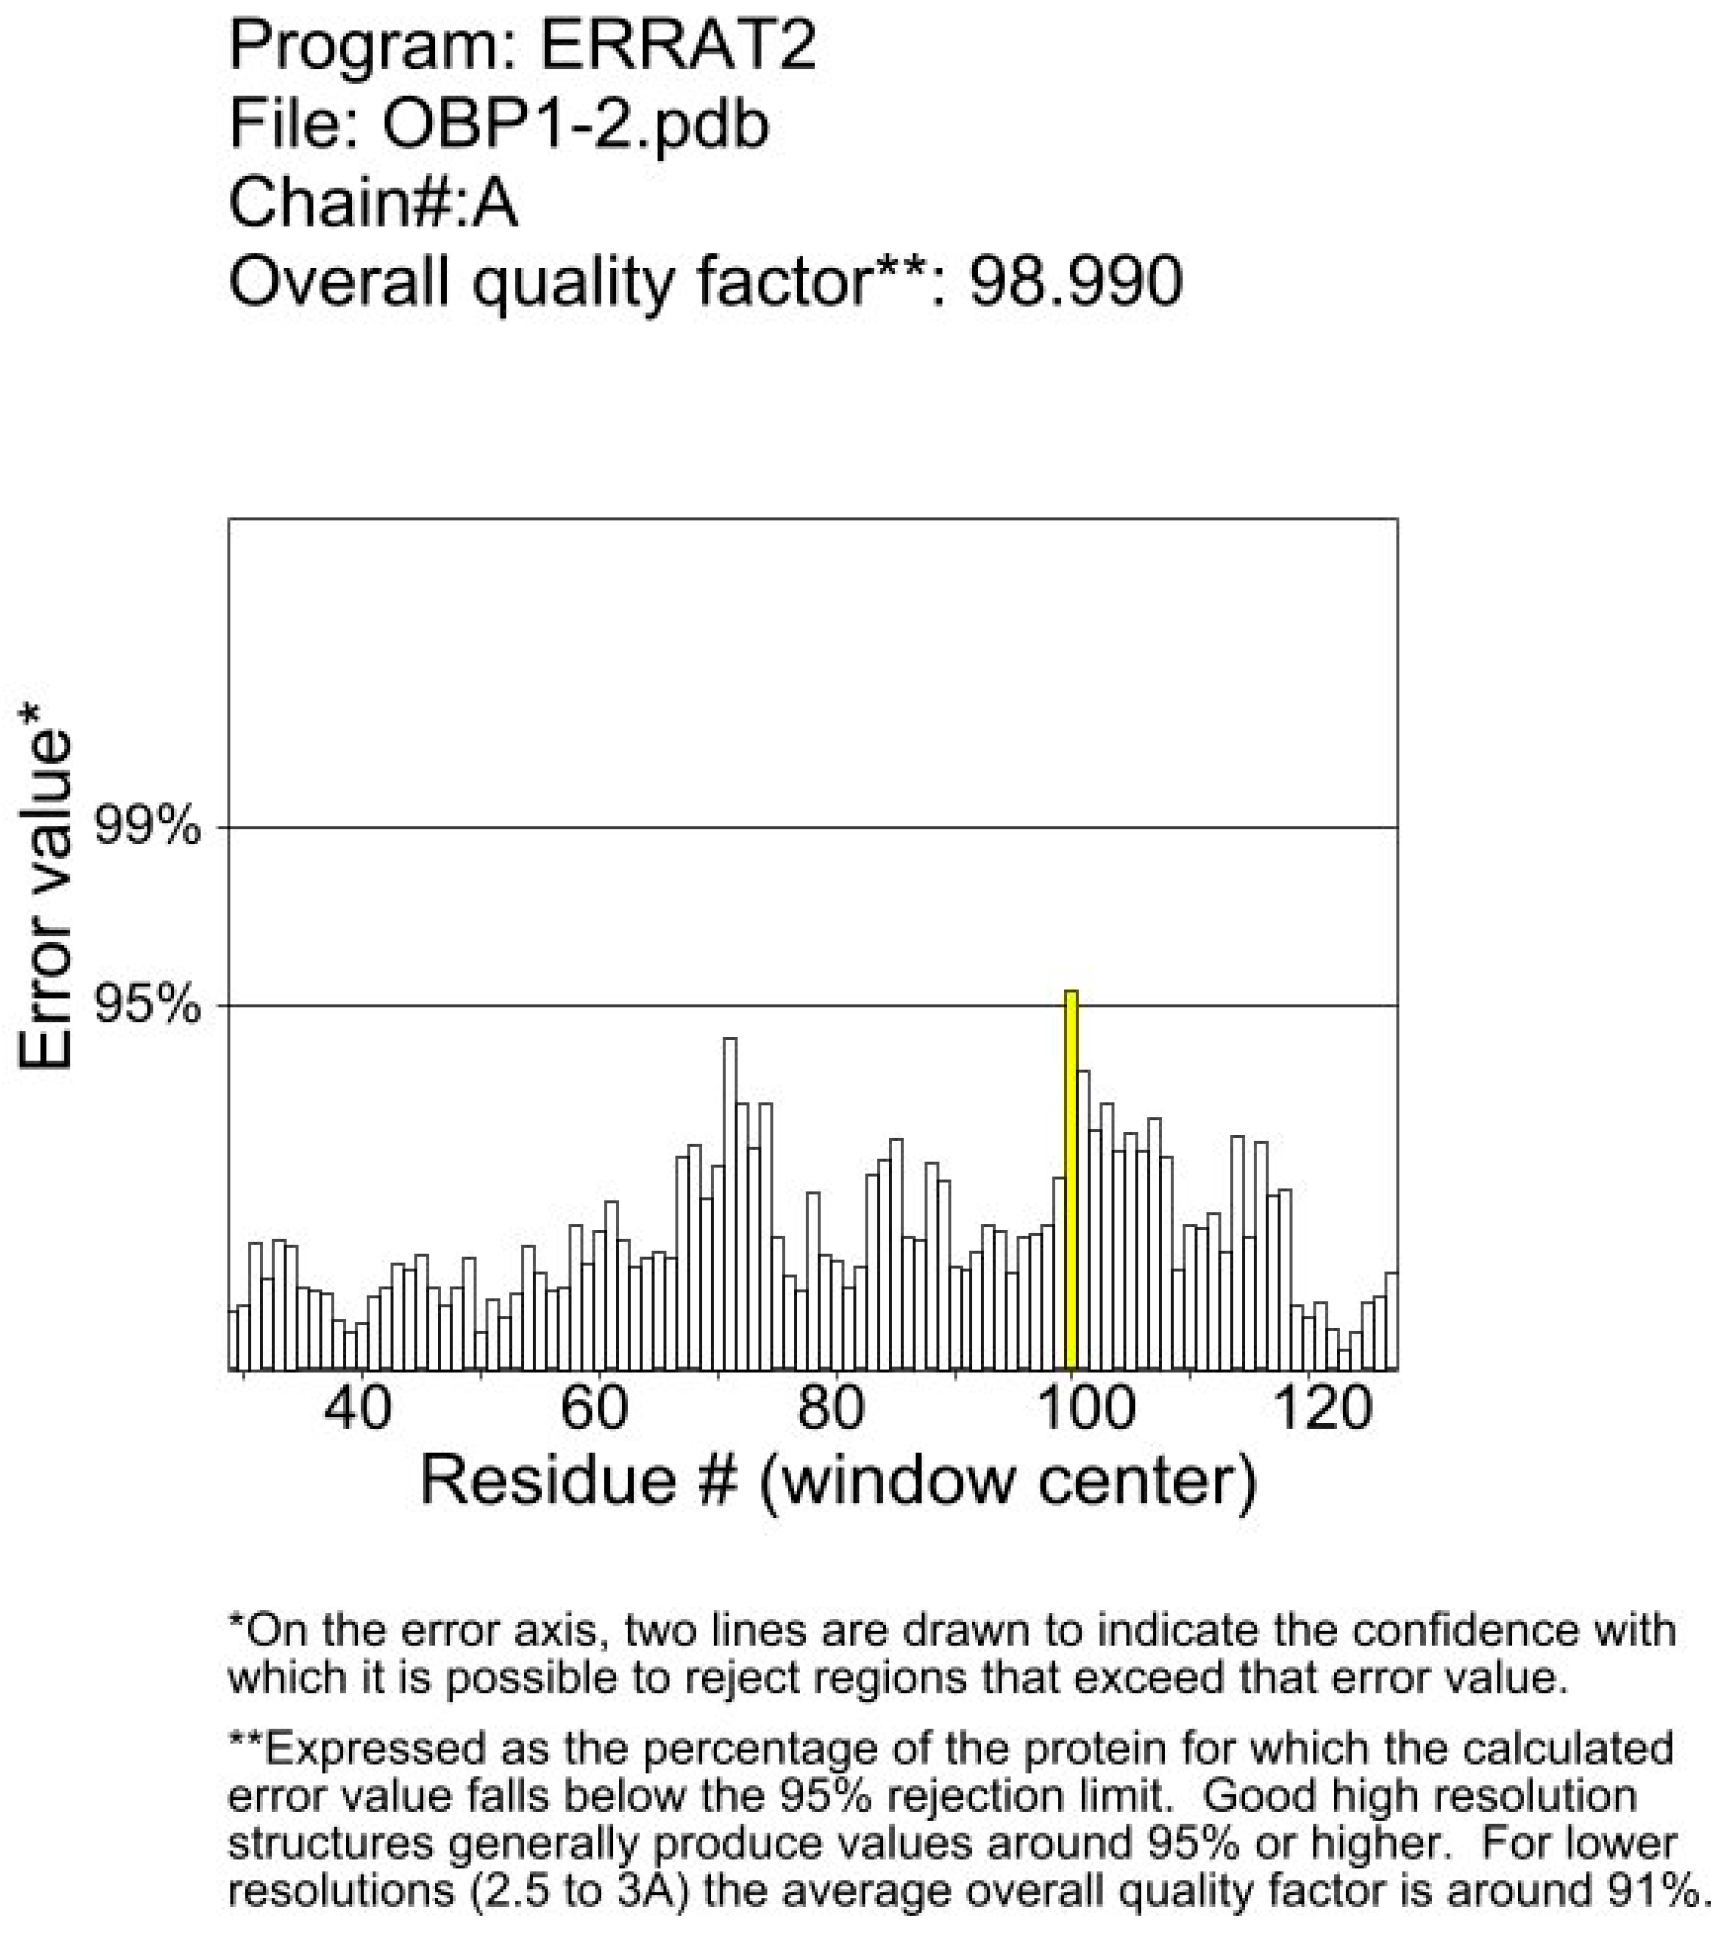
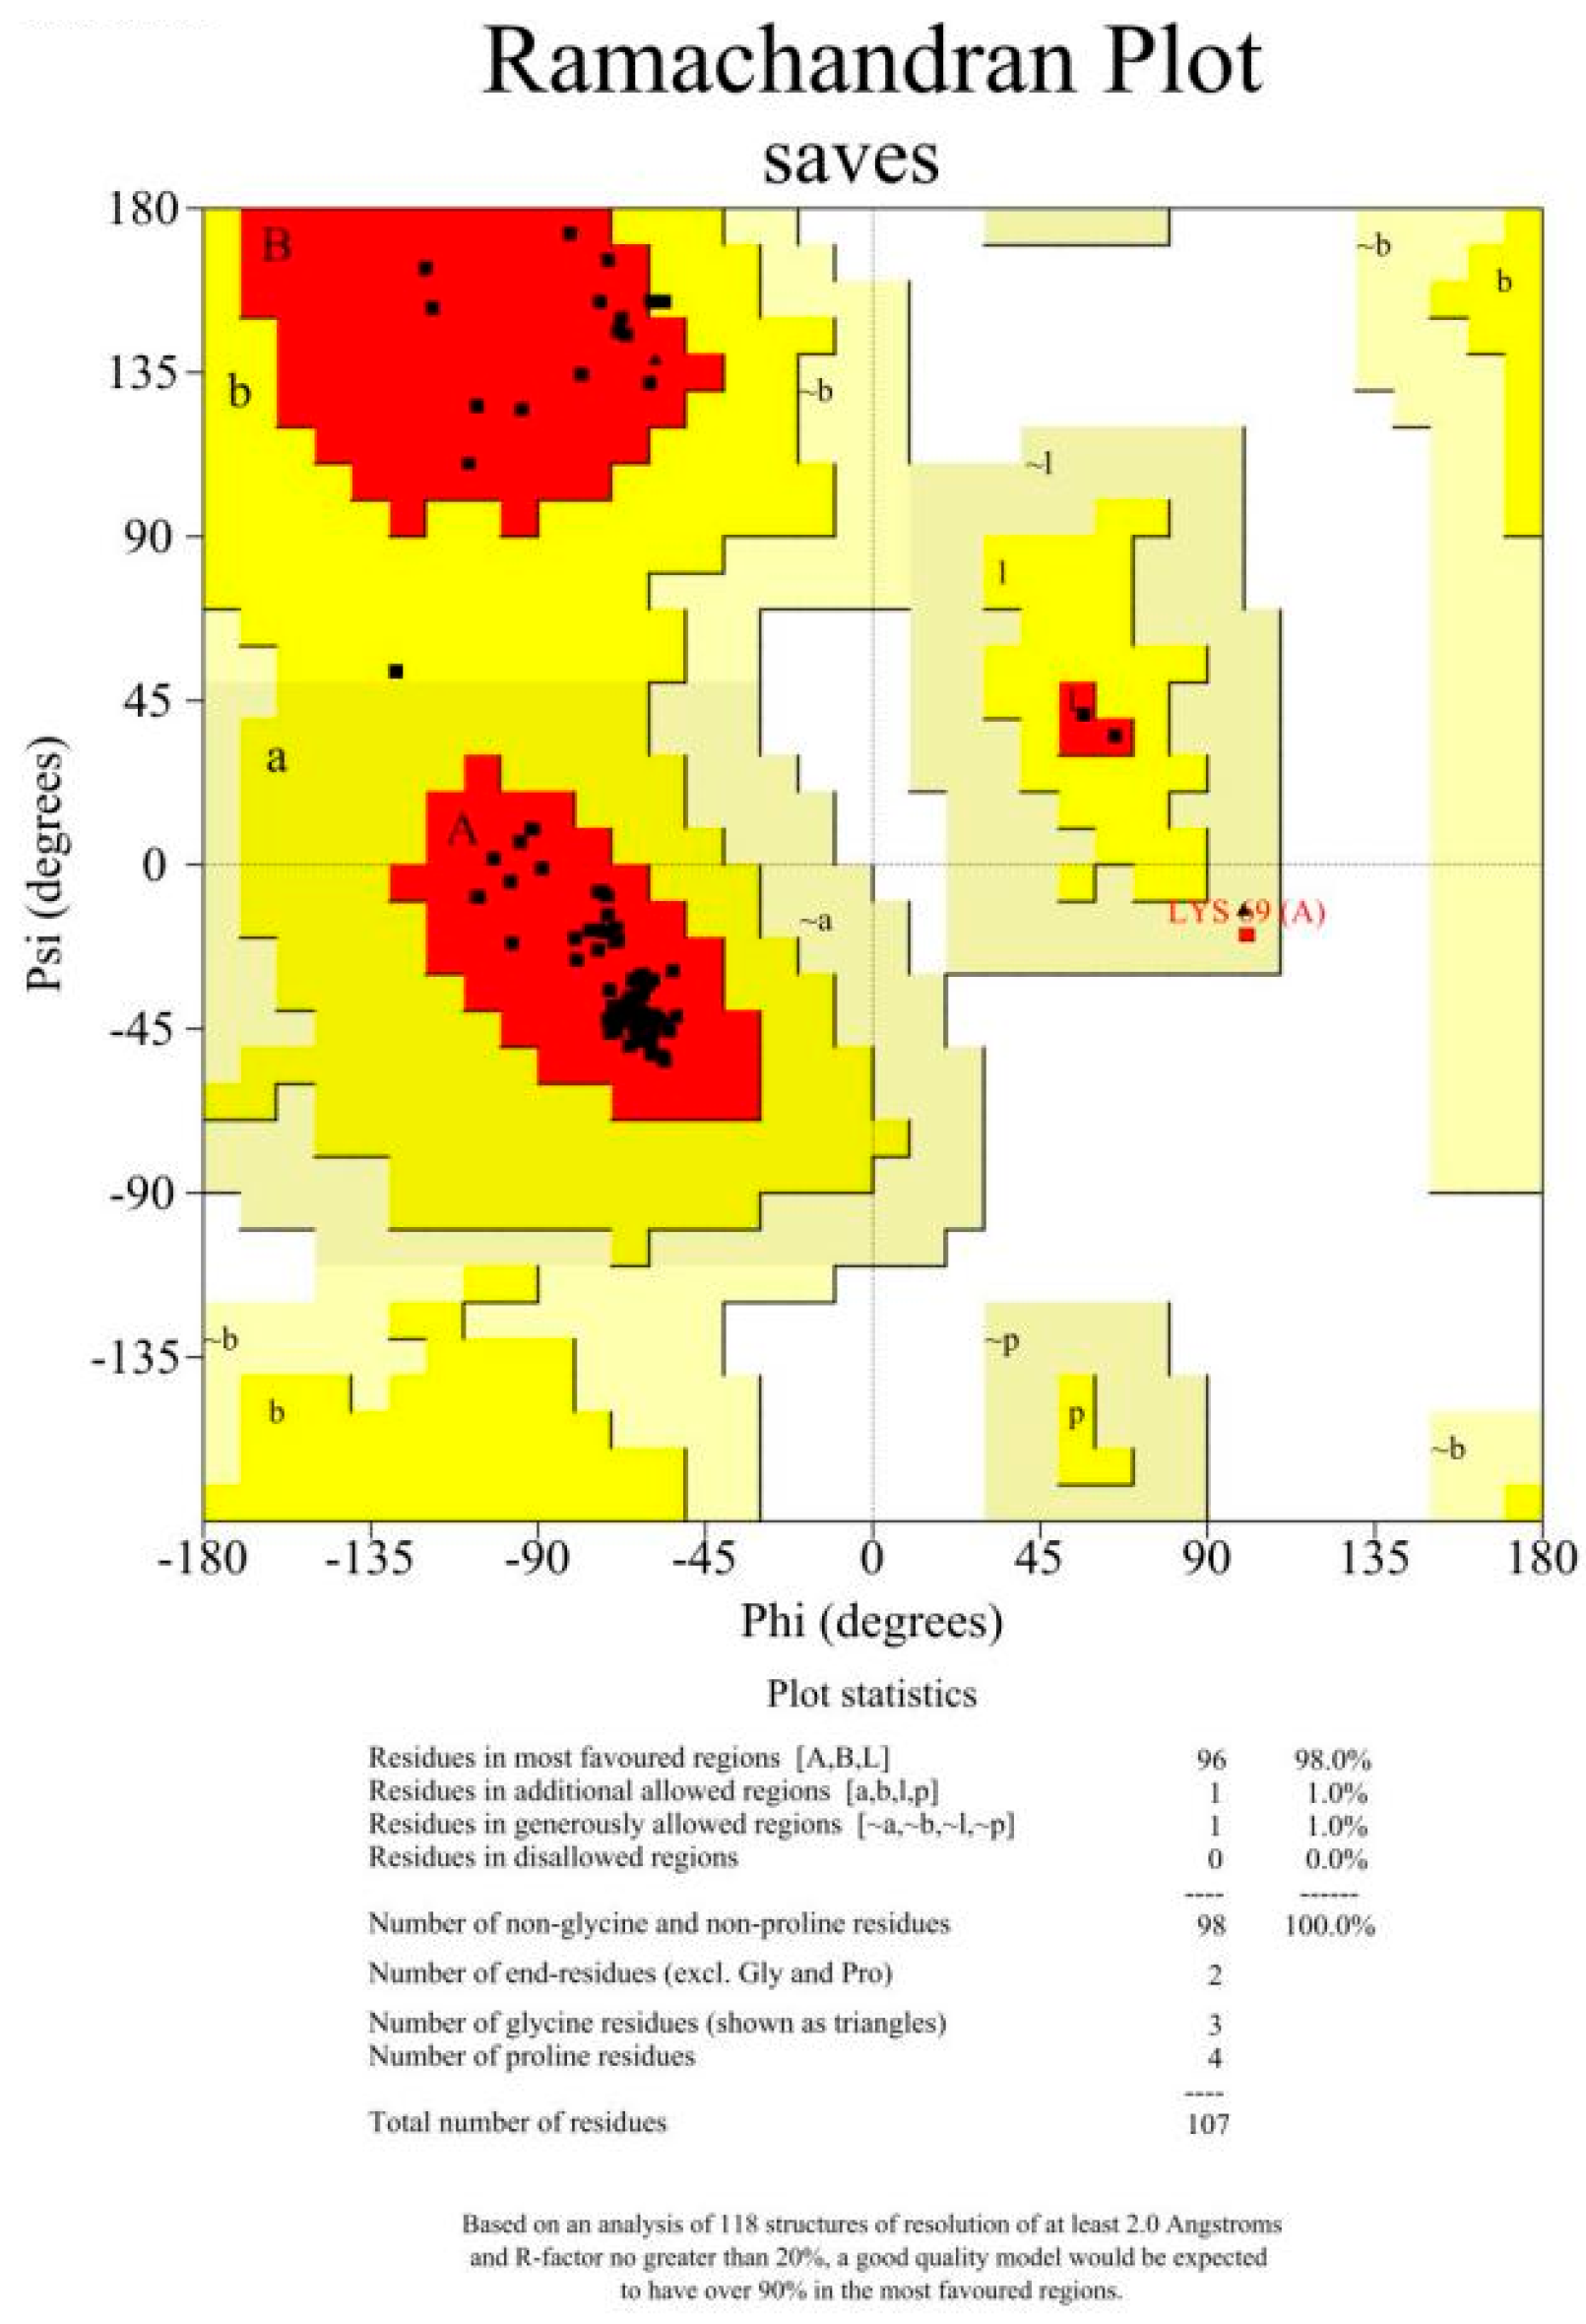
The amino acid sequences without signal peptides were subjected to BLAST sequence alignment analysis using the NCBI database https://blast.ncbi.nlm.nih.gov/Blast.cgi (accessed on 14 September 2024). Alignment results with E-values less than 10-5 and the smallest E-value (minimum value of 0) were saved. The template with the highest BLAST algorithm score was selected as the template for protein modeling. The target protein structure was predicted using the SWISS-MODEL server https://swissmodel.expasy.org/ (accessed on 14 September 2024) and optimized through a neural network-based method. The protein model with the highest score was chosen as the final structure of the target protein. The obtained protein models were analyzed using Procheck, Verify_3D, and ERRAT programs to evaluate their rationality (Figure A1 and Figure A2).
Molecular docking was performed following the method described by Wang et al. [63]. The protein models and ligands were docked using Autodock 4.2.6 software. The binding energy was calculated using the Lamarckian Genetic Algorithm (LGA). In the Autodock tools, the protein and ligand molecules were opened, and the docking box parameters were set. The docking box size was set to x = 40, y = 40, z = 40, with a grid point spacing of 0.375 Å, ensuring that the docking box covered the entire protein molecule. The center grid point coordinates were set to −1.986, 2.882, −0.029. The AutoGrid program was used to calculate the grid point energies, generating a series of Map files representing interatomic interactions. The AutoDock program was then run to evaluate and rank the ligands based on conformation and energy parameters. The docking results produced 50 best conformations, and the conformation with the lowest binding energy was selected for further analysis and evaluation. Images were generated and analyzed using PyMOL 3.9.0.

4.7. Synthesis of Double-Stranded RNA (dsRNA) and Treatment

RNAi experiments were performed following the experimental protocol of Jia et al. [36]. Double-stranded RNA (dsRNA) was synthesized using the T7 RiboMAX™ Express RNAi Kit (Promega, Madison, WI, USA) according to the manufacturer’s instructions. Specific primers containing T7 promoter sequences (Table A3) were designed for this purpose. The synthesized dsRNA was diluted to a concentration of 100 ng/μL using a 30% sucrose solution. Twenty adult A. spiniferus, starved for 1 h, were transferred into a food-grade plastic cup (upper diameter: 38 mm, lower diameter: 30 mm, height: 30 mm). The cup opening was sealed with a plastic film (Bemis, Inc., Neenah, WI, USA), and 20 droplets of dsRNA (1 μL each) were added to the film. A second layer of stretched film was then covered the first, and 20 needle holes were punctured through both layers. To prevent escape, the diameter of the needle holes was smaller than the cross-sectional width of the adults. Controls included dsRNA of green fluorescent protein (dsGFP, 436 bp) at the same concentration and distilled water (CK). Both treatments and controls were placed in an environmental incubator set at 26 ± 2 °C, 70 ± 5% relative humidity, and a photoperiod of 16L:8D. After 24 h of feeding, EAG and behavioral tests were conducted. Total RNA was extracted from the adults collected at the end of feeding treatments for qPCR analysis to evaluate RNA interference efficiency. Each treatment was replicated four times. Statistical differences in relative expression levels among dsAspiOBP1, dsAspiOBP2, dsGFP, and distilled water (CK) treatments were analyzed using one-way analysis of variance (ANOVA), with mean comparisons performed using Tukey’s-b multiple range test.

4.8. EAG Tests

The Electroantennographic (EAG) recordings of adult A. spiniferus to host volatiles were tested following the methods described by Gu et al. [64] and Tang et al. [65]. Six volatiles were diluted to concentrations of 100 μg/μL using hexane, with 10 μL solution dropped to filter paper strips (5 × 60 mm). The filter paper was quickly placed into a 14.5 cm Pasteur pipette and used as a stimulus source after 30 s. A control was prepared by dropping 10 μL of hexane to the filter paper. Timing began immediately after the antennae were excised from the insect, and EAG responses were recorded starting 5 min later. Each antenna was stimulated with three randomly selected volatiles from the test set, following the sequence: control, random volatiles, control, random volatiles, and control. Specifically, the tip of the Pasteur pipette was inserted into a steel tube through a small hole (approximately 11 cm from the tube opening) to a depth of about 3 mm. The stimulation duration was 0.3 s, with a 60-s interval between stimuli [66]. A total of 15 antennae were tested with only one antenna randomly selected per adult.
The EAG instrument (Syntech Ltd., Hilversum, The Netherlands) was connected to a computer via an IDAC-2 signal acquisition unit. Under a stereomicroscope, the reference and recording electrodes (Ag-AgCl) were connected to the base and tip of the antenna, respectively. The antenna was positioned approximately 2 mm from the opening of the steel tube. A 1 L/min airflow, purified through activated carbon and humidified, passed through the steel tube (14 cm long, 8 mm inner diameter) and carried the volatiles over the antenna. The testing conditions were maintained at 25 ± 2 °C and 46–78% relative humidity. The EAG responses were expressed as relative values, calculated by subtracting the average of the control (hexane) responses before and after each stimulus from the sample response. The resulting difference represented the relative EAG response to the sample stimulus. The experimental data were analyzed using one-way analysis of variance (ANOVA), with mean comparisons performed using Tukey’s-b multiple range test.

4.9. Two-Choice Olfactometry for dsRNA-Treated A. spiniferus

The Y-tube olfactometer test was adapted from the method described by Han and Chen [67]. The test compounds were prepared at a concentration of 100 μg/μL, with hexane used as the solvent. The Y-tube olfactometer consisted of a base and two arms, each 10 cm in length and 1 cm in internal diameter, with a 90° angle between the arms. In the odor source containers on both sides, 10 μL of the test volatile compound and hexane were placed, respectively. An electric vacuum pump was connected to the base of the Y-tube. The incoming air was filtered through activated charcoal, regulated by a flow meter, and humidified using water-saturated cotton balls. All components were connected using polytetrafluoroethylene (PTFE) tubing. The airflow through each arm was maintained at 100 mL/min. A total of 80 adults were tested individually. Each individual was given a choice between the volatile compound and hexane. The choice of adult was recorded after 10 min. After every 10 adults tested, the Y-tube was thoroughly cleaned in sequence using ethanol, acetone, and deionized water, and the positions of the two arms were swapped to avoid positional bias. The same testing procedure was repeated four times for each odor source treatment. After testing one odor source, the Y-tube, odor source containers, and other glass components are cleaned in sequence using ethanol, acetone, and deionized water, and dried in an oven at 120 °C before reuse. The activated charcoal in the filter was reactivated by heating in an oven at 100 °C for 4 h. After cooling, the activated charcoal was stored in a sealed glass bottle for future use. The bioassays were conducted between 9:30 and 15:30 in a laboratory maintained at 22–28 °C, 65–75% relative humidity, and 3200–3600 lux light intensity. The statistical differences in the number of adults between the two choices were analyzed using the chi-square test.

5. Conclusions

In summary, this study has identified the functions of the AspiOBP1 and AspiOBP2 proteins in binding and transporting host volatiles. AspiOBP1 is likely involved in this mechanism, with ARG-79 potentially serving as a critical amino acid site for this binding process. AspiOBP2 appears to play a supportive role in this mechanism. This research lays the groundwork for a deeper exploration of the host selection mechanisms of A. spiniferus and provides theoretical support for the development of novel compounds and RNA-based pesticides aimed at controlling this pest.

Author Contributions

Methodology, Z.J., Z.Q. and X.G.; investigation, Z.J., X.G., Z.Q. and Y.X.; data curation, Z.C. and Y.X.; writing—original draft preparation, Z.J. and Z.C.; writing—review and editing, Z.J., Z.C. and Y.X.; project administration, Z.C. and Y.X.; funding acquisition, Y.X.; Visualization, Z.J. All authors have read and agreed to the published version of the manuscript.

Funding

This research was funded by the National Key Research and Development Program of China (2023YFD1700405), the Agricultural Major Technology Collaborative Promotion Project of Shandong province (SDNYXTTG-2024-30), and the Modern Tea Industry Technology System of Shandong Province (SDAIT-19-04).

Institutional Review Board Statement

Not applicable.

Data Availability Statement

The data that support the findings of this study are available from the corresponding author upon reasonable request.

Acknowledgments

We extend sincere gratitude to all members of the Laboratory of Insect Ecology and Physiology at Shandong Agricultural University, and acknowledge Yusheng Li from Shandong Agricultural Technology Extension Center for his contribution to this study.

Conflicts of Interest

The authors declare no conflicts of interest.

Abbreviations

AspiOBPAleurocanthus spiniferus odorant binding protein
CSPschemosensory proteins
OBPsodorant binding proteins
EAGelectroantennogram
bis-ANS4,4′-Dianilino-1,1′-Binaphthyl-5,5′-Disulfonic Acid, Dipotassium Salt
SDS-PAGEsodium dodecyl sulfate polyacrylamide gel electropheresis
IPTGisopropyl-β-d-thiogalactoside
SRAsequence read archive
ORFopen reading frame

Appendix A

Table A1. Statistics of VOC-induced expression alteration.
VOCsGeneCK aTreatmenttdfpChanges in OBP Gene Expression b
MeanStandard
Errors
MeanStandard Errors
3-CareneAspiOBP11.47330.15510.99730.06762.81560.048down
AspiOBP21.04330.10040.70990.04203.06460.037down
AspiOBP31.19770.16191.92090.13393.44360.026up
AspiOBP51.04930.15110.62230.05842.63560.058ns
AspiOBP71.33370.23550.08520.00715.29860.006down
(E)-2-hexenalAspiOBP11.25600.04401.76700.18402.70260.035up
AspiOBP21.04450.07810.76500.03803.21860.018down
AspiOBP31.48500.18250.02800.00117.9856<0.001down
AspiOBP51.15250.13620.66520.08263.05960.022down
AspiOBP71.12600.10940.82130.17011.50760.183ns
LinaloolAspiOBP11.29000.15800.75680.13442.57160.042down
AspiOBP21.07250.08670.84750.17201.16860.287ns
AspiOBP31.37500.15290.36890.10175.47960.002down
AspiOBP51.03250.09880.91380.08030.93260.387ns
AspiOBP71.10880.09100.98160.16040.68960.516ns
HexanolAspiOBP11.64750.35901.32050.47460.54960.603ns
AspiOBP21.00000.08320.64000.06193.47360.013down
AspiOBP31.14950.13100.49680.27502.14360.076ns
AspiOBP51.27080.18181.72290.42600.97660.367ns
AspiOBP71.25750.07231.30190.33170.13160.900ns
(Z)-3-hexenolAspiOBP11.49250.18550.63900.16763.41460.014down
AspiOBP21.37500.20810.43430.08994.15160.006down
AspiOBP31.23450.15751.01790.09151.18960.279ns
AspiOBP51.45380.23870.70660.04373.07960.022down
AspiOBP71.25650.18361.39910.24010.47260.654ns
NonanalAspiOBP11.30750.06600.58150.07657.1886<0.001down
AspiOBP21.33680.14510.83000.06473.19060.019down
AspiOBP31.18600.15940.08460.03666.73560.001down
AspiOBP51.22750.06980.71130.07415.07060.002down
AspiOBP70.98850.08090.99200.08430.03060.977ns
a CK was a hexane-induced expression alteration. b “ns” indicates a non-significant difference, “up” indicates significant up-regulation, “down” indicates significant down-regulation.
Table A2. The secondary structures of AspiOBP1.
Proteinα-Helix/%Extended Strand/%β-Turn/%Random Coil/%
AspiOBP172.032.804.2020.98
Table A3. Primers used in this study.
Gene NamePrimer Sequence (5′–3′)Remarks
AspiOBP1F: GTTTTTGTTTCGTTTGTTGCCCAGTqPCR
R: TCGGAACCAGATACTGTTTCATTAC
AspiOBP2F: GGATGACGAGCCTTTGAA
R: GTGGTCGGTGGTTTTCTA
AspiOBP3F: TGACGGGCACTATGTTGG
R: CATTGTATCGGTGGCTGA
AspiOBP5F: CCCTGCTCGCTGCCTTTGT
R: TGTCACTCCCGCCCAATCC
AspiOBP7F: ATCTGTGATAAGTGTGATGACGC
R: ATGGCGTTCTGTATCCCT
RPS28F: AACCAGGACAAGTAGGCCAAG
R: GCCTCGCCGATTTCCTTCTC
AspiOBP1F: GCCATGGCTGATATCGGATCCGTCACTCACGAACAAATTGATCAACClone
R: TTGTCGACGGAGCTCGAATTCTTAAGATTTCGTGAACCATCCAAGC
AspiOBP2F: GCCATGGCTGATATCGGATCCGAGACATCAACGGTTGACTCTG
R: TTGTCGACGGAGCTCGAATTCTCAAGGTTTTGGTGGAGGC
T7-dsAspiOBP1F: GGATCCTAATACGACTCACTATAGGNAAATGTTTGACGAGAATGGGCRNAi
R: GGATCCTAATACGACTCACTATAGGNGTTATAGTGGGACTTCGGGGC
T7-dsAspiOBP2F: GGATCCTAATACGACTCACTATAGGNCCGTAGCAAATGGTGGCA
R: GGATCCTAATACGACTCACTATAGGNTTCCGTTGGGCAGTTCAT
T7-dsGFPF: GGATCCTAATACGACTCACTATAGGNTGGGCACAAATTTTCTGTC
R: GGATCCTAATACGACTCACTATAGGNAAGGGTATCACCTTCAAAC
Table A4. The amino acid residues and distances of hydrophobic interactions between AspiOBP1 and ligands.
3-CareneHexanol(E)-2-Hexenal(Z)-3-HexenolNonanalLinalool
Amino Acid ResiduesDistanceAmino Acid ResiduesDistanceAmino Acid
Residues
DistanceAmino Acid ResiduesDistanceAmino Acid ResiduesDistanceAmino Acid ResiduesDistance
GLN-763.58GLN-763.50GLU-1063.35TYR-773.46GLN-763.71GLU-803.46
TYR-773.44TYR-773.95MET-1093.42GLU-1063.36GLN-763.54GLU-1063.46
TYR-773.24TYR-773.36 MET-1093.14TYR-1173.12
ARG-793.79GLU-1063.44 TYR-1173.30
GLU-1063.05MET-1093.55
MET-1093.40TYR-1173.52
TYR-1173.99
Table A5. The amino acid residues and distances of hydrogen bonds between AspiOBP1 and ligands.
Hexanol(E)-2-Hexenal(Z)-3-HexenolNonanalLinalool
Amino Acid
Residues
DistanceAmino Acid ResiduesDistanceAmino Acid ResiduesDistanceAmino Acid ResiduesDistanceAmino Acid ResiduesDistance
TYR-771.83ARG-791.85TYR-771.96GLN-762.11ASN-781.86
ARG-792.03 ARG-792.23 ARG-792.53
GLU-801.73
Figure A1. Overall quality factor of AspiOBP1 model evaluated by ERRAT.
Ijms 26 08784 g0a1
Figure A2. Ramachandran plot of the AspiOBP1 model.
Ijms 26 08784 g0a2

References

  1. Tang, X.T.; Tao, H.H.; Du, Y.Z. Microsatellite-based analysis of the genetic structure and diversity of Aleurocanthus spiniferus (Hemiptera: Aleyrodidae) from tea plants in China. Gene 2015, 560, 107–113. [Google Scholar] [CrossRef]
  2. Van den Berg, M.A.; Greenland, J. Classical biological control of Aleurocanthus spiniferus (Hem.: Aleyrodidae), on citrus in Southern Africa. BioControl 1997, 42, 459–465. [Google Scholar] [CrossRef]
  3. Muniappan, R.; Purea, M.; Sengebau, F.; Reddy, G.V. Orange spiny whitefly, Aleurocanthus spiniferus (Quaintance) (Homoptera: Aleyrodidae), and its parasitoids in the Republic of Palau. Hawaii. Entomol. Soc. 2006, 38, 21–25. Available online: http://hdl.handle.net/10125/119 (accessed on 15 January 2025).
  4. Kanmiya, K.; Ueda, S.; Kasai, A.; Yamashita, K. Proposal of new specific status for tea-infesting populations of the nominal citrus spiny whitefly Aleurocanthus spiniferus (Homoptera: Aleyrodidae). Zootaxa 2011, 125, 25–44. [Google Scholar] [CrossRef]
  5. Cioffi, M.; Cornara, D.; Corrado, I.; Jansen, M.G.M.; Porcelli, F. The status of Aleurocanthus spiniferus from its unwanted introduction in Italy to date. Bull. Insectology 2013, 66, 273–281. Available online: https://www.cabidigitallibrary.org/doi/full/10.5555/20133416562 (accessed on 15 January 2025).
  6. Porcelli, F. First record of Aleurocanthus spiniferus (Homoptera: Aleyrodidae) in Apulia, Southern Italy. OEPP/EPPO Bull. 2008, 38, 516–518. [Google Scholar] [CrossRef]
  7. Nugnes, F.; Laudonia, S.; Jesu, G.; Jansen, M.G.; Bernardo, U.; Porcelli, F. Aleurocanthus spiniferus (Hemiptera: Aleyrodidae) in some European countries: Diffusion, hosts, molecular characterization, and natural enemies. Insects 2020, 11, 42. [Google Scholar] [CrossRef]
  8. Streito, J.C.; Mendes, E.; Sanquer, E.; Strugarek, M.; Ouvrard, D.; Robin-Havret, V.; Poncet, L.; Lannou, C.; Rossi, J.P. Incursion preparedness, citizen science and early detection of invasive insects: The case of Aleurocanthus spiniferus (Hemiptera, Aleyrodidae) in France. Insects 2023, 14, 916. [Google Scholar] [CrossRef]
  9. Gillespie, P.S. A review of the whitefly genus Aleurocanthus Quaintance & Baker (Hemiptera: Aleyrodidae) in Australia. Zootaxa 2012, 3252, 1–42. Available online: https://www.cabidigitallibrary.org/doi/full/10.5555/20133124601 (accessed on 20 January 2025). [CrossRef]
  10. Tian, Y.; Chen, Z.; Huang, X.; Zhang, L.; Zhang, Z. Evaluation of botanicals for management of piercing–sucking pests and the effect on beneficial arthropod populations in tea trees Camellia sinensis (L.) O. Kuntze (Theaceae). J. Insect Sci. 2020, 20, 27. [Google Scholar] [CrossRef]
  11. Zhou, J.J. Odorant-binding proteins in insects. Vitam. Horm. 2010, 83, 241–272. [Google Scholar] [CrossRef]
  12. Leal, W.S. Odorant reception in insects: Roles of receptors, binding proteins, and degrading enzymes. Annu. Rev. Entomol. 2013, 58, 373–391. [Google Scholar] [CrossRef]
  13. Gao, Y.Q.; Chen, Z.Z.; Liu, M.Y.; Song, C.Y.; Jia, Z.F.; Liu, F.H.; Qu, C.; Dewer, Y.; Zhao, H.P.; Xu, Y.Y.; et al. Characterization of antennal chemosensilla and associated chemosensory genes in the orange spiny whitefly, Aleurocanthus spiniferus (Quaintanca). Front. Physiol. 2022, 13, 847895. [Google Scholar] [CrossRef]
  14. Venthur, H.; Mutis, A.; Zhou, J.J.; Quiroz, A. Ligand binding and homology modelling of insect odorant-binding proteins. Physiol. Entomol. 2014, 39, 183–198. [Google Scholar] [CrossRef]
  15. Wang, Z.; Shang, X.; Wu, Z.; Wei, J.; Tian, X.; Zhang, G. Identification of behaviorally active odorants for adult Chilo sacchariphagus based on the binding properties of odorant-binding proteins toward host volatiles. J. Agric. Food Chem. 2025, 73, 7669–7684. [Google Scholar] [CrossRef]
  16. Fan, J.; Francis, F.; Liu, Y.; Chen, J.L.; Cheng, D.F. An overview of odorant-binding protein functions in insect peripheral olfactory reception. Genet. Mol. Res. 2011, 10, 3056–3069. [Google Scholar] [CrossRef]
  17. Lizana, P.; Mutis, A.; Quiroz, A.; Venthur, H. Insights into chemosensory proteins from non-model insects: Advances and perspectives in the context of pest management. Front. Physiol. 2022, 13, 924750. [Google Scholar] [CrossRef] [PubMed]
  18. Wang, L.; Hou, M.; Liang, C.; Xu, Q.; Lu, Y.; Zhao, Z. Role of odorant binding protein C12 in the response of Tribolium castaneum to chemical agents. Pestic. Biochem. Physiol. 2024, 201, 105861. [Google Scholar] [CrossRef] [PubMed]
  19. Yang, Y.; Tan, S.; Wang, Q.; Wang, F.; Zhang, Y. Key amino acids in odorant-binding protein OBP7 enable Bradysia odoriphaga to recognize host plant volatiles. Int. J. Biol. Macromol. 2025, 284, 138179. [Google Scholar] [CrossRef] [PubMed]
  20. Xu, P.X.; Zwiebel, L.J.; Smith, D.P. Identification of a distinct family of genes encoding atypical odorant-binding proteins in the malaria vector mosquito, Anopheles gambiae. Insect Mol. Biol. 2003, 12, 549–560. [Google Scholar] [CrossRef]
  21. Zhou, J.; Zhang, G.; Huang, W.; Birkett, M.A.; Field, L.M.; Pickett, J.A.; Pelosi, P. Revisiting the odorant-binding protein LUSH of Drosophila melanogaster: Evidence for odour recognition and discrimination. Febs Lett. 2004, 558, 23–26. [Google Scholar] [CrossRef]
  22. Pelosi, P.; Mastrogiacomo, R.; Iovinella, I.; Tuccori, E.; Persaud, K.C. Structure and biotechnological applications of odorant-binding proteins. Appl. Microbiol. Biotechnol. 2014, 98, 61–70. [Google Scholar] [CrossRef] [PubMed]
  23. Pelosi, P.; Zhou, J.J.; Ban, L.P.; Calvello, M. Soluble proteins in insect chemical communication. Cell. Mol. Life Sci. CMLS 2006, 63, 1658–1676. [Google Scholar] [CrossRef]
  24. Brito, N.F.; Moreira, M.F.; Melo, A.C. A look inside odorant binding proteins in insect chemoreception. J. Insect Physiol. 2016, 95, 51–65. [Google Scholar] [CrossRef] [PubMed]
  25. Hekmat-Scafe, D.S.; Scafe, C.R.; McKinney, A.J.; Tanouye, M.A. Genome-wide analysis of the odorant-binding protein gene family in Drosophila melanogaster. Genome Res. 2002, 12, 1357–1369. [Google Scholar] [CrossRef] [PubMed]
  26. Li, D.Z.; Yu, G.Q.; Yi, S.C.; Zhang, Y.; Kong, D.X.; Wang, M.Q. Structure-based analysis of the ligand-binding mechanism for DhelOBP21, a C-minus odorant binding protein, from Dastarcus helophoroides (Fairmaire; Coleoptera: Bothrideridae). Int. J. Biol. Sci. 2015, 11, 1281–1295. [Google Scholar] [CrossRef]
  27. Renou, M.; Anton, S. Insect olfactory communication in a complex and changing world. Curr. Opin. Insect Sci. 2020, 42, 1–7. [Google Scholar] [CrossRef]
  28. Li, L.; Wu, L.; Xu, Y.; Liu, F.; Zhao, H. Three odorant-binding proteins of small hive beetles, Aethina tumida, participate in the response of bee colony volatiles. Int. J. Biol. Macromol. 2024, 278, 134905. [Google Scholar] [CrossRef]
  29. Calín-Sánchez, Á.; Martínez, J.J.; Vázquez-Araújo, L.; Burló, F.; Melgarejo, P.; Carbonell-Barrachina, Á.A. Volatile composition and sensory quality of Spanish pomegranates (Punica granatum L.). J. Sci. Food Agric. 2011, 91, 586–592. [Google Scholar] [CrossRef]
  30. Caboni, P.; Ntalli, N.G.; Aissani, N.; Cavoski, I.; Angioni, A. Nematicidal activity of (E,E)-2,4-decadienal and (E)-2-decenal from Ailanthus altissima against Meloidogyne javanica. J. Agric. Food Chem. 2012, 60, 1146–1151. [Google Scholar] [CrossRef]
  31. Goliáš, J.; Létal, J.; Kožíšková, J.; Dokoupil, L. Formation of volatiles in apricot (Prunus armeniaca L.) fruit during post-harvest ripening. Mitteilungen Klosterneubg. 2013, 63, 96–107. Available online: https://www.cabidigitallibrary.org/doi/full/10.5555/20143028343 (accessed on 20 January 2025).
  32. Velásquez, A.; Valenzuela, M.; Carvajal, M.; Fiaschi, G.; Avio, L.; Giovannetti, M.; D’Onofrio, C.; Seeger, M. The arbuscular mycorrhizal fungus Funneliformis mosseae induces changes and increases the concentration of volatile organic compounds in Vitis vinifera cv. Sangiovese leaf tissue. Plant Physiol. Biochem. 2020, 155, 437–443. [Google Scholar] [CrossRef]
  33. Sun, H.; Chen, W.; Jiang, Y.; He, Q.; Li, X.; Guo, Q.; Xiang, S.; Xi, W.; Liang, G. Characterization of volatiles in red-and white-fleshed loquat (Eriobotrya japonica) fruits by electronic nose and headspace solid-phase microextraction with gas chromatography-mass spectrometry. Food Sci. Technol. 2020, 40 (Suppl. S1), 21–32. [Google Scholar] [CrossRef]
  34. Wen, X.; Yang, K.; Piñero, J.C.; Wen, J. Contrasting behavioral and electrophysiological responses of Eucryptorrhynchus scrobiculatus and E. brandti (Coleoptera: Curculionidae) to volatiles emitted from the tree of heaven. Ailanthus altissima. Insects 2021, 12, 68. [Google Scholar] [CrossRef]
  35. Yamamoto, K.; Endo, S. Bombyx mori-derived aldo-keto reductase AKR2E8 detoxifies aldehydes present in mulberry leaves. Chem.-Biol. Interact. 2022, 351, 109717. [Google Scholar] [CrossRef]
  36. Jia, Z.; Li, Z.; Li, D.; Kang, Z.; Xu, Y.; Chen, Z. Two chemosensory proteins in Aleurocanthus spiniferus are involved in the recognition of host VOCs. Chem. Biol. Technol. Agric. 2024, 11, 183. [Google Scholar] [CrossRef]
  37. Jia, Z.; Ge, X.; Bian, Y.; Song, K.; Li, D.; Song, D.; Ding, S.; Xu, Y.; Chen, Z. Field application of tea volatiles mediating the selectivity of Aleurocanthus spiniferus on four tea cultivars. Plants 2025, 14, 2653. [Google Scholar] [CrossRef]
  38. von der Weid, B.; Rossier, D.; Lindup, M.; Tuberosa, J.; Widmer, A.; Col, J.D.; Kan, C.; Carleton, A.; Rodriguez, I. Large-scale transcriptional profiling of chemosensory neurons identifies receptor-ligand pairs in vivo. Nat. Neurosci. 2015, 18, 1455–1463. [Google Scholar] [CrossRef] [PubMed]
  39. Yin, J.; Wang, C.; Fang, C.; Zhang, S.; Cao, Y.; Li, K.; Leal, W.S. Functional characterization of odorant-binding proteins from the scarab beetle Holotrichia oblita based on semiochemical-induced expression alteration and gene silencing. Insect Biochem. Mol. Biol. 2019, 104, 11–19. [Google Scholar] [CrossRef]
  40. Liu, X.Q.; Jiang, H.B.; Fan, J.Y.; Liu, T.Y.; Meng, L.W.; Liu, Y.; Yu, H.Z.; Dou, W.; Wang, J.J. An odorant-binding protein of Asian citrus psyllid, Diaphorina citri, participates in the response of host plant volatiles. Pest Manag. Sci. 2021, 77, 3068–3079. [Google Scholar] [CrossRef]
  41. Hu, P.; Qiu, Z.; Chen, X.; Xu, Y.; Su, X.; Yang, Z. Olfactory proteins of Endoclita signifer larvae and their roles in host recognition. Chem. Biol. Technol. Agric. 2022, 9, 54. [Google Scholar] [CrossRef]
  42. He, P.; Chen, G.L.; Li, S.; Wang, J.; Ma, Y.F.; Pan, Y.F.; He, M. Evolution and functional analysis of odorant-binding proteins in three rice planthoppers: Nilaparvata lugens, Sogatella furcifera, and Laodelphax striatellus. Pest Manag. Sci. 2019, 75, 1606–1620. [Google Scholar] [CrossRef] [PubMed]
  43. Zhu, J.; Arena, S.; Spinelli, S.; Liu, D.; Zhang, G.; Wei, R.; Cambillau, C.; Scaloni, A.; Wang, G.; Pelosi, P. Reverse chemical ecology: Olfactory proteins from the giant panda and their interactions with putative pheromones and bamboo volatiles. Proc. Natl. Acad. Sci. USA 2017, 114, E9802–E9810. [Google Scholar] [CrossRef] [PubMed]
  44. Tang, H.; Xie, J.; Liu, J.; Khashaveh, A.; Liu, X.; Yi, C.; Zhao, D.; He, L.; Sun, Y.; Zhang, Y. Odorant-binding protein HvarOBP5 in ladybird Hippodamia variegata regulates the perception of semiochemicals from preys and habitat plants. J. Agric. Food Chem. 2023, 71, 1067–1076. [Google Scholar] [CrossRef]
  45. Liu, H.; Sun, X.; Shi, Z.; An, X.; Khashaveh, A.; Li, Y.; Gu, S.; Zhang, Y. Identification and functional analysis of odorant-binding proteins provide new control strategies for Apolygus lucorum. Int. J. Biol. Macromol. 2023, 224, 1129–1141. [Google Scholar] [CrossRef] [PubMed]
  46. Swarup, S.; Williams, T.I.; Anholt, R.R. Functional dissection of Odorant binding protein genes in Drosophila melanogaster. Genes Brain Behav. 2011, 10, 648–657. [Google Scholar] [CrossRef]
  47. Wang, Q.; Liu, J.T.; Zhang, Y.J.; Chen, J.L.; Li, X.C.; Liang, P.; Gao, X.W.; Zhou, J.J.; Gu, S.H. Coordinative mediation of the response to alarm pheromones by three odorant binding proteins in the green peach aphid Myzus persicae. Insect Biochem. Mol. Biol. 2021, 130, 103528. [Google Scholar] [CrossRef]
  48. Sandler, B.H.; Nikonova, L.; Leal, W.S.; Clardy, J. Sexual attraction in the silkworm moth: Structure of the pheromone-binding-protein-bombykol complex. Chem. Biol. 2000, 7, 143–151. [Google Scholar] [CrossRef]
  49. Pelosi, P.; Iovinella, I.; Zhu, J.; Wang, G.; Dani, F.R. Beyond chemoreception: Diverse tasks of soluble olfactory proteins in insects. Biol. Rev. 2018, 93, 184–200. [Google Scholar] [CrossRef]
  50. Vincent, F.; Spinelli, S.; Ramoni, R.; Grolli, S.; Pelosi, P.; Cambillau, C.; Tegoni, M. Complexes of porcine odorant binding protein with odorant molecules belonging to different chemical classes. J. Mol. Biol. 2000, 300, 127–139. [Google Scholar] [CrossRef]
  51. Li, H.L.; Song, X.M.; Wu, F.; Qiu, Y.L.; Fu, X.B.; Zhang, L.Y.; Tan, J. Chemical structure of semiochemicals and key binding sites together determine the olfactory functional modes of odorant-binding protein 2 in Eastern honey bee, Apis cerana. Int. J. Biol. Macromol. 2020, 145, 876–884. [Google Scholar] [CrossRef]
  52. Del Mármol, J.; Yedlin, M.A.; Ruta, V. The structural basis of odorant recognition in insect olfactory receptors. Nature 2021, 597, 126–131. [Google Scholar] [CrossRef] [PubMed]
  53. Yang, R.; Li, D.; Yi, S.; Wei, Y.; Wang, M. Odorant-binding protein 19 in Monochamus alternatus involved in the recognition of a volatile strongly emitted from ovipositing host pines. Insect Sci. 2024, 31, 134–146. [Google Scholar] [CrossRef] [PubMed]
  54. Rebijith, K.B.; Asokan, R.; Hande, H.R.; Kumar, N.K.; Krishna, V.; Vinutha, J.; Bakthavatsalam, N. RNA interference of odorant-binding protein 2 (OBP2) of the cotton aphid, Aphis gossypii (glover), resulted in altered electrophysiological responses. Appl. Biochem. Biotechnol. 2016, 178, 251–266. [Google Scholar] [CrossRef] [PubMed]
  55. Zhang, X.Y.; Zhu, X.Q.; Gu, S.H.; Zhou, Y.L.; Wang, S.Y.; Zhang, Y.J.; Guo, Y.Y. Silencing of odorant binding protein gene AlinOBP4 by RNAi induces declining electrophysiological responses of Adelphocoris lineolatus to six semiochemicals. Insect Sci. 2017, 24, 789–797. [Google Scholar] [CrossRef]
  56. Du, Y.; Xu, K.; Ma, W.; Su, W.; Tai, M.; Zhao, H.; Jiang, Y.; Li, X. Contact chemosensory genes identified in leg transcriptome of Apis cerana cerana (Hymenoptera: Apidae). J. Econ. Entomol. 2019, 112, 2015–2029. [Google Scholar] [CrossRef]
  57. Du, Y.; Chen, J. The odorant binding protein, SiOBP5, mediates alarm pheromone olfactory recognition in the red imported fire ant, Solenopsis invicta. Biomolecules 2021, 11, 1595. [Google Scholar] [CrossRef]
  58. Livak, K.J.; Schmittgen, T.D. Analysis of relative gene expression data using real-time quantitative PCR and the 2−ΔΔCT Method. Methods 2001, 25, 402–408. [Google Scholar] [CrossRef]
  59. Wei, H.S.; Duan, H.X.; Li, K.B.; Zhang, S.; Wei, Z.J.; Yin, J. The mechanism underlying OBP heterodimer formation and the recognition of odors in Holotrichia oblita faldermann. Int. J. Biol. Macromol. 2020, 152, 957–968. [Google Scholar] [CrossRef]
  60. Zhan, H.X.; Dewer, Y.; Zhang, J.P.; Tian, J.; Li, D.; Qu, C.; Yang, Z.; Li, F.; Luo, C. Odorant-binding protein 1 plays a crucial role in the olfactory response of Bemisia tabaci to R-curcumene. J. Agric. Food Chem. 2021, 69, 12785–12793. [Google Scholar] [CrossRef]
  61. Qu, Y.; Liu, X.; Zhao, X.; Qin, J.; Cao, Y.; Li, K.; Zhou, J.J.; Wang, S.; Yin, J. Evidence of the involvement of a plus-C odorant-binding protein HparOBP14 in host plant selection and oviposition of the scarab beetle Holotrichia parallela. Insects 2021, 12, 430. [Google Scholar] [CrossRef] [PubMed]
  62. Li, J.Q.; Zhu, R.; Yao, W.C.; Yu, H.P.; Huang, J.R.; Wang, Z.; Sun, X.Y.; Yuan, D.H.; Sun, Y.Y.; Emam, S.S.; et al. Chemosensory protein 2 of male Athetis lepigone is involved in the perception of sex pheromones and maize volatiles. J. Agric. Food Chem. 2023, 71, 6277–6287. [Google Scholar] [CrossRef]
  63. Wang, W.W.; Han, K.R.; Jiang, X.F.; Liu, T.X.; Zhang, S.Z. Odorant-binding protein CrufOBP1 in Cotesia ruficrus females plays a pivotal role in the detection of Spodoptera frugiperda larvae. Int. J. Biol. Macromol. 2024, 274, 133491. [Google Scholar] [CrossRef]
  64. Gu, S.H.; Wang, S.Y.; Zhang, X.Y.; Ji, P.; Liu, J.T.; Wang, G.R.; Wu, K.M.; Guo, Y.Y.; Zhou, J.J.; Zhang, Y.J. Functional characterizations of chemosensory proteins of the Alfalfa plant bug Adelphocoris lineolatus indicate their involvement in host recognition. PLoS ONE 2012, 7, e42871. [Google Scholar] [CrossRef]
  65. Tang, R.; Su, M.W.; Zhang, Z.N. Electroantennogram responses of an invasive species fall webworm (Hyphantria cunea) to host volatile compounds. Chin. Sci. Bull. 2012, 57, 4560–4568. [Google Scholar] [CrossRef]
  66. Delorme, J.D.; Payne, T.L. Antennal olfactory responses of black turpentine beetle, Dendroctonus terebrans (Olivier), to bark beetle pheromones and host terpenes. J. Chem. Ecol. 1990, 16, 1321–1329. [Google Scholar] [CrossRef]
  67. Han, B.Y.; Chen, Z.M. Behavioral and electrophysiological responses ofnatural enemies to synomones from tea shoots and kairomones from tea aphids, Toxoptera aurantii. J. Chem. Ecol. 2002, 28, 2203–2219. [Google Scholar] [CrossRef]
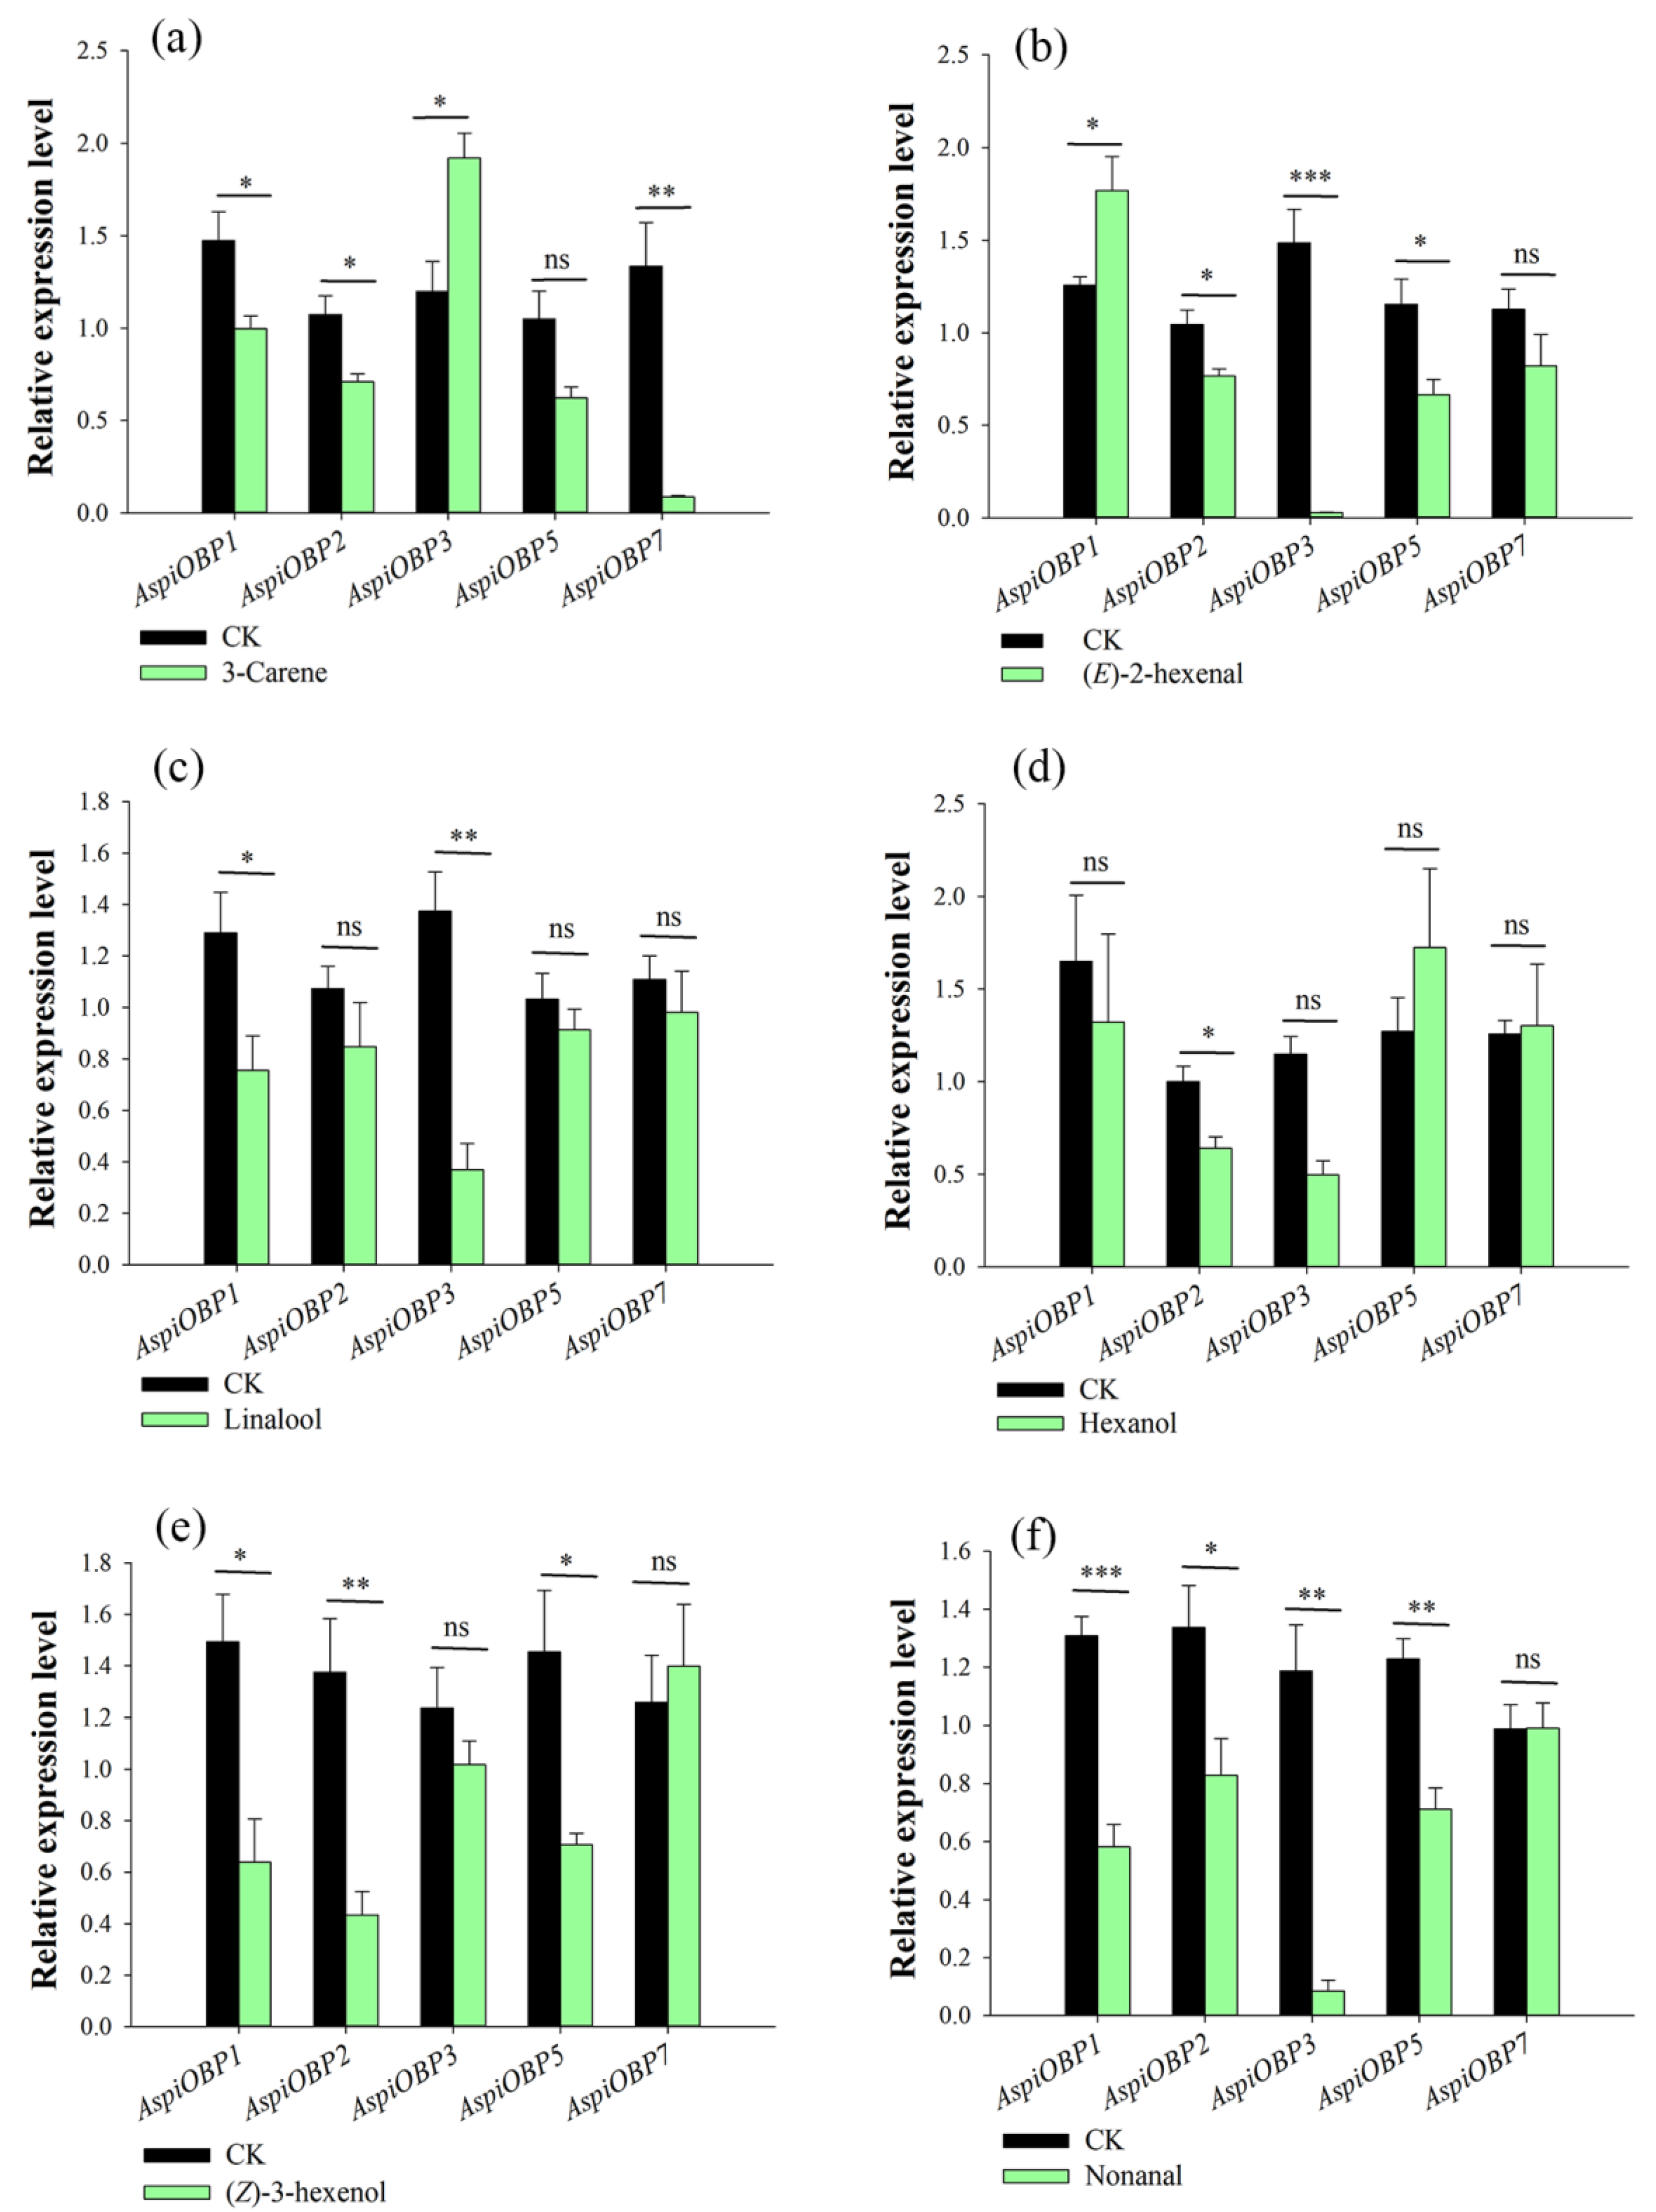
Figure 1. Effect of exposure to six host volatiles on transcript levels of AspiOBP genes. Templates from A. spiniferus treated with four attractants [3-carene (a), (E)-2-hexenal (b), linalool (c), hexanol (d)] and two repellents [nonanal (f), (Z)-3-hexenol (e)] were compared with those from untreated A. spiniferus. Bars indicate standard errors. All experiments were done in four replicates, using a two-tailed Student’s t test. * p < 0.05; ** p < 0.01; *** p < 0.001; ns indicate non-significant difference.
Ijms 26 08784 g001
Figure 2. Bacterially expressed AspiOBP1 and AspiOBP2. Label 1, non-induced with IPTG; 2, induced with IPTG; 3, protein; 4, supernatant; 5, insoluble aggregate; 6, protein eluted from 20 mmol/L imidazole; 7, protein eluted from 50 mmol/L imidazole; 8, protein eluted from 100 mmol/L imidazole; 9, protein eluted from 250 mmol/L imidazole; 10, protein eluted from 500 mmol/L imidazole; M, molecular weight marker.
Ijms 26 08784 g002
Figure 3. Ligand-binding assays of recombinant AspiOBP2. (a): Binding curve and Scatchard formula analysis of bis-ANS with AspiOBP2. (b): Binding curves of AspiOBP2 with six ligands.
Ijms 26 08784 g003
Figure 4. Sequence and structure of AspiOBP1. (a): Three-dimensional structure of AspiOBP1; (b): Alignment of amino acid sequences between AspiOBP1 and template.
Ijms 26 08784 g004
Figure 5. The molecular docking results of AspiOBP1 to (a): 3-carene, (b): (E)-2-hexenal (c): linalool, (d): hexanol, (e): (Z)-3-hexenol, (f): nonanal. The first and third columns show the optimal binding mode of AspiOBP1 to ligands. The second and fourth columns show the three-dimensional diagram of docking results. Blue solid lines show the hydrogen bonds, black dashed lines show the hydrophobic interactions.
Ijms 26 08784 g005
Figure 6. Effect of RNAi treatment on the transcript levels of AspiOBP1 (a) and AspiOBP2 (b). Different letters above bars indicate statistically significant differences based on one-way analysis of variance using the Tukey’s-b multiple range test (p < 0.05).
Ijms 26 08784 g006
Figure 7. Effect of silencing AspiOBP1 (a) and AspiOBP2 (b) on EAG recordings of A. spiniferus to host volatiles. Data are shown as mean ± SEM, *** p < 0.001, one-way analysis of variance, Tukey’s-b multiple range test. ns indicate non-significant difference.
Ijms 26 08784 g007
Figure 8. Behavioral responses of CK, dsGFP-feeding and dsAspiOBP1-feeding A. spiniferus to 3-carene (a), (E)-2-hexenal (b), linalool (c), hexanol (d), (Z)-3-hexenol (e), nonanal (f). Asterisks indicate significant difference (* p < 0.05, ** p < 0.01, *** p < 0.001) preference between control and odor sources via a Chi-square test. The number to the right of the asterisk is the Chi-square. n.s. means no significant difference (p > 0.05).
Ijms 26 08784 g008
Figure 9. Behavioral responses of CK, dsGFP-feeding and dsAspiOBP2-feeding A. spiniferus to 3-carene (a), (E)-2-hexenal (b), linalool (c), hexanol (d), (Z)-3-hexenol (e), nonanal (f). Asterisks indicate significant difference (* p < 0.05, ** p < 0.01, *** p < 0.001) preference between control and odor sources via a Chi-square test. The number to the right of the asterisk is the Chi-square. n.s. means no significant difference (p > 0.05).
Ijms 26 08784 g009
Table 1. Binding energy of AspiOBP1 to ligands.
ProteinsLigandsDocking Energy
(kcal/mol)
AspiOBP13-Carene−3.07
(E)-2-Hexenal−2.47
(Z)-3-Hexenol−3.10
Linalool−1.78
Hexanol−1.99
Nonanal−1.89
Disclaimer/Publisher’s Note: The statements, opinions and data contained in all publications are solely those of the individual author(s) and contributor(s) and not of MDPI and/or the editor(s). MDPI and/or the editor(s) disclaim responsibility for any injury to people or property resulting from any ideas, methods, instructions or products referred to in the content.