Article

Deep Sequencing Reveals Novel Mutations in Androgen Receptor-Related Genes in Prostate Cancer

by
Abraham Pedroza-Torres
1,†,
Noemí Baranda-Avila
2,†,
Jorge L. Ramírez
2,
Maricruz González
2,
Pamela A. González
2,
Blanca L. Torres
2,
Miguel A. Jiménez-Ríos
3,
Alfonso Méndez-Tenorio
4,
Rosa María Álvarez-Gómez
5 and
Greco Hernández
2,6,*
1
Cátedra SECIHTI-Clínica de Cáncer Hereditario, National Institute of Cancer (Instituto Nacional de Cancerología, INCan), Mexico City 14080, Mexico
2
Laboratory of mRNA and Cancer, Unit of Biomedical Research on Cancer, National Institute of Cancer (Instituto Nacional de Cancerología, INCan), Mexico City 14080, Mexico
3
Department of Oncologic Urology, National Institute of Cancer (INCan), Mexico City 14080, Mexico
4
Laboratory of Biotechnology and Genomic Bioinformatics, National School of Sciences, National Polytechnic Institute (Instituto Politécnico Nacional), Mexico City 07840, Mexico
5
Clínica de Cáncer Hereditario, National Institute of Cancer (Instituto Nacional de Cancerología, INCan), Mexico City 14080, Mexico
6
Tecnologico de Monterrey, Escuela de Medicina y Ciencias de la Salud, Mexico City 14380, Mexico
*
Author to whom correspondence should be addressed.
These authors contributed equally to this work.
Int. J. Mol. Sci. 2025, 26(18), 8758; https://doi.org/10.3390/ijms26188758
Submission received: 16 April 2025 / Revised: 26 June 2025 / Accepted: 26 June 2025 / Published: 9 September 2025
(This article belongs to the Special Issue Prostate Cancer Research Update: Molecular Diagnostic Biomarkers)

Abstract

Prostate cancer (PCa) is the second most frequent tumor and the fifth leading cause of cancer-related death in men worldwide. PCa shows the largest clinical disparities across Asian, Caucasian, and African descendants among all cancer types, proving that the ethnic genetic background plays a significant role in PCa. Androgen Receptor (AR) gene malfunctioning represents the most prevalent cause of PCa. AR also displays a broad spectrum of genetic variability across ethnic backgrounds differently associated with cancer risk. We conducted a massive sequencing analysis of 15 genes highly relevant for PCa or the AR activation pathway in biopsies from 64 tumors and 36 benign prostate samples from Mexican patients. We identified 3414 genomic mutations and observed that AR, SPOP, TP53, FOXA1, and MTOR had the highest rate of pathogenic mutations in tumors, evidencing their relevance in PCa. AR showed 13 unique mutations, followed by SPOP (6), TP53 (5), FOXA1 (4), and MTOR (3). We discovered 19 novel mutations specific of Hispanic patients, a population only scarcely studied, thus adding critical information on the genetic diversity of the mutational landscape in genes key for PCa. We discuss the clinical relevance of these mutations and predict the structural consequences on the proteins. Mutations in FOXA1 showed significant negative association with patient survival and might be used as novel PCa markers, at least for Hispanic men.

1. Introduction

Prostate cancer (PCa) is the second most frequently diagnosed tumor in men and the fifth cause of death by cancer worldwide. About 2.9 million new cases and 795,000 deaths from this type of tumor were reported in 2022, and it is expected that the PCa incidence will be duplicated between 2020 and 2040. Moreover, deaths will increase by about 85%, particularly in low-income countries [1,2,3,4]. PCa results from the uncontrolled proliferation and dispersion of cells from the prostate epithelium. Indeed, PCa is a heterogeneous illness that displays a broad spectrum of clinical evolution and phenotypic defects [5,6,7]. Currently, several factors limit the diagnosis, prognosis, and treatment of PCa in the early stages. On the one hand, the clinical management of prostate tumors has demonstrated extreme complexity due to the high heterogeneity of factors such as age, race/ethnicity, and family history, which modify the clinical outcome of PCa patients [7,8,9,10]. PCa has one of the largest clinical disparities among races of all cancer types. PCa comparative studies mostly among Caucasian, Asian, and African descendants have proven that the race/ethnic genetic background plays a significant role in the origin and progression of this disease [10,11,12]. On the other hand, the wide use of the blood level of prostate-specific antigen (PSA) as a diagnostic marker has enhanced patients’ early detection of PCa. However, its predictive value is currently under debate, as PSA is frequently elevated in patients with benign tumors, hyperplasia, and prostatitis, limiting its specificity for cancer [7,13], and because it possesses poor diagnosis and predictive values of PCa mortality in population screenings [14,15]. Thus, new research has favored the use of other methods for early detection of cancer such as the Gleason score of tumors, the Prostate Health Index (phi), and the urinary PCA3 level with slightly better results [7,16,17].
At the molecular level, the gene fusion TMPRSS2-ERG is one of the most conspicuous tumor signatures [18], and genome-wide association studies have identified alterations (i.e., point mutations, chromosome rearrangements, indels, and copy number variations) in more than 100 low-penetrance loci defining the molecular landscape of PCa [19]. However, so far, they have shown minimal power of predicting cancer risk. Misexpression of other loci with high penetrance have also been associated with PCa, including long non-coding (Inc)RNA RPS-997D16.2, AR, BRCA2, HOXB13, TP53, RB1, PTEN, TMPRSS2-ERG fusion, ETV1, ETV4, FLI1, SPOP, FOXA1, IDH1, BRCA2, ATM, MYC, and BRAF. Although they might have clinical utility, their possible value in predicting cancer risk and treatment options remain under study [19,20,21,22,23,24,25]. The differential occurrence of mutations among Asian, Caucasian, and African descendants has also been observed for some genes, including SPOP [26], the gene fusion TMPRSS2-ERG [27,28,29], p16 [30], the microRNA mir34 [31], and FOXA1 [32].
Malfunctioning of the transcription factor Androgen Receptor (AR) represents the most prevalent cause of onset and progression of PCa, as the prostate function strongly depends on the action of both androgens and AR. AR is part of the family of steroid hormone receptors and regulates hundreds of genes responsible for the development of male characteristics [33,34,35,36]. Accordingly, 2–18% of prostate tumors show point mutations in the AR gene, and gene amplifications have been reported in 5–52%, preferably in castration-resistant PCa subtypes [12,21,22,37,38,39,40]. The AR gene also displays a broad spectrum of variability in both polymorphisms and mutations across different ethnical backgrounds that might be differently associated with cancer risk [41,42,43,44,45]. The relationship between AR mutational variability with mutations in other genes and their clinical outcome is also scarcely understood.
To better understand the role that AR gene mutagenesis plays in prostate carcinogenesis, we conducted a massive, next-generation sequencing (NGS) analysis of a panel of genes highly relevant for PCa in prostate tumor biopsies from a scarcely studied cohort, namely Hispanic patients. Our results showed that AR, SPOP, TP53, FOXA1, and MTOR carried a high rate of pathogenic mutations in patients with CaP, evidencing their prostate cancer relevance. Among them, we report 19 novel mutations, correlate them with the clinical profiles of patients, and discuss their possible impact in PCa. We also discovered that mutations in FOXA1 were significantly associated with patient survival.

2. Results

2.1. Clinicopathologic Characteristics of Patients

We analyzed biopsies from 160 patients who attended the Department of Oncologic Urology of the National Institute of Cancer (Mexico City) between February 2016 and September 2018. Overall, 96 (60%) patients met the described criteria to be included in the NGS analysis. The patient inclusion criteria were as follows: Mexican men with all four Mexican grandparents; patients who have signed informed consent; men ≥ 18 years of age with the capacity to make their own decisions; histologically or cytologically confirmed diagnosis of prostate carcinoma without neuroendocrine differentiation or small cell features; any Gleason score; adequate organ function; any TNM stage; and ECOG score of 0 or 1. The exclusion criteria were as follows: patients with symptomatic local or regional disease requiring medical intervention; those who have received any treatment prior to biopsy collection; comorbidity with another type of cancer, autoimmune diseases, or any other condition that could impair the patient’s ability to comply with the study procedures; and prostate biopsy is contraindicated. The clinical and pathological characteristics of all patients are summarized in Table 1.
After histopathological examination, samples were categorized into two groups: 64 (66%) were “PCa” tissue, and 32 (34%) were “non-PCa,” i.e., non-tumorous tissue (benign prostate) obtained from independent and healthy individuals. The average age of the PCa patients was 68 years (ranging from 41 to 82), while the average age of non-PCa patients was 67 years (ranging from 45 to 83).

2.2. Risk Factors Identified in Our Patient Cohorts

The median value of the prostate-specific antigen (PSA) in the PCa group was 305 ng/mL, while in the non-PCa group, it was 10.5 ng/mL. The median body mass index (BMI), another risk factor considered for PCa, was 27 (ranging from 17.89 to 36.17) in the PCa group, while in the non-PCa group, it was 25.9 (ranging 22.8 to 31.6). Noticeably, 37 (57.8%) patients of the PCa group were addicted to smoking (n = 4; 6.25%), alcohol (n = 11; 17.18%), and both alcohol and smoking (n = 22; 34.37%). In this group, six patients (9.7%) had a Gleason score < 7; 25 patients (40.3%) had a Gleason score = 7; and 31 patients (50%) had a Gleason score > 7. Additionally, 41 patients (74.5%) were diagnosed with perineural invasion, and 19 patients (38%) were confirmed with distant metastasis (Table 1).

2.3. Sequencing Statistics

We performed next-generation sequencing of a panel designed to analyze 15 genes strongly associated with the PCa development from PCa and non-PCa samples. Our 15-gene panel generated 471 amplicons of 200 base pairs on average, with a total length of 57.32 kb and an average coverage of 97.73%. On average, a total of 5,152,539 reads were obtained for each patient, with 95.6% of readings mapped into the target sequences and an average depth of 8214X.

2.4. Genomic Alterations

After variant annotation, a total of 3414 genomic variants were identified, of which 308 were classified as probably pathogenic variants (287 missense, nine frameshift insertion, five non-frameshift deletion, two frameshift deletion, and five nonsense); 909 were synonymous variants; and 2197 were variant of uncertain significance (VUS) (Supplementary Table S2). We plotted the number of functional mutations for each analyzed gene across all samples, both tumor and non-PCa tumor. Interestingly, the genes with the highest number of mutational events were TP53, AR, and FOXO1. Moreover, the genes with the lowest number of mutational events were EIF4E, CYP17A1, and MAPK1 (Figure 1). Subsequently, we identified the type of mutations present in every gene in all samples. The top five genes that presented the highest number of mutations were TP53 (88%), FOXO1 (48%), AR (28%), TMPRSS2 (26%), and FOXA1 (12%) (Figure 2). Genes SRD5A2 and Nkx3.1 did not present any mutation. The most frequent type of mutations in tumors were missense changes, and the second most frequent were frameshift deletions (Figure 2). No relationship was found between the Gleason score and the number of mutations found in each sample.
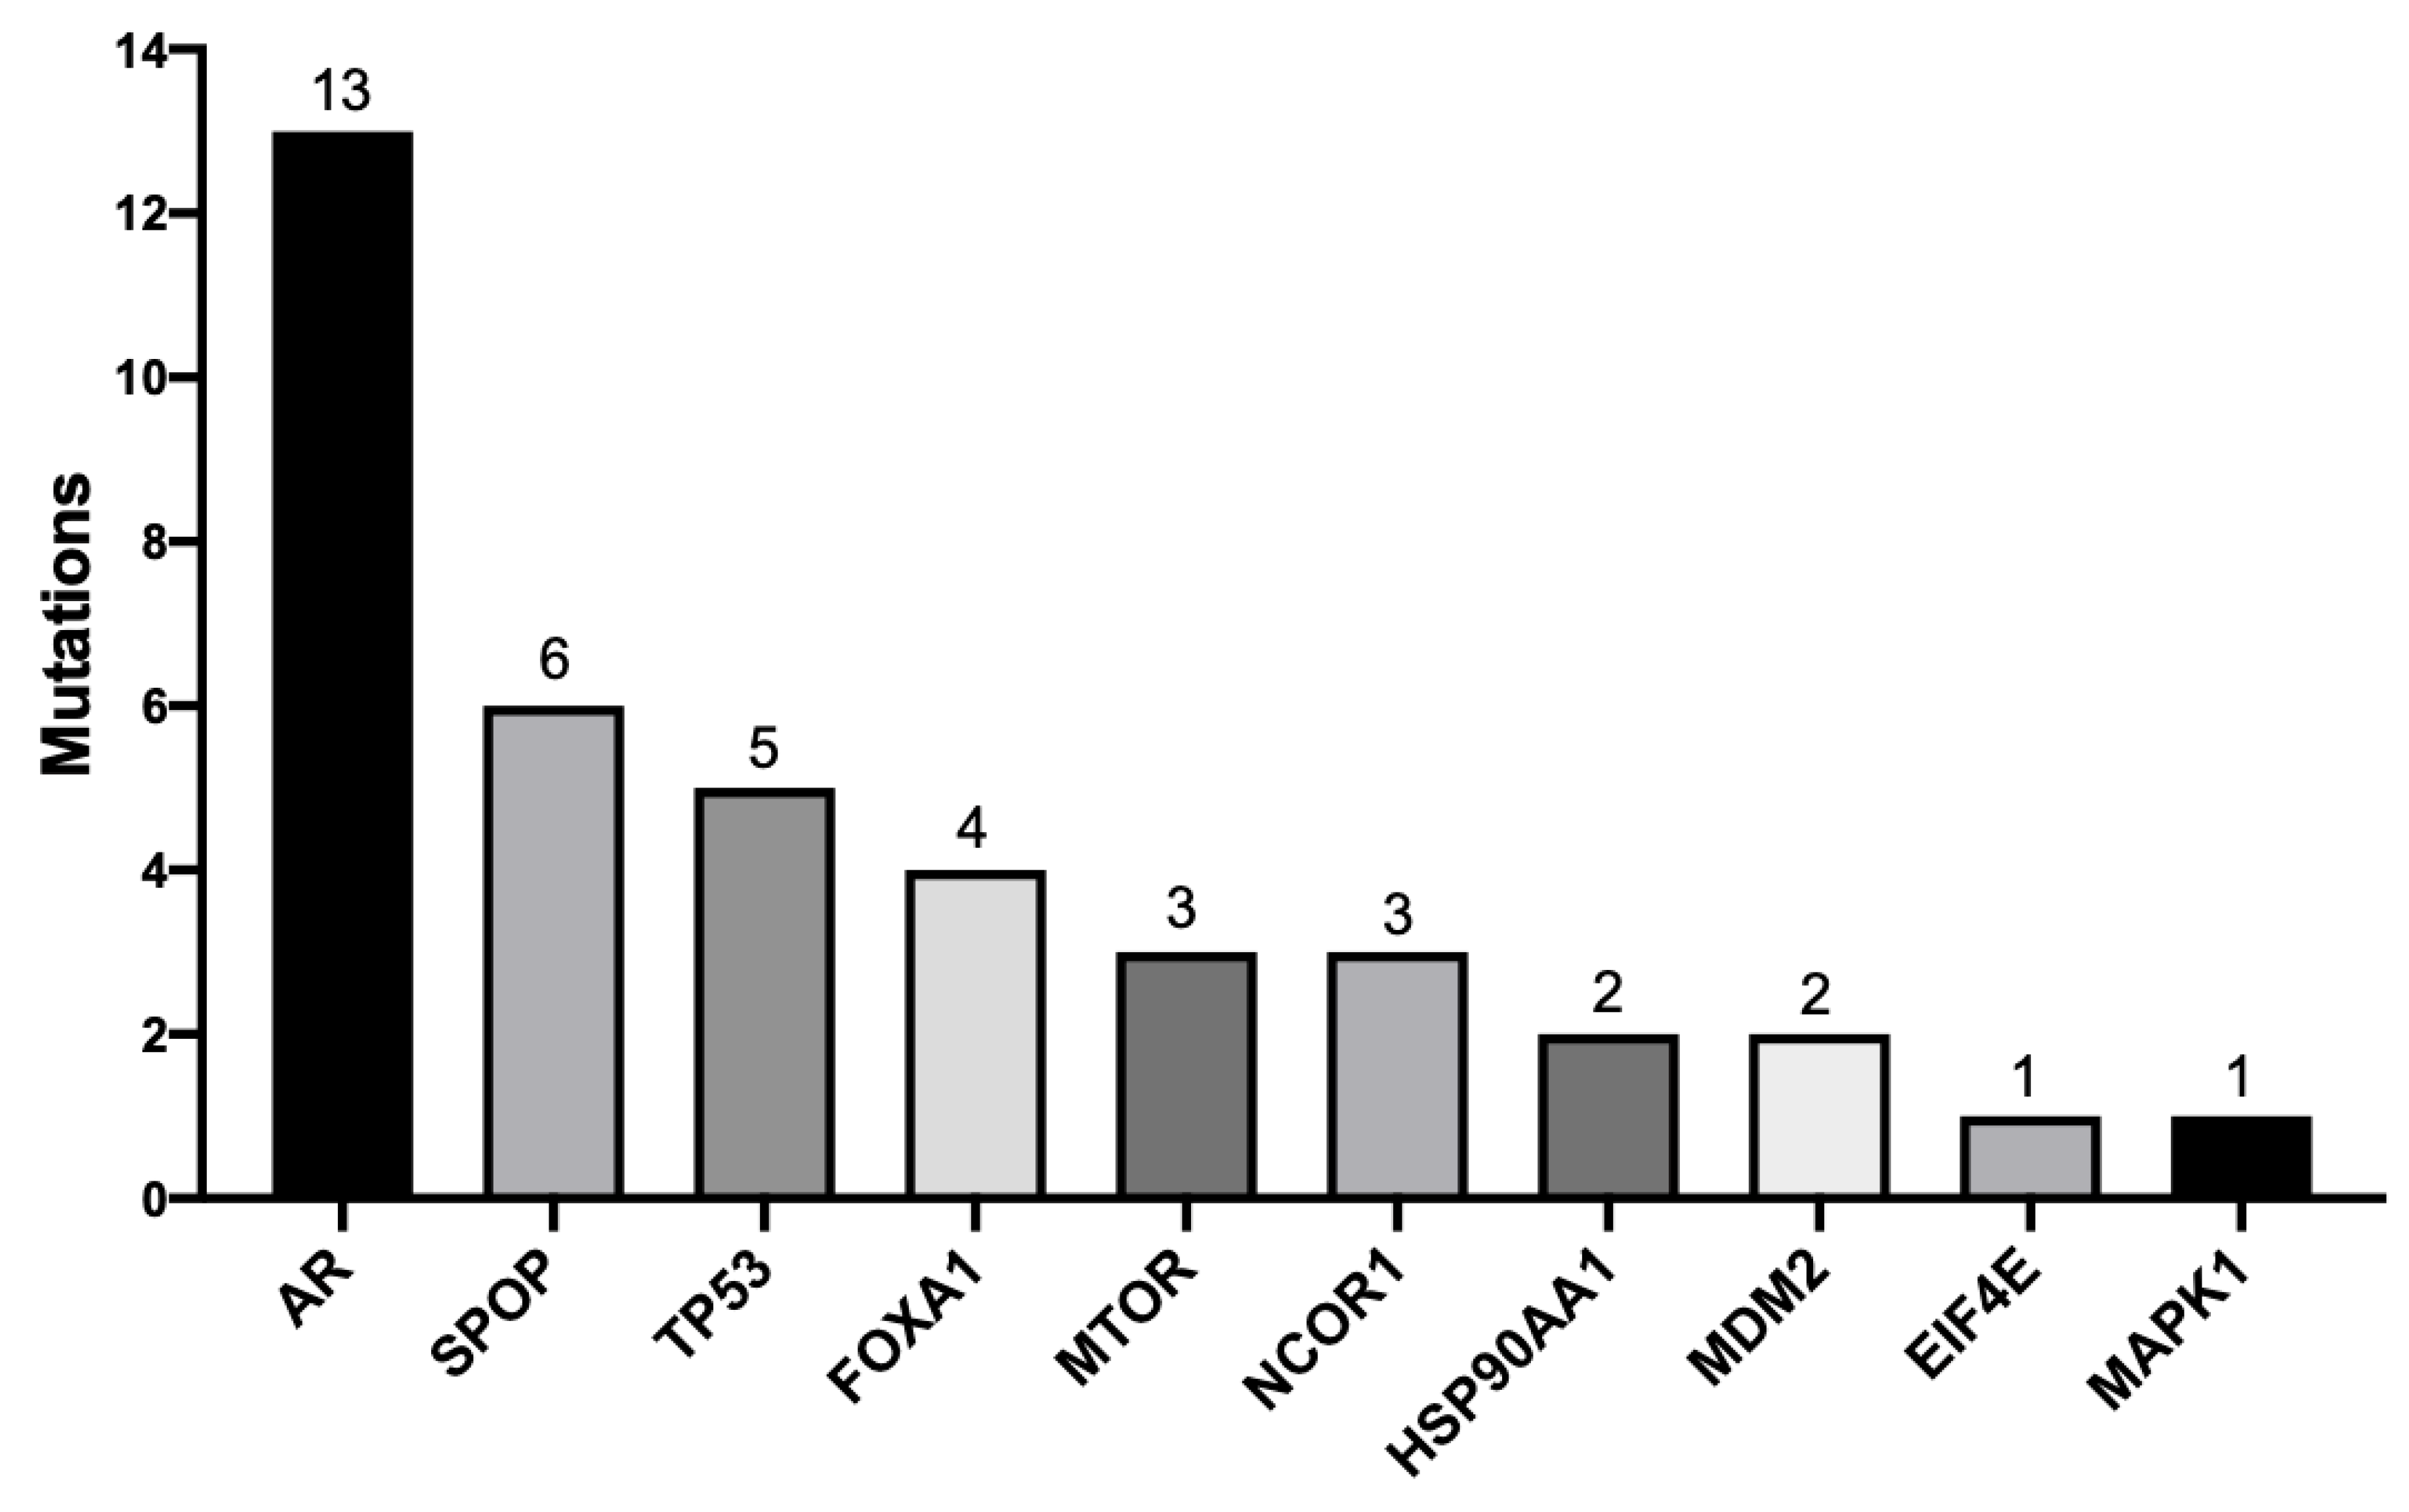
We next classified those genetic variants present only in tumor samples according to their biological and clinical significance. Overall, we detected 40 unique pathogenic mutations, 15 unique synonymous mutations (considered benign), and 48 VUS. Within the pathogenic variants, 29 (72.5%) were classified as missense, with one (2.5%) frameshift deletion, five (12.5%) frameshift insertions, three (4.16%) non-frameshift deletions, and two (5%) nonsense (Table 2). Noticeably, AR was the gene with the highest number of putative pathogenic mutations with 13 different hits (seven missense mutations, five frameshift mutations, and one nonsense mutation), followed by SPOP with six mutations (all missense type), TP53 with five mutations (four missense and one nonsense), FOXA1 with four pathogenic variants (two non-frameshift deletion and two missense), NCOR1 with three mutations (one non-frameshift deletion and two missense), and MTOR with three mutations (all missense type) (Figure 3). In HSP90AA1 and MDM2 genes, we detected two pathogenic, missense mutations in each gene. In addition, we found a single missense mutation in MAPK1 and EIF4E genes. We did not find genomic variants in CYP17A1, SRD5A2, FOXO1, NKx3.1, and TMPRSSD2 genes that were present only in the PCa samples (Figure 3 and Table 2).

2.5. Pathogenic Mutations

After identification of genomic variants, we performed a web-based analysis to predict the potential role of the identified variants by means of SIFT, Polyphen-2, PhyloP, and Grantham algorithms. The most prevalent pathogenic variant found in the PCa patient cohort was SPOP c.398T>G (Polyphen-2 score = 1; Grantham score = 155; n = 3; 4.68%), followed by TP53 c.578A>C (Polyphen-2 score = 1; Grantham score = 77; n = 2; 3.1%) and EIF4E c.144_145delTA (frameshift deletion; Polyphen-2 and Grantham score; n = 2; 3.1%). Other pathogenic variants found with a lower frequency were AR c.61G>A (SIFT score = 0; Polyphen-2 score = 1; Grantham score = 125; n = 1; 1.56%), FOXA1 c.655C>A (SIFT score = 0; Polyphen-2 score = 1; Grantham score = 110; n = 1; 1.56%), MTOR c.5705A>T (SIFT score = 0; Polyohen-2 score = 1; Grantham score = 152; n = 1; 1.56%), and NCOR1 p.Gln1602Arg (SIFT score = 0; Polyphen-2 score = 1; Grantham Score = 43; n = 1; 1.56%). Among the previously reported genomic variants, seven were confirmed as pathogenic variants, nine as probably pathogenic, and two as probably benign, and two were reported with interpretation conflicts. All pathogenic variants found are summarized in Table 2.

2.6. Novel Mutations

Among the 40 genomic mutations identified, we found 19 without a previous report (i.e., novel mutations, specific of our Hispanic cohort), of which 11 were confirmed as pathogenic changes and seven as probably pathogenic, and one variant was classified as probably benign. All novel mutations are summarized in Table 2. The novel mutations were found in AR, FOXA1, EIF4E, HSP90AA1, MAPK1, mTOR, NCOR1, and MDM2. To gain insight of the novel mutations’ impact on proteins, we performed AlphaFold three-dimensional (3D) structure predictions [46] of those mutations based on the tertiary structures already described.
We found seven novel mutations in AR, namely G21R, T66fs, Q69fs, Q69R, Q70fs, Q77fs, and Q78fs (Figure 4A). All of them hit the amino-terminal domain (NTD) of the protein, which is an intrinsically disordered region [34,47]. Within the NTD, AR possesses a polymorphic region of polyglutamine (poly Q) encoded by 8–31 repeats of the CAG codon. Changes in the length of the poly Q tract determine the size of the α-helical structure of AR [34,47], as well as the transcriptional activity of it [48,49]. T66fs, Q69fs, Q69R, Q70fs, Q77fs, and Q78fs were located within the poly Q tract (Figure 4B). All, except Q69R, were predicted to produce truncated proteins that might act like dominant negative peptides disturbing AR transcriptional activity.
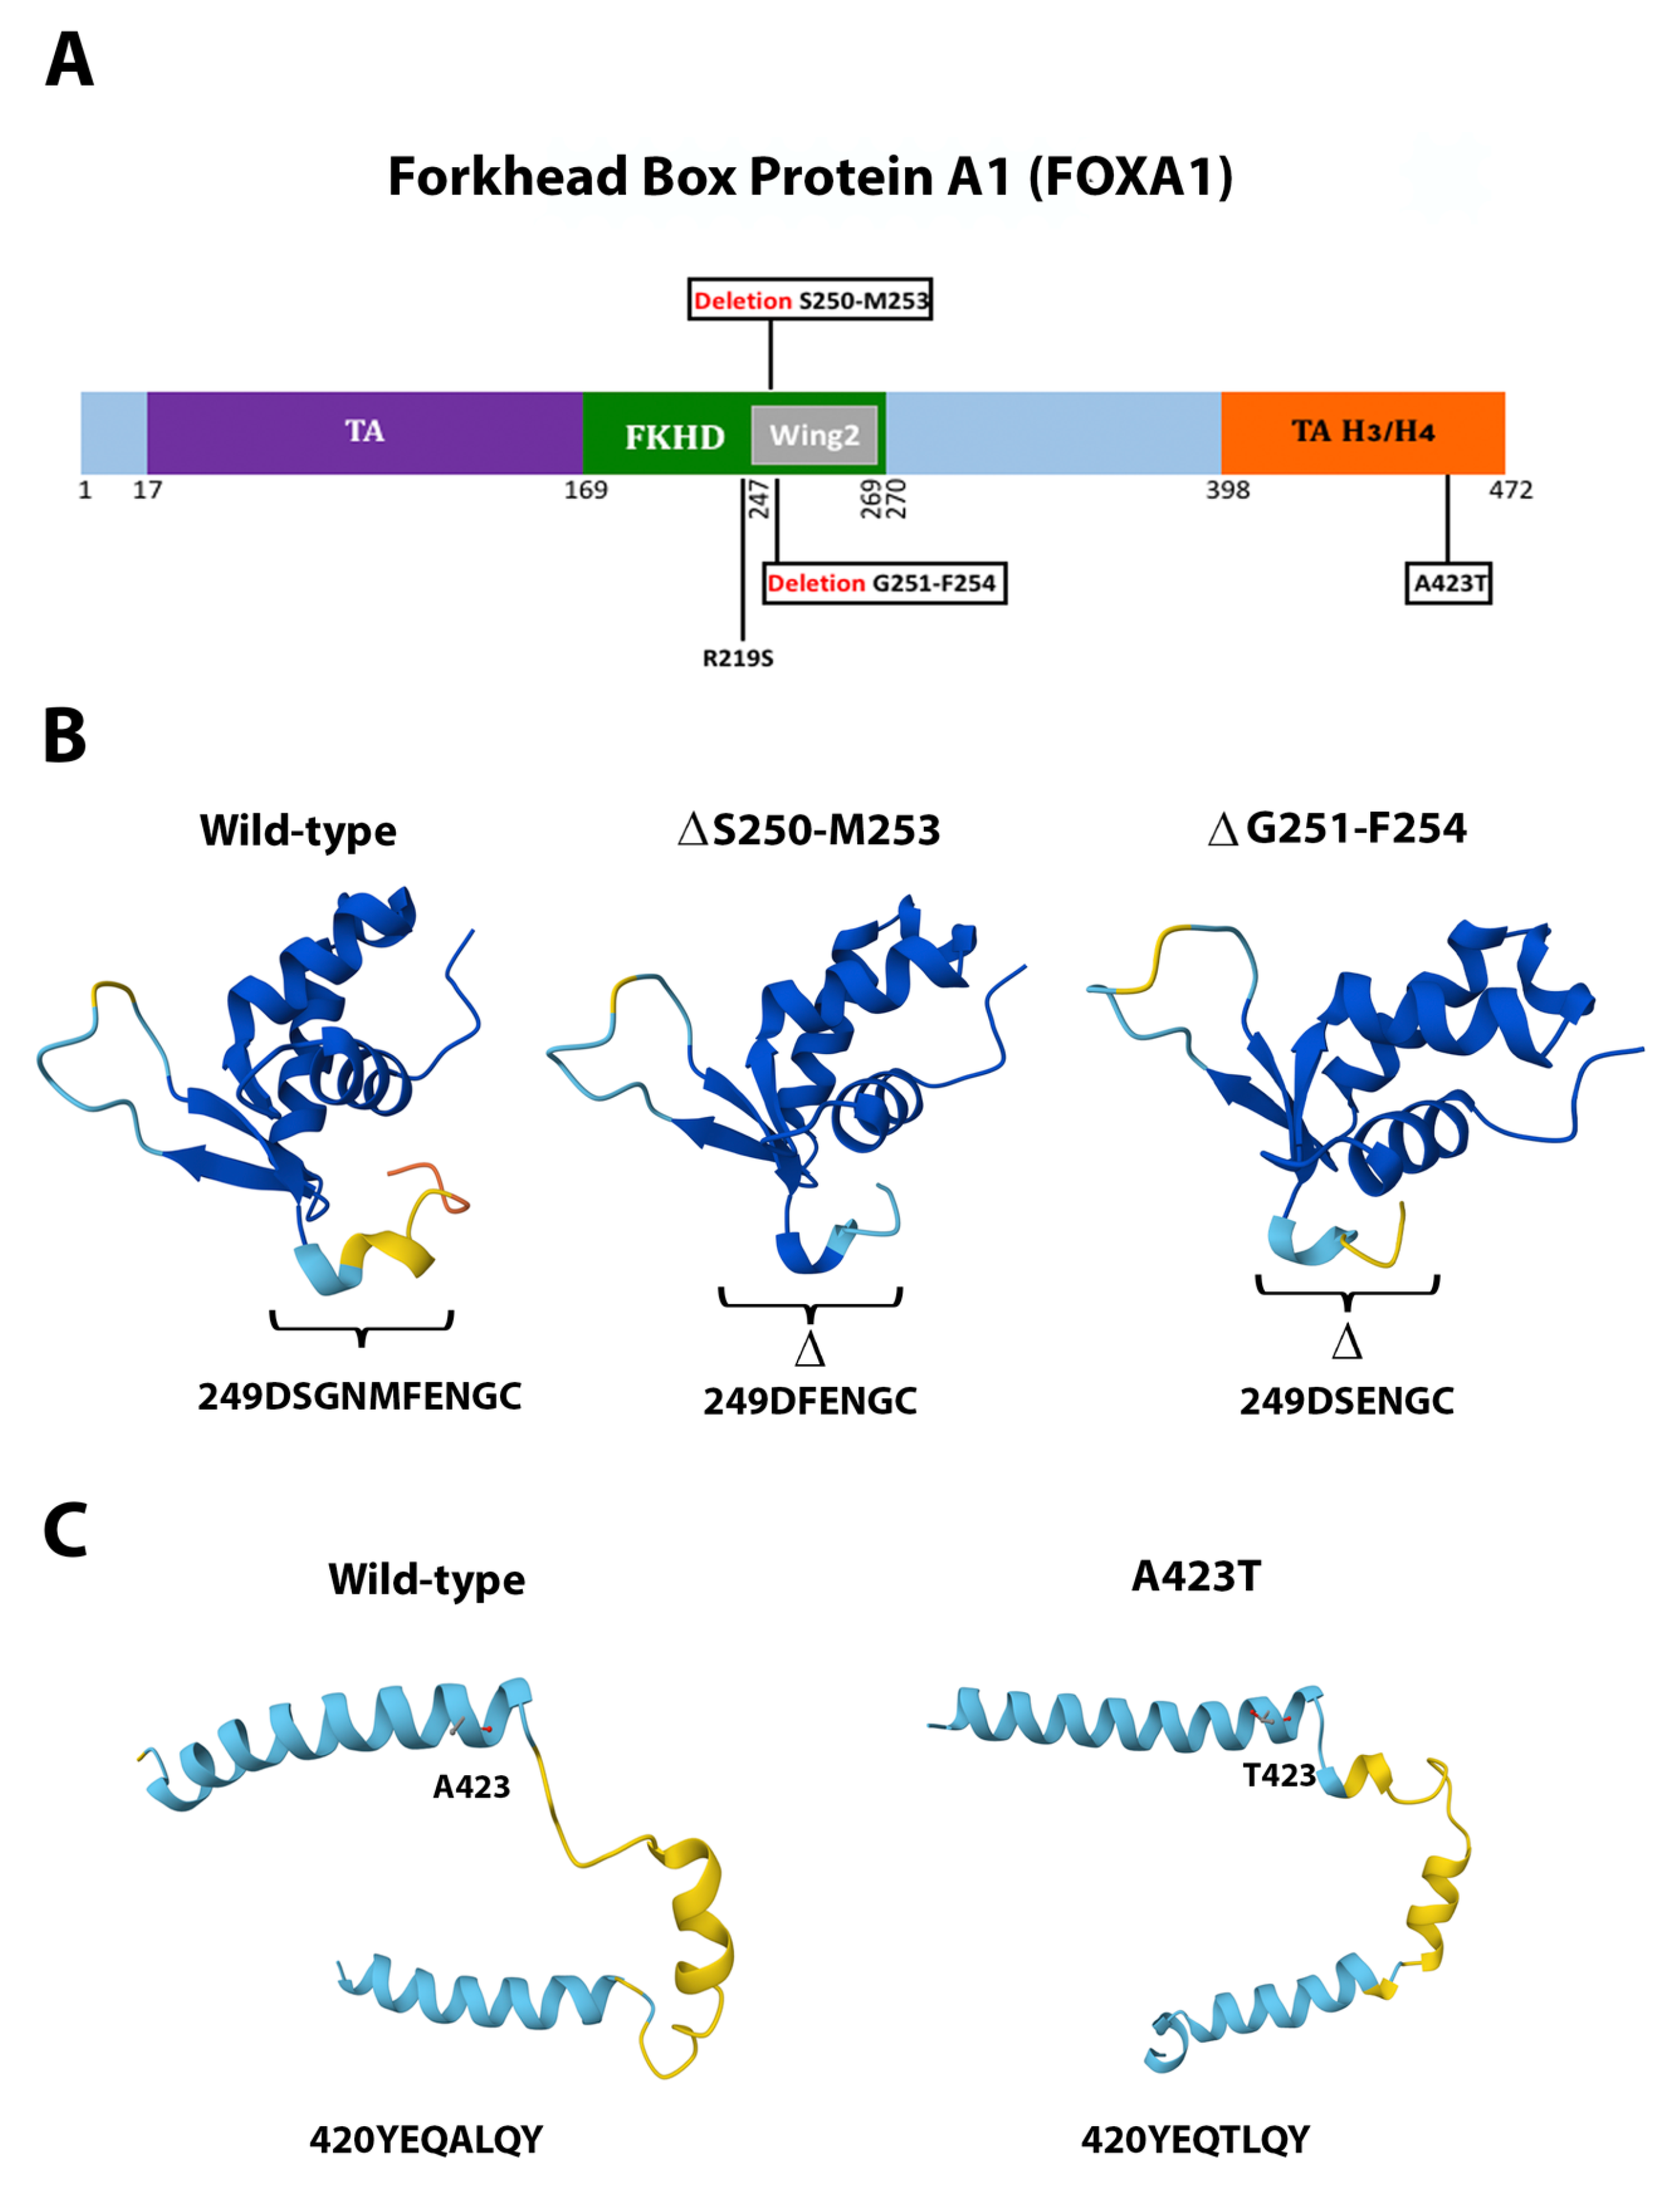
Deletions ΔS250-M253 and ΔG251-F254 in FOXA1 lay within the central forkhead DNA-binding domain (Figure 5A). They shortened the coded peptide, from ten to six amino acids-long (249DSGNMFENGC toward DFENGC and DSENGC, respectively), and are predicted to distort the β-sheet of the Wing2 domain [50] (Figure 5B). These deletions are located within the mutational hotspot across cancers that modify the transcriptional activity of FOXA1 [50,51,52,53]. Thus, it is predicted that the deletions we found in this study will also deregulate FOXA1 activity, and that may drive cancer. We also modeled the mutation A423T within the carboxy-terminal transactivation (TA) domain of the protein, which associates with histone H3/H4. This mutation is predicted to cause a spatial distortion forming an extra short α-helix, possibly modifying its protein-protein binding capacities (Figure 5C).
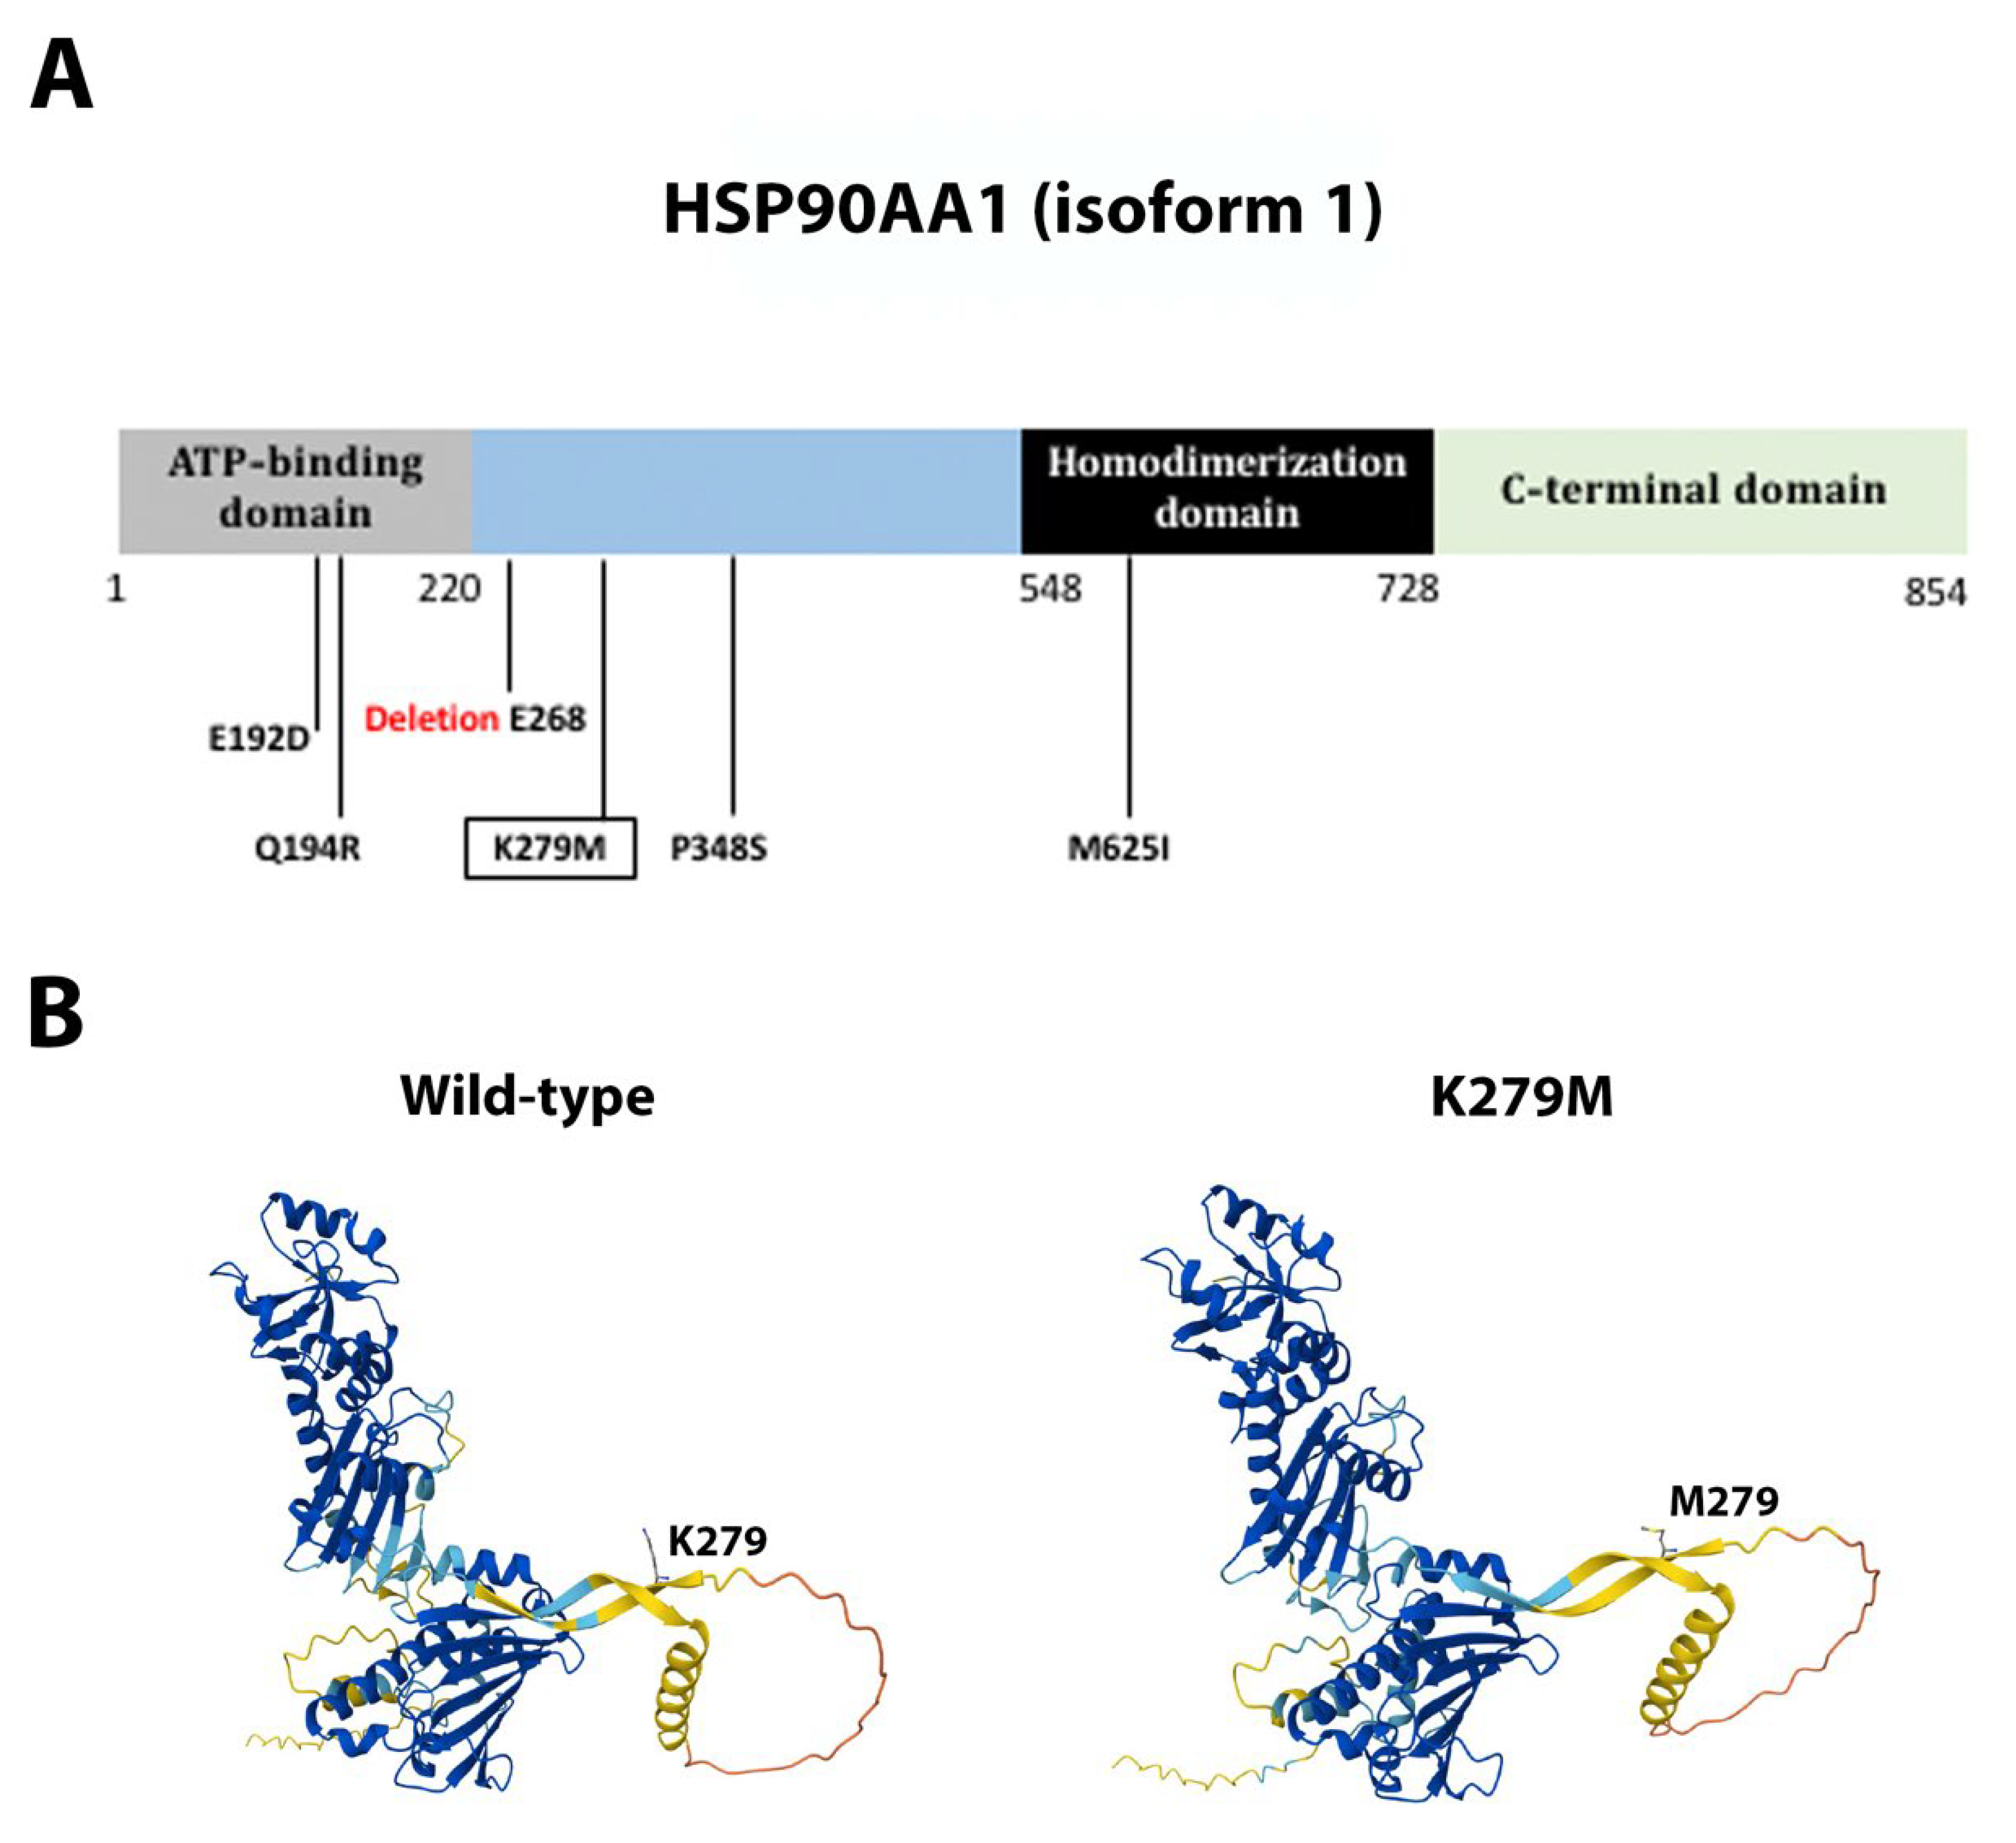
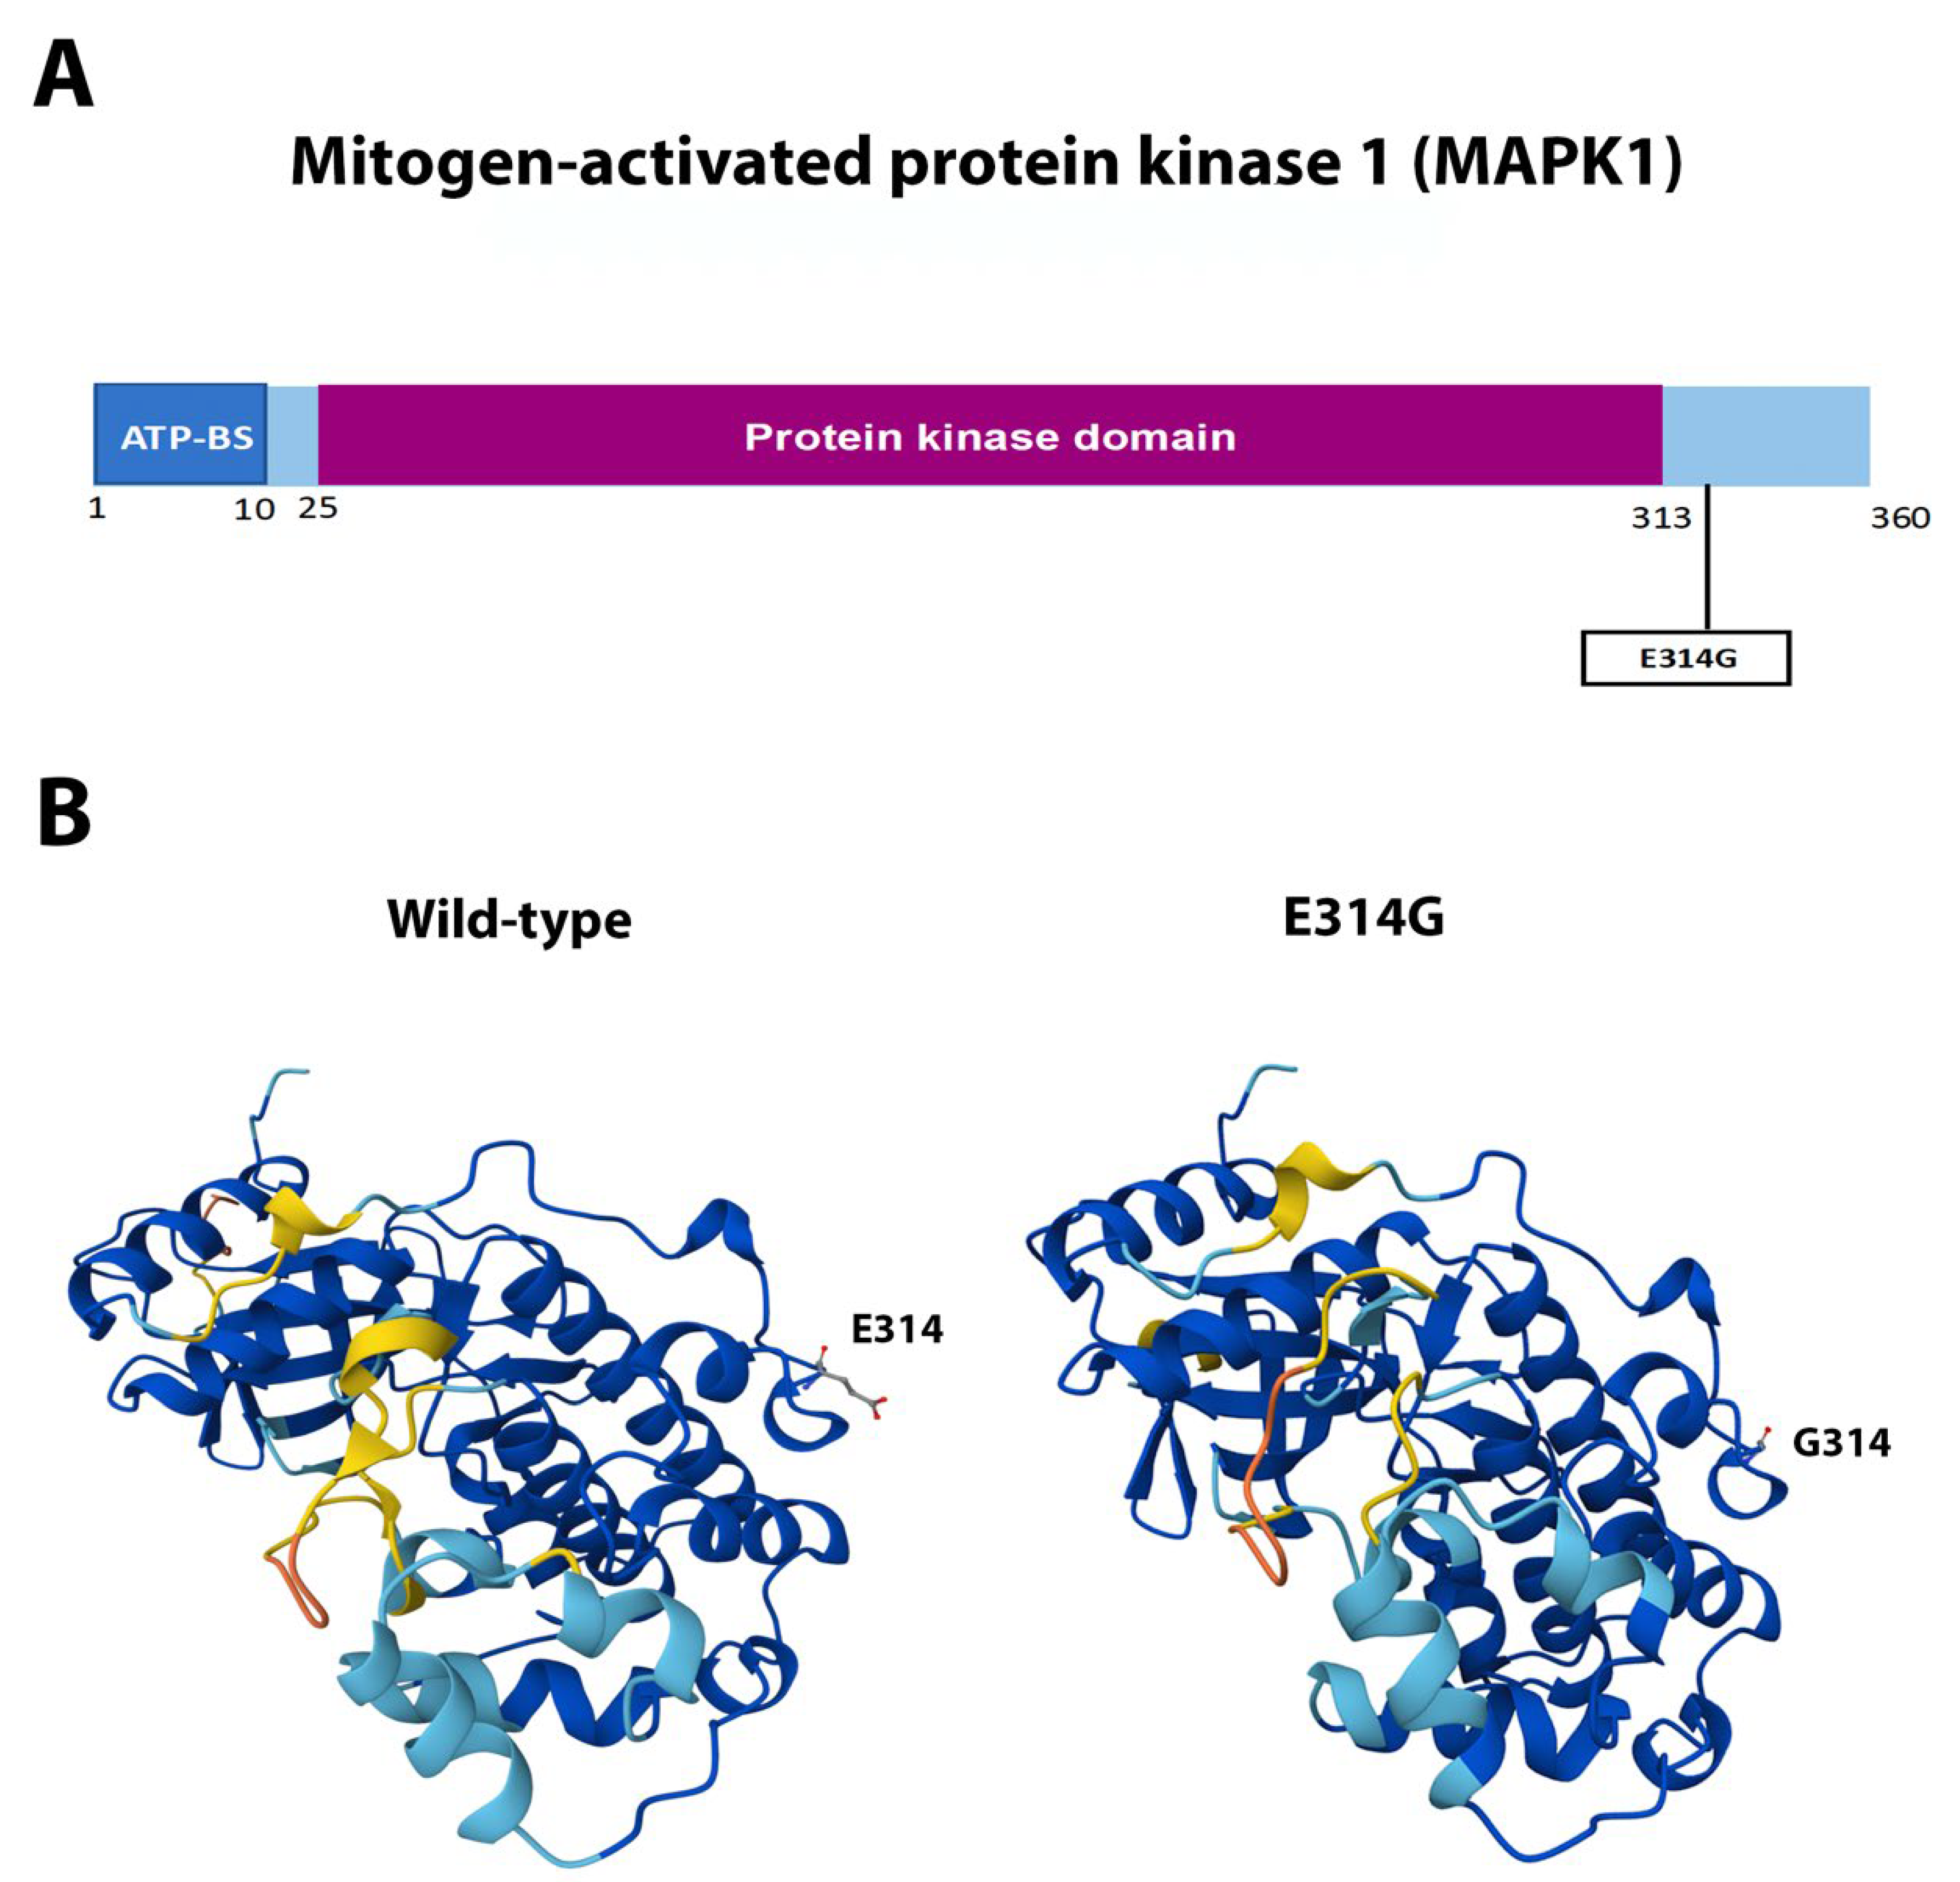
eIF4E contains four α-helices intercalated with eight β-sheets forming a cupped-hand-shaped protein [54,55]. Mutation F48 frameshift (Figure 6A) is predicted to produce a truncated protein at the beginning α-helix 3, with a sequence change 80QLSSNLMP toward 80QLSS (Figure 6B). HSP90AA1 missense, non-conservative mutation K279M (Figure 7A) appears not to significantly alter the overall protein structure [56,57], as it is oriented toward the solvent part of the protein and was located in between the two functional domains, namely the ATP-binding domain and the homodimerization domain (Figure 7B). MAPK1 missense, non-conservative mutation E314G (Figure 8A) is located at the α-helix 14 at the protein carboxi-terminus [58,59], outside the kinase domain and the active site. This mutation is predicted to cause little spatial distortion (Figure 8B).
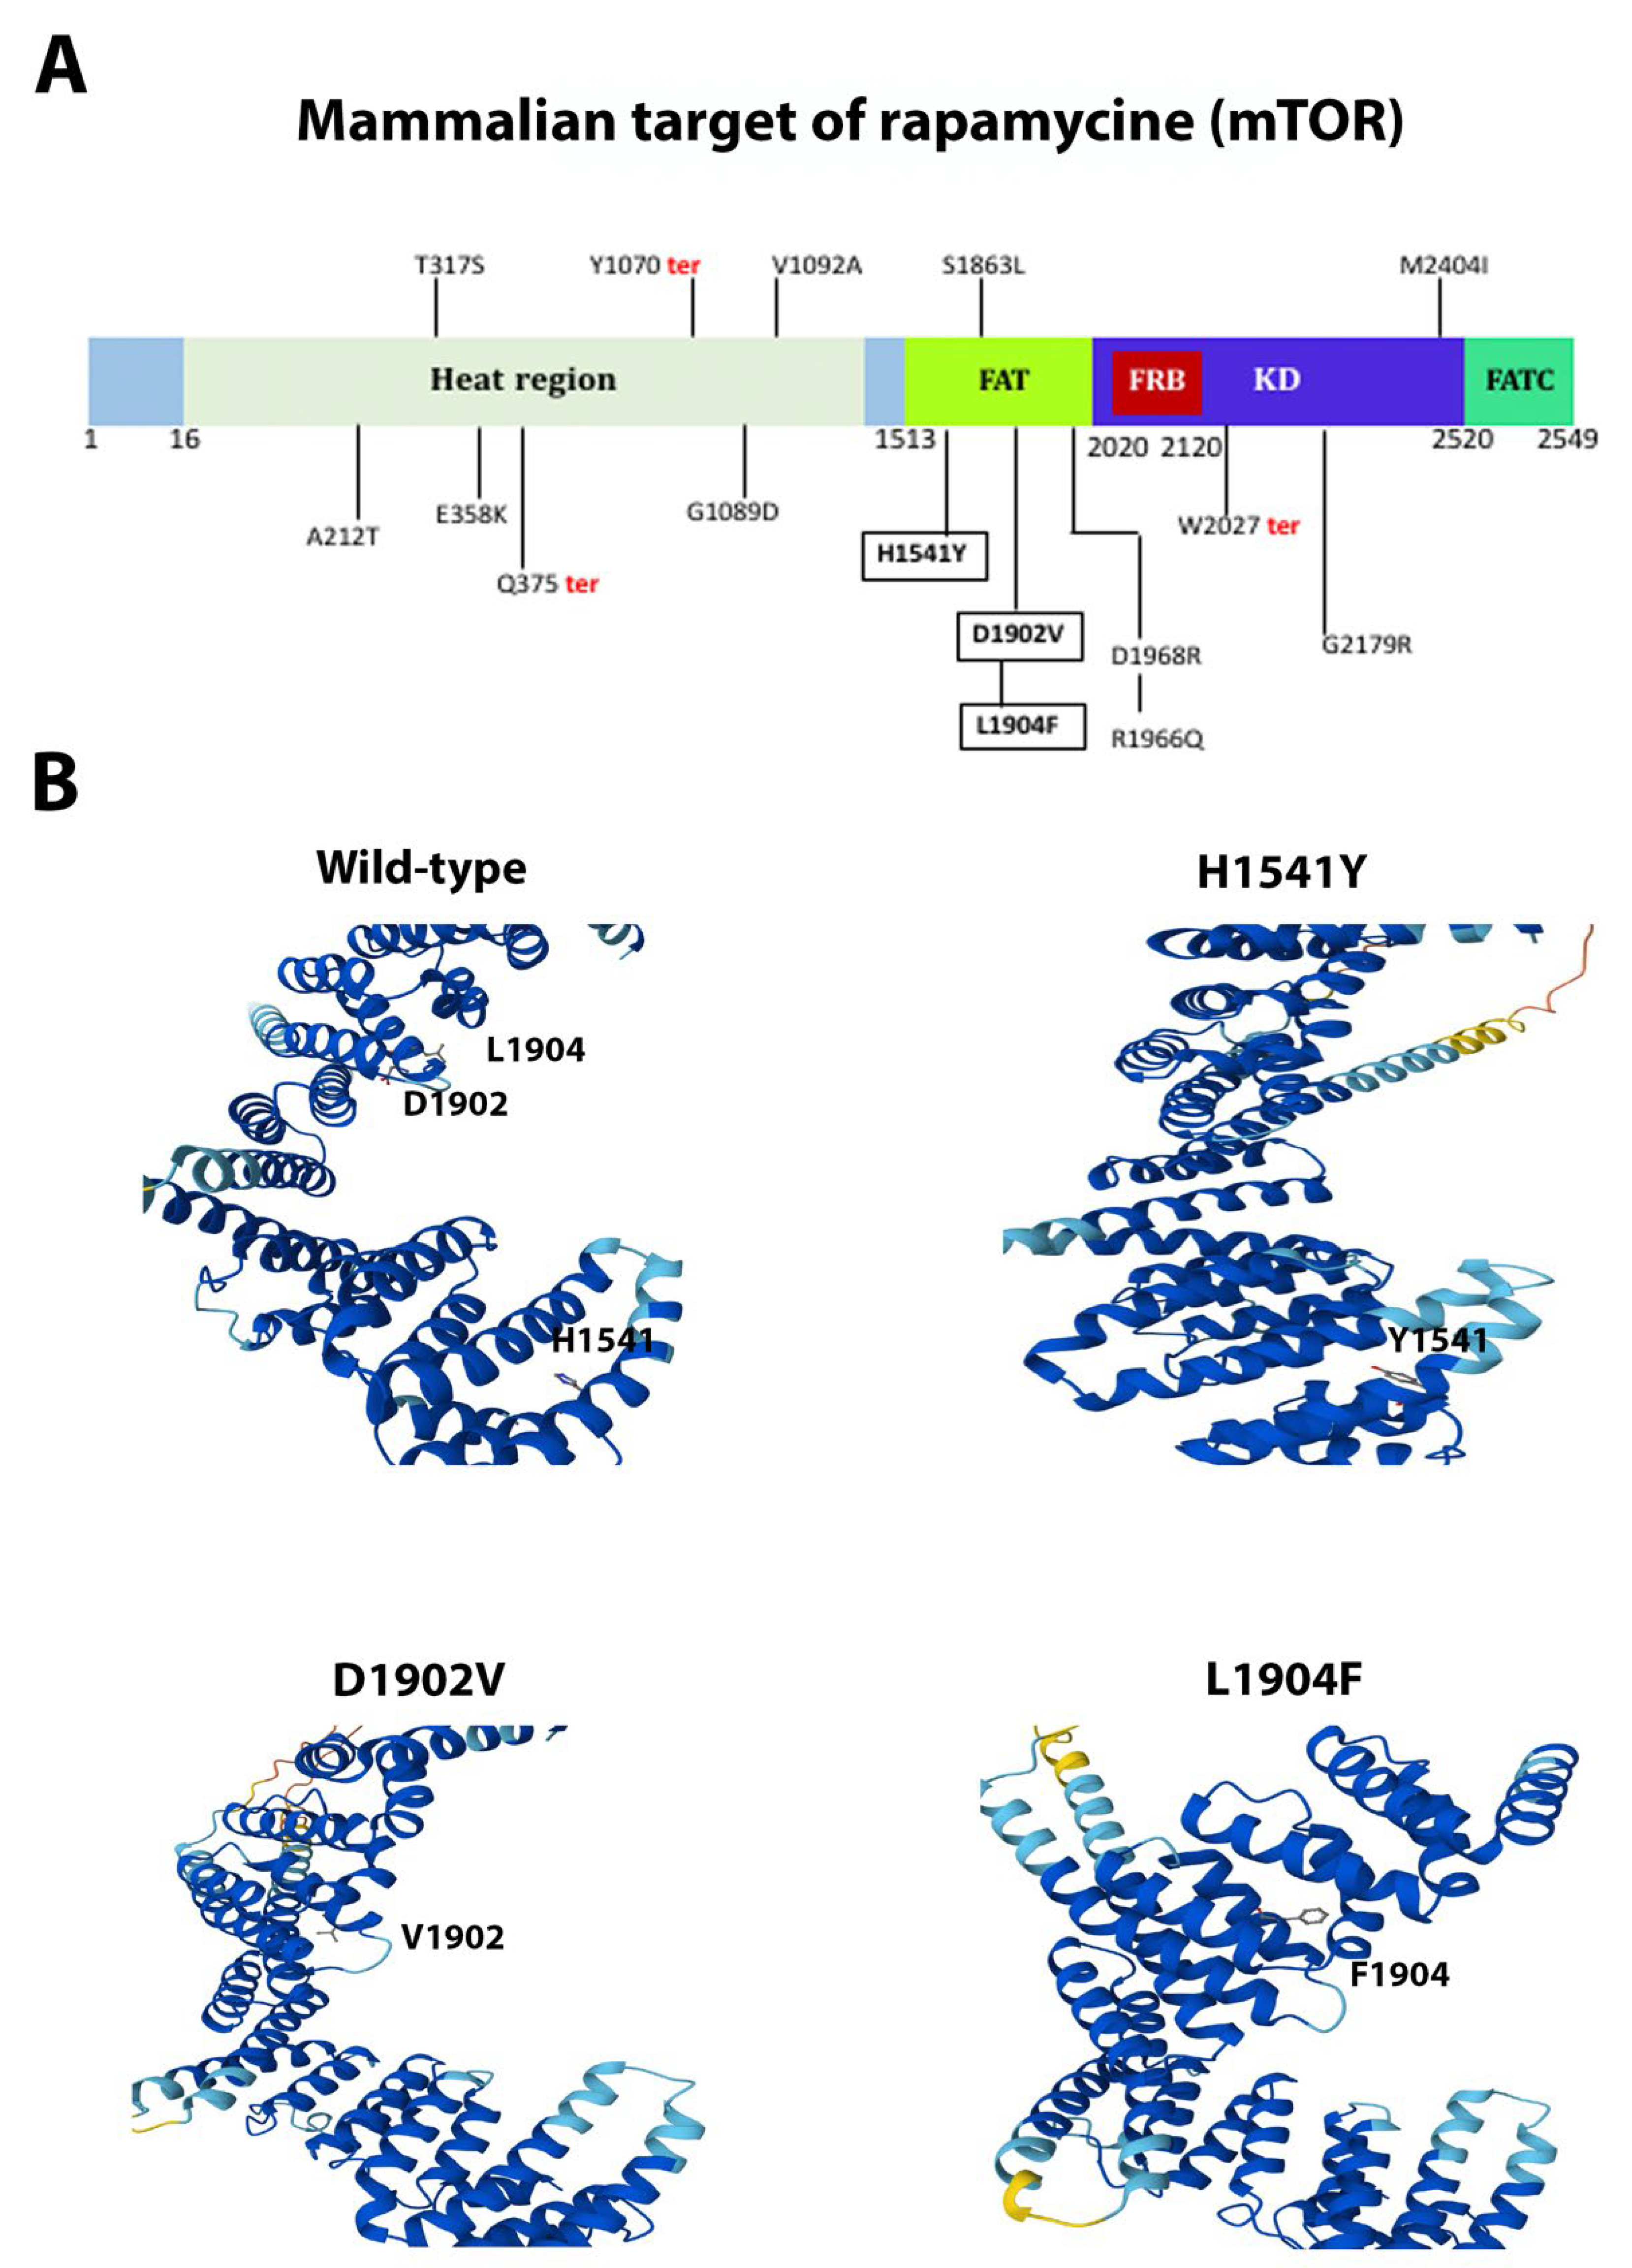
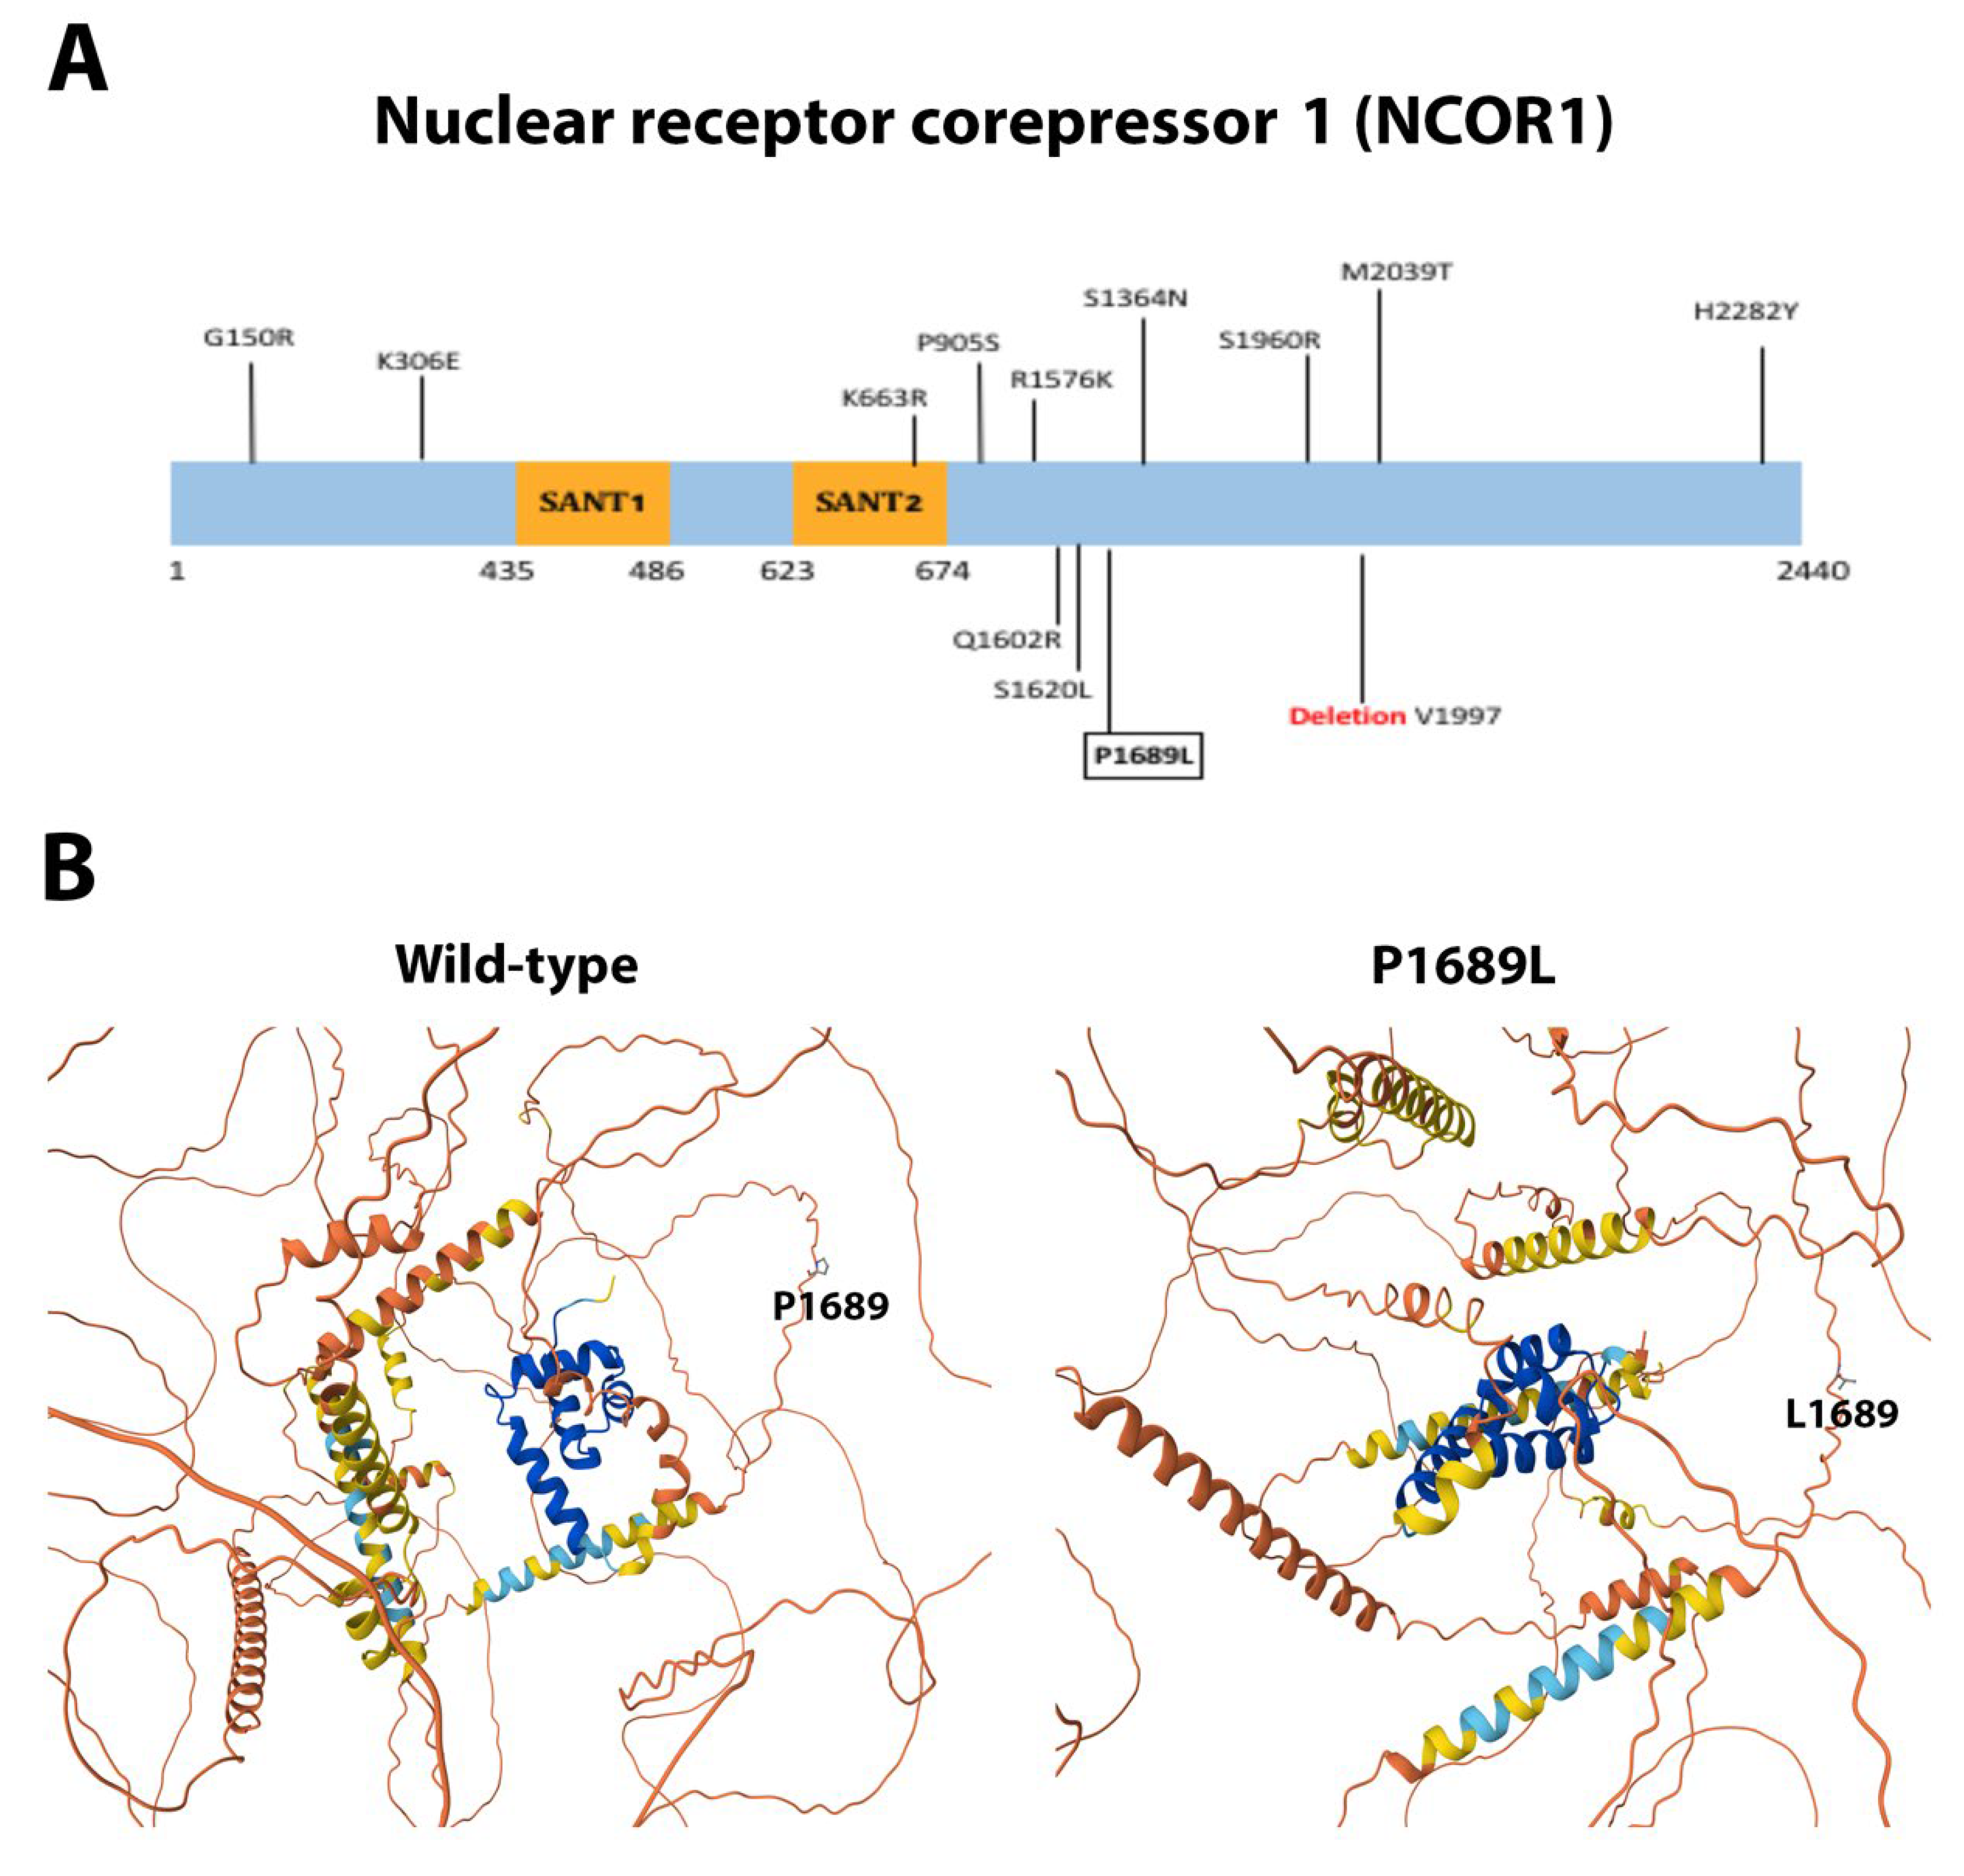
Missense mutations H1541Y (non-conservative), D1902V (non-conservative), and L1904F (conservative) of the kinase mTOR lay within the FAT domain (Figure 9A), a region critical for the catalytic activity of the protein. The FAT domain is a structural “C”-shaped unit composed of α-α-helical repeats forming an α-solenoid wrapping around the kinase domain and clamps onto it [60,61]. The mutations H1541Y and L1904F are predicted to cause slight distortions in α-helix 10 and α-helix 23, respectively, and D1902V makes a disordered structure around its spatial location in α-helix 23 (Figure 9B). In NCOR1, we have described the missense and non-conservative mutation P1689L, located outside the SANT1 and SANT2 motifs (Figure 10A), that promotes histone deacetylation and repression [62]. Since this mutation appeared to be in a predicted flexible and non-structured region, 3D structural predictions indicated little or no spatial change of the protein (Figure 10B). Finally, we described the missense mutations Y282C (conservative) and Q283R (non-conservative) in MDM2. Both changes are located between the acidic domain and the C4 Zn finger domain (Figure 11A). This is an unstructured and flexible region with no reported function [63]. The changes Y282C and Q283R were predicted not to significantly change the shape of this flexible region (Figure 11B).

2.7. Association Between Genetic Mutations and Clinicopathologic Characteristics

The prevalence of mutations in our cohort of PCa patients was 40.6% (26 out of 64 patients had one or more mutations). We analyzed the correlation between each mutation found and the overall patient survival included in this study. Interestingly, only the mutations c.655C>A (amino acid change R219S), c.1267G>A (amino acid change A423T), c.749_760delCCGGCAACATGT (deleting amino acids 250–253), and c.752_763delGCAACATGTTCG (deleting amino acids 251–254) found in FOXA1 showed a significant negative association with the overall patient survival. In order to assess the prognostic impact of FOXA1 mutations, we performed a Kaplan–Meier survival analysis comparing patients with and without mutations in this gene. As shown in Figure 12, patients harboring FOXA1 mutations (red line) exhibited a markedly reduced overall survival compared to those without mutations (blue line). The cumulative survival rate declined more rapidly in the mutant group throughout the follow-up period. This difference was statistically significant (log-rank test, p = 0.04), indicating that FOXA1 mutations are associated with an adverse prognosis in this cohort.
We further analyzed the overall survival data of patients with each of the clinical characteristics. We found that those patients who have undergone a prostatectomy had a slightly better prognosis (92% vs. 75%, Supplementary Figure S1A). Similarly, those patients who were treated with radiotherapy had longer survival periods (85% vs. 70%, Supplementary Figure S1B), with statistical significance. In our data, no statistical significance was found between any mutation and the Gleason score (chi-squared test) or PSA level (Wilcox test) for all patients.

3. Discussion

3.1. Novel Mutations from a Novel Genetic Background

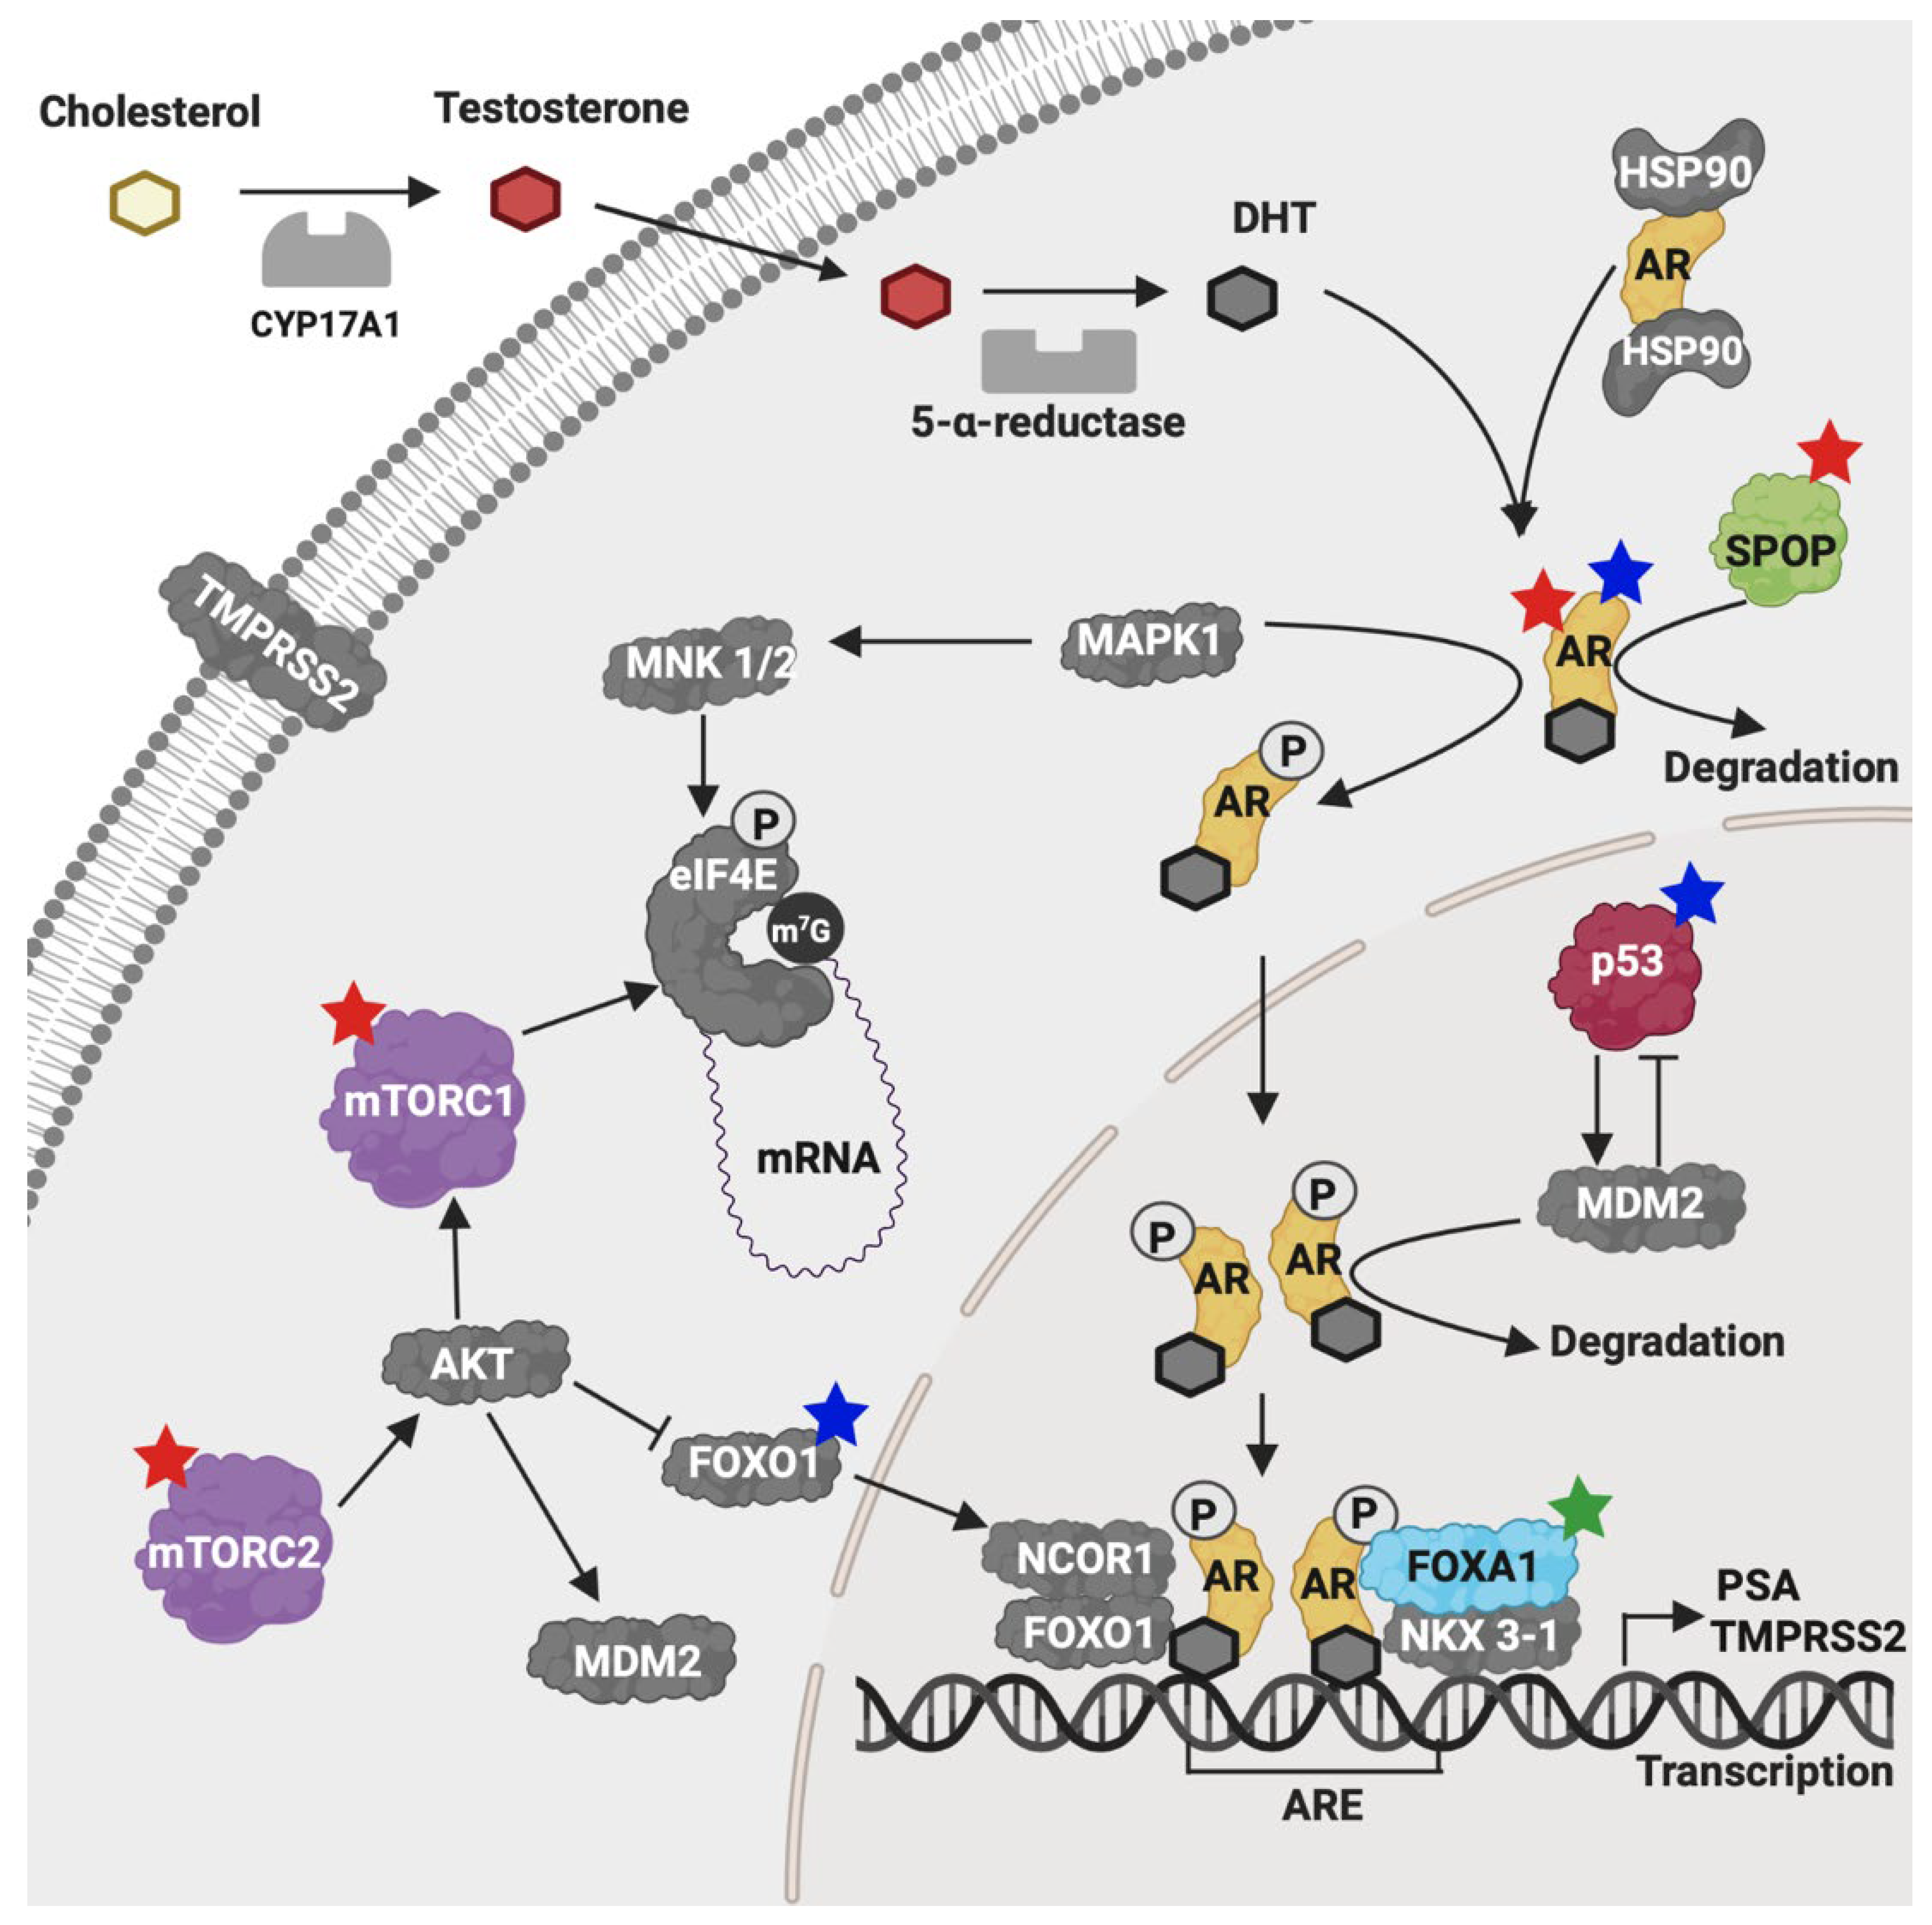
PCa displays one of the most significant disparities across Caucasian, Asian, and African descendants, proving that the race-specific genetic background is critical for the PCa development [8,10,11,12,64]. Overall, we identified 3414 genomic mutations utilizing NGS, with a high number of them of uncertain significance (VUS) (64%, 2197 events). Among them, 19 were novel. We analyzed the genomic variants following the American College of Medical Genetics and Genomics (ACMG) recommendations [65], which are based in categorization, annotation, and reporting using clinical, experimental, and bioinformatic evidence [66]. A summary of the most relevant mutations found in this study is depicted in Figure 13.
Our discovery of Hispanic-specific mutations is very relevant, as most PCa research, including genome sequencing, has disproportionally focused on European descendants [4,67,68,69]. Likewise, above 85% of mutations and polymorphisms associated with cancer have been discovered in people with European genetic background. In contrast, only 10% belong to Asians and 5% to African descendants [1,69,70]. Thus, populations with genetic backgrounds from other world regions are either scarce or absent in such studies. This bias toward the European background limits the understanding of the genetic variability of PCa. The Hispanic-specific mutations discovered in this study add key information on the genetic diversity of the mutational landscape in genes critical for PCa. The mutations detected here might have a specific impact on the onset and development of PCa in Hispanics.
The novel mutations discovered in this study are described in Table 2 and are shown within squares in Figure 4A, Figure 5A, Figure 6A, Figure 7A, Figure 8A, Figure 9A, Figure 10A and Figure 11A. Eight of them were in the AR, three in FOXA1, three in MTOR, two in MDM2, and only one in EIF4E, HSP90AA1, MAPK1, and NCOR1, of which 10 were predicted to be pathogenic changes, nine as putative pathogenic, and one as probably benign. In the following, we will discuss the effect that the novel mutations might have on the protein and PCa.

3.2. AR, FOXA1, MTOR, and MDM2 Carried the Highest Number of Novel and Pathogenic Mutations

In our cohort of patients with PCa, AR, FOXA1, MTOR, and MDM2 showed the highest rate of novel and pathogenic mutations, with 7, 3, 3, and 2, respectively, evidencing their relevance in this type of cancer.
AR malfunctioning triggers primary PCa and metastases and is involved in multiple cellular events, including proliferation, apoptosis, migration, invasion, and differentiation [34,35,40]. The AR gene displays a broad spectrum of variability in the mutations landscape across different ethnical backgrounds that might be differently associated with cancer risk [39,41,42,43,44,45,71]. In our cohort, AR carried the highest rate of pathogenic mutations in Hispanic patients with PCa (11%). We detected 13 pathogenic mutations (eight novel and four previously reported) in this gene. In our data, patients with AR mutations were associated with metastases and a higher Gleason score (≥8, p = 0.028). Gaddipati et al. and Thompson et al. also suggested the association of AR mutations with advanced stages and metastasis in PCa [72,73]. We also detected the pathogenic change c.170T>A (L57Q) at the NTD, present in advanced PCa [74] male hepatocellular carcinoma [75], medulloblastoma [76], breast cancer [77], and colorectal cancer [78].
All novel AR mutations lay within the NTD of the protein, a domain that interacts with many proteins that regulate AR transcriptional activity via the activation domains AF-1 and AF-5 [36]. At the NTD, AR possesses a polymorphic tract of poly Q encoded by 8–31 repeats of the CAG codon. Indeed, changes in the length of the poly Q region determine the transcriptional activity of AR [48,49] and influence the risk of PCa. Short poly Q lengths (≤22 repetitions) are associated with an increased risk of CaP and are more commonly found in African-descendant individuals, less frequent in European individuals, and much less frequent in Asian individuals [42,44,79]. This is consistent with the much higher frequency of PCa observed in African-American men [8,10,11,12,64]. Interestingly, among the novel mutations, six frame shift changes (Q69fs, Q70fs, Q69R, Q77fs, and Q78fs) were located within the poly Q hypervariable region and might produce dominant negative peptides. Due to the functional relevance of both the NTD and the poly Q tract, most probably the mutations we discovered here are relevant for PCa development in Hispanics. Indeed, all novel mutations were classified as probably pathogenic.

3.3. Clinical Association of FOXA1 and Patient Survival

FOXA1 plays a key role in PCa and can also be used to determine distinctive phenotypes in this tumor. High expression of FOXA1 is associated with poor prognosis [80]. Moreover, mutations in FOXA1 have been frequently associated with poor clinical outcomes in PCa [50,51,52,53,81,82,83,84]. The frequency of mutations in FOXA1 in PCa is also influenced by the ethnic background [32], with a frequency of 41% in tumors of Asian populations and 4–13% in North Americans, Europeans, and African descendants [21,23,84,85,86,87,88]. In our cohort, we found 12% mutations in this gene.
Interestingly, we discovered that the mutations in FOXA1 had a significant negative association with the overall patient survival (Figure 12), namely c.655C>A (amino acid change R219S) [52], the novel mutation c.1267G>A (amino acid change A423T), and the novel deletions Δc.749_760delCCGGCAACATGT (deleted amino acids A250-M253) and Δc.752_763delGCAACATGTTCG (amino acid deleted G251-F254), which partially overlapped or clustered with the described deletions ΔM253-N256 [52], ΔF254-E255 [52], the mutations FENG254-7C [89] and G275X [52], and the deletion ΔR265-Q271 [50], within the mutational hotspot second winged loop (Wing2) in the forkhead DNA-binding domain (FKHD; Figure 5B,C). The reported mutations deregulate transcription-causing cellular phenotypes across different cancers [50,51,52,53]. Taken together, these observations support the notion that the FOXA1 mutations we found play a significant role in the clinical outcome of Hispanic PCa patients.
In PCa progression, the two central signal transduction pathways are Ras/MAPK and PI3K/Akt/mTOR, both converging on eIF4E [90]. mTOR is a central hub in the PI3/Akt/mTOR signaling cascade that controls cell growth and proliferation in response to energy, nutrients, growth factors, and environmental clues. This pathway is often hyperactivated in most tumors, including PCa [61,90,91,92]. Beyond signal transduction, mTOR also plays a role in gene transcription. During PCa, mTOR also directly associates with chromatin in different complexes with transcriptional regulators, including AR, to drive chromatin remodeling and the transcription of genes relevant for cancer progression [93,94,95,96]. Genomic profiling data have shown that mTOR alterations (i.e., mutations and amplifications) occur in 1.78% of PCa cases and 2.93% of in metastatic prostate adenocarcinoma [90]. We have discovered the novel mutations H1541Y within the FAT domain of mTOR. Since the FAT domain associates with different regulator proteins to form the complex mTORC1 and mTORC2, most mutations in the FAT domain deregulate mTOR activity [60,61]. This might also be the case of mutations H1541Y, L1904F, and D1902V.
MDM2 is an oncoprotein inhibitor of p53. MDM2 associates with p53, diminish its transcriptional activity, escorts it from the nucleus to the cytoplasm, and ubiquitylates p53 for degradation by the 26S proteasome [97]. MDM2 also plays p53-independent activities in regulating genomic stability [98,99,100] and stabilizing different mRNAs [101,102]. Malfunctioning of MDM2 is strongly involved in carcinogenesis in many tissues, including prostate, as it also targets AR for degradation [103,104,105,106]. We described the novel mutations Y282C and Q283R within a disordered region [63] with no reported function. The relevance of these mutations in MDM2 function and PCa remains obscure.

3.4. Single Novel Mutations in EIF4E, HSP90AA1, MAPK1, and NCOR1

EIF4E, HSP90AA1, MAPK1, and NCOR1 had one novel mutation in our cohort. eIF4E drives mRNA translation. Moreover, a fraction of the protein is found in the nucleus and cytoplasmic foci, where it mediates mRNA export and storage, respectively [107]. eIF4E is a protooncogene, key for cell signaling in cancer [108], and is overexpressed in different tumors, including PCa [109]. Downregulation of eIF4E reduces the translation of only a defined set of mRNAs involved in cell proliferation and transformation in cells and in mice [110,111,112]. Thus, eIF4E has been proposed as a prime target for anticancer therapies. We described the novel mutation F48fs, which will produce a truncated, non-functional protein. Therefore, this mutation probably reduces the carcinogenic phenotype in prostate tumors.
The chaperone HSP90AA1 plays a pivotal role in helping newly synthesized proteins fold correctly and maintaining protein stability and function [56]. HSP90AA1 interacts with several oncoproteins, including kinases and transcription factors, promoting the development of different tumors, including PCa [113]. In PCa, HSP90AA1 promotes chronic inflammation of fibroblasts through the activation of NF-kB and STAT3, which in turn stimulates PCa progression [114]. N-domain ATP binding and hydrolysis is key for HSP90AA1 activity [57]; thus, most inhibitors of this protein target this domain, which leads to proteasome-mediated degradation of HSP90AA1 partners [56]. We described the novel mutation K279M, laying outside the ATP-binding domain and possibly not leading to significant overall structural changes of the protein. We cannot predict what its effect on cancer might be.
The kinase MAPK1 integrates and transduces multiple signals and is involved in transcription, translation, apoptosis, stress responses, cell proliferation, differentiation, and migration [115]. Aberrant signaling by the MAPK1 cascade plays a crucial role in carcinogenesis [116,117]. In most cancer types (including PCa), the MAPK cascade is hyperactivated, promoting tumor growth, castration-resistant carcinogenesis, and metastasis [118]. Indeed, 25% of the PCa tumors show a presumed actionable lesion in members of the MAPK1 signaling pathways [85]. In our cohort, we found the novel mutation E314G outside the MAPK domain and the active site with non-significant structural and functional changes [58,59] and unknown (if any) relevance for cancer progression.
NCOR1 is a transcriptional repressor that interacts with nuclear hormone receptors, transcription factors (including AR), and chromatin-condensation enzymes [119]. It is also key in oxidative metabolism signaling in the mitochondria [120]. NCOR1 malfunctioning is involved in cell proliferation and carcinogenesis in breast, colorectal, bladder, cervical, and prostate cancers [121,122,123,124,125,126]. NCOR1 genomic alterations have been identified in 5% of PCa cases and have been proposed as a molecular marker of a subtype of PCa [127]. Moreover, NCOR1 downregulation may be predictive of resistance to castration therapy in PCa patients expressing AR [122]. We described the novel mutation P1689L, which hit outside the DNA-binding motifs SANT1 and 2.

4. Materials and Methods

4.1. Patients and Tissue Samples

The research was performed under the approved protocols by both the Ethics Committee (approval CEI/905/14) and the Research Committee (approval 014/019/IBI) of the National Institute of Cancer, Mexico (Instituto Nacional de Cancerología, Mexico City, Mexico). We confirm that all research was performed in accordance with the guidelines and regulations of this Institute and in accordance with the Declaration of Helsinki. We also confirm that informed consent was obtained from all participants and/or their legal guardians to use their samples for diagnostic and investigation purposes, as well as for publication of the resulting data in an anonymous way.
After obtaining informed written consent, prostate tissue samples were obtained between February 2016 and September 2018 from 96 Mexican patients attending the Department of Oncologic Urology in the National Institute of Cancer (Mexico). The inclusion criteria for patient selection were as follows: patients were born in Mexico with both parents and both grandparents also born in Mexico; blood PSA levels above 4 ng/mL; and presented symptoms related to prostatic pathologies such as dysuria, hematuria, and abnormal digital exam. The exclusion criteria were as follows: patients selected for the study did not receive any previous treatment with androgenic antagonists. Following the sample’s recollection, tissues were examined by the Pathology Department and were classified either as cancerous tissue or non-cancerous tissue. All samples were processed anonymously and stored in liquid nitrogen until nucleic acid extraction.

4.2. Genomic DNA Extraction

Nucleic acids for Next Generation Sequencing were obtained from the collected tissues. Genomic DNA (gDNA) was extracted using the Wizard Genomic DNA Purification kit (Promega Corp., Madison, WI, USA) following the manufacturer’s instructions. Extracted gDNA was quantified by real-time PCR reactions using the TaqMan RNase P Detection Reagents kit (ThermoFisher Scientific, Waltham, MA, USA), following the Demonstrated Protocol Sample Quantification for an Ion AmpliSeq Library Preparation (Pub. No. MAN0007732).

4.3. Generation of Primer Pools for Target Genes

A panel of 15 genes directly related to the AR function or relevant to prostate cancer were included in this study (Table 3). Genes were selected under two criteria: the importance for the AR gene signaling pathway and the number of previous reports where they have been associated with PCa. The sequencing panel was designed using the Ion AmpliSeq Designer tool by ThermoFisher Scientific (Waltham, MA, USA), following the manufacturer’s instructions. Primers were designed using the human genome GRCh38 as a reference (http://www.ncbi.nlm.nih.gov/grc/human accessed on 2 June 2014). The average target size was 57.32 kb, with an average of 471 amplicons and an average of gene coverage of 97.73%.

4.4. Amplicon Library Generation

Twenty nanograms of gDNA were used to elaborate amplicon DNA libraries by means of the Ion AmpliSeq Kit for Chef DL8 (ThermoFisher Scientific, Waltham, MA, USA). A total of 12 different libraries (eight samples per library) were elaborated following the Ion AmpliSeq Library Preparation on the Ion OneTouch 2 system. Samples were diluted equimolar in each of the libraries, and 15 uL of each library were charged into the IonChef system. One hundred fifty uL of two primer pools were added per run. Runs were programmed following the manufacturer’s instructions under the following conditions; 2 primer pools; 18 amplification cycles; 4 min of annealing extension time.

4.5. Ion Torrent Sequencing

Generated libraries were sequenced using Ion Torrent S5 equipment (Thermo Fisher Scientific, Waltham, MA, USA). Twenty-five μL of each 100 pM library were loaded into the Ion 540 chips and sequenced. Sequencing was performed following the manufacturer’s instructions. A total of 96 samples were sequenced with an average in-deep coverage of 8214X. Sequencing was performed using the human genome GRCh38 as a reference. The Variant Caller plugin included in the Torrent Suite Software was used to identify variations in target regions.

4.6. Data Analyses

Ion Torrent Suite V4.0 was used to align raw fastq files to the GRCh38 reference genome and generate VCF files. After processing the results with the Variant Caller plug-in, a database was elaborated with the xls files. The main database categories were locus; type of mutation; genotype; coverage; gene; genomic localization; protein change; codon change; polyphen score; dbsnp; and sample number. Only mutations with a non-synonymous change were selected for subsequent analysis. Selected mutations were separated into two groups depending on the sample’s origin: either “cancerous” or “non-cancerous.” To determine whether there was a significant correlation between mutational burden and any of the tumor characteristics, we calculated the Pearson correlation coefficient among the number of somatic mutations in each sample, with each of the samples’ clinical characteristics. All statistical analyses were performed in R 3.4.2 (R Core Team, Vienna, Austria).

4.7. Variant Classification

Sequence variants detected in this study were identified according to the human genome GRChg38 as a reference using the mutation databases (http://androgendb.mcgill.ca/ and http://www.hgmd.cf.ac.uk/ac/all.php accessed on 2 June 2025), SNP database (https://www.ncbi.nlm.nih.gov/snp/ accessed on 2 June 2025), and Genome Aggregation Database (GnomAD, https://gnomad.broad.institute.org accessed on 2 June 2025). Variants were classified according to the classification guidelines of the International Agency for Research on Cancer (IARC). The clinical interpretation of each variant and their association with a disease is described in ClinVar (https://www.ncbi.nlm.nih.gov/clinvar/ accessed on 2 June 2025), Varsome (https://varsome.com/ accessed on 2 June 2025), and or COSMIC (https://cancer.sanger.ac.uk/cosmic accessed on 2 June 2025) [128]. Missense, nonsense, frame-shift deletion, frame-shift insertion mutation, non-frameshift deletion, splicing variants, and mutations affecting protein function were classified as pathogenic variants. Additionally, we performed a web-based analysis to predict the potential role of the identified variants employing SIFT, Polyphen-2, PhyloP, and Grantham algorithms.

4.8. Three-Dimensional (3D) Structure Prediction

Protein 3D structures were predicted by Alphafold2 [46] using the Worldwide Protein Data Bank (PDB) reports. Images were visualized using PyMOL (Schrödinger, L., & DeLano, W. (2020). PyMOL. Retrieved from http://www.pymol.org/pymol accessed on 1 May 2025).

5. Conclusions

We described 3414 novel somatic mutations in PCa samples, highlighting both the mutational heterogeneity of prostate tumors and the ethnical component of a scarcely studied genetic background. Nineteen of them were novel changes. Of particular interest were those mutations found in FOXA1, which might be used as novel markers for PCa prognosis, at least for Hispanic men.

Supplementary Materials

The following supporting information can be downloaded at: https://www.mdpi.com/article/10.3390/ijms26188758/s1.

Author Contributions

G.H. conceived the whole project and the manuscript, designed experiments, gathered information, analyzed data, and wrote part of the paper; A.P.-T. designed and performed experiments, analyzed data, gathered information, assembled Figure 1, Figure 2, Figure 3, Figure 4, Figure 5, Figure 6, Figure 7 and Figure 8, and wrote part of the paper; N.B.-A. gathered information, designed and performed experiments, and performed data analyzes; J.L.R. performed experiments, analyzed data, gathered information, and assembled Figure 1, Figure 2, Figure 3, Figure 4, Figure 5, Figure 6, Figure 7 and Figure 8; M.G. gathered information, analyzed data, and assembled Figure 9; P.A.G. collected samples and assembled the clinical database; B.L.T. performed experiments; M.A.J.-R. performed the clinical study of patients; A.M.-T. coordinated the sequencing experiments; R.M.Á.-G. performed data analyses. All authors have read and agreed to the published version of the manuscript.

Funding

This research was funded by Secretaría de Ciencia, Humanidades, Tecnología e Innovación (SECIHTI, former CONACyT), grant num. 273116 to G.H. (“Identification of new mutations in the Androgen Receptor gene specific of Mexican men and their clinic impact on prostate cancer”), by the intramural funding program of the National Institute of Cancer (INCan), and by Tecnologico de Monterrey (Fondo de Apoyo PUB y Cong. Med., EMCS), Mexico. N.B.-A. was supported by the intramural funding program of the INCan. SECIHTI MS fellowships were awarded to J.L.R. (num. 482690), M.G. (num. 736271), and P.A.G. (num. 416277). A SECIHTI PhD fellowship was awarded to B.L.T. This work is part of J.L.R., M.G., and P.A.G.’s curriculum in the MS Program on Biochemical Sciences (Maestría en Ciencias Bioquímicas), UNAM, and B.L.T.’s curriculum in the PhD Program on Biomedical Sciences (Doctorado en Ciencias Biomédicas), UNAM.

Institutional Review Board Statement

The study was conducted in accordance with the Declaration of Helsinki, and approved by the Institutional Review Board and Ethics Committee) of Instituto Nacional de Cancerología (INCan, National Institute of Cancer) Mexico (protocol codes 014/019/IBI and CEI/905/14, respectively, and approved on 2 July 2014 and 3 July 2014, respectively).

Informed Consent Statement

Informed consent was obtained from all subjects involved in the study.

Data Availability Statement

The mutations data generated in this study have been submitted to the Gene Bank Submission number SUB15257899 (submission in progress). They are available also as Supplemental Table S1.

Acknowledgments

We thank the insightful criticism and comments of the anonymous reviewers.

Conflicts of Interest

The authors declare that the research was conducted in the absence of any commercial or financial relationships that represent competing interests.

References

  1. Wild, C.P.; Weiderpass, E.; Stewart, B.W. (Eds.) World Cancer Report. Cancer Research for Cancer Prevention; International Agency for Research on Cancer and World Health Organization: Lyon, France, 2020. [Google Scholar]
  2. Ferlay, J.; Ervik, M.; Laversanne, M.; Colombet, N.; Mery, L.; Piñeros, M.; Znaor, A.; Soerjomataram, I.; Bray, F. Global Cancer Observatory: Cancer Today; International Agency for Research on Cancer; World Health Organization: Geneva, Switzerland, 2024; Available online: https://gco.iarc.who.int/today (accessed on 15 April 2025).
  3. International Agency for Research on Cancer. Cancer Today. Data Version: Globocan 2022; World Health Organization: Geneva, Switzerland, 2022; Available online: https://gco.iarc.who.int (accessed on 15 April 2025).
  4. James, N.D.; Tannock, I.; N’Dow, J.; Feng, F.; Gillessen, S.; Ali, S.A.; Trujillo, B.; Al-Lazikanii, B.; Attard, G.; Bray, F.; et al. The Lancet Commission on prostate cancer: Planning for the surge in cases. Lancet 2024, 403, 1683–1722. [Google Scholar] [CrossRef] [PubMed]
  5. Packer, J.R.; Maitland, N.J. The molecular and cellular origin of human prostate cancer. Biochim. Biophys. Acta 2016, 1863, 1238–1260. [Google Scholar] [CrossRef] [PubMed]
  6. Humphrey, P.A. Histopathology of prostate cancer. Cold Spring Harb. Perspect. Med. 2017, 7, a030411. [Google Scholar] [CrossRef] [PubMed]
  7. Sekhoacha, M.; Riet, K.; Motloung, P.; Gumenku, L.; Adegoke, A.; Mashele, S. Prostate cancer review: Genetics, diagnosis, treatment options, and alternative approaches. Molecules 2022, 27, 5730. [Google Scholar] [CrossRef]
  8. Pernar, C.H.; Ebot, E.M.; Wilson, K.M.; Mucci, L.A. The epidemiology of prostate cancer. Cold Spring Harb. Perspect. Med. 2018, 8, a030361. [Google Scholar] [CrossRef]
  9. Porcaro, A.B.; Tafuri, A.; Inverardi, D.; Amigoni, N.; Sebben, M.; Pirozzi, M.; Processali, T.; Rizzetto, R.; Shakir, A.; Cerrato, C.; et al. Incidental prostate cancer after transurethral resection of the prostate: Analysis of incidence and risk factors in 458 patients. Minerva Urol. Nefrol. 2020. online ahead of print. [Google Scholar] [CrossRef]
  10. Rebbeck, T.R. Prostate cancer disparities by race and ethnicity: From nucleotide to Neighborhood. Cold Spring Harb. Perspect. Med. 2018, 8, a030387. [Google Scholar] [CrossRef]
  11. Jiang, S.; Narayan, V.; Warlick, C. Racial disparities and considerations for active surveillance of prostate cancer. Transl. Androl. Urol. 2018, 7, 214–220. [Google Scholar] [CrossRef]
  12. Tan, S.H.; Petrovics, G.; Srivastava, S. Prostate gancer genomics: Recent advances and the prevailing underrepresentation from racial and ethnic minorities. Int. J. Mol. Sci. 2018, 19, 1255. [Google Scholar] [CrossRef]
  13. Sarwar, S.; Adil, M.A.; Nyamath, P.; Ishaq, M. Biomarkers of prostatic cancer: An attempt to categorize patients into prostatic carcinoma, benign prostatic hyperplasia, or prostatitis based on serum prostate specific antigen, prostatic acid phosphatase, calcium, and phosphorus. Prostate Cancer 2017, 2017, 5687212. [Google Scholar] [CrossRef]
  14. Herget, K.A.; Patel, D.P.; Hanson, H.A.; Sweeney, C.; Lowrance, W.T. Recent decline in prostate cancer incidence in the United States, by age, stage, and Gleason score. Cancer Med. 2016, 5, 136–141. [Google Scholar] [CrossRef]
  15. Martin, R.M.; Donovan, J.L.; TRurner, E.L.; Metcalfe, C.; Young, G.J.; Walshh, E.I.; Lane, J.A.; Noble, S.; Oliver, S.E.; Evans, S.; et al. Effect of a low-intensity PSA-based ccreening intervention on prostate cancer mortality: The CAP randomized clinical trial. J. Am. Med. Asoc. 2018, 319, 883–895. [Google Scholar] [CrossRef] [PubMed]
  16. Jones, C.; Fam, M.M.; Davies, B. Expanded criteria for active surveillance in prostate cancer: A review of the current data. Transl. Androl. Urol. 2018, 7, 221–227. [Google Scholar] [CrossRef] [PubMed]
  17. McCrea, E.M.; Lee, D.K.; Sissung, T.M.; Figg, W.D. Precision medicine applications in prostate cancer. Ther. Adv. Med. Oncol. 2018, 10, 1758835918776920. [Google Scholar] [CrossRef]
  18. Li, Y.; Roberts, N.D.; Wala, J.A.; Shapira, O.; Schumacher, S.E.; Kumar, K.; Khurana, E.; Waszak, S.; Korbel, J.O.; Haber, J.E.; et al. Patterns of somatic structural variation in human cancer genomes. Nature 2020, 578, 112–121. [Google Scholar] [CrossRef]
  19. Rubin, M.A.; Demichelis, F. The genomics of prostate cancer: A historic perspective. Cold Spring Harb. Perspect. Med. 2019, 31, a034942. [Google Scholar] [CrossRef]
  20. Khemlina, G.; Ikeda, S.; Kurzrock, R. Molecular landscape of prostate cancer: Implications for current clinical trials. Cancer Treat. Rev. 2015, 41, 761–766. [Google Scholar] [CrossRef]
  21. Taylor, B.S.; Schultz, N.; Hieronymus, H.; Gopalan, A.; Xiao, Y.; Carver, B.S.; Arora, V.K.; Kaushik, P.; Cerami, E.; Reva, B.; et al. Integrative genomic profiling of human prostate cancer. Cancer Cell 2010, 18, 11–22. [Google Scholar] [CrossRef]
  22. Grasso, C.S.; Wu, Y.M.; Robinson, D.R.; Cao, X.; Dhanasekaran, S.M.; Khan, A.P.; Quiste, M.J.; Jing, X.; Lonigro, R.J.; Brenner, J.C.; et al. The mutational landscape of lethal castration-resistant prostate cancer. Nature 2012, 487, 239–243. [Google Scholar] [CrossRef]
  23. Baca, S.C.; Prandi, D.; Lawrence, M.S.; Mosquera, J.M.; Romanel, A.; Drier, Y.; Park, K.; Kitabayashi, N.; MacDonald, T.Y.; Ghandi, M.; et al. Punctuated evolution of prostate cancer genomes. Cell 2013, 153, 666–677. [Google Scholar] [CrossRef]
  24. Robinson, D.; Van Allen, E.M.; Wu, Y.M.; Schultz, N.; Lonigro, R.J.; Mosquera, J.M.; Montgomery, B.; Taplin, M.E.; Pritchard, C.C.; Attard, G.; et al. Integrative clinical genomics of advanced prostate cancer. Cell 2015, 161, 1215–1228. [Google Scholar] [CrossRef]
  25. Rheinbay, E.; Nielsen, M.M.; Abascal, F.; Wala, J.A.; Shapira, O.; Tiao, G.; Hornshøj, H.; Hess, J.M.; Juul, R.I.; Lin, Z.; et al. Analyses of non-coding somatic drivers in 2,658 cancer whole genomes. Nature 2020, 578, 102–111. [Google Scholar] [CrossRef] [PubMed]
  26. Blattner, M.; Lee, D.J.; O’Reilly, C.; Park, K.; MacDonald, T.Y.; Khani, F.; Turner, K.R.; Chiu, Y.L.; Wild, P.J.; Dolgalev, I.; et al. SPOP mutations in prostate cancer across demographically diverse patient cohorts. Neoplasia 2014, 16, 14–20. [Google Scholar] [CrossRef] [PubMed]
  27. Magi-Galluzzi, C.; Tsusuki, T.; Elson, P.; Simmerman, K.; LaFargue, C.; Esgueva, R.; Klein, E.; Rubin, M.A.; Zhou, M. TMPRSS2-ERG gene fusion prevalence and class are significantly different in prostate cancer of Caucasian, African-American and Japanese patients. Prostate 2011, 71, 489–497. [Google Scholar] [CrossRef] [PubMed]
  28. Jiang, H.; Mao, X.; Huang, X.; Zhao, J.; Wang, L.; Xu, J.; Zhang, H.; Lu, Y.; Yu, Y. TMPRSS2:ERG fusion gene occurs less frequently in Chinese patients with prostate cancer. Tumor Biol. 2016, 37, 12397–12402. [Google Scholar] [CrossRef]
  29. Zhou, C.K.; Young, D.; Yeboah, E.D.; Coburn, S.B.; Tettey, Y.; Biritwum, R.B.; Adjei, A.A.; Tay, E.; Niwa, S.; Truelove, A.; et al. TMPRSS2:ERG gene fusions in prostate cancer of west African men and a meta-analysis of racial differences. Am. J. Epidemiol. 2017, 186, 1352–1361. [Google Scholar] [CrossRef]
  30. Wong, M.; Bierman, Y.; Pettaway, C.; Kittles, R.; Mims, M.; Jones, J.; Ittmann, M. Comparative analysis of p16 expression among African American and European American prostate cancer patients. Prostate 2019, 79, 1274–1283. [Google Scholar] [CrossRef]
  31. Shina, M.; Hashimoto, Y.; Kato, T.; Yamamura, S.; Tanaka, Y.; Majid, S.; Saini, S.; Varahram, S.; Kulkarni, P.; Dasgupta, P. Differential expression of miR-34b and androgen receptor pathway regulate prostate cancer aggressiveness between African-Americans and Caucasians. Oncotarget 2017, 8, 8356–8368. [Google Scholar] [CrossRef]
  32. Li, J.; Xu, C.; Lee, H.J.; Ren, S.; Zi, X.; Zhang, Z.; Wang, H.; Yu, Y.; Yang, C.; Gao, X.; et al. A genomic and epigenomic atlas of prostate cancer in Asian populations. Nature 2020, 580, 93–99. [Google Scholar] [CrossRef]
  33. Crawford, E.D.; Schellhammer, P.F.; McLeod, D.G.; Moul, J.W.; Higano, C.S.; Shore, N.; Denis, L.; Iversen, P.; Eisenberger, M.A.; Labrie, F. Androgen receptor-targeted treatments for prostate cancer: 35 years’ Progress with antiandrogens. J. Urol. 2018, 200, 956–966. [Google Scholar] [CrossRef]
  34. Tan, M.H.E.; Li, J.; Xu, H.E.; Melcher, K.; Yong, E.L. Androgen receptor: Structure, role in prostate cancer and drug discovery. Acta Pharma. Sin. 2015, 36, 3–23. [Google Scholar] [CrossRef]
  35. Aurilio, G.; Cimadamore, A.; Mazzucchelli, R.; Lopez-Beltran, A.; Verri, E.; Scarpelli, M.; Massari, F.; Cheng, L.; Santoni, M.; Montironi, R. Androgen Receptor signaling pathway in prostate cancer: From genetics to clinical applications. Cells 2020, 9, 2653. [Google Scholar] [CrossRef] [PubMed]
  36. Centenera, M.M.; Selth, L.A.; Ebrahimiie, E.; Butler, L.M.; Tilley, W.D. New opportunitie for targeting the Androgen receptor in prostate cancer. Cold Spring Harb. Perspect. Med. 2019, 15, 235–253. [Google Scholar]
  37. Visakorpi, T.; Hyytinen, E.; Koivisto, P.; Tanner, M.; Keinänen, R.; Palmberg, C.; Palotie, A.; Tammela, T.; Isola, J.; Kallioniemi, O.P. In vivo amplification of the androgen receptor gene and progression of human prostate cancer. Nat. Genet. 1995, 9, 401–406. [Google Scholar] [CrossRef] [PubMed]
  38. Linja, M.J.; Savinainen, K.J.; Saramäki, O.R.; Tammela, T.L.; Vessella, R.L.; Visakorpi, T. Amplification and overexpression of androgen receptor gene in hormone-refractory prostate cancer. Cancer Res. 2001, 61, 3550–3555. [Google Scholar]
  39. Gottlieb, B.; Beitel, L.K.; Nadarajah, A.; Paliouras, M.; Trifiro, M. The androgen receptor gene mutations database: 2012 Update. Hum. Mut. 2012, 33, 887–894. [Google Scholar] [CrossRef]
  40. Culig, Z.; Santer, F. Androgen receptor signaling in prostate cancer. Cancer Metastasis Rev. 2014, 33, 413–427. [Google Scholar] [CrossRef]
  41. Zaman, N.; Giannopoulos, P.N.; Chowdhury, S.; Bonneil, E.; Thibault, P.; Wang, E.; Trifiro, M.; Paliouras, M. Proteomic-coupled-network analysis of T877A Androgen Receptor interactomes can predict clinical prostate cancer outcomes between White (non-Hispanic) and African-American groups. PLoS ONE 2014, 9, e113190. [Google Scholar] [CrossRef]
  42. Sun, J.H.; Lee, S.A. Association between CAG repeat polymorphisms and the risk of prostate cancer: A meta-analysis by race, study design and the number of (CAG) n repeat polymorphisms. Int. J. Mol. Med. 2013, 32, 1195–1203. [Google Scholar] [CrossRef]
  43. Qin, Z.; Li, X.; Han, P.; Zheng, Y.; Liu, H.; Tang, J.; Yang, C.; Zhang, J.; Wang, K.; Qi, X.; et al. Association between polymorphic CAG repeat lengths in the androgen receptor gene and susceptibility to prostate cancer: A systematic review and meta-analysis. Medicine 2017, 96, e7258. [Google Scholar] [CrossRef]
  44. Weng, H.; Li, S.; Huang, J.Y.; He, Z.Q.; Meng, X.Y.; Cao, Y.; Fang, C.; Zeng, X.T. Androgen receptor gene polymorphisms and risk of prostate cancer: A meta-analysis. Sci. Rep. 2017, 7, 40554. [Google Scholar] [CrossRef]
  45. Gu, M.; Dong, X.; Zhang, X.; Niu, W. The CAG repeat polymorphism of androgen receptor gene and prostate cancer: A meta-analysis. Mol. Biol. Rep. 2012, 39, 2615–2624. [Google Scholar] [CrossRef] [PubMed]
  46. Jumper, J.; Evans, R.; Pritzel, A.; Green, T.; Figurnov, M.; Ronneberger, O.; Tunyasuvunakool, K.; Bates, R.; Žídek, A.; Potapenko, A.; et al. Highly accurate protein structure prediction with AlphaFold. Nature 2021, 596, 583–589. [Google Scholar] [CrossRef] [PubMed]
  47. Weikum, E.R.; Liu, X.; Ortlund, E.A. The nuclear receptor super-family: A structural perspective. Protein Sci. 2018, 27, 1876–1892. [Google Scholar] [CrossRef] [PubMed]
  48. Callewaert, L.; Christiaens, V.; Haelens, A.; Verrijdt, G.; Verhoeven, G.; Claessens, F. Implications of a polyglutamine tract in the function of the human androgen receptor. Biochem. Biophys. Res. Commun. 2003, 306, 46–52. [Google Scholar] [CrossRef]
  49. Beilin, J.; Ball, E.M.; Favaloro, J.M.; Zajac, J.D. Effect of the androgen receptor CAG repeat polymorphism on transcriptional activity: Specificity in prostate and non-prostate cell lines. J. Mol. Endocrinol. 2000, 25, 85–96. [Google Scholar] [CrossRef]
  50. Parolia, A.; Cieslik, M.; Chu, S.-C.; Xiao, L.; Ouchi, T.; Zhang, Y.; Wang, X.; Vats, P.; Cao, X.; Pitchiaya, S.; et al. Distinct structural classes of activating FOXA1 alterations in advanced prostate cancer. Nature 2019, 571, 413–418. [Google Scholar] [CrossRef]
  51. Teng, M.; Zhou, S.; Cai, C.; Lupien, M.; He, H.H. Pioneer of prostate cancer: Past, present and the future of FOXA1. Prot. Cell 2021, 12, 29–38. [Google Scholar] [CrossRef]
  52. Adams, E.J.; Karthaus, W.R.; Hoover, E.; Liu, D.; Gruet, A.; Zhang, Z.; Cho, H.; DiLoreto, R.; Chhangawala, S.; Liu, Y.; et al. FOXA1 mutations alter pioneering activity, differentiation and prostate cancer phenotypes. Nature 2019, 571, 408–412. [Google Scholar] [CrossRef]
  53. Zhu, J.; Wei, Y.; Deng, F.; Zhou, Y.; Yang, Z.; Ma, Y. The role of FOXA1 in human normal development and its functions in sex hormone-related cancers. Front. Biosc. 2024, 29, 225. [Google Scholar] [CrossRef]
  54. Marcotrigiano, J.; Gingras, A.C.; Sonenberg, N.; Burley, S.K. Cocrystal structure of the messenger RNA 5′ cap-binding protein (eIF4E) bound to 7-methyl-GDP. Cell 1997, 89, 951–961. [Google Scholar] [CrossRef]
  55. Tomoo, K.; Shen, J.; Okabe, K.; Nozoe, Y.; Fukuhara, S.; Morino, S.; Ishida, T.; Taniguchi, T.; Hasegawa, H.; Terashima, A.; et al. Crystal structures of 7-methylguanosine 5′-triphosphate (m7GTP)- and P1-7-methylguanosine-P3-adenosine-5′, 5′-triphosphate (m7GpppA)-bound human full-lenght eukaryotic initiation factor 4E: Biological importance of the C-terminal flexible region. Biochem. J. 2002, 362, 539–544. [Google Scholar] [CrossRef] [PubMed]
  56. Zuehlke, A.D.; Beebe, K.; Neckers, L.; Prince, T. Regulation and function of the human HSP90AA1 gene. Gene 2015, 570, 8–16. [Google Scholar] [CrossRef] [PubMed]
  57. Prodromou, C.; Roe, S.M.; O’Brien, R.; Ladbury, J.E.; Piiper, P.W.; Pearl, L.H. Identification and structural characterization of the ATP/ADP-binding site in the Hsp90 molecular chaperone. Cell 1997, 90, 65–75. [Google Scholar] [CrossRef] [PubMed]
  58. Petrosino, M.; Novak, L.; Pasquo, A.; Turina, P.; Capriotti, E.; Minicozzi, V.; Consalvi, V.; Chiaraluce, R. The complex impact of cancer-related missense mutations on the stability and on the biophysical and biochemical properties of MAPK1 and MAPK3 somatic variants. BMC Hum. Genet. 2023, 17, 95. [Google Scholar] [CrossRef]
  59. Sulaimani, M.N.; Ahmed, S.; Anjum, F.; Mohammad, T.; Shamsii, A.; Dohare, R.; Hassan, M.I. Structure-guided identification of mitogenactivated protein kinase-1 inhibitors towards anticancer therapeutics. PLoS ONE 2025, 20, e0311954. [Google Scholar] [CrossRef]
  60. Yang, H.; Rudge, D.G.; Koos, J.D.; Vaidialingam, B.; Yang, H.J.; Pavletich, N.P. mTOR kinase structure, mechanism and regulation. Nature 2013, 497, 217–223. [Google Scholar] [CrossRef]
  61. Marafie, S.K.; Al-Mulla, F.; Abubaker, J. mTOR: Its critical role in metabolic diseases, cancer, and the aging process. Int. J. Mol. Sci. 2024, 25, 6141. [Google Scholar] [CrossRef]
  62. Yu, J.; Li, Y.; Ishizuka, T.; Guenther, M.G.; Lazar, M.A. A SANT motif in the SMRT corepressor interprets the histone code and promotes histone deacetylation. EMBO J. 2003, 22, 3403–3410. [Google Scholar] [CrossRef]
  63. Zhang, Q.; Xiao, H.; Chai, S.C.; Hoang, Q.Q.; Lu, H. Hydrophilic residues are crucial for ribosomal protein L11 (RPL11) interaction with zinc finger domain of MDM2 and p53 protein activation. J. Biol. Chem. 2011, 286, 38264–38274. [Google Scholar] [CrossRef]
  64. Rebbeck, T.R. Prostate cancer. Challenges for prevention, detection and treatment. In World Cancer Report; Wild, C.P., Weiderpass, E., Stewart, B.W., Eds.; International Agency for Research in Cancer; World Health Organization: Lyon, France, 2020; pp. 421–429. [Google Scholar]
  65. Richards, S.; Aziz, N.; Bale, S.; Bick, D.; Das, S.; Gastier-Foster, J.; Grody, W.W.; Hedge, M.; Lyon, E.; Spector, E.; et al. Standards and guidelines for the interpretation of sequence variants: A joint consensus recommendation of the American College of Medical Genetics and Genomics and the Association for Molecular Pathology. Genet. Med. 2015, 17, 405–424. [Google Scholar] [CrossRef]
  66. Landrum, M.J.; Lee, J.M.; Benson, M.; Brown, G.R.; Chao, C.; Chitipiralla, S.; Gu, B.; Hart, J.; Hoffman, D.; Jang, W.; et al. ClinVar: Improving access to variant interpretations and supporting evidence. Nucleic Acid Res. 2018, 46, 1062–1067. [Google Scholar] [CrossRef] [PubMed]
  67. Bustamante, C.D.; Burchard, E.G.; De la Vega, F.M. Genomics for the world. Nature 2011, 475, 163–165. [Google Scholar] [CrossRef] [PubMed]
  68. Goldstein, D.B.; Cavalleri, G.L. Understanding human diversity. Nature 2005, 437, 1241–1242. [Google Scholar] [CrossRef]
  69. Sirugo, G.; Williams, S.M.; Tishkoff, S.A. The missing diversity in human genetic studies. Cell 2019, 177, 26–31. [Google Scholar] [CrossRef]
  70. Park, S.L.; Cheng, I.; Haiman, C.A. Genome-wide association studies of cancer in diverse populations. Cancer Epidemiol. Biomark. Prev. 2018, 27, 405–417. [Google Scholar] [CrossRef]
  71. Paliouras, M.; Zaman, N.; Lumbroso, R.; Kapogeorgakis, L.; Beitel, L.K.; Wang, E.; Trifiro, M. Dynamic rewiring of the androgen receptor protein interaction network correlates with prostate cancer clinical outcomes. Integr. Biol. 2011, 3, 1020–1032. [Google Scholar] [CrossRef]
  72. Gaddipati, J.P.; McLeod, D.G.; Heidenberg, H.B.; Sesterhenn, I.A.; Finger, M.J.; Moul, J.W.; Srivastava, S. Frequent detection of codon 877 mutation in the androgen receptor gene in advanced prostate cancers. Cancer Res. 1994, 54, 2861–2864. [Google Scholar]
  73. Thompson, J.; Hyytinen, E.R.; Haapala, K.; Rantala, I.; Helin, H.J.; Jänne, O.A.; Palvimo, J.J.; Koivisto, P.A. Androgen receptor mutations in high-grade prostate cancer before hormonal therapy. Lab. Investig. 2003, 83, 1709–1713. [Google Scholar] [CrossRef]
  74. Tilley, W.D.; Buchanan, G.; Hickey, T.E.; Bentel, J.M. Mutations in the androgen receptor gene are associated with progression of human prostate cancer to androgen independence. Clin. Cancer Res. 1996, 2, 277–285. [Google Scholar]
  75. Yeh, S.H.; Chiu, C.M.; Chen, C.L.; Lu, S.F.; Hsu, H.C.; Che, D.S.; Chen, P.J. Somatic mutations at the trinucleotide repeats of androgen receptor gene in male epatocellular carcinoma. Int. J. Cancer 2007, 120, 1610–1617. [Google Scholar] [CrossRef]
  76. Pugh, T.J.; Weeraratne, S.D.; Archer, T.C.; Kummel, D.A.P.; Auclair, D.; Bochicchio, J.; Carneiro, M.O.; Carter, S.L.; Cibulskis, K.; Erlich, R.L.; et al. Medulloblastoma exome sequencing uncovers subtype-specific somatic mutations. Nature 2012, 488, 106–110. [Google Scholar] [CrossRef] [PubMed]
  77. Lefebvre, C.; Bachelot, T.; Filleron, T.; Pedrero, M.; Campone, M.; Soria, J.C.; Massard, C.; Lévy, C.; Arnedos, M.; Lacroix-Triki, M.; et al. Mutational profile of metastatic breast cancers: A retrospective analysis. PLoS Med. 2016, 13, e1002201. [Google Scholar] [CrossRef] [PubMed]
  78. Giannakis, M.; Mu, X.J.; Shukla, S.A.; Qian, Z.R.; Cohen, O.; Nishihara, R.; Bahl, S.; Cao, Y.; Amin-Mansour, A.; Yamauchi, M.; et al. Genomic correlates of immune-cell infiltrates in colorectal carcinoma. Cell Rep. 2016, 15, 857–865. [Google Scholar] [CrossRef] [PubMed]
  79. Rodríguez-González, G.; Cabrera, S.; Ramírez-Moreno, R.; Bilbao, C.; Díaz-Chico, J.C.; Serra, L.; Chesa, N.; Cabrera, J.J.; Díaz-Chico, B.N. Short alleles of both GGN and CAG repeats at the exon-1 of the androgen receptor gene are associated to increased PSA staining and a higher Gleason score in human prostatic cancer. J. Steroid Biochem. Mol. Biol. 2009, 113, 85–91. [Google Scholar] [CrossRef]
  80. Sahu, B.; Laakso, M.; Ovaska, K.; Mirtti, T.; Lundin, J.; Rannikko, A.; Sankila, A.; Turunen, J.P.; Lundin, M.; Konsti, J.; et al. Dual role of FoxA1 in androgen receptor binding to chromatin, androgen signalling and prostate cancer. EMBO J. 2011, 30, 3962–3976. [Google Scholar] [CrossRef]
  81. Bernardo, G.M.; Keri, R.A. FOXA1: A transcription factor with parallel functions in development and cancer. Biosci. Rep. 2012, 32, 113–130. [Google Scholar] [CrossRef]
  82. Gerhardt, J.; Montani, M.; Wild, P.; Beer, M.; Huber, F.; Hermanns, T.; Müntener, M.; Kristiansen, G. FOXA1 promotes tumor progression in prostate cancer and represents a novel hallmark of castration-resistant prostate cancer. Am. J. Pathol. 2012, 180, 848–861. [Google Scholar] [CrossRef]
  83. Jin, H.J.; Zhao, J.C.; Ogden, I.; Bergan, R.C.; Yu, J. Androgen receptor-independent function of FoxA1 in prostate cancer metastasis. Cancer Res. 2013, 73, 3725–3736. [Google Scholar] [CrossRef]
  84. Barbieri, C.E.; Baca, S.C.; Lawrence, M.S.; Demichelis, F.; Blattner, M.; Theurillat, J.P.; White, T.A.; Stojanov, P.; Allen, E.V.; Stransky, N.; et al. Exome sequencing identifies recurrent SPOP, FOXA1 and MED12 mutations in prostate cancer. Nat. Genet. 2012, 44, 685–689. [Google Scholar] [CrossRef]
  85. Cancer Genome Atlas Research Network. The molecular taxonomy of primary prostate cancer. Cell 2015, 163, 1011–1025. [Google Scholar] [CrossRef]
  86. Espiritu, S.M.G.; Liu, L.Y.; Rubanova, Y.; Bhandari, V.; Espiritu, S.M.G.; Holgersen, E.M.; Szyca, L.M.; Espiritu, S.M.G.; Fox, N.S.; Chua, M.L.; et al. The evolutionary landscape of localized prostate cancers drives clinical aggression. Cell 2018, 173, 1003–1013.e15. [Google Scholar] [CrossRef] [PubMed]
  87. Huang, F.W.; Mosquera, J.M.; Garofalo, A.; Oh, C.; Baco, M.; Amin-Mansour, A.; Rabasha, B.; Bahl, S.; Mullane, S.A.; Robinson, B.D.; et al. Exome sequencing of African-American prostate cancer reveals loss-of-function ERF mutations. Cancer Discov. 2017, 7, 973–983. [Google Scholar] [CrossRef] [PubMed]
  88. Hernández-Llodrà, S.; Segalés, L.; Safont, A.; Juanpere, N.; Lorenzo, M.; Fumadó, L.; Rodríguez-Vida, A.; Cecchini, L.; Bellmunt, J.; Lloreta-Trull, J. SPOP and FOXA1 mutations are associated with PSA recurrence in ERG wt tumors, and SPOP downregulation with ERG-rearranged. Prostate 2019, 79, 1156–1165. [Google Scholar] [CrossRef] [PubMed]
  89. Xu, B.; Song, B.; Lu, X.; Kim, J.; Hu, M.; Zhao, J.C.; Yu, J. Altered chromatin recruitment by FOXA1 mutations promotes androgen independence and prostate cancer progression. Cell Res. 2019, 29, 773–775. [Google Scholar] [CrossRef]
  90. Shorning, B.Y.; Dass, M.S.; Smalley, M.J.; Pearson, H.B. The PI3K-AKT-mTOR pathway and prostate cancer: At the crossroads of AR, MAPK, and WNT signaling. Int. J. Mol. Sci. 2020, 21, 4507. [Google Scholar] [CrossRef]
  91. Proud, C.G. Phosphorylation and signal transduction pathways in translational control. Cold Spring Harb. Perspect. Biol. 2019, 11, a033050. [Google Scholar] [CrossRef]
  92. Makwana, V.; Rudrawar, S.; Anoopkumar-Dukie, S. Signalling transduction of O-GlcNAcylation and PI3K/AKT/mTOR-axis in prostate cancer. Biochim. Biophys. Acta Mol. Basis Dis. 2021, 1867, 166129. [Google Scholar] [CrossRef]
  93. Dufor, C.R.; Scholtes, C.; Yan, M.; Chen, Y.; Han, L.; Li, T.; Xia, H.; Deng, Q.; Vernier, M.; Giguere, V. The mTOR chromatin-bound interactome in prostate cancer. Cell Rep. 2022, 38, 110534. [Google Scholar] [CrossRef]
  94. Chen, Y.; Han, L.; Dufor, C.R.; Alfonso, A.; Giguere, V. Canonical and nuclear mTOR specify distinct transcriptional programs in androgen-dependent prostate cancer cells. Mol. Cancer Res. 2024, 22, 113–124. [Google Scholar] [CrossRef]
  95. Audet-Walsh, E.; Dufor, C.R.; Yee, T.; Zouanat, F.Z.; Yang, M.; Kalloghlian, G.; Vernier, M.; Caron, M.; Bourque, G.; Scarlata, E.; et al. Nuclear mTOR acts as a transcriptional integrator of the androgen signaling pathway in prostate cancer. Genes Dev. 2017, 31, 1228–1242. [Google Scholar] [CrossRef]
  96. Giguere, V. DNA-PK, nuclear mTOR, and the androgen pathway in prostate cancer. Trends Cancer 2020, 6, 337–347. [Google Scholar] [CrossRef] [PubMed]
  97. Tan, B.X.; Liew, H.P.; Chua, J.S.; Ghadessy, F.J.; Tan, Y.S.; Lane, D.P.; Coffill, C.R. Anatomy of Mdm2 and Mdm4 in evolution. J. Mol. Cell Biol. 2017, 9, 3–15. [Google Scholar] [CrossRef]
  98. Brown, D.R.; Thomas, C.A.; Deb, S.P. The human oncoprotein MDM2 arrests the cell cycle: Elimination of its cell-cycle-inhibitory function induces tumorigenesis. EMBO J. 1998, 17, 2513–2525. [Google Scholar] [CrossRef] [PubMed]
  99. Manfredi, J.J. The Mdm2-p53 relationship evolves: Mdm2 swings both ways as an oncogene and a tumor suppressor. Genes Dev. 2010, 24, 1580–1589. [Google Scholar] [CrossRef] [PubMed]
  100. Alt, J.R.; Bouska, A.; Fernandez, M.R.; Cerny, L.; Xiao, H.; Eischen, C.M. Mdm2 binds to Nbs1 at sites of DNA damage and regulates double strand break repair. J. Biol. Chem. 2005, 280, 18771–18781. [Google Scholar] [CrossRef]
  101. Gu, L.; Zhang, H.; He, J.; Li, J.; Huang, M.; Zhou, M. MDM2 regulates MYCN mRNA stabilization and translation in human neuroblastoma cells. Oncogene 2012, 31, 1342–1353. [Google Scholar] [CrossRef]
  102. Jung, C.-H.; Kim, J.; Park, J.K.; Hwang, S.-G.; Moon, S.-K.; Kim, W.-J.; Um, H.-D. Mdm2 increases cellular invasiveness by binding to and stabilizing the Slug mRNA. Cancer Lett. 2013, 335, 270–277. [Google Scholar] [CrossRef]
  103. Wang, W.; Albadari, N.; Du, Y.; Fowler, J.F.; Sang, H.T.; Xian, W.; McKeon, F.; Li, W.; Zhou, J.; Zhang, R. MDM2 Inhibitors for cancer therapy: The past, present, and future. Pharmacol. Rev. 2024, 76, 414–453. [Google Scholar] [CrossRef]
  104. Xue, L.; Han, X.; Liu, R.; Wang, Z.; Li, H.; Chen, Q.; Zhang, P.; Wang, Z.; Chong, T. MDM2 and P53 polymorphisms contribute together to the risk and survival of prostate cancer. Oncotarget 2016, 7, 31825–31831. [Google Scholar] [CrossRef]
  105. Khatiwada, P.; Rimal, U.; Han, Z.; Shemshedini, L. MDM2 regulates the stability of AR, AR-V7, and TM4SF3 proteins in prostate cancer. Endocr. Oncol. 2024, 4, e230017. [Google Scholar] [CrossRef]
  106. Vummidi Giridhar, P.; Williams, K.; VonHandorf, A.P.; Deford, P.L.; Kasper, S. Constant degradation of the androgen receptor by MDM2 conserves prostate cancer stem cell integrity. Cancer Res. 2019, 79, 1124–1137. [Google Scholar] [CrossRef] [PubMed]
  107. Hernández, G.; Vazquez-Pianzola, P. eIF4E as a molecular wildcard in metazoans RNA metabolism. Biol. Rev. Cambr. Phil. Soc. 2023, 98, 2284–2306. [Google Scholar] [CrossRef] [PubMed]
  108. Siddiqui, N.; Sonenberg, N. Signalling to eIF4E in cancer. Biochem. Soc. Trans. 2015, 43, 763–772. [Google Scholar] [CrossRef] [PubMed]
  109. Kremer, C.L.; Klein, R.R.; Mendelson, J.; Browne, W.; Samadzedeh, L.K.; Vanpatten, K.; Highstrom, L.; Pestano, G.A.; Nagle, R.B. Expression of mTOR signaling pathway markers in prostate cancer progression. Prostate 2006, 66, 1203–1212. [Google Scholar] [CrossRef]
  110. Mamane, Y.; Petroulakis, E.; Martineau, Y.; Sato, T.A.; Larsson, O.; Rajasekhar, V.; Sonenberg, N. Epigenetic activation of a subset of mRNAs by eIF4E explains its effects on cell proliferation. PLoS ONE 2007, 2, e242. [Google Scholar] [CrossRef]
  111. Yanagiya, A.; Suyama, E.; Adachi, H.; Svitkin, Y.V.; Aza-Blanc, P.; Imataka, H.; Mikami, S.; Martineau, Y.; Ronai, Z.A.; Sonenberg, N. Translational homeostasis via the mRNA Cap-binding protein, eIF4E. Mol. Cell 2012, 46, 847–858. [Google Scholar] [CrossRef]
  112. Truitt, M.L.; Conn, C.S.; Shi, Z.; Pang, X.; Tokuyasu, T.; Coady, A.M.; Seo, Y.; Barna, M.; Ruggero, D. Differential requirements for eIF4E dose in normal development and cancer. Cell 2015, 162, 59–71. [Google Scholar] [CrossRef]
  113. Trepel, J.; Mollapour, M.; Giaccone, G.; Neckers, L. Targeting the dynamic HSP90 complex in cancer. Nat. Rev. Cancer 2010, 10, 537–549. [Google Scholar] [CrossRef]
  114. Bohonowych, J.E.; Hance, M.W.; Nolan, K.D.; Defee, M.; Parsons, C.H.; Isaacs, J.S. Extracellular Hsp90 mediates an NF-kappaB dependent inflammatory stromal program: Implications for the prostate tumor microenvironment. Prostate 2014, 74, 395–407. [Google Scholar] [CrossRef]
  115. Lavoie, H.; Gagnon, J.; Therrien, M. ERK signalling: A master regulator of cell behaviour, life and fate. Nat. Rev. Mol. Cell Biol. 2020, 21, 607–632. [Google Scholar] [CrossRef]
  116. Guo, Y.-J.; OPan, W.W.; Liu, S.B.; Shen, Z.F.; Xu, Y.; Hu, L.L. ERK/MAPK signalling pathway and tumorigenesis. Exp. Ther. Med. 2020, 19, 1997–2007. [Google Scholar] [CrossRef] [PubMed]
  117. Roskoski, R.J. Targeting ERK1/2 protein-serine/threonine kinases in human cancers. Pharmacol. Res. 2019, 142, 151–168. [Google Scholar] [CrossRef] [PubMed]
  118. Hernández, G.; Ramírez, J.L.; Pedroza-Torres, A.; Herrera, L.A.; Jiménez-Ríos, M.A. The secret life of translation initiation in prostate cancer. Front. Genet. 2019, 10, 14. [Google Scholar] [CrossRef] [PubMed]
  119. Paluvai, H.; Shanmukha, K.D.; Tyedmers, J.; Backs, J. Insights into the function of HDAC3 and NCoR1/NCoR2 co-repressor complex in metabolic diseases. Front. Mol. Biosci. 2023, 10, 1190094. [Google Scholar] [CrossRef]
  120. TI, L.; Valentim, R.R.; Araújo, H.N.; Oliveira, A.G.; Favero, B.C.; Menezes, E.S.; Araújo, R.; Silveira, L.R. Role of NCoR1 in mitochondrial function and energy metabolism. Cell Biol. Int. 2018, 42, 734–741. [Google Scholar]
  121. St-Jean, S.; De Castro, A.C.; Lecours, M.; Jones, C.; Rivard, N.; Rodier, F.; Perreault, N.; Boudreau, F. NCOR1 sustains colorectal cancer cell growth and protects against cellular senescence. Cancers 2021, 13, 4414. [Google Scholar] [CrossRef]
  122. Lopez, S.M.; Agoulnik, A.I.; Zhang, M.; Peterson, L.E.; Suarez, E.; Gandarillas, G.A.; Frolov, A.; Li, R.; Rajapakshe, K.; Coarfa, C.; et al. Nuclear receptor corepressor 1 expression and output declines with prostate cancer progression. Clin. Cancer Res. 2016, 22, 3937–3949. [Google Scholar] [CrossRef]
  123. Aylon, Y.; Furth, N.; Mallel, G.; Friedlander, G.; Nataraj, N.B.; Dong, M.; Hassin, O.; Zoabi, R.; Cohen, B.; Drendel, V.; et al. Breast cancer plasticity is restricted by a LATS1-NCOR1 repressive axis. Nat. Commun. 2022, 13, 7199. [Google Scholar] [CrossRef]
  124. Bertucci, F.; Ng, C.K.Y.; Patsouris, A.; Droiin, N.; Piscouglio, S.; Carbuccia, N.; Soria, J.C.; Dien, A.T.; Adnani, Y.; Kamal, M.; et al. Genomic characterization of metastatic breast cancers. Nature 2019, 569, 560–564. [Google Scholar] [CrossRef]
  125. Shu, S.; Li, Z.; Liu, L.; Ying, X.; Zhang, Y.; Wang, T.; Zhou, X.; Jiang, P.; Lv, W. HPV16 E6-activated OCT4 promotes cervical cancer progression by suppressing p53 expression via co-repressor NCOR1. Front. Oncol. 2022, 12, 900856. [Google Scholar] [CrossRef]
  126. Lin, A.; Qiu, Z.; Zhang, J.; Luo, P. Effect of NCOR1 mutations on immune microenvironment and efficacy of immune checkpoint inhibitors in patient with bladder cancer. Front. Immunol. 2021, 12, 630773. [Google Scholar] [CrossRef] [PubMed]
  127. Tang, L.; Zhang, L.; Liu, L.; Dong, L.; Dong, Y.; Zhu, W.; Wang, H. NCOR1 may be a potential biomarker of a novel molecular subtype of prostate cancer. FEBS Open Bio 2020, 10, 2678–2686. [Google Scholar] [CrossRef] [PubMed]
  128. Tate, J.G.; Bamford, S.; Jubb, H.C.; Sondka, Z.; Beare, D.M.; Bindal, N.; Boutselakis, H.; Cole, C.G.; Creatore, C.; Dawson, E.; et al. COSMIC: The catalogue of somatic mutations in cancer. Nucleic Acids Res. 2019, 47, D941–D947. [Google Scholar] [CrossRef] [PubMed]
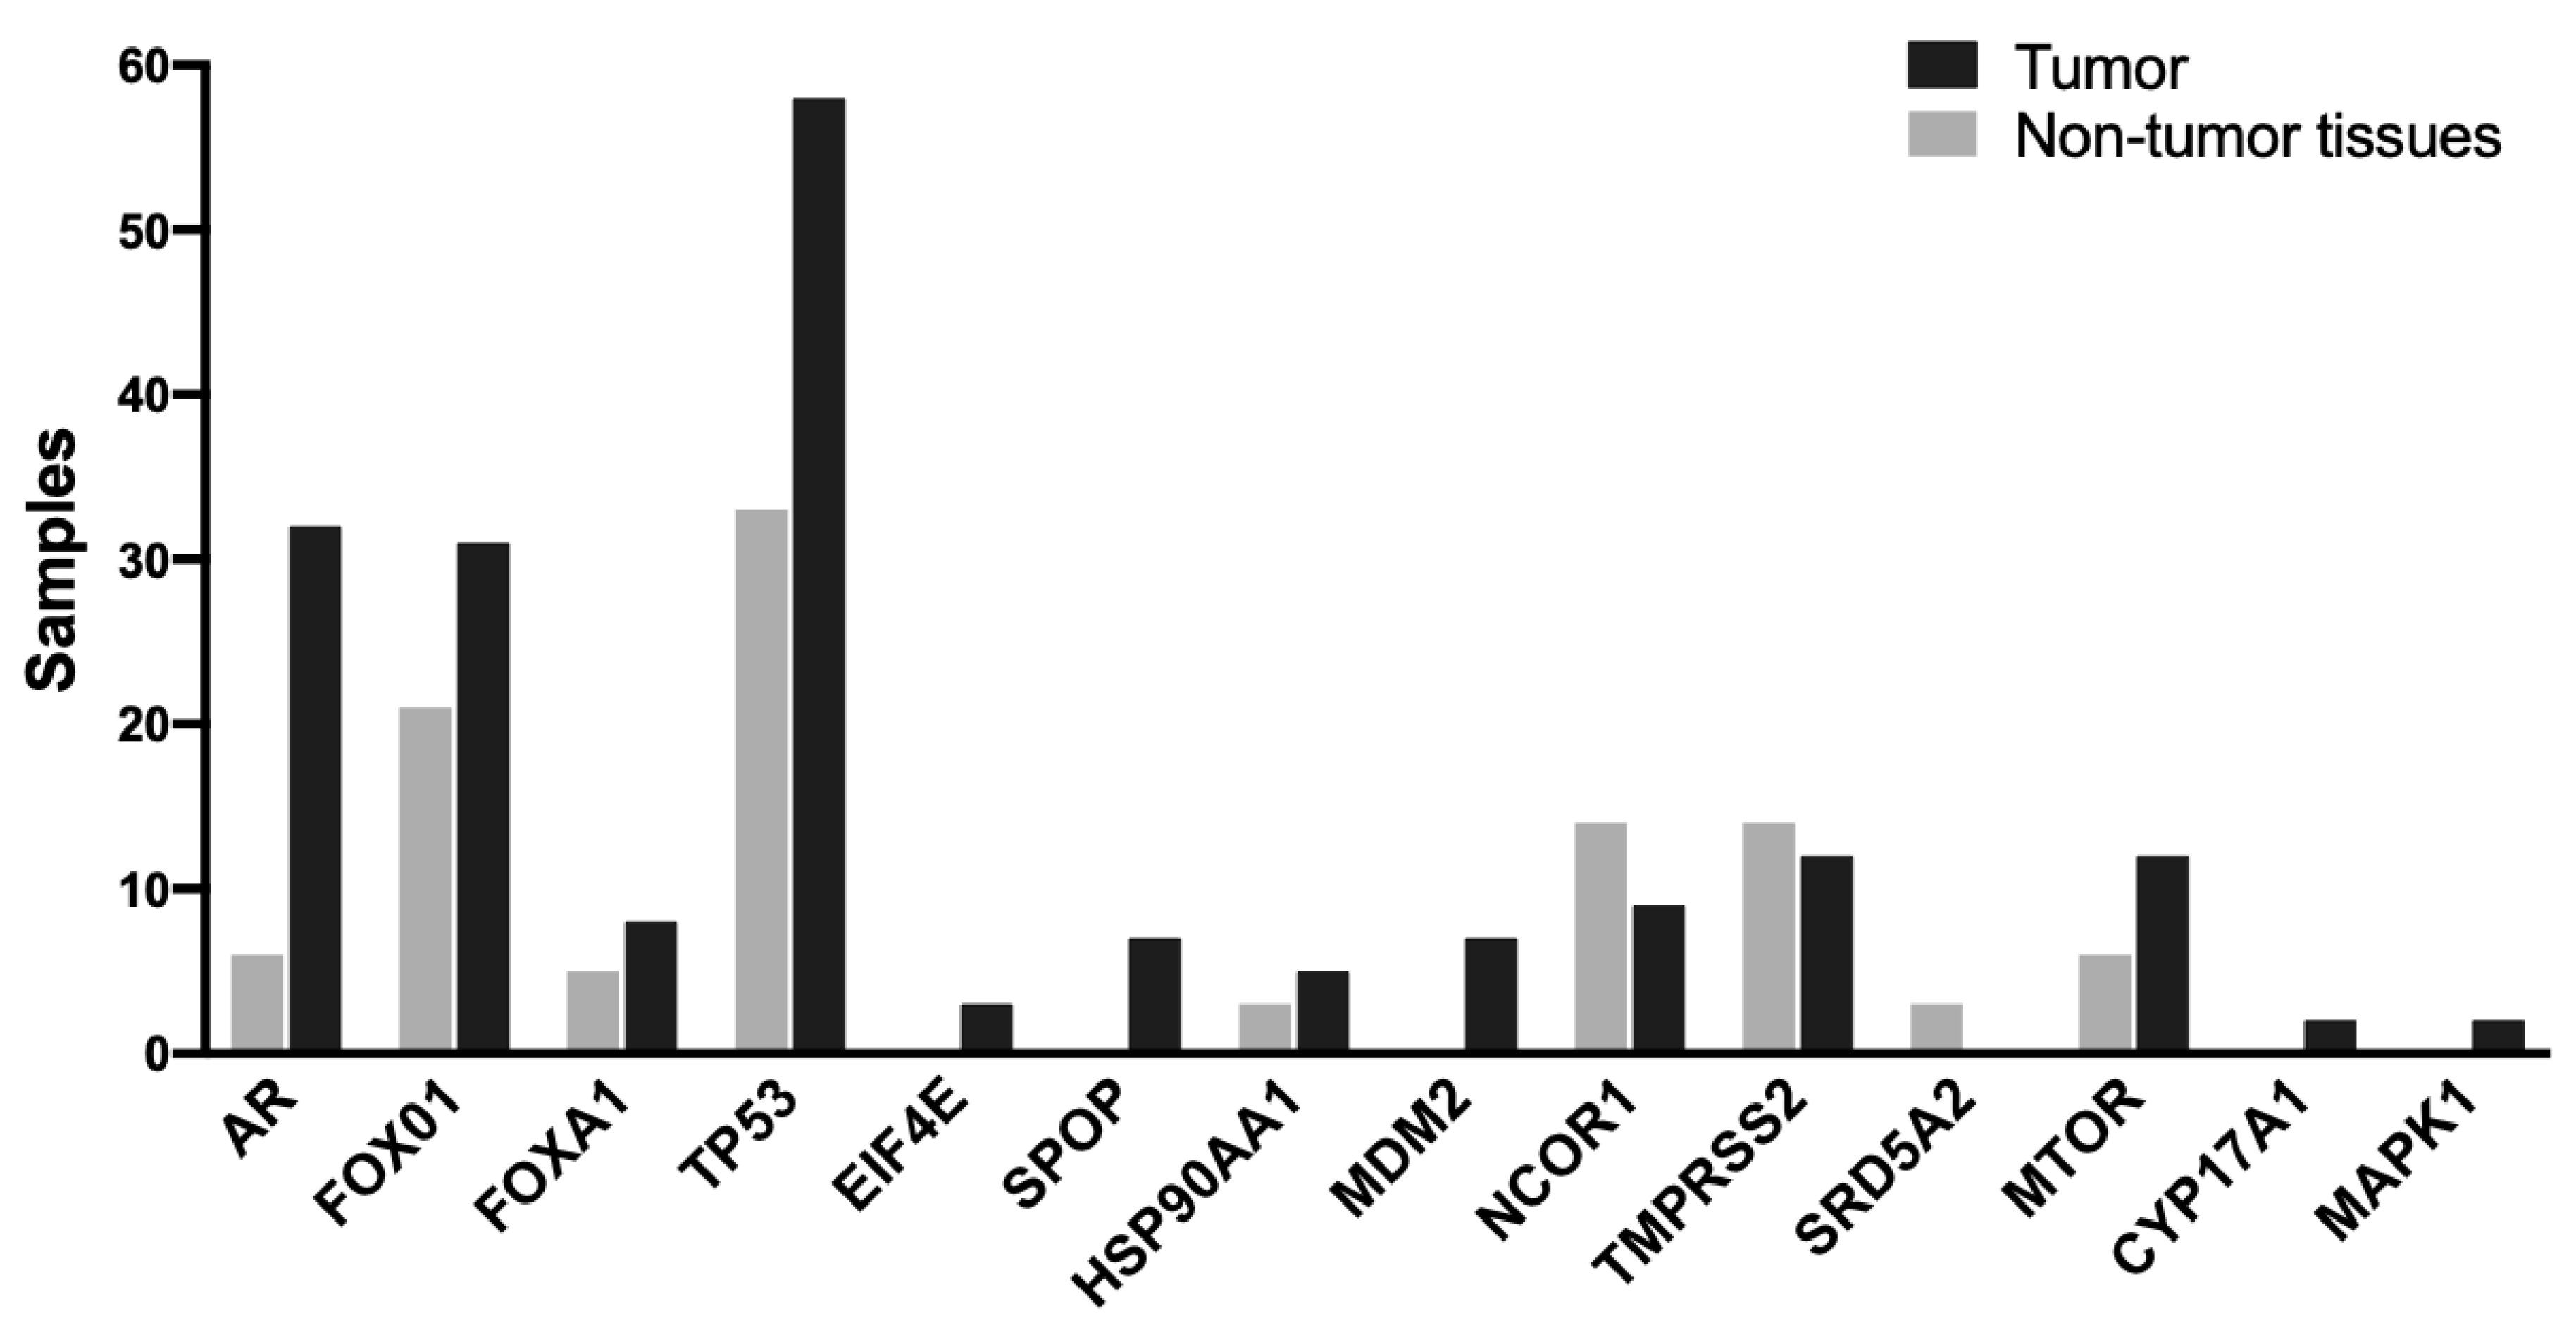
Figure 1. Frequency of functional mutations in the genes analyzed across biopsies. Black bars, tumors; Gray bars, non-PCa tumor biopsies. Missense mutations, nonsense mutations, frameshift deletions, and frameshift insertions were considered. TP53, AR, FOXO1, MTOR, and TMPRSS2 were the genes with mutations in the highest number.
Ijms 26 08758 g001
Figure 2. Number and type of mutations per gene in tumor samples. TP53, FOXO1, AR, TMPRSS2, and FOXA1 are the genes with the highest number of possible pathogenic mutations. Each square represents a tumor sample. The Gleason score is indicated in blue bars on top. Gleason scores above 7 are delimited with a red line. The type of mutations is color-coded on the bottom. Gray squares represent tumor samples without mutations hits.
Ijms 26 08758 g002
Figure 3. Number of pathogenic mutations per gene specific of tumor biopsies. AR, SPOP, TP53, FOXA1, and MTOR were the most mutated genes. The numbers on top of each bar indicate mutational hits.
Ijms 26 08758 g003
Figure 4. Functional mutations found in AR in PCa tissues. (A) The AR protein and its domains. The described and novel mutations discovered in this study are shown without and within squares, respectively. NTD, amino-terminal domain; AF-1 and AF-5, activation function-1 and -5 motifs, respectively; FXXLF and WXXLF, LxxLL motifs; QQQQQQQQ…, polymorphic region with variable (8–31) number of glutamine residues, spanning amino acids 57–88; fs, frame-shift; DBD, DNA-binding domain; LBD, ligand-binding domain. (B,C) AlphaFold 3D structure predictions of the NTD, wild-type and the indicated mutant proteins. (D) AlphaFold 3D structure predictions of the Hinge domain, wild-type and the indicated mutant protein.
Ijms 26 08758 g004
Figure 5. Functional mutations found in FOXA1 in PCa tissues. (A) The FOXA1 protein and its domains. The described and novel mutations discovered in this study are shown without and within squares, respectively. TA, N-terminal transactivation domain; FKHD, forkhead DNA-binding domain; Wing2, second winged loop; TA H3/H4, C-terminal transactivation domain associated with histone H3/H4. (B,C) AlphaFold 3D structure predictions of the wild-type and mutated proteins. (B) Only the FKHD is shown. (C) Only TA H3/H4 domain is shown.
Ijms 26 08758 g005
Figure 6. Functional mutations found in eIF4E in PCa tissues. (A) The eIF4E protein. The described and novel mutations discovered in this study are shown without and within squares, respectively. Cap-binding, residues involved in 7mGTP (cap)-binding; fs, frame-shift. (B) AlphaFold 3D structure prediction of both the complete wild-type and mutated proteins. Frameshift mutation F48S is predicted to produce a truncated peptide. An asterisk indicates a premature stop of the protein.
Ijms 26 08758 g006
Figure 7. Functional mutations found in HSP90AA1 in PCa tissues. (A) The HSP90AA1 protein and its domains. The described and novel mutations discovered in this study are shown without and within squares, respectively. (B) AlphaFold 3D structure prediction of both the wild-type and mutated proteins.
Ijms 26 08758 g007
Figure 8. Functional mutations found in MAPK1 in PCa tissues. (A) The MAPK1 protein and its domains. The described and novel mutations discovered in this study are shown without and within squares, respectively. ATP-BS, ATP-binding site. (B) AlphaFold 3D structure prediction of both the wild-type and mutated proteins.
Ijms 26 08758 g008
Figure 9. Functional mutations found in mTOR in PCa tissues. (A) The mTOR kinase and its domains. The described and novel mutations discovered in this study are shown without and within squares, respectively. FAT, FRAP, ATM, and TRRAP domain; FRB, FKBP12-rapamycin-binding domain; KD, kinase domain; FATC, FAT domain at the carboxy-terminus. (B) AlphaFold 3D structure prediction of the wild-type and mutated proteins. Only the FAT domain is depicted.
Ijms 26 08758 g009
Figure 10. Functional mutations found in NCOR1 in PCa tissues. (A) The NCOR1 protein and its domains. The described and novel mutations discovered in this study are shown without and within squares, respectively. SANT1, component of the deacetylase activator domain; SANT2, histone interaction domain. (B) AlphaFold 3D structure prediction of both the wild-type and mutated protein.
Ijms 26 08758 g010
Figure 11. Functional mutations found in MDM2 in PCa tissues. (A) The MDM2 protein and its domains. The described and novel mutations discovered in this study are shown without and within squares, respectively. (B) AlphaFold 3D structure prediction of the wild-type and mutated proteins.
Ijms 26 08758 g011
Figure 12. Kaplan–Meier survival curves comparing patients with and without mutations in FOXA1Blue line, patients without mutations; Red line, patients carrying mutations. Censored data points are indicated by vertical ticks (blue and red for the respective groups). Patients with mutations in FOXA1 exhibited significantly decreased overall survival compared to those without mutations (log-rank test, p = 0.04).
Ijms 26 08758 g012
Figure 13. Genes with relevant mutations and their involvement in the AR activation pathway. Proteins encoded by all genes here studied are shown. The top five proteins with the highest rate of pathogenic mutations in tumors are depicted in color. Blue stars indicate genes with the highest frequency of mutations across all biopsies; red stars indicate genes with the highest number of pathogenic mutations exclusively in tumors; green stars indicate mutations with a positive patient survival association. AR, androgen receptor; SPOP, speckle-type POZ protein; FOXA1, Forkhead box protein A1; MTOR, mammalian target of rapamycin; DHT, dihydrotestosterone; P, phosphorylation; PSA, prostate specific antigen. Image created with BioRender.com.
Ijms 26 08758 g013
Table 1. Clinical description of the patients analyzed in this study.
CharacteristicTumor Samples
n = 64 (66.6%)
Non-Tumor Samples
n = 32 (33.4%)
Age≤50: 4 (6.25%)≤50: 2 (6.25%)
>50: 60 (93.75%)>50: 30 (93.75%)
Median = 68-years-oldMedian = 6-years-old
PSA at diagnosis≤10 ng/mL: 11 (17.18)≤10 ng/mL: 18 (56.25%)
10.1–20 ng/mL: 11 (17.18%)10.1–20 ng/mL: 11 (34.37%)
>20 ng/mL: 42 (65.6%)>20 ng/mL: 3 (9.37%)
Median = 305 ng/mLMedian = 10.5 ng/mL
Body mass index (BMI)<18.5: 2 (3.12%)<18.5: 5 (15.62%)
18.5–24.9: 10 (15.62%)18.5–24.9: 10 (31.25%)
25–29.9: 26 (40.65%)25–29.9: 6 (18.75%)
≥30: 11 (17.18%)≥30: 6 (18.75%)
Without data: 15 (23.43%) Without data: 5 (15.62%)
Median = 27Median = 25.9
AddictionsSmoking: 4 (6.25%)
Alcohol: 11 (17.18%)
Smoking and alcohol: 22 (34.37%)
Without data: 27 (42.18%)
Without data
Gleason score<7: 6 (9.37%)
=7: 25 (39.06%)
>7: 31 (50%)
Without data: 2 (3.12%)
NA
Perineural invasionYes: 41 (64.06%)
No: 15 (23.43%)
Without data: 2 (3.12%)
NA
MetastasisYes: 19 (29.68%)
No: 31 (48.43%)
Without data: 14 (21.87%)
NA
Nationality100% Mexicans with all four Mexican grandparents 100% Mexicans with all four Mexican grandparents
Table 2. Pathogenic and probably pathogenic mutations identified in the cohort of patients diagnosed with prostate cancer from this study.
GenMutation Type Change in DNAChange in ProteinStatus aFunctional Prediction b
ARFrameshift Insertionc.230_231insAp.Gln78fsNovelProbably pathogenic
ARFrameshift Insertionc.203_204insAp.Gln69fsNovelProbably pathogenic
ARFrameshift Insertionc.206_207insAp.Gln70fsNovelProbably pathogenic
ARMissensec.61G>Ap.Gly21ArgNovelPathogenic
ARFrameshift Insertionc.227_228insAp.Gln77fsNovelProbably pathogenic
ARMissensec.206A>Gp.Gln69ArgNovelProbably pathogenic
ARFrameshift Insertionc.1981_1982insAAAAp.Thr661fsNovelProbably pathogenic
ARMissensec.1115C>Tp.Ala372ValPreviously reportedProbably pathogenic
ARMissensec.170T>Ap.Leu57GlnPreviously reportedProbably benign
ARMissensec.92G>Ap.Arg31HisPreviously reportedPathogenic
ARMissensec.215A>Tp.Gln72LeuPreviously reportedProbably benign
EIF4EFrameshift Deletionc.144_145delTAp.Phe48fsNovelProbably pathogenic
FOXA1Missensec.655C>Ap.Arg219SerPreviously reportedPathogenic
FOXA1Missensec.1267G>Ap.Ala423ThrNovelPathogenic
FOXA1Non-frameshift Deletionc.752_763delGCAACATGTTCGp.Gly251_Phe254delNovelProbably pathogenic
FOXA1Non-frameshift Deletionc.749_760delCCGGCAACATGTp.Ser250_Met253delNovelProbably pathogenic
HSP90AA1Missensec.836A>Tp.Lys279MetNovelPathogenic
HSP90AA1Missensec.581A>Gp.Gln194ArgPreviously reportedPathogenic
MAPK1Missensec.941A>Gp.Glu314GlyNovelPathogenic
MDM2Missensec.845A>Gp.Tyr282CysNovelPathogenic
MDM2Missensec.848A>Gp.Gln283ArgNovelProbably benign
MTORMissensec.5710C>Tp.Leu1904PheNovelPathogenic
MTORMissensec.4621C>Tp.His1541TyrNovelPathogenic
MTORMissensec.5705A>Tp.Asp1902ValNovelPathogenic
NCOR1Missensec.5066C>Tp.Pro1689LeuNovelPathogenic
NCOR1Non-frameshift Deletionc.5989_5991delGTTp.Val1997delPreviously reportedProbably pathogenic
NCOR1Missensec.4805A>Gp.Gln1602ArgPreviously reportedProbably pathogenic
SPOPMissensec.397T>Gp.Phe133ValPreviously reportedProbably pathogenic
SPOPMissensec.469C>Tp.Leu157PhePreviously reportedVUS
SPOPMissensec.398T>Cp.Phe133SerPreviously reportedProbably pathogenic
SPOPMissensec.398T>Gp.Phe133CysPreviously reportedProbably pathogenic
SPOPMissensec.305T>Gp.Phe102CysPreviously reportedProbably pathogenic
SPOPMissensec.304T>Gp.Phe102ValPreviously reportedProbably pathogenic
TP53Missensec.524G>Ap.Arg175HisPreviously reportedPathogenic
TP53Missensec.578A>Cp.His193ProPreviously reportedPathogenic
TP53Missensec.1096T>Gp.Ser366AlaPreviously reportedVUS
TP53Nonsensec.916C>Tp.Arg306TerPreviously reportedPathogenic
TP53Missensec.808T>Ap.Phe270IlePreviously reportedPathogenic
a Novel mutations, exclusive from Mexican population. b Defined by ClinVar (https://www.ncbi.nlm.nih.gov/clinvar/ (accessed on accessed on 2 June 2025)), Varsome (https://varsome.com/ (accessed on 2 June 2025)), and or COSMIC (https://cancer.sanger.ac.uk/cosmic (accessed on 2 June 2025)) and references therein.
Table 3. Fifteen-gene panel associated with the AR pathway in prostate cancer.
Gene NameChromosomeChr. StartChr. EndNum. AmpliconsTotal BasesCovered BasesMissed BasesCoverage (%)
MTOR1111074791125941470822081833799.5
CYP17A11010283069610283736614160716070100
MDM212688084726883985417160416040100
FOXO1134055951740666217101988150048875.5
HSP90AA11410208170610213940920268526850100
FOXA114375913593759497791439129614390.1
TP53177669603767659914138313077694.5
SPOP1749600372496228159121512150100
NCOR117160322901619457473782978290100
SRD5A22315261903158090588158041198.7
TMPRSS221414661364150800916173016933797.9
MAPK12221769198218674451111631160399.7
EIF4E49888102298929117109159150100
NKX3-18236812152368289457257002596.6
ARX675451416772384619287328730100
Disclaimer/Publisher’s Note: The statements, opinions and data contained in all publications are solely those of the individual author(s) and contributor(s) and not of MDPI and/or the editor(s). MDPI and/or the editor(s) disclaim responsibility for any injury to people or property resulting from any ideas, methods, instructions or products referred to in the content.