Article

Novel Carbazole–Thiazole Conjugates: Synthesis and Biophysical Characterization

by
Beata Donarska
1,
Klaudia Seklecka
1,
Joanna Cytarska
1,
Katarzyna Piechowska
1,
Przemyslaw Ledwon
2,
Sławomir Kula
3,
Przemysław Krawczyk
4,
Angelika Baranowska-Łączkowska
5,* and
Krzysztof Z. Łączkowski
1,*
1
Department of Chemical Technology and Pharmaceuticals, Faculty of Pharmacy, Collegium Medicum, Nicolaus Copernicus University, Jurasza 2, 85-089 Bydgoszcz, Poland
2
Department of Physical Chemistry and Technology of Polymers, Faculty of Chemistry, Silesian University of Technology, Strzody 9, 44-100 Gliwice, Poland
3
Institute of Chemistry, Faculty of Science and Technology, University of Silesia, Szkolna 9 St., 40-007 Katowice, Poland
4
Department of Physical Chemistry, Faculty of Pharmacy, Collegium Medicum, Nicolaus Copernicus University, Kurpińskiego 5, 85-950 Bydgoszcz, Poland
5
Faculty of Physics, Kazimierz Wielki University, Powstańców Wielkopolskich 2, 85-090 Bydgoszcz, Poland
*
Authors to whom correspondence should be addressed.
Int. J. Mol. Sci. 2025, 26(16), 7945; https://doi.org/10.3390/ijms26167945
Submission received: 28 June 2025 / Revised: 17 July 2025 / Accepted: 14 August 2025 / Published: 18 August 2025
(This article belongs to the Special Issue Spectroscopic Techniques in Molecular Sciences)

Abstract

This presented study depicts the synthesis of three novel carbazole–thiazole conjugates, thoroughly investigating their spectroscopic properties as well as evaluating their biological activity as tyrosinase inhibitors. Additionally, we investigated the possibility of using Concanavalin A (ConA) complexes with dyes from a theoretical point of view, developing a promising protein-based strategy of delivery of dyes to the target cells. The tyrosinase inhibition assay showed that compounds K1 and K3 demonstrated higher activity than the kojic acid with IC50 values of 46 and 59 mM, respectively. Among the tested compounds, carbazole K3 exhibits the most pronounced nonlinear optical response due to its high electronic flexibility, strong solvatochromism, large excited-state dipole moments, and efficient intramolecular charge transfer. Additionally, all investigated carbazoles demonstrate high ability to form stable supramolecular complexes with ConA, which was confirmed using molecular docking studies. It was found experimentally and theoretically that the compound K3 has the best biophysical parameters, making it a promising candidate for potential diagnostic applications.

1. Introduction

Carbazoles are heterocyclic aromatic compounds containing a tricyclic system consisting of two benzene rings joined by a five-membered ring containing nitrogen atom. Due to their unique chemical structure, carbazoles exhibit interesting physicochemical properties, which make them the subject of intensive research in various scientific fields—from materials chemistry through pharmacology to bioengineering. These compounds are attracting special attention from scientists due to their high thermal stability, strong fluorescence properties, and ability to be easily chemically modified, which enables tailoring their properties to specific applications [1].
In medicine, carbazoles exhibit a wide range of biological activity, including anti-inflammatory, antibacterial, antifungal, antiviral, and antioxidant effects [2,3]. There is a great interest in the anticancer properties of carbazoles, which are associated with various mechanisms of action [4,5]. A classic example of a natural compound from this group is ellipticine, an alkaloid with the ability to inhibit topoisomerase II and DNA intercalation [6]. Some carbazole derivatives have been identified as potential inhibitors of protein kinases—enzymes that play a key role in cancer pathogenesis. Recently, murrayanine, another carbazole alkaloid, has been shown to inhibit the growth of oral cancer cells by modulating the AKT/mTOR and Raf/MEK/ERK signaling pathways, thereby limiting tumor growth in vivo [7]. Synthetic carbazoles, such as derivatives of thiazolidinone, indoles, and carbaldehyde, have been shown to inhibit the growth of liver, breast, colon, and melanoma cancer cells. In the context of therapy of the latter type of cancer, of particular interest is the ability of carbazoles to inhibit activity of tyrosinase—an enzyme that catalyzes hydroxylation of L-tyrosine to L-DOPA and its further oxidation to L-DOPA-quinone.
Excessive activity of this enzyme is associated with pigmentation disorders (such as melasma, age spots), as well as with the pathogenesis of melanoma and chronic skin inflammation. Recently, 2-benzimidazole, benzothiazole, and benzoxazole carbazole derivatives have been described as potent competitive tyrosinase inhibitors that bind to the active site of tyrosinase via interaction with its dinuclear copper center [8]. In melanoma therapy, the ability of compounds to inhibit tyrosinase activity is associated with the sensitivity of cancer cells to radiotherapy and chemotherapy, by reducing the production of cancer cells protecting melanin. In addition to their use in cancer therapy, the ability to inhibit tyrosinase is also associated with the possibility of using carbazole derivatives in the food and materials industry [9].
The applications of carbazoles in molecular biology and biochemistry as building blocks for fluorescent sensors are equally interesting. Due to their optical properties, carbazoles can be used as probes in studies on enzymes, protein structures, and intermolecular interactions. The carbazole ring is characterized by chemical and photostability, as well as the possibility of introducing various functional groups, which allows for the appropriate adjustment of fluorescence emission both for the detection of metal ions, changes in environmental pH, and the detection of specific enzymatic reactions. Fluorescent probes based on the carbazole structure are characterized by high selectivity towards biological targets and detection sensitivity, which allows detection of low concentrations of analytes [10]. Recently, a fluorescent probe based on a carbazole structure has been presented for the detection of fluoride ions in biological samples, which is important due to the toxic effects of excessive fluoride concentrations in the human body [11]. Another example is the fluorescent probe designed by Wang et al., based on a carbazole structure conjugated with thiophene, capable of selective detection of copper II ions in aqueous solutions and in living cells. The probe has been shown to easily penetrate biological membranes and exhibit low toxicity, making it a useful tool in biomedical research [12].
The next, equally important application of carbazole compounds is their use in organic electronics, primarily as light-emitting materials in organic light-emitting diodes (OLEDs), as well as components of active layers in organic photovoltaic cells (OPVs) and thin-film transistors (OTFTs). The carbazole structure is characterized by favorable properties such as electron delocalization in the conjugated π system and good hole transport, high thermal and electrochemical stability, high photoluminescence quantum yield (PLQY), and ease of functionalization in various places, which makes it an attractive material in terms of applications in optics and electronics [13]. Recently, new derivatives of carbazole conjugated with benzo[a]carbazole have been published, exhibiting excellent thermal and optical stability, serving as dedicated host materials in OLEDs, as well as improving the efficiency and lifetime of diodes [14].
Considering the above-mentioned findings, we decided to continue the search for new compounds with more favorable properties as dyes and with larger biological activity. We decided to achieve this effect by introducing into the molecule the cyano (-CN) and nitro (-NO2) groups, which are commonly used in dyes as electron-withdrawing groups. Additionally, we also decided to investigate the effect of the large, rigid electron-donating adamantyl group, which has the ability to bind to the hydrophobic pocket of enzymes. Our research includes detailed investigation of the substituent effect on spectroscopic properties, and thus the possibility of using these materials as sensitive molecular probes and potential anticancer drugs based on the mechanism of tyrosinase inhibition. Additionally, we investigated the possibility of using Concanavalin A (ConA) complexes with dyes, developing a promising protein-based strategy of delivery of dyes to the target cells, as well as a way to improve probe efficiency.

2. Results and Discussion

2.1. Chemical Synthesis

The synthesis of new carbazole derivatives containing thiazole moiety K1K3 was carried out using the reaction of 2-(4-(9H-carbazol-9-yl)benzylidene)hydrazinecarbothioamide (B), prepared according to the known procedure [15], and commercially available 2-bromoketones in ethanol solvent for 20 h under reflux. The targeted products K1K3 were obtained with 90–97% yield, and their synthesis is outlined in Scheme 1. All products were purified on silica gel column chromatography and fully characterized employing spectroscopic methods, 1H, 13C NMR, and ESI-HRMS analysis (see Supplementary Information). The 1H NMR peaks at 6.45, 7.67, and 7.76 ppm are characteristic signals from the thiazole ring-5H protons, confirming obtaining of target products. Additionally, bold signals from the NH group can be found in the range of 12.34–12.43 ppm. All products also have their characteristic peaks corresponding to their molecular [M+H]+ ions, observed in the ESI-HRMS spectra.

2.2. Mushroom Tyrosinase Inhibition

Carbazoles K1K3 were examined for their inhibitory effects on mushroom tyrosinase using L-DOPA as substrate. The results are summarized in Table 1. The results were compared with standard tyrosinase inhibitors, namely kojic acid and ascorbic acid.
All tested compounds showed higher effect of tyrosinase inhibition than ascorbic acid (IC50 386.50 µM). Among the investigated carbazoles, the best inhibitory effect was demonstrated by compound K3. Its IC50 value of 45.95 µM means 1.6 times higher inhibitory effect than kojic acid (IC50 72.27 µM) and more than 8 times higher inhibitory effect than ascorbic acid (IC50 386.5 mM). This compound is characterized by the presence of the 4-nitrophenyl group. Almost comparable activity to K3 was shown by the K1 compound containing the adamantyl moiety, with IC50 value equal to 59.36 µM. Slightly lower tyrosinase inhibition effect than kojic acid was shown by compound K2 (IC50 81.99 µM), containing the cyano group.

Kinetic Analysis of the Inhibition of Tyrosinase

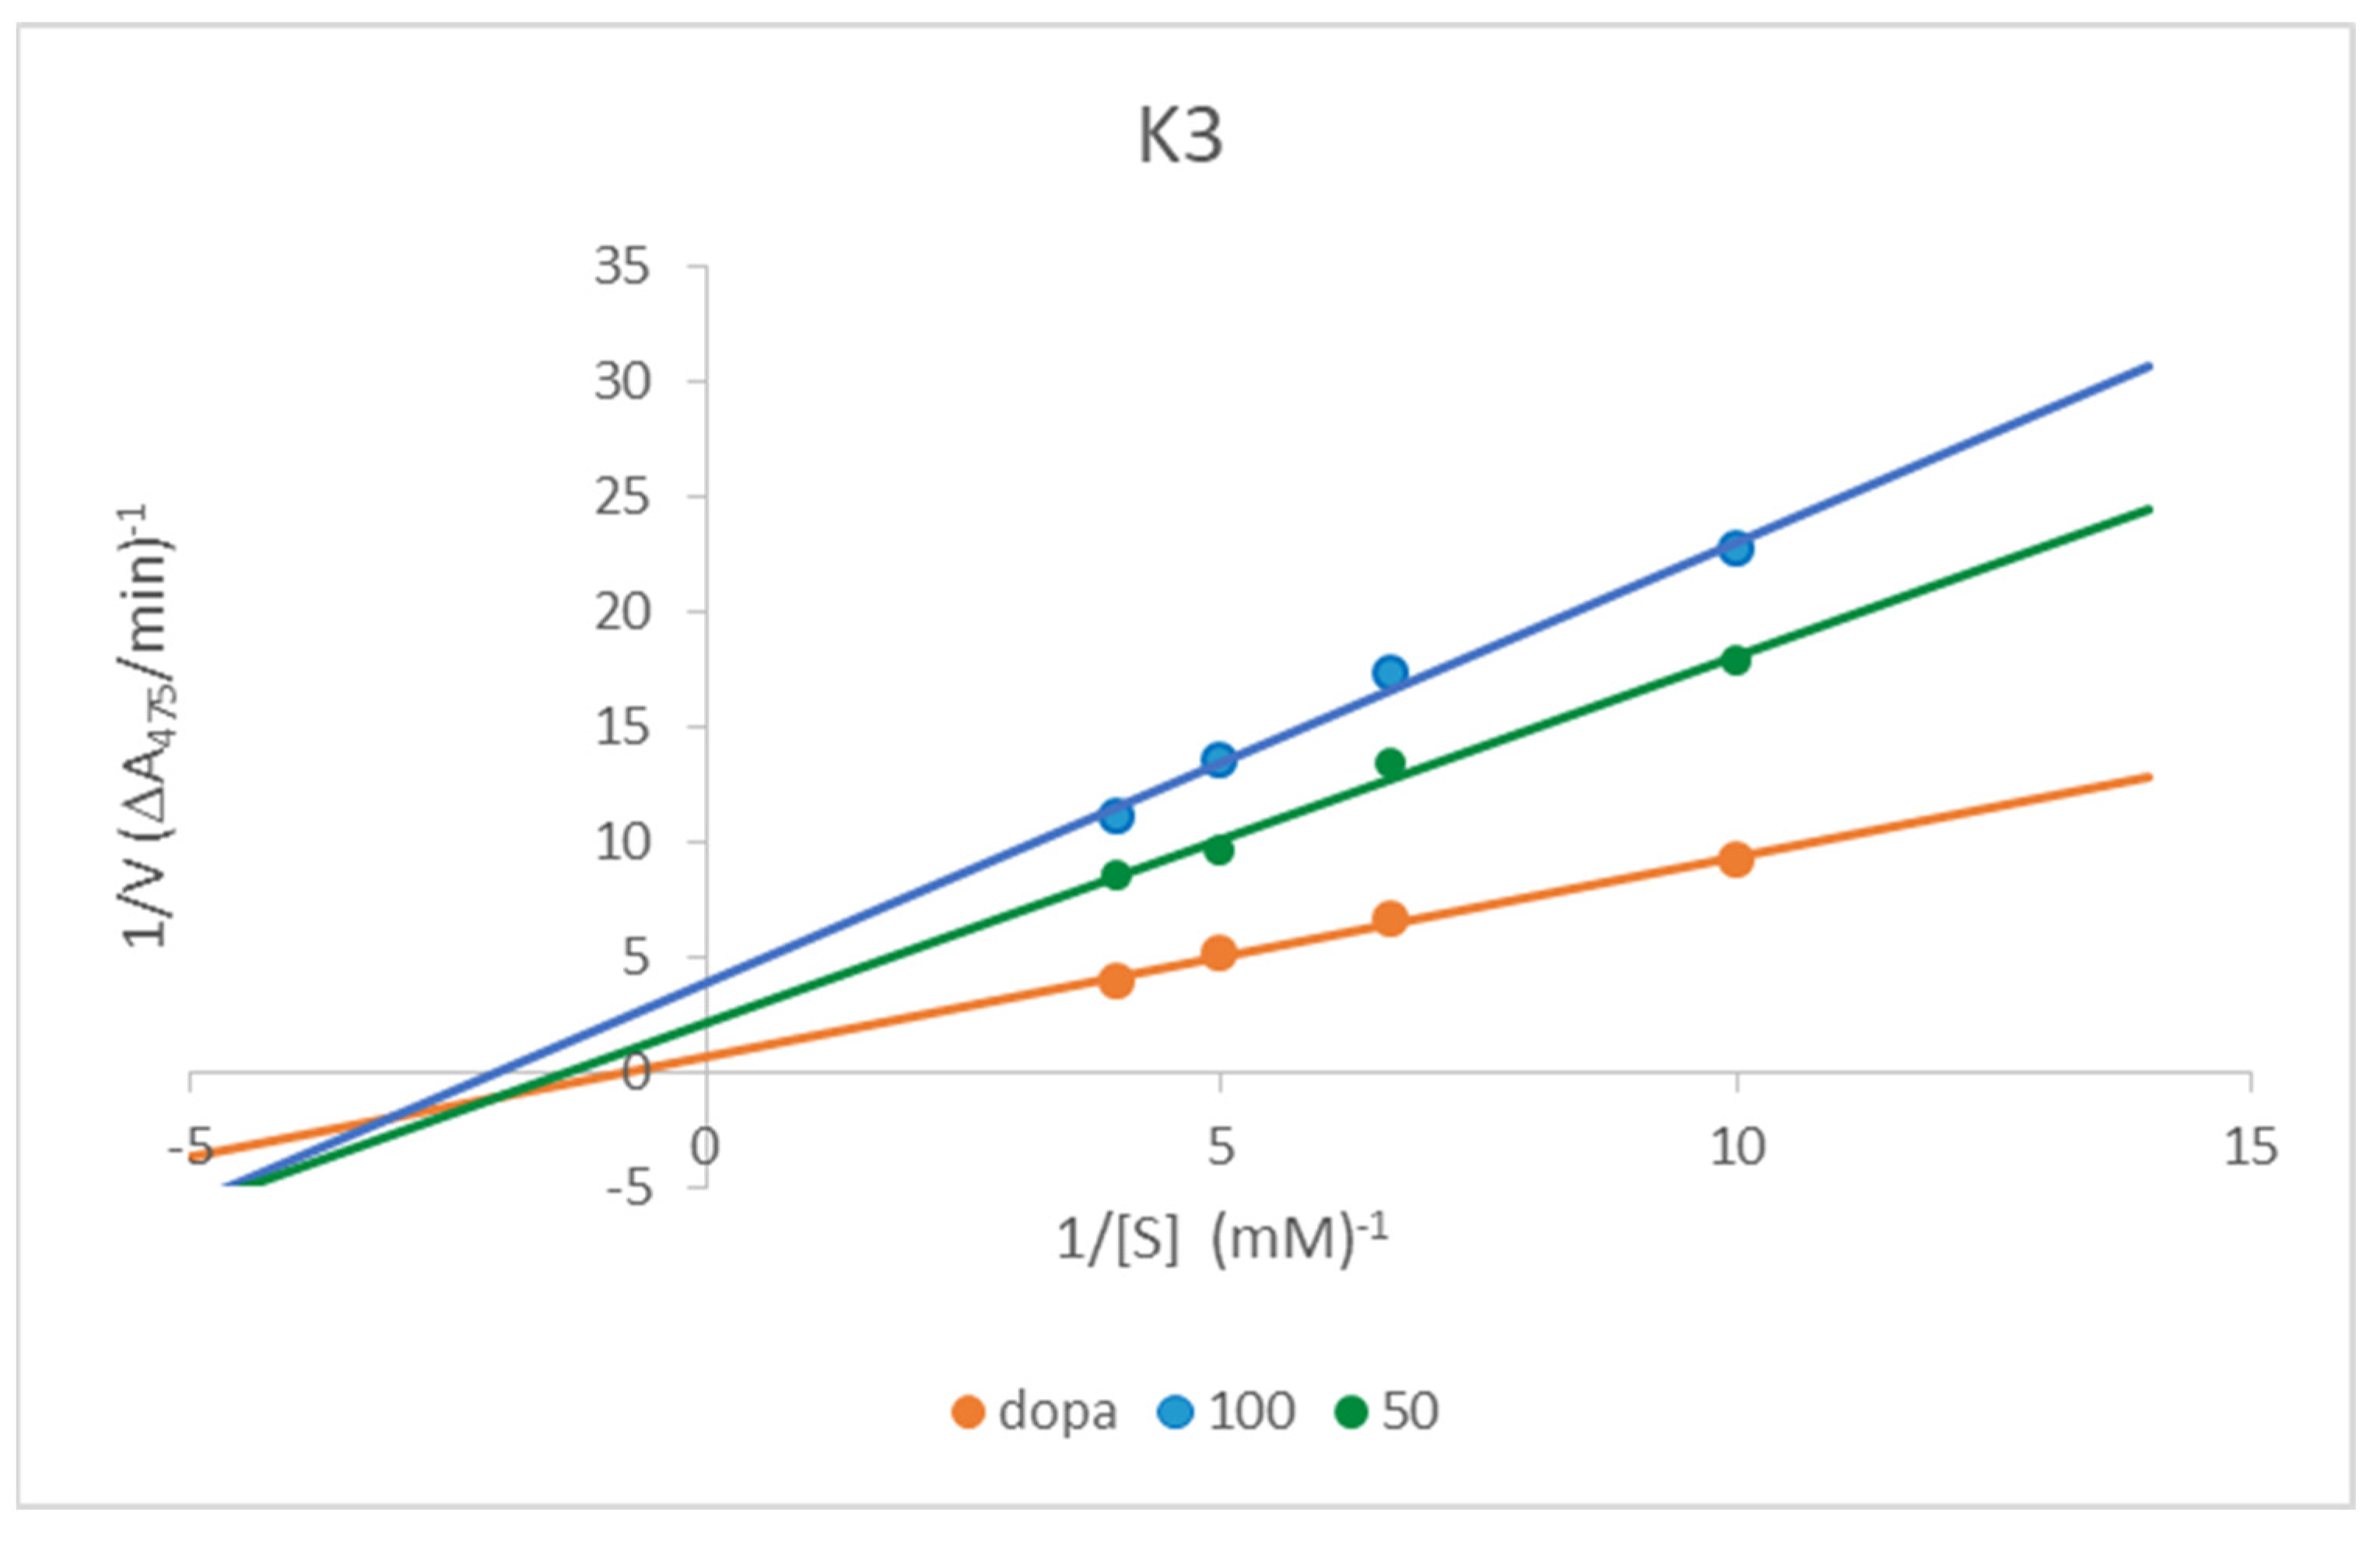
Based on the Lineweaver–Burk double reciprocal plots, the inhibition mode for the three investigated compounds was established as mixed-type inhibition, i.e., the type of enzyme inhibition in which the inhibitor may bind to the enzyme regardless of whether or not the enzyme has already bound the substrate. Out of all the investigated compounds, the K2 carbazole is characterized by the lowest value of the inhibition constant, KM 0.314, which corresponds to the high enzyme affinity for substrate (Figure 1).

2.3. Physicochemical Properties

2.3.1. Thermal Stability

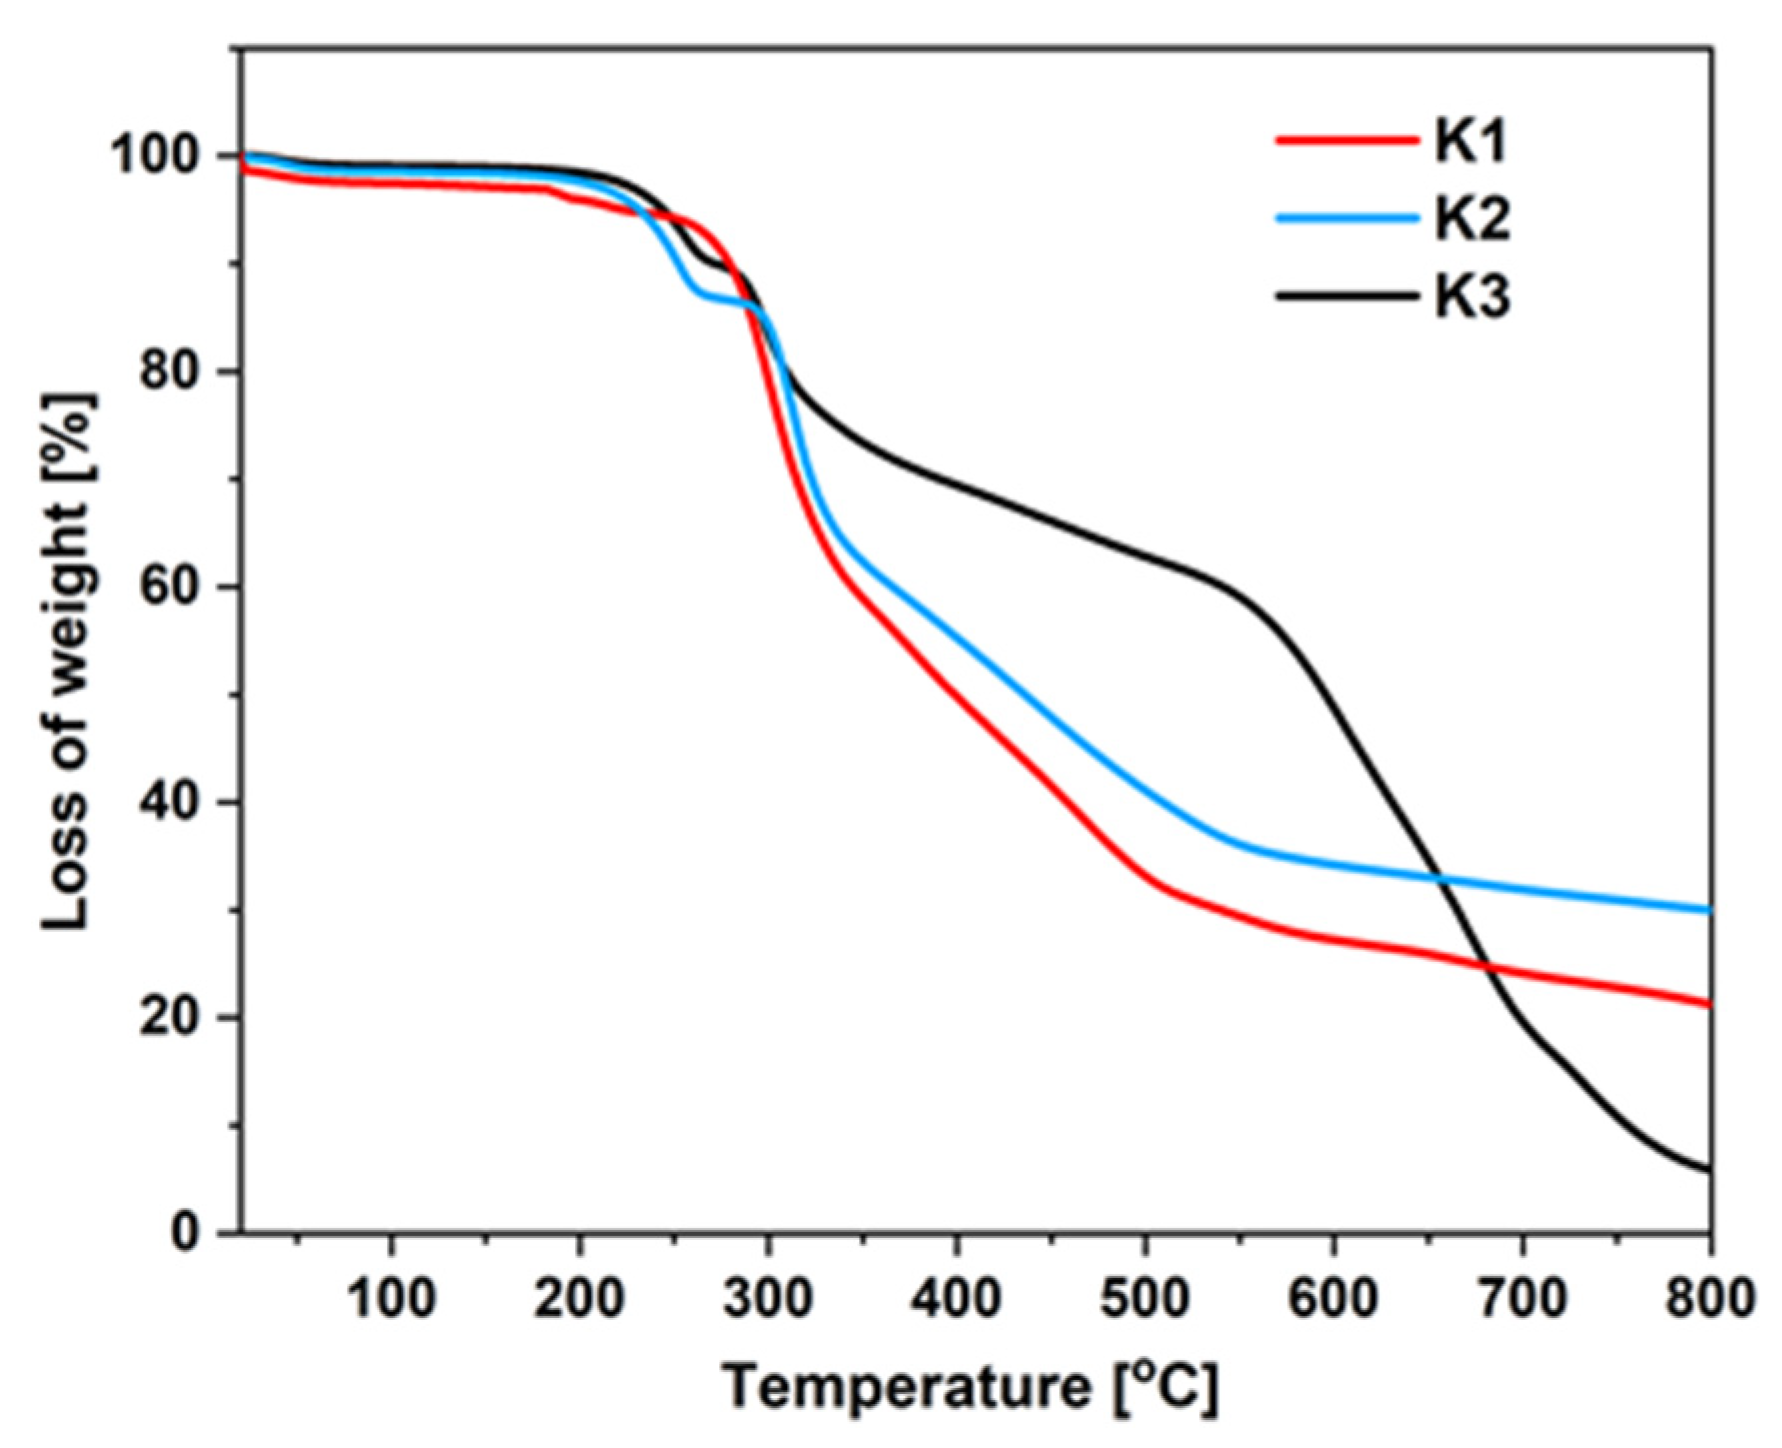
Thermogravimetric analysis (TGA) allowed obtaining of thermal stability results for the presented compounds (K1K3). For all derivatives, the temperature of 5% (T5) and 10% (T10) mass loss as well as the temperature of complete decomposition (Tmax) were determined. The collected data are presented in Table 2 and Figure 2. Referring to the T5 for K1K3, we can see that it is in the range of 222 °C to 244 °C. Such high values indicate the high durability of these compounds. Moreover, the functional group in the substituent has a negligible effect on thermal stability. The best thermal properties are those of K3 compound, containing the 4-nitrophenyl group. In the case of replacing this group with benzonitrile (K2), we observe a slight decrease in T5 (by 13 °C), T10 (by 19 °C), and only one stage of Tmax degradation. On the other hand, compound K1 has the lowest T5 (222 °C). It is most likely due to the aliphatic nature of the substituent. Comparing the discussed derivatives (K1K3) to their analogs described in the literature, we can see a significant similarity in thermal properties, despite different functional groups in the substituents [15].

2.3.2. Photoluminescence Properties

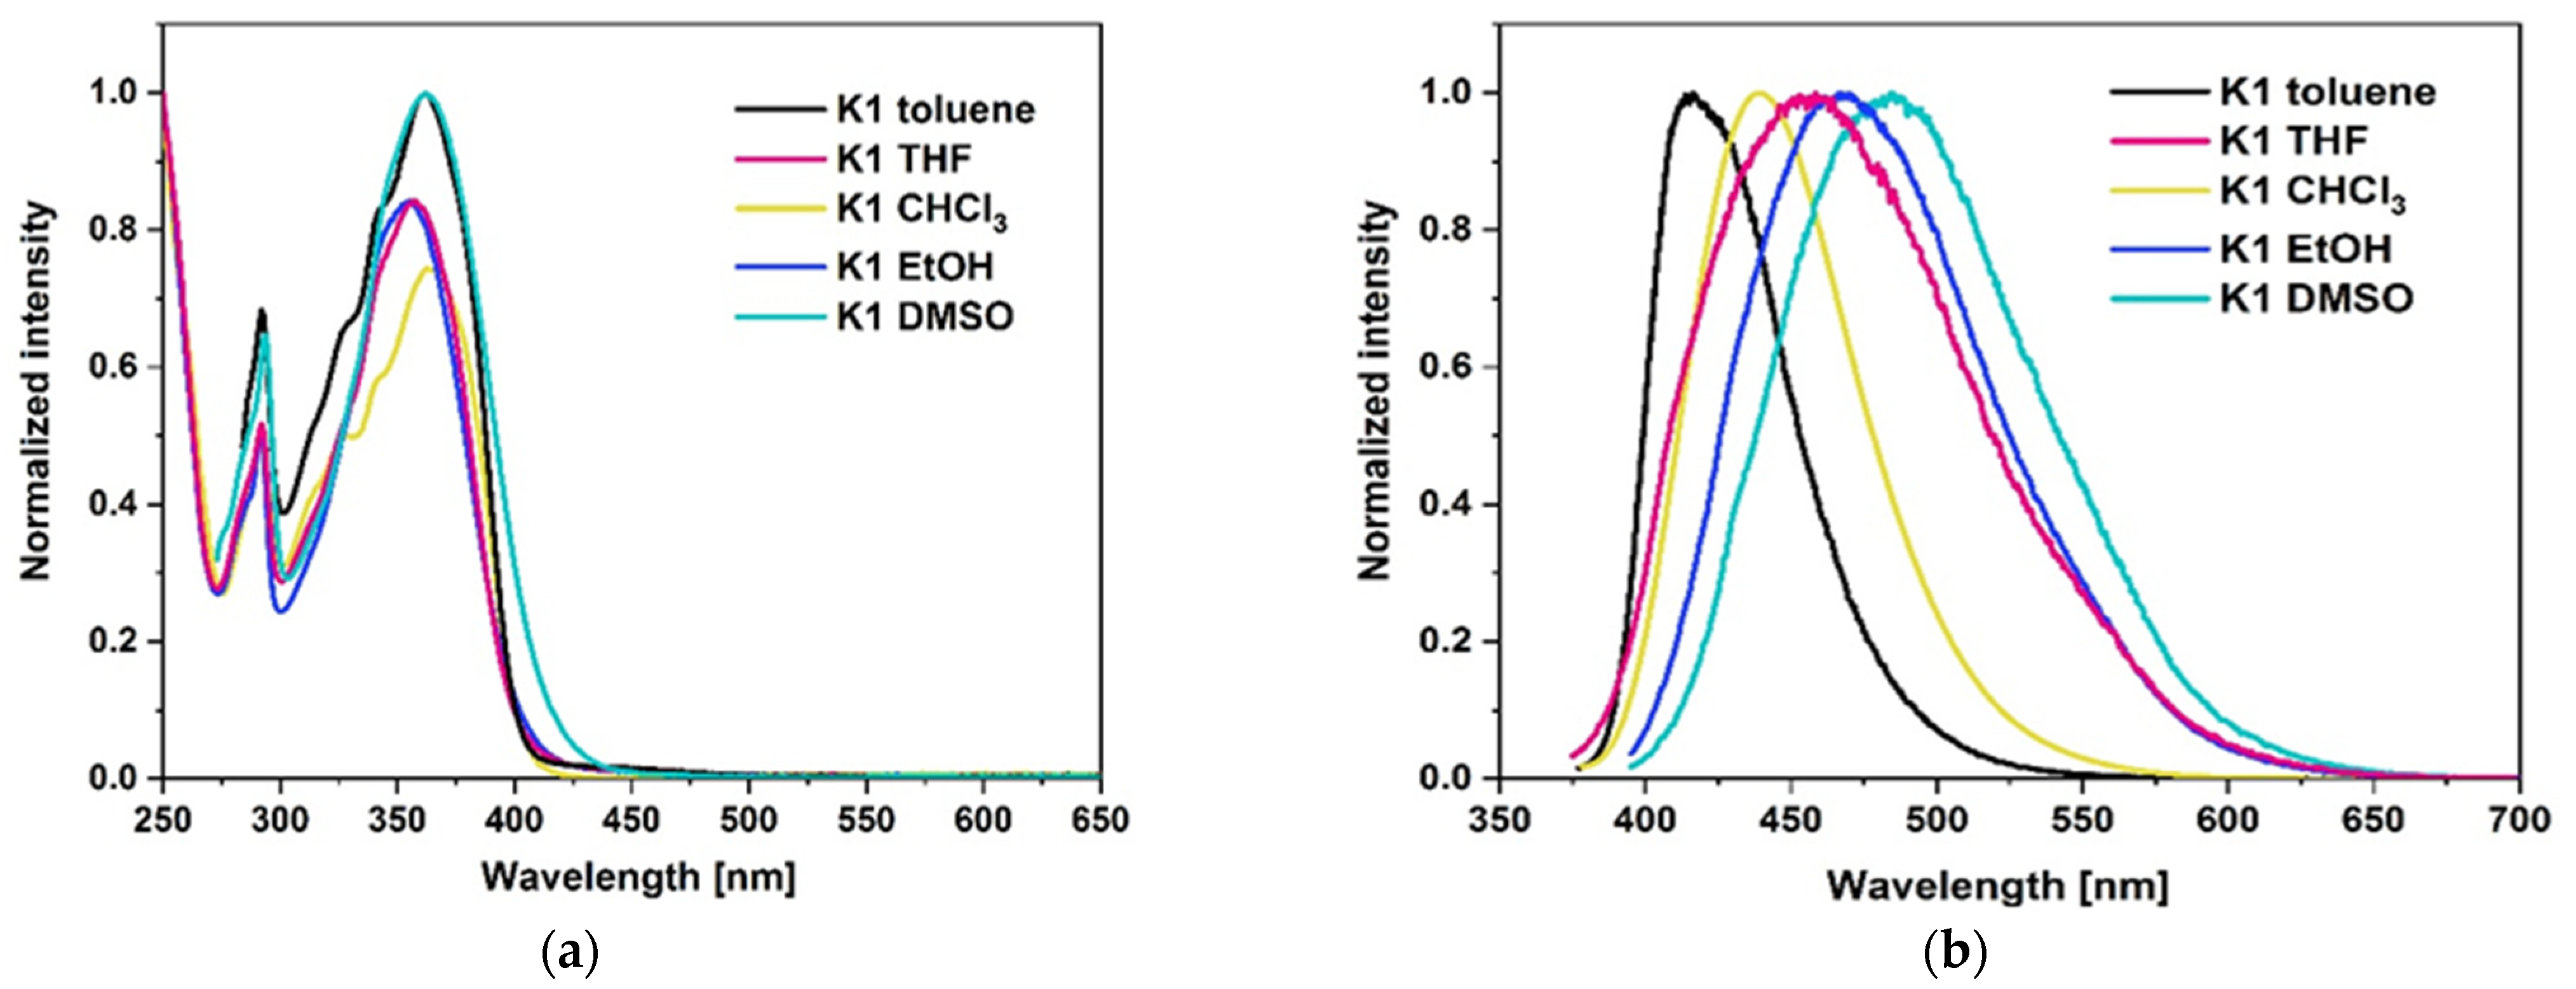
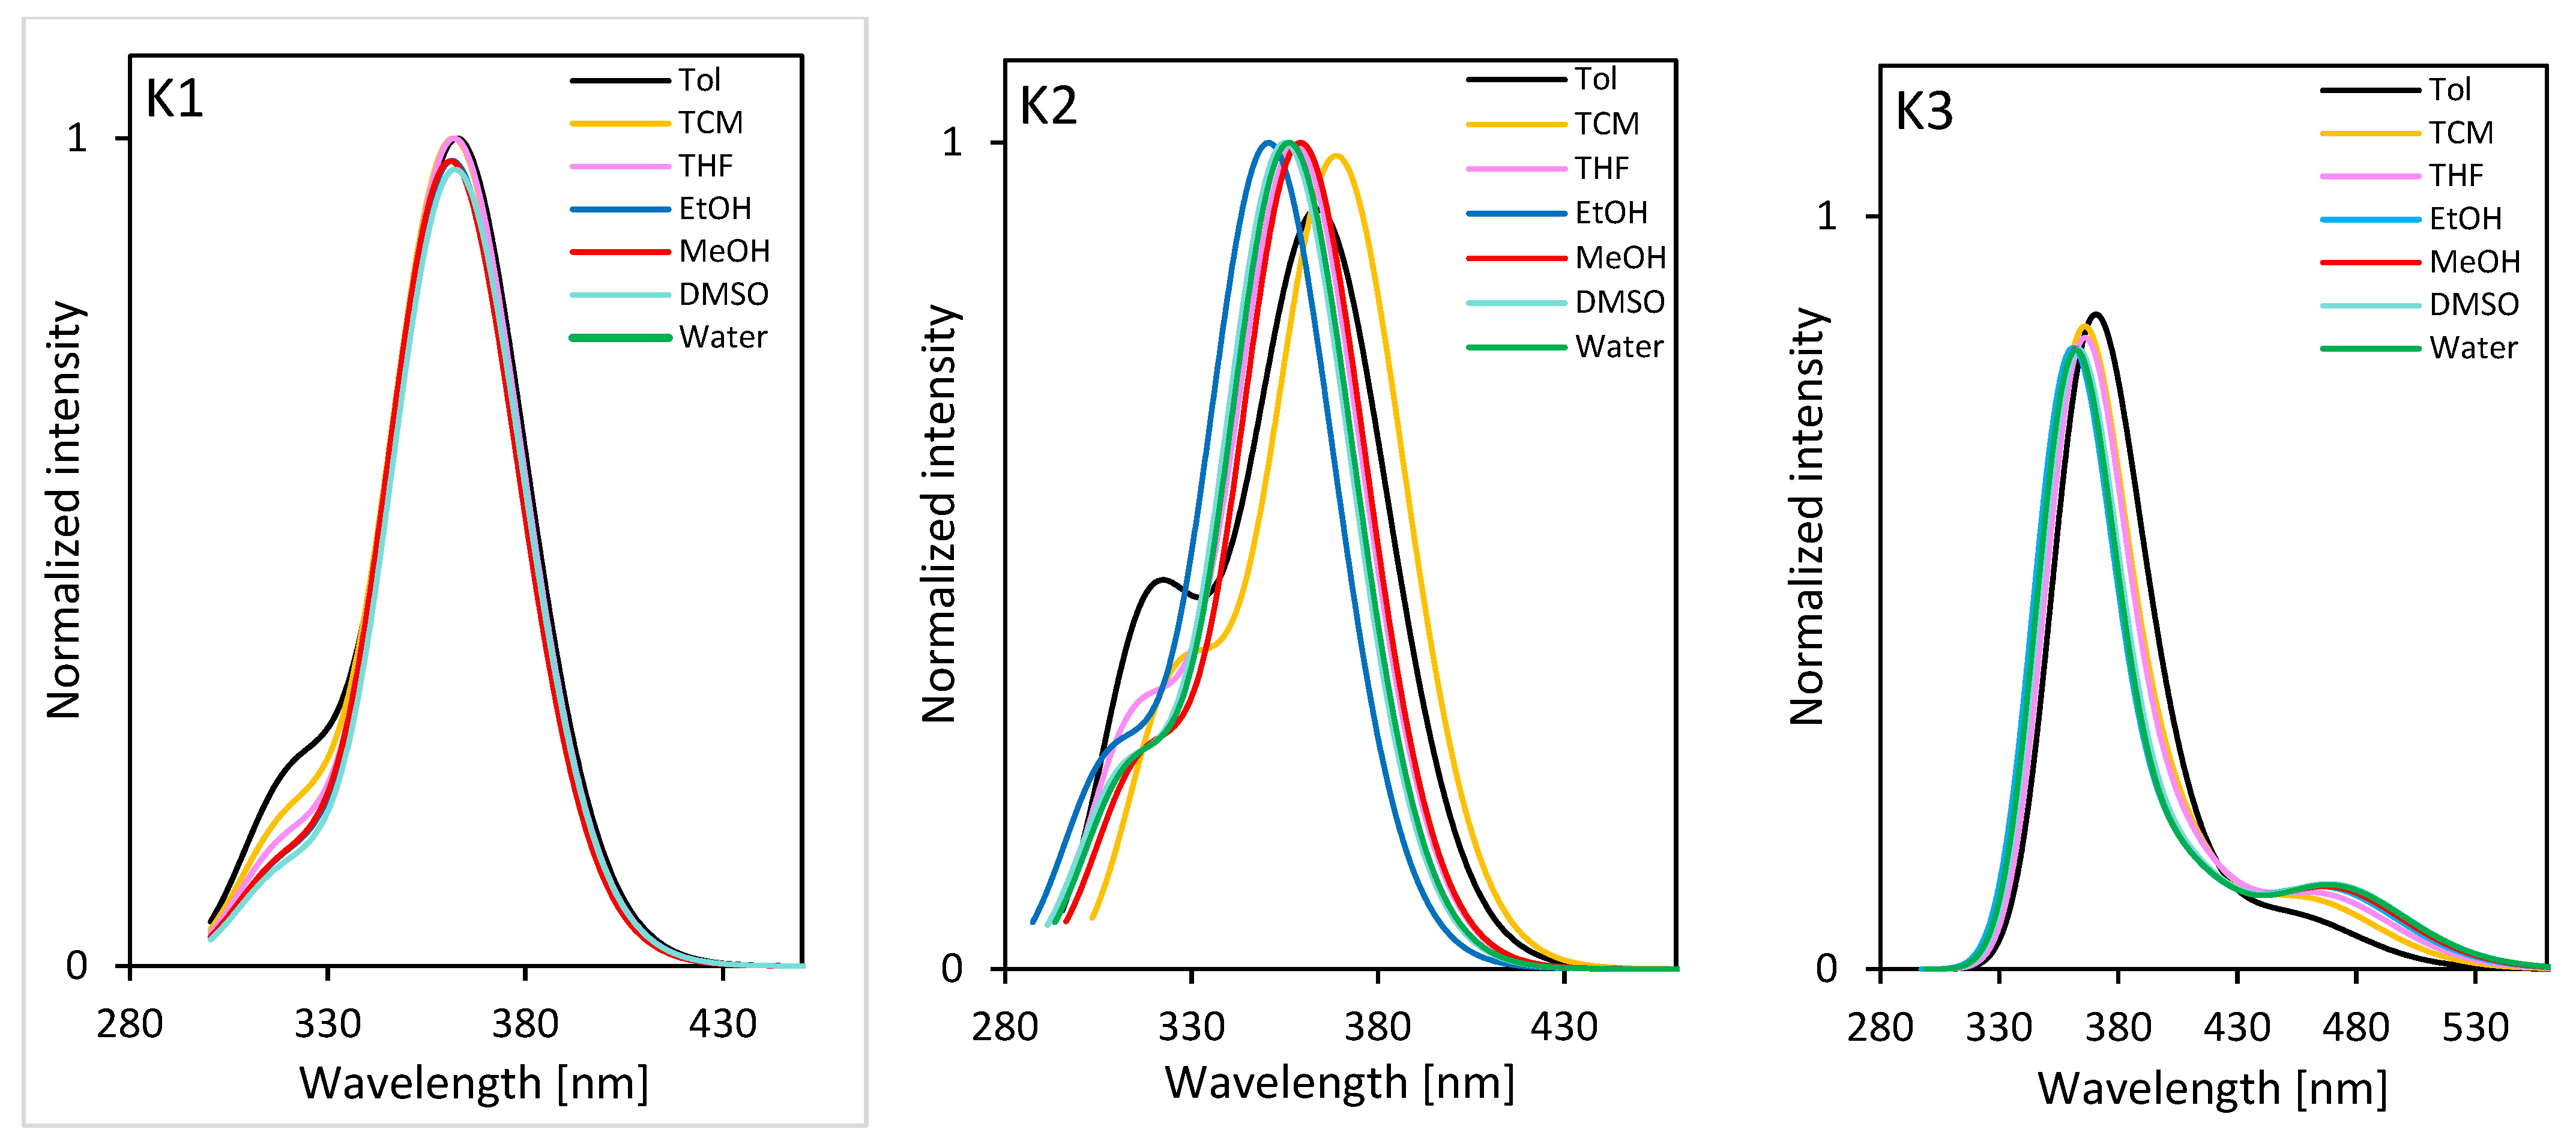
Absorption and emission studies were carried out for investigated compounds K1K3 using solvents of different polarities. The presented molecules differ in the substituent in thiazole ring. To check the influence of the substituent in the discussed molecules, the tests were carried out on solutions with a concentration of 2.5 × 10⁻⁵ mol/L. In the first step, absorption maxima (λabs) were determined. The measured data are shown in Table 3, Figure 3, Figures S1 and S2.
Each of the derivatives has at least two bands registered in the absorption spectra. The main bands between 320 and 370 nm can be attributed to the π→π* transition. The next one is the band above 300 nm. In the case of the presented molecules, the solvatochromic effect associated with the polarity of the solvent is not observed in the absorption spectra. The same behavior is shown by the analogs described in the literature [15,16]. In the next step, the emission maxima were determined. For the K3 molecule, spectra were recorded only in chloroform, ethanol, and DMSO. This compound did not dissolve in non-polar toluene and did not give an emission spectrum in THF. For the rest, λem was successfully determined in several solvents. By analyzing the fluorescence spectra, the influence of the polarity of the solvent on the obtained results can be observed. In compounds K1K3, a red shift was observed with increasing solvent polarity. Moreover, the Stokes shift increases from non-polar to polar solvents (K3 30 nm, K1 69 nm, K2 70 nm). This is a typical effect for compounds with a different charge distribution in the excited state compared to the ground state. This suggests greater stabilization of the excited singlet state in the polar environment. Such behavior shows compounds with CT (charge transfer) character for which excitation causes an increase in the dipole moment [16,17,18]. The presented molecules are very similar to their analogs described in the literature [15,16]. Comparing the results obtained in chloroform, K3 and K1 compounds are the most blue-shifted relative to their structural analogs.

2.3.3. Cyclic Voltammetry Measurements

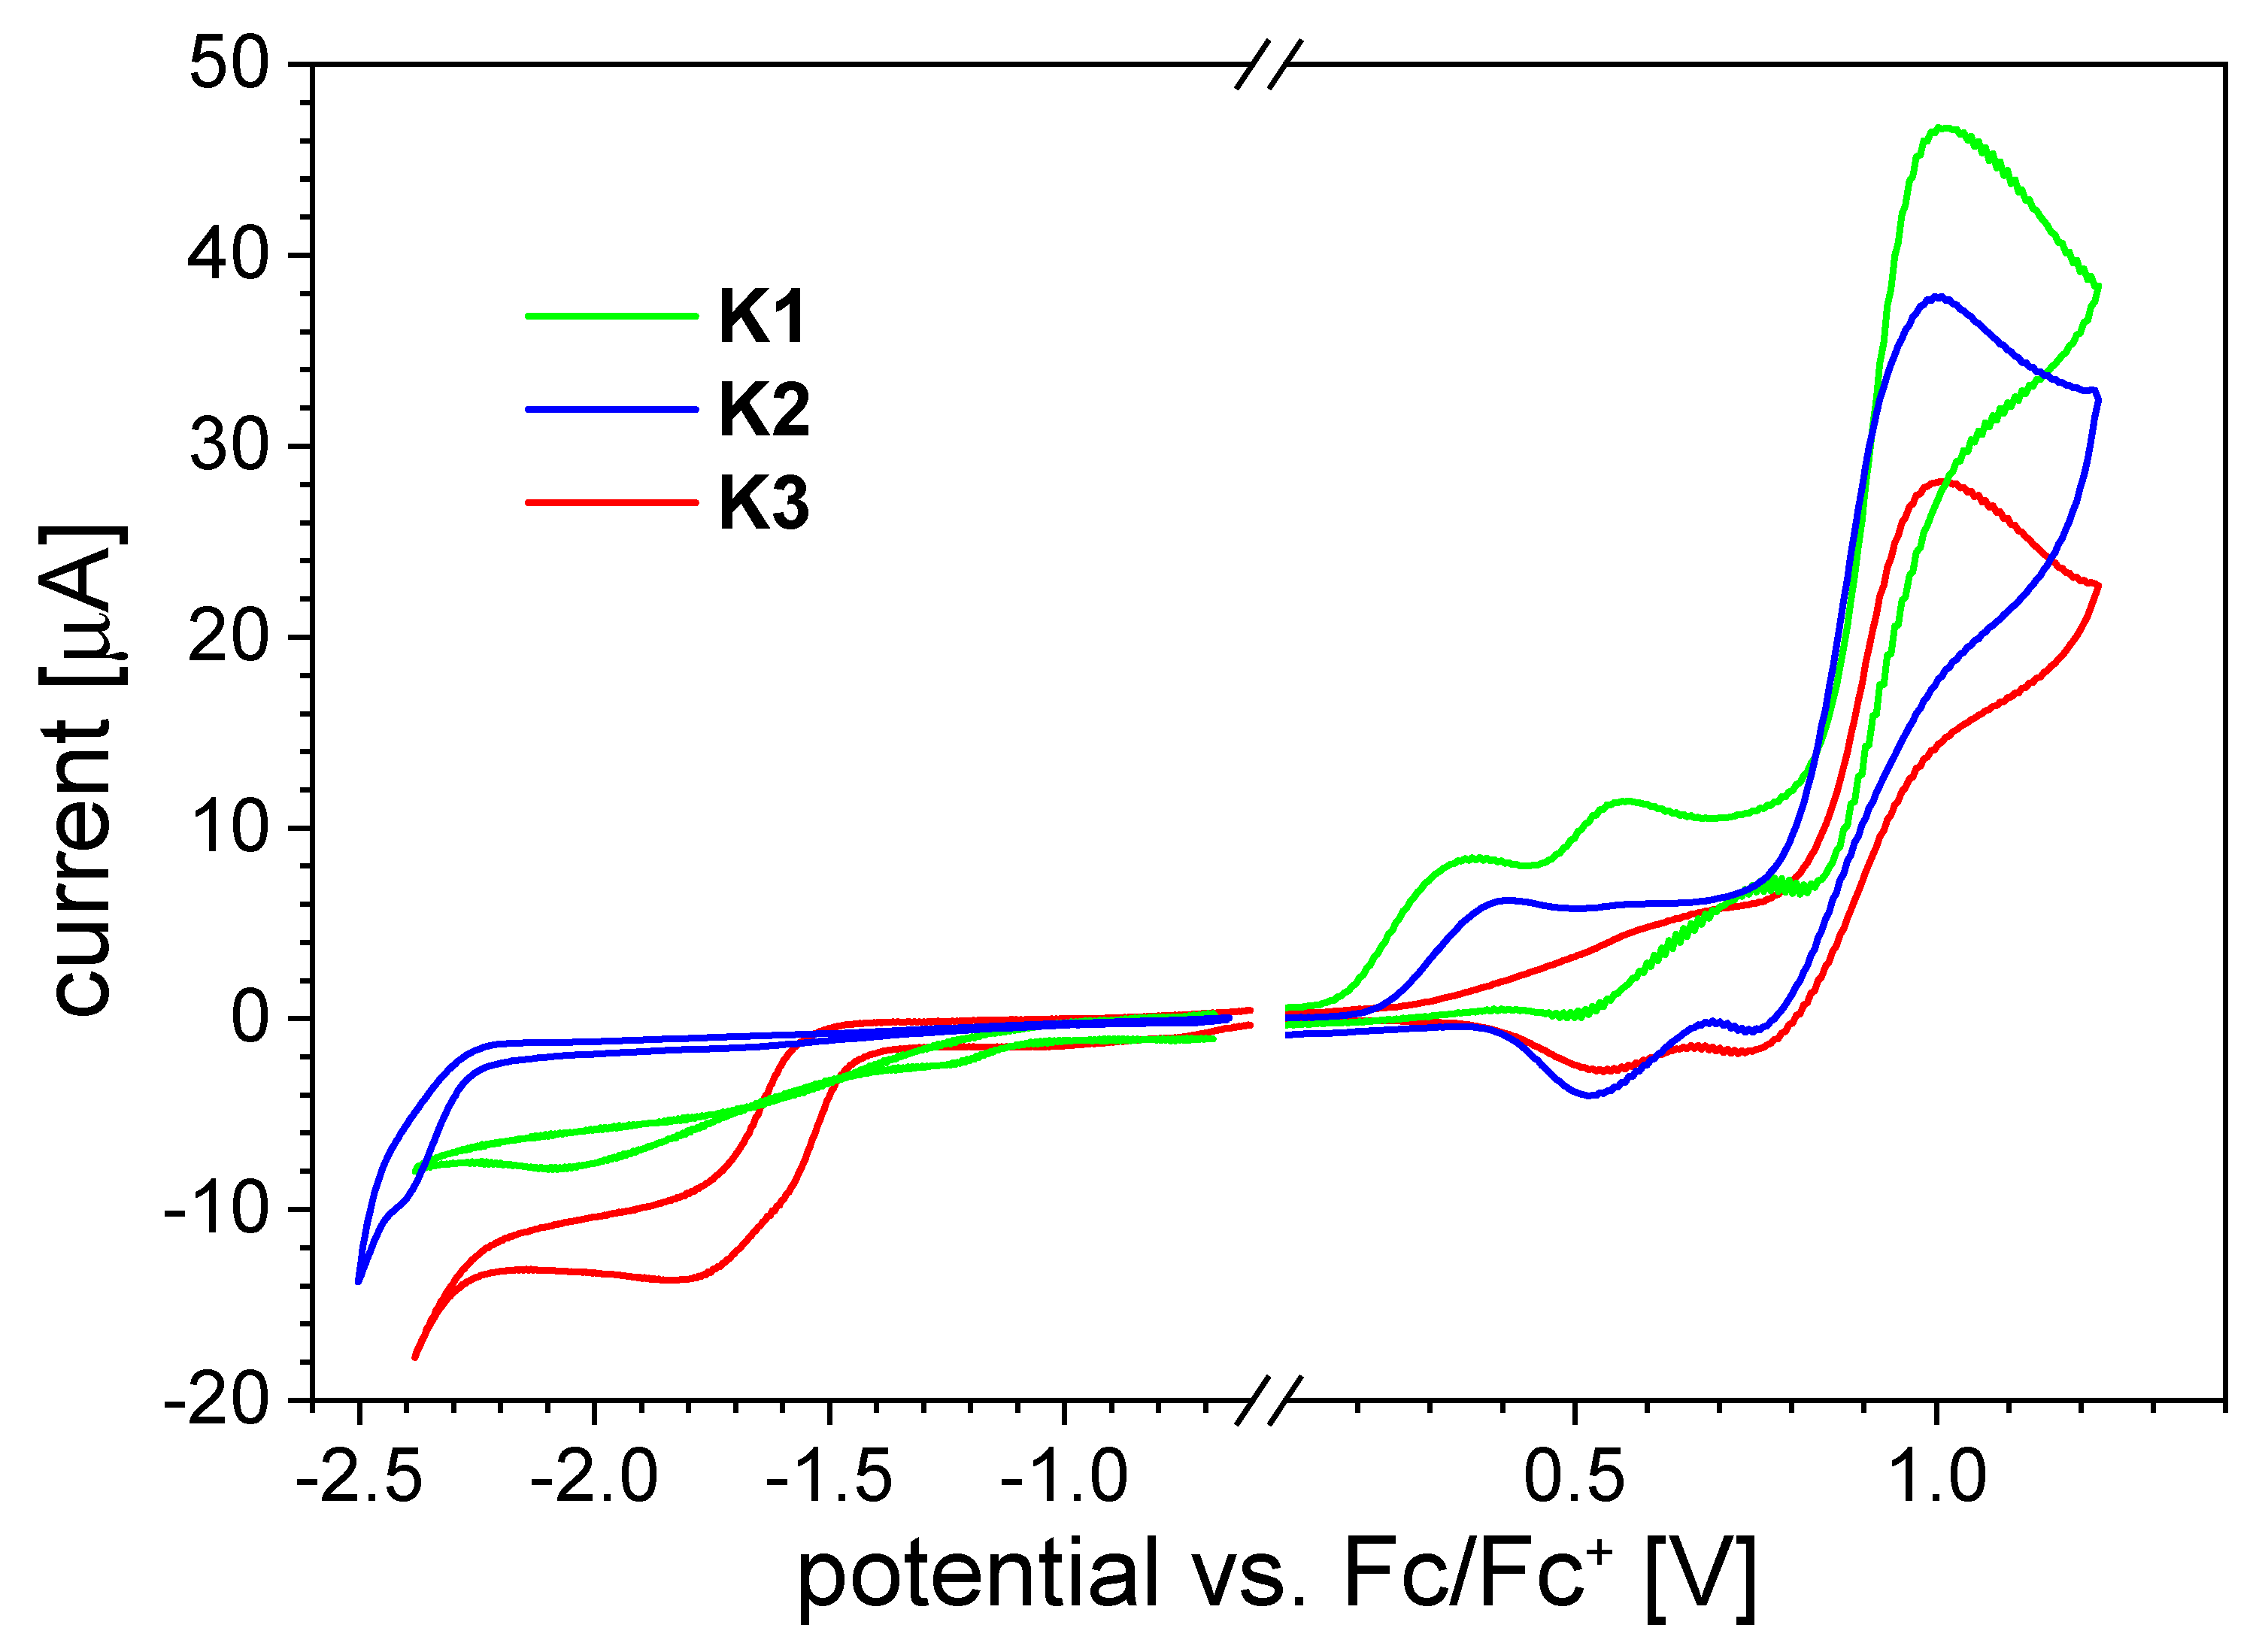
The influence of the chemical structure on electrochemical properties was estimated using cyclic voltammetry characterization. This technique is considered as a basic tool for the characterization of conjugated organic molecules, including the estimation of possible coupling processes that can lead to formation of conjugated polymers [19]. The cyclic voltammetry of the studied compounds is shown in Figure 4. The reduction and oxidation curves exhibit complex behavior, which can be attributed to the intricate structure of the studied compounds. The compounds contain carbazole as the main electroactive unit, with electroactive hydrazine-based side chains linked to carbazole via a nitrogen atom. This structure allows for the oxidation and reduction of both the carbazole and the hydrazine-based group.
The oxidation of all compounds starts at a similar potential. When comparing the oxidation onset potentials of the tested compounds, it can be concluded that the differences are not significant. The onset of oxidation in compound K1 is 0.18 V, for compound K2, it is 0.22 V, and the highest oxidation potential of 0.28 V is observed for compound K3. Additionally, the shape of the observed voltammograms in the anodic range is similar for each of the tested compounds. First, a double wave is observed, indicating a two-stage oxidation. Then, a peak with a higher current at 1 V for all compounds is observed. Its potential is similar to the oxidation potential of the analogous N-phenylcarbazoles [20]. This clearly indicates that this peak is related to the oxidation of the N-substituted carbazole unit, while the earlier oxidation waves are related to the reactions on the hydrazine- and thiazole-based moieties [15]. After changing the direction of the potential sweep, reduction peaks are also observed. They are asymmetric in relation to the oxidation peaks, which indicates the electrochemical irreversible nature of the oxidation process. These waves indicate the coupling of two carbazole units, which is characteristic of this group of chemical compounds [21]. It was decided to confirm this process by registering multiple voltammetric cycles. As shown in Figure 5 the carbazole coupling process of K3 is visible as a rising peak at 0.6–0.75 V potential.
A similar process is also observed for N-phenylcarbazole derivatives [20]. When examining the reduction processes, the complex nature of the voltammetry curves in the cathodic range is also observed. Significant differences in the onset of reduction for the tested compounds are observed. Reduction starts at −1.13 V for K1, −1.48 V for compound K3, and −2.27 V for compound K2. Moving towards lower potentials, successive waves of reduction are observed. This behavior can be attributed to the occurrence of azo-hydrazone tautomerism of the C=N-NH hydrazone group [22,23].

2.4. Computational Evaluation of Molecular Behavior

2.4.1. Molecular and Spectroscopic Characteristics

Natural Bond Orbital (NBO) analysis (Table S1), which quantifies electron distribution in chemical bonds, reveals that the substituent attached at position C38 (Figure S3) critically modulates the stability of the carbazole-based complexes (molecular backbone: (E)-2-(2-(4-(9H-carbazol-9-yl)benzilidene)hydrazinyl)thiazole). The K3 complex exhibits the lowest LUMO energy (−2.89 eV in water, Table S2), while K1 shows the highest (−5.70 eV in toluene), directly correlating with their electronic stabilization trends. Orbital energy analysis demonstrates that K3 substituent, -NO2, provides the strongest stabilization (LUMO energy: −2.89 eV in water), while K1 is the least stable (LUMO: −5.70 eV in toluene). This 2.81 eV difference reflects K3 efficient electron delocalization. Electron occupancy in each complex remains at a similar level, 1.97 eV, but subtle differences may result from the inductive effect of the substituents. The charge on the C38 atom decreases in the order K1 > K3 > K2, which may indicate differences in the electron-donating nature of the substituents. The solvent can influence the stability of the system through electrostatic interactions and solvation effects. Solvent polarity is responsible for stabilization: in water, orbital energy of the K3 decreases by 0.52 eV compared to toluene, reflecting enhanced charge delocalization in polar media. This effect is the weakest for K1 (ΔE = 0.12 eV), indicating its low solvation sensitivity. The charge on the C38 atom tends to decrease in more polar solvents, indicating electron redistribution under solvation influence. Bond polarization changes minimally in highly polar solvents, suggesting a more stable bond character in such environments. For the K1, orbital energy changes the least depending on the solvent, indicating its greater resistance to solvation effects compared to K2 and K3. The substituent in K3 stabilizes the structure the most, which is evident in lower orbital energies, while solvents with higher polarity, such as H2O and DMSO, stabilize the molecules by lowering orbital energy and redistributing the charge on C38. Bond polarization shows slight variations across different solvents, suggesting that the electronic properties of the complexes are relatively stable. The K2 and K3 complexes are more susceptible to solvent influence than K1, indicating greater flexibility of their electronic systems.
The graphical analysis of HOMO and LUMO orbitals for the tested compounds (Figure S4) reveals significant differences in electron density distribution influenced by the substituents. For K1, the HOMO orbital is concentrated on the carbazole part, indicating that the donor electron density is focused in the center of the molecule, while the LUMO is more delocalized, potentially facilitating interactions with electron acceptors. In the case of K2, a shift of the HOMO towards the substituent is observed, suggesting its active role in electron delocalization, while the LUMO is more localized in peripheral regions, which may affect its reactivity. For K3, the LUMO orbital is the most extended, and the HOMO shows a clearly decentralized electron density, suggesting greater electron mobility and increased chemical reactivity compared to K1 and K2. These changes confirm previous energy analysis results, indicating greater stability for K1 and higher reactivity and electronic flexibility for K3.
Based on the analysis of HOMO–LUMO energy levels and related chemical parameters for the K1, K2, and K3 compounds in various solvents (Table S2), a clear influence of both substituents and solvent environment can be observed. K3 displays the lowest LUMO and highest HOMO energies, resulting in the narrowest energy gap (ΔEGAP), which indicates higher reactivity and lower kinetic stability. In contrast, K1 has the widest gap, suggesting greater stability and reduced reactivity. Increasing solvent polarity slightly reduces ΔEGAP, indicating enhanced electron delocalization and stabilization in polar environments. This effect is most notable for K3, where ΔEGAP drops from toluene to water, implying improved conditions for electronic transitions. Chemical hardness (η) and softness (σ) confirm these observations. K1 is the hardest and least reactive, while K3 is the softest and most reactive. K3 also shows the highest electronegativity (χ), chemical potential (μ), and global electrophilicity (ω), making it more prone to electrophilic interactions. K1, with its higher hardness and ΔEGAP, has a lower tendency to participate in these reactions. The influence of solvents is also evident in these parameters, especially for K3, where polar solvents tend to lower orbital energies and enhance electrophilicity. K2 is still characterized by intermediate values, suggesting a balance between reactivity and stability in all solvents. In summary, K3 is the most reactive due to its narrow energy gap and high electrophilicity, while K1 is the most stable and least sensitive to solvent effects. Therefore, polar environments significantly increase stabilization and can enhance the electronic properties of the studied molecules used in chemical or optoelectronic systems.
Based on the Molecular Electrostatic Potential (MEP) surfaces (Figure S5) for the K1, areas with the most negative potential, indicating increased electron density, are primarily concentrated around the carbazole part, confirming previous conclusions about its stability and lower reactivity. K2 exhibits a more varied distribution of electrostatic charge, with a greater influence of substituents in modulating electronic properties, which aligns with the observed greater delocalization of the HOMO in this molecule. K3 is characterized by the broadest spread of regions with high electron density, consistent with previous findings regarding its greater electronic flexibility and susceptibility to electrophilic reactions. Therefore, the higher stability of K1 and the increased chemical reactivity and greater electron delocalization of K3 are confirmed.
The changes in electron density upon photoexcitation (Δρ (r)) are graphically shown in Figure S6. In the case of K1, regions of electron density depletion (blue) are concentrated around the carbazole part, while the zones of electron density increase (purple) are distributed mainly over the π–electron bridge, completely omitting the adamantate substituent. This indicates limited charge mobility within the molecule and aligns with its previously described stability. In K2, a more pronounced asymmetry between the depletion and accumulation regions is observed, pointing to greater charge polarization and more dynamic electron redistribution influenced by the substituents. K3 exhibits the broadest distribution of electron depletion and accumulation zones, suggesting increased charge mobility and a greater tendency for electron transfer. The analysis of the amount of transferred charge (qCT) and charge transfer distance (DCT, Table S3) confirms these observations and reveals the influence of both substituents and solvents. qCT values increase in the order K1 < K2 < K3, indicating a progressive rise in the amount of transferred charge, which is in accordance with the decreasing power of deactivating substituents. K1 shows the lowest qCT values, suggesting greater electronic stability and less tendency toward charge transfer, while K3 exhibits the highest values, reflecting more dynamic electronic behavior and enhanced donor–acceptor interactions. Similarly, DCT values follow the same trend, with K3 displaying the longest transfer distances, supporting its more delocalized electronic nature. The solvent effect is particularly evident in DCT values. For K1, DCT decreases with increasing solvent polarity, implying a more compact charge distribution and limited electron reorganization in polar environments. In contrast, for K2 and K3, increasing polarity results in greater DCT values, which reflects increased electronic flexibility and facilitated charge displacement. For K3, the differences are less pronounced, suggesting that this molecule is already inherently more delocalized and less sensitive to environmental changes compared to K1 and K2.
The analysis of free energy of solvation (ΔGsolv, Table S4) for the tested compounds indicates a clear influence of both molecular structure and solvent type on the stabilization of these systems in solution. For all three molecules, the most negative ΔGsolv values are observed in toluene and chloroform, indicating better stabilization in non-polar and moderately polar organic environments. As the polarity of the solvent increases, the solvation energy becomes less negative, reflecting weaker stabilization of the compounds. K1 shows the greatest variation in solvation energy depending on the solvent, from −27.45 kcal/mol in TCM to −10.88 kcal/mol in H2O. This suggests that the structure of this compound is most sensitive to changes in the surrounding environment. K2 exhibits the lowest solvation energy in TCM (−29.67 kcal/mol), indicating a particularly favorable interaction with this solvent. In contrast, K3 generally displays less negative ΔGsolv compared to K1 and K2, suggesting that it is the least stabilized by solvation and has greater freedom in charge redistribution within the molecule.
The calculated vertical absorption maxima (λabs, Table S5) for the K1, K2, and K3 molecules show good agreement with experimental values. In particular, very comparable results were obtained for K1, with an average deviation of only 2.2 nm. For K3, the error is moderate (4.8 nm), while the largest discrepancies are observed for K2 (6.6 nm). Compared to cLR approximation, vertical values yields consistently lower mean errors across all three derivatives, with the exception of K3, where both approaches perform similarly. However, vertical values shows greater consistency overall and more accurately reproduces spectral trends, confirming its reliability for describing the optical properties of the studied molecules. The absorption maxima also indicate the presence of solvatochromism. K1 and K3 exhibit positive solvatochromism, with absorption maxima shifting to longer wavelengths as solvent polarity increases; for K1: from 357 nm in THF to 362 nm in DMSO; for K3: from 356 nm in EtOH to 362 nm in DMSO. In contrast, K2 shows negative solvatochromism, with a clear hypsochromic shift in more polar solvents, from 367 nm in TCM to 342 nm in EtOH. These shifts correlate well with the calculated dipole moments of the ground (μGS) and excited (μCT) states (Table S6). K3 shows the largest increase in dipole moment, ranging from 7.66 D in toluene to 9.16 D in water for the ground state and from 35.21 D to 37.02 D for the excited state, depending on the solvent. This is followed by K2, whose dipole moment ranges from 6.38 D to 7.42 D in the ground state and from 17.94 D to 18.92 D in the excited state. The smallest values are observed for K1, with dipole moments ranging from 4.14 D to 4.26 D in the ground state and from 8.26 D to 8.34 D in the excited state. An increase in the polarity of the excited state (〖Δμ〗_(CT-GS)) reflects a redistribution of charge upon excitation, which is characteristic of charge transfer (CT) transitions. The greater the difference in these values, the stronger the CT character, and the higher the sensitivity of the system to solvent polarity. In the case of K1 and K3, which exhibit positive solvatochromism, the high dipole moments in the excited state indicate that this state is more stabilized by polar solvents. On the other hand, for K2, where a blue shift is observed, the smaller dipole moment difference suggests that the ground state is more stabilized in polar environments. Thus, the dipole moment values reflect the direction of the absorption band shift and confirm that for K3, the largest increase in dipole moment corresponds to the most pronounced polarity-dependent spectral shift. This confirms the strong charge transfer (CT) character of the excited state for K3, in agreement with the density difference maps and the highest qCT and DCT values, indicating substantial electronic redistribution upon excitation.
Comparison of the graphically presented absorption spectra obtained experimentally and theoretically (Figure 6) reveals a good match in the position of the main absorption bands across all three derivatives. Theoretical spectra also predict additional low-intensity absorption bands, particularly in the 310–340 nm region. These bands likely originate from n→π* or π→π* transitions localized on substituents. Their presence is supported by the significant changes in dipole moments and the polarized nature of the CT transitions. This is especially true for K3, where the 〖Δμ〗_(CT-GS) exceeds 30 D, suggesting that these weak transitions may meaningfully contribute to the overall spectral shape.
The theoretical emission maxima (λem, Table S7) also correlate well with experimental data. K1 and K3 show small differences, while for K2, the calculated maxima are slightly higher than measured. Increasing solvent polarity results in a red shift of λem, consistent with the behavior of CT excited states. K1 emits in the 416–490 nm range, K2 in 432–471 nm, and K3 in 444–477 nm. Theoretical values predict slightly larger shifts but follow the same directional trend. Stokes shifts values are largest for K1 (up to 7300 cm−1 in water) and K3 (~6600 cm−1), indicating substantial structural relaxation in the excited state. These large shifts reflect strong excited-state stabilization and are consistent with the significant dipole moment increases and CT characteristics observed in these systems.
The molecule K3 exhibits the highest first hyperpolarizability values (β, Table S8) among all the studied systems, ranging from 3503.14 a.u. in toluene to 8796.30 a.u. in water, significantly exceeding those of K1 (from 890.71 to 1877.40 a.u.) and K2 (from 1000.44 to 2974.45 a.u.). These differences are consistent across all solvents, and as solvent polarity increases, a pronounced enhancement in β is observed, particularly for K3, where the increase exceeds 5200 a.u. Similarly, K3 also shows the highest isotropic polarizability (α), with values ranging from 282.60 a.u. in toluene to 307.91 a.u. in water, confirming its superior electronic responsiveness. The polarizability values for K1 (239.77–248.69 a.u.) and K2 (254.28–264.20 a.u.) remain lower throughout, reflecting more rigid and less polarizable electron distributions.
Carbazole K3 exhibits the most pronounced nonlinear optical response among the studied compounds, attributed to its high electronic flexibility, strong solvatochromism, large excited-state dipole moments, and efficient intramolecular charge transfer, as confirmed by density difference maps and qCT/DCT values. Its batochromic-shifted spectra, large Stokes shifts, and polarized electron distribution further support CT character. In contrast, K1 and K2 show lower polarizability, smaller dipole changes, and limited NLO potential. Considering both β values and spectroscopic consistency, K3 emerges as the most promising candidate for applications such as SHG, nonlinear imaging probes, and bioimaging.

2.4.2. Delivery of Compounds

Fluorescent probe-based imaging techniques of biological systems are currently recognized as one of the most powerful methods used in medicinal chemistry. Proteins occupy a special place due to their natural biocompatibility, increased solubility, and bioavailability of fluorescent probes [24]. Concanavalin A (ConA) belongs to the lectin family proteins designated by specificity for strong binding polysaccharides containing α-glucose, mannose, glucosamine, and α-N-acetylglucosamine. These glycans are present on the surface of all types of cells and play roles in the immune system and cellular signaling. ConA, originally extracted from the jack-bean (Canavalia ensiformis), is a homotetramer at neutral pH [25]. Recently it was reported that the ConA complex with Rose Bengal photosensitizer has been successfully used in targeted photodynamic therapy against Gram-negative bacteria [26]. For this reason, we decided to investigate the possibility of creating supramolecular complexes of ConA and Human serum albumin (HAS) with compounds K1K3 in order to direct the photoactive compound to saccharides on the cell wall to increase their potency.
It was found that all investigated carbazole derivatives demonstrate the ability to form stable supramolecular complexes with model proteins, including ConA and HSA, involving lysine residues (LYS) as binding centers. In the interaction of the studied carbazole derivatives with ConA (Table S9), molecular docking analysis reveals differences in both the binding site location and the binding free energy values. K1 binds within the region centered around LYS116, while for K2 and K3, the binding occurs at LYS46. The most favorable binding free energy (ΔGb) is observed for K1 and amounts to −6.30 kcal/mol, indicating the highest affinity toward ConA. For K2 and K3, the ΔGb values are slightly higher, at −5.40 kcal/mol and −5.30 kcal/mol, respectively. This suggests slightly weaker, but still beneficial, interactions with the active site. The change in binding site from LYS116 (for K1) to LYS46 (for K2 and K3) may result from steric and electronic differences caused by the substituents at the C38 position. In each case, the molecule is not stabilized by hydrogen bonds or π–π* interactions, indicating that the main forces responsible for binding to the macromolecule are electrostatic interactions and geometric complementarity of the probe to the aromatic cavity of the protein. In the case of HSA (Table S10), all three compounds bind to the same active site (LYS444), with K1 again exhibiting the strongest binding (ΔGb = −10.3 kcal/mol), and K2 and K3 showing comparable values (−9.0 kcal/mol each). In all cases, conjugation occurs without additional stabilizing interactions such as hydrogen bonding or π–π* stacking.

3. Materials and Methods

All details regarding UV-Vis absorption measurements [27], and the computational procedure [28,29,30,31,32,33,34,35,36,37,38,39,40,41,42,43,44,45,46,47,48,49,50,51,52], have been placed in the Supplementary Materials.

3.1. Measurement

All experiments were carried out under air atmosphere unless stated otherwise. Reagents were generally the best quality commercial-grade products and were used without further purification 1H NMR (400 MHz) and 13C NMR (100 MHz) spectra were recorded on a Bruker Avance III (Billerica, MA, USA) multinuclear instrument. High-resolution mass spectrometry measurements were performed using Synapt G2-Si mass spectrometer (Waters, Milford, MA, USA) equipped with quadrupole Time-of-flight mass analyzer. The mass spectrometer was operated in the positive ion detection mode. The results of the measurements were processed using the MassLynx 4.1 software (Waters, Milford, MA, USA) incorporated with the instrument. Melting points were determined in open glass capillaries and are uncorrected. Analytical TLC was performed using Macherey-Nagel (Düren, Germany) Polygram Sil G/UV254 0.2 mm plates.

General Experimental Procedure for Synthesis of Carbazole K1K3

The synthesis of the new compounds K1K3 was carried out according to the procedure described previously [15].
(E)-2-(2-(4-(9H-carbazol-9-yl)benzylidene)hydrazinyl)-4-(1-adamantyl)thiazole (K1). Yield: 0.45 g, 90%, (dichloromethane/methanol (95:5), Rf = 0.86); mp 198–204 °C. 1H NMR (700 MHz, DMSO-d6), δ (ppm): 1.67–1.78 (m, 6H, 3CH2); 1.86–1.93 (m, 6H, 3CH2); 2.01–2.06 (m, 3H, 3CH); 6,46 (s, 1H, 1CH); 7.29–7.33 (m, 2H, 2CH); 7.44–7.48 (m, 4H, 4CH); 7.71 (d, 2H, 2CH, J = 8.4 Hz); 7.95 (d, 2H, 2CH, J = 8.4 Hz); 8.22 (s, 1H, CH); 8.26 (d, 2H, 2 CH, J = 7.7 Hz); 12,34 (bs, 1H, NH). 13C NMR (176 MHz, DMSO-d6), δ (ppm): 28.34 (3C); 36.37 (3C); 36.75 (3C); 41.69 (C); 100.60 (C); 110.22 (2C); 120.75 (2C); 121.05 (2C); 123.38 (2C); 126.81 (2C); 127.34 (2C); 128.38 (2C); 133.87 (C); 137.99 (C); 140.35 (2C); 162.45 (C); 168.45 (C). ESI-HRMS (m/z) calculated for C32H31N4S: 503.2269 [M+H]+. Found: 503.2273 [M+H]+.
(E)-4-(2-(2-(4-(9H-carbazol-9-yl)benzylidene)hydrazinyl)thiazol-4-yl)benzonitrile (K2). Yield: 0.46 g, 97%, (dichloromethane/methanol (95:5), Rf = 0.79); mp 240–242 °C. 1H NMR (700 MHz, DMSO-d6), δ (ppm): 7.30–7.34 (m, 2H, 2CH); 7.42–7.49 (m, 4H, 4CH); 7.69 (s, 1H, 1CH); 7.71 (d, 2H, 2CH, J = 8.4 Hz); 7.89 (d, 2H, 2CH, J = 8.4 Hz); 7.96 (d, 2H, 2CH, J = 8.4 Hz); 8.06 (d, 2H, 2CH, J = 8.4 Hz); 8.21 (s, 1H, 1CH); 8.27 (d, 2H, 2CH, J = 7.7 Hz); 12.41 (bs, 1H, NH). 13C NMR (176 MHz, DMSO-d6), δ (ppm): 108.22 (C); 110.12 (C); 110.23 (C); 119.46 (C); 120.76 (2C); 121.06 (2C); 123.38 (2C); 126.63 (2C); 126.82 (2C); 127.39 (2C); 128.43 (2C); 130.20 (2C); 133.88 (C); 138.01 (C); 139.25 (C); 140.40 (2C); 141.30 (C); 149.39 (C); 168.98 (C). ESI-HRMS (m/z) calculated for C29H20N5S: 470.1439 [M+H]+. Found: 470.1433 [M+H]+.
(E)-2-(2-(4-(9H-carbazol-9-yl)benzylidene)hydrazinyl)-4-(4-nitrophenyl)thiazole (K3). Yield: 0.44 g, 90%, (dichloromethane/methanol (95:5), Rf = 0.73); mp 239–242 °C. 1H NMR (700 MHz, DMSO-d6), δ (ppm): 7.28–7.33 (m, 2H, 2CH); 7.43–7.49 (m, 4H, 4 CH); 7.71 (d, 2H, 2CH, J = 8.8 Hz); 7.75 (s, 1H, 1CH); 7.96 (d, 2H, 2CH, J = 8.8 Hz); 8.11 (d, 2H, 2CH, J = 8.8 Hz); 8.19 (s, 1H, 1CH); 8.25 (d, 2H, 2CH, J = 7.6 Hz); 8.27 (d, 2H, 2 CH, J = 8.6 Hz); 12.42 (bs, 1H, NH). 13C NMR (176 MHz, DMSO-d6), δ (ppm): 109.25 (C); 110.22 (2C); 120.05 (2C); 123.37 (2C); 124.59 (2C); 126.83 (2C); 127.35 (2C); 128.42 (2C); 133.81 (C); 138.02 (C); 140.35 (2C); 141.10 (C); 141.39 (C); 146.71 (C); 149.05 (C); 169.09 (C). ESI-HRMS (m/z) calculated for C28H20N5O2S: 490.1338 [M+H]+. Found: 490.1338 [M+H]+.

3.2. Mushroom Tyrosinase Inhibition Assay

The mushroom tyrosinase (Sigma-Aldrich, St. Louis, MO, USA) inhibition was performed following previously reported methods [53,54]. All the assays were carried out with solutions containing phosphate buffer (50 mM, pH 6.8), L-DOPA (0.17 mM), EDTA (0.022 mM), tyrosinase (50–100 units), and varying concentrations of tested carbazole, which were performed in triplicate at room temperature. The inhibitor solutions were prepared in DMSO with an initial concentration of 1 mM. Different aliquots were added to the solution containing buffers L-DOPA and EDTA, with the enzyme being added at the end. Formation of dopachromone was determined by monitoring the absorbance at 475 nm with a T60U spectrophotometer (PG Instruments, Leicestershire, UK) equipped with quartz cells of 1 cm path length. Kojic acid and ascorbic acid were used as reference inhibitors with an initial concentration of 1 mM. The IC50 values were calculated from the equation generated by exponential fit of the experimental data. The effectiveness of inhibition was expressed for the investigated compounds as the percentage of concentration necessary to achieve 50% inhibition (IC50), calculated using the following equation:
% of Inhibition = {[(B30 − B0) − (A30 − A0)]/(B30 − B0)} × 100
where B0 = absorbance of L-DOPA + tyrosinase at t = 0 min, B30 = absorbance of L-DOPA + tyrosinase at t = 30 min, A0 = absorbance of L-DOPA + tyrosinase + inhibitor at t = 0 min, and A30 = absorbance of L-DOPA + tyrosinase + inhibitor at t = 30 min.

3.3. Kinetic Analysis of the Inhibition of Tyrosinase

A series of experiments were performed to determine the inhibition kinetics of tested carbazoles by following the already reported method [9,55]. The inhibitor concentrations for tested carbazoles were 0.05 and 0.1 mM. Substrate L-DOPA concentration was between 0.1 and 0.25 mM in all kinetic studies. Maximal initial velocity was determined from the initial linear portion of absorbance up to ten minutes after addition of enzyme. The inhibition type of the enzyme, Michaelis constant (Km) and maximal velicity (Vmax), were determined by Lineweaver–Burk plots of inverse of velocities (1/V) versus inverse of substrate concentration 1/[L-DOPA] mM−1.

3.4. Thermogravimetric Analysis

Thermogravimetric analysis was performed on Perkin Elmer Thermogravimetric Analyzer Pyris 1 TGA at a heating rate of 15 °C/min under nitrogen. The electronic spectra were measured on a ThermoScientific Evolution 220 UV/Vis spectrometer. Photoluminescence emission spectra were acquired using Hitachi Fluorescence Spectrophotometer F-7100 [19].

3.5. Cyclic Voltammetry Analysis

Cyclic voltammetry measurements were carried out using a classic three-electrode system. A Pt wire was used as the working electrode, a Pt spiral was used as the counter electrode, and a leakless Ag/AgCl electrode (eDAQ) was used as the reference electrode. The potential was calibrated using ferrocene. Tetrabutylammonium tetrafluoroborate Bu4NBF4 (TCI) in CH2Cl2 (99.8% Sigma Aldrich, HPLC grade) with a concentration of 0.1 mol∙dm−3 was used as the supporting electrolyte. Solutions with K1, K2, and K3 concentrations of 1 mmol∙dm−3 were purged with argon before measurements. The measurements were carried out with a scan rate of 50 mV∙s−1 using Autolab PGSTAT 100N (Metrohm Autolab B.V., Utrecht, The Netherlands) [20].

4. Conclusions

The three carbazole–thiazoles were synthesized and their ability to inhibit tyrosinase and the mechanism of its inhibition were studied. The physicochemical investigations were performed and supported with the DFT calculations. Finally, the prototype Concanavalin A-carbazole supramolecular complexes were investigated using molecular docking. Based on our research, it can be concluded that the investigated compounds K1 and K3 demonstrated a higher ability to inhibit tyrosinase than kojic acid. Results of our theoretical predictions of ability of compounds K1K3 to form stable supramolecular complexes with model proteins, including ConA and has, further enhances their potential applicability in bioimaging. The results of our theoretical predictions of the ability of compounds K1K3 to form stable supramolecular complexes with model proteins, including ConA and HSA, allow us to hypothesize that such a supramolecular complexes, upon entering the cell, will be able to release appropriate dyes due to ConA specificity for strong binding to polysaccharides containing α-glucose, mannose, glucosamine, and α-N-acetylglucosamine. Upon entering in the cell, the investigated compounds, particularly compound K3 due to its strong sensitivity to environmental polarity, efficient charge transfer, and notable fluorescence properties, can be used as a promising candidate for fluorescence-based imaging. Additionally, it will also have higher possibility to inhibit tyrosinase. However, further in vivo and cellular validation studies are needed. Therefore, the search for new carbazoles with more favorable chemical properties and greater biological activity is the subject of ongoing research in the fields of medicinal chemistry and materials engineering.

Supplementary Materials

The supporting information can be downloaded at: https://www.mdpi.com/article/10.3390/ijms26167945/s1.

Author Contributions

Conceptualization, K.Z.Ł. and P.K.; Formal analysis, B.D., K.Z.Ł., A.B.-Ł., and P.K.; Investigation, P.L., S.K., J.C., and K.Z.Ł.; Synthesis, K.S., B.D., K.P., and K.Z.Ł.; Experimental part, P.L., S.K., K.Z.Ł., and J.C.; Theoretical part, P.K.; Methodology, P.L., S.K., K.Z.Ł., and J.C.; Project administration, K.Z.Ł.; Resources, P.L., S.K., K.Z.Ł., and J.C.; Supervision, K.Z.Ł. and P.K.; Validation, P.L., S.K., and K.Z.Ł.; Visualization, P.L., S.K., K.Z.Ł., and J.C.; Writing—original draft, P.K., B.D., A.B.-Ł., K.Z.Ł., and J.C. All authors have read and agreed to the published version of the manuscript.

Funding

This study was supported by the Nicolaus Copernicus University (project No. WF 540/2020; 1 January 2020); calculations have been carried out using resources provided by the Wroclaw Centre for Networking and Supercomputing (https://wcss.pl), grant No 585 (1 October 2022).

Institutional Review Board Statement

Not applicable.

Informed Consent Statement

Not applicable.

Data Availability Statement

The data presented in this study are available on request from the corresponding author. Compounds will be provided upon reasonable scientific request.

Conflicts of Interest

The authors declare no conflicts of interest.

Abbreviations

The following abbreviations are used in this manuscript:
L-DOPAL-3,4-dihydroxyphenylalanine
ESIelectrospray ionization
HRMShigh-resolution mass spectrometry
IC50Half-maximal inhibitory concentration
SDstandard deviation
Vmaxmaximum velocity
Kminhibition constant
TGAthermogravimetric analysis
THFtetrahydrofuran
EtOHethanol
DMSOdimethyl sulfoxide
CHCl3chloroform
CTcharge transfer
NBOnatural bond orbital
LUMOlowest unoccupied molecular orbital
HOMOhighest occupied molecular orbital
MEPmolecular electrostatic potential
NLOnonlinear optical materials
ConAconcanavalin A
HSAhuman serum albumin
TDDFTtime-dependent density-functional theory
PBE0Perdew–Burke–Ernzerhof hybrid functional

References

  1. Xu, Z.; Wu, D.; Fang, C.; Li, Y. Mini-Review on the Novel Synthesis and Potential Applications of Carbazole and Its Derivatives. Des. Monomers Polym. 2023, 26, 90–105. [Google Scholar] [CrossRef]
  2. Niedziałkowska, K.; Felczak, A.; Głowacka, I.E.; Piotrowska, D.G.; Lisowska, K. Antimicrobial Activity and Toxicity of Newly Synthesized 4-[4-(Benzylamino)butoxy]-9H-Carbazole Derivatives. Int. J. Mol. Sci. 2023, 24, 13722. [Google Scholar] [CrossRef]
  3. Liu, Y.-P.; Hu, S.; Liu, Y.-Y.; Zhang, M.-M.; Zhang, W.-H.; Qiang, L.; Fu, Y.-H. Anti-Inflammatory and Antiproliferative Prenylated Carbazole Alkaloids from Clausena vestita. Bioorg. Chem. 2019, 91, 103107. [Google Scholar] [CrossRef] [PubMed]
  4. Issa, S.; Prandina, A.; Bedel, N.; Rongved, P.; Yous, S.; Le Borgne, M.; Bouaziz, Z. Carbazole Scaffolds in Cancer Therapy: A Review from 2012 to 2018. J. Enzyme Inhib. Med. Chem. 2019, 34, 1321–1346. [Google Scholar] [CrossRef]
  5. Çapan, İ.; Hawash, M.; Jaradat, N.; Sert, Y.; Servi, R.; Koca, I. Design, Synthesis, Molecular Docking and Biological Evaluation of New Carbazole Derivatives as Anticancer and Antioxidant Agents. BMC Chem. 2023, 17, 60. [Google Scholar] [CrossRef] [PubMed]
  6. Hou, W.; Xu, X.L.; Huang, L.J.; Zhang, Z.Y.; Zhou, Z.N.; Wang, J.Y.; Ouyang, X.; Xin, S.Y.; Zhang, Z.Y.; Xiong, Y.; et al. Bioactivities and Action Mechanisms of Ellipticine Derivatives Reported Prior to 2023. Chem. Biodivers. 2024, 21, e202400210. [Google Scholar] [CrossRef]
  7. Zhang, J.; Wang, F.; Qu, G.; Wang, B. Murrayanine Suppresses the Proliferation and Metastasis of Human Breast Cancer Cells via Induction of Apoptosis and Inhibition of RANK/RANKL Signaling Pathway. Appl. Biol. Chem. 2021, 64, 32. [Google Scholar] [CrossRef]
  8. Ghani, U. Carbazole and Hydrazone Derivatives as New Competitive Inhibitors of Tyrosinase: Experimental Clues to Binuclear Copper Active Site Binding. Bioorg. Chem. 2019, 83, 235–241. [Google Scholar] [CrossRef]
  9. Cytarska, J.; Szulc, J.; Kołodziej-Sobczak, D.; Nunes, J.A.; da Silva-Júnior, E.F.; Łączkowski, K.Z. Cyrene™ as a Tyrosinase Inhibitor and Anti-Browning Agent. Food Chem. 2024, 442, 138430. [Google Scholar] [CrossRef]
  10. Yin, J.; Ma, Y.; Li, G.; Peng, M.; Lin, W. A Versatile Small-Molecule Fluorescence Scaffold: Carbazole Derivatives for Bioimaging. Coord. Chem. Rev. 2020, 412, 213257. [Google Scholar] [CrossRef]
  11. Li, D.; Tu, S.; Le, Y.; Zhou, Y.; Yang, L.; Ding, Y.; Huang, L.; Liu, L. Development of Carbazole-Based Fluorescent Probe for Highly Sensitive Application in Fluoride Ion Detection. Spectrochim. Acta A Mol. Biomol. Spectrosc. 2023, 285, 121816. [Google Scholar] [CrossRef]
  12. Yang, C.; Yu, C.; Zhang, M.; Yang, X.; Dong, H.; Dong, Q.; Zhang, H.; Li, L.; Guo, X.; Zang, H. Investigation of Protective Effect of Ethanol on the Natural Structure of Protein with Infrared Spectroscopy. Spectrochim. Acta A Mol. Biomol. Spectrosc. 2022, 271, 120935. [Google Scholar] [CrossRef] [PubMed]
  13. Ximenes, M.C.; Ferreira, J.L.M.; de Souza, A.P.N.; Tomaso, L.P.d.S.; da Silva, G.F.S.; Marques, A.d.S.; de Campos, J.B.; Malta, L.F.B.; Senra, J.D. Organic Electronics: Basic Fundamentals and Recent Applications Involving Carbazole-Based Compounds. Processes 2024, 12, 2945. [Google Scholar] [CrossRef]
  14. Tavgeniene, D.; Blazevicius, D.; Skuodis, E.; Grigalevicius, S.; Huang, C.-H.; Chen, Y.-H.; Chang, C.-H. High-Performance OLED Host Materials: Photophysical Properties and Device Optimization of Carbazole-Benzocarbazole Derivatives. Dyes Pigm. 2025, 242, 112965. [Google Scholar] [CrossRef]
  15. Krawczyk, P.; Kula, S.; Seklecka, K.; Łączkowski, K.Z. Synthesis, Electrochemical, Optical and Biological Properties of New Carbazole Derivatives. Spectrochim. Acta A Mol. Biomol. Spectrosc. 2022, 267, 120497. [Google Scholar] [CrossRef] [PubMed]
  16. Krawczyk, P.; Jędrzejewska, B.; Seklecka, K.; Cytarska, J.; Łączkowski, K.Z. Effect of the Chloro-Substitution on Electrochemical and Optical Properties of New Carbazole Dyes. Materials 2021, 14, 3091. [Google Scholar] [CrossRef] [PubMed]
  17. Suppan, P. Invited Review: Solvatochromic Shifts: The Influence of the Medium on the Energy of Electronic States. J. Photochem. Photobiol. A Chem. 1990, 50, 293–330. [Google Scholar] [CrossRef]
  18. Lakowicz, J.R. Principles of Fluorescence Spectroscopy; Springer: New York, NY, USA, 2006. [Google Scholar]
  19. Ledwon, P.; Lapkowski, M. The Role of Electrochemical and Spectroelectrochemical Techniques in the Preparation and Characterization of Conjugated Polymers: From Polyaniline to Modern Organic Semiconductors. Polymers 2022, 14, 4173. [Google Scholar] [CrossRef]
  20. Hsiao, S.-H.; Lin, S.-W. Electrochemical Synthesis of Electrochromic Polycarbazole Films from N-Phenyl-3,6-Bis(N-Carbazolyl)Carbazoles. Polym. Chem. 2016, 7, 198–211. [Google Scholar] [CrossRef]
  21. Karon, K.; Lapkowski, M. Carbazole Electrochemistry: A Short Review. J. Solid. State Electrochem. 2015, 19, 2601–2610. [Google Scholar] [CrossRef]
  22. Chen, X.-C.; Tao, T.; Wang, Y.-G.; Peng, Y.-X.; Huang, W.; Qian, H.-F. Azo-Hydrazone Tautomerism Observed from UV-Vis Spectra by pH Control and Metal-Ion Complexation for Two Heterocyclic Disperse Yellow Dyes. Dalt. Trans. 2012, 41, 11107–11115. [Google Scholar] [CrossRef]
  23. Bártová, K.; Císařová, I.; Lyčka, A.; Dračínský, M. Tautomerism of Azo Dyes in the Solid State Studied by 15N, 14N, 13C and 1H NMR Spectroscopy, X-Ray Diffraction and Quantum-Chemical Calculations. Dye. Pigment. 2020, 178, 108342. [Google Scholar] [CrossRef]
  24. Yu, X.; Li, C.; Wang, B.; Ding, X.; Wang, N.; Xing, B.; Zhang, Z. Protein-Mediated Fluorescent Probes for Bioimaging and Biosensing: From Fundamentals to Applications. TrAC Trends Anal. Chem. 2024, 170, 117462. [Google Scholar] [CrossRef]
  25. Reeder, W.J.; Ekstedt, R.D. Study of the Interaction of Concanavalin A with Staphylococcal Teichoic Acids. J. Immunol. 1971, 106, 334–340. [Google Scholar] [CrossRef] [PubMed]
  26. Mussini, A.; Delcanale, P.; Berni, M.; Pongolini, S.; Jordà-Redondo, M.; Agut, M.; Steinbach, P.J.; Nonell, S.; Abbruzzetti, S.; Viappiani, C. Concanavalin A Delivers a Photoactive Protein to the Bacterial Wall. Int. J. Mol. Sci. 2024, 25, 5751. [Google Scholar] [CrossRef]
  27. Olmsted, J., III. Calorimetric Determinations of Absolute Fluorescence Quantum Yields. J. Phys. Chem. 1979, 83, 2581–2684. [Google Scholar] [CrossRef]
  28. Frisch, M.J.; Trucks, G.W.; Schlegel, G.B.; Scuseria, G.E.; Robb, M.A.; Cheeseman, J.R.; Scalmani, G.; Barone, V.; Mennucci, B.; Petersson, G.A.; et al. Gaussian 09, Revision A.1; Gaussian, Inc.: Wallingford, CT, USA, 2009. [Google Scholar]
  29. Adamo, C.; Scuseria, G.E.; Barone, V. Accurate Excitation Energies from Time-Dependent Density Functional Theory: Assessing the PBE0 Model. J. Chem. Phys. 1999, 111, 2889–2899. [Google Scholar] [CrossRef]
  30. Perdew, J.P.; Burke, K.; Ernzerhof, M. Generalized Gradient Approximation Made Simple. Phys. Rev. Lett. 1996, 77, 3865–3868, Erratum in Phys. Rev. Lett. 1997, 78, 1396. https://doi.org/10.1103/PhysRevLett.78.1396. [Google Scholar] [CrossRef] [PubMed]
  31. Krawczyk, P.; Bratkowska, M.; Wybranowski, T.; Hołyńska-Iwan, I.; Cysewski, P.; Jędrzejewska, B. Experimental and Theoretical Insight into Spectroscopic Properties and Bioactivity of 4-(4-Formylbenzylidene)-2-Phenyloxazol-5(4H)-One Dye for Future Applications in Biochemistry. J. Mol. Liq. 2020, 314, 113632. [Google Scholar] [CrossRef]
  32. Krawczyk, P.; Wybranowski, T.; Kaźmierski, Ł.; Hołyńska-Iwan, I.; Bartkowska, M.; Cysewski, P.; Jędrzejewska, B. 2’(1H-Phenanthro[9,10-d]imidazol-2-yl-4-carboxyclic Acid N-Hydroxysuccimimide Ester: A New Phenanthroimidazole Derivative as a Fluorescent Probe for Medical Applications. Spectrochim. Acta A Mol. Biomol. Spectrosc. 2020, 228, 117757. [Google Scholar] [CrossRef]
  33. Krawczyk, P.; Jędrzejewska, B.; Pietrzak, M.; Janek, T. Synthesis, Photophysical Properties and Systematic Evaluations of New Phenanthroimidazole Fluorescent Probe for Bioimaging: Experimental and Theoretical Study. J. Photochem. Photobiol. B-Biol. 2017, 166, 74–85. [Google Scholar] [CrossRef]
  34. Szukalski, A.; Jędrzejewska, B.; Krawczyk, P.; Bajorek, A. An Optical Modulator on the Pyrazolone-Based Bi-Component System. Dye. Pigment. 2020, 172, 107805. [Google Scholar] [CrossRef]
  35. Jędrzejewska, B.; Krawczyk, P.; Józefowicz, M. Experimental and Theoretical Studies of the Influence of Solvent Polarity on the Spectral Properties of Two Push-Pull Oxazol-5-(4H)-One Compounds. Spectrochim. Acta A Mol. Biomol. Spectrosc. 2017, 171, 258–267. [Google Scholar] [CrossRef]
  36. Minezawa, N. State-Specific Solvation Effect on the Intramolecular Charge Transfer Reaction in Solution: A Linear-Response Free Energy TDDFT Method. Chem. Phys. Lett. 2014, 608, 140–144. [Google Scholar] [CrossRef]
  37. Ming Tong, G.S.; Chan, K.T.; Chang, X.; Che, C.-M. Theoretical Studies on the Photophysical Properties of Luminescent Pincer Gold(III) Arylacetylide Complexes: The Role of π-Conjugation at the C-Deprotonated [C^N^C] Ligand. Chem. Sci. 2015, 6, 3026–3037. [Google Scholar] [CrossRef]
  38. Kurtz, H.A.; Stewart, J.J.P.; Dieter, K.M. Calculation of the Nonlinear Optical Properties of Molecules. J. Comput. Chem. 1990, 11, 82–87. [Google Scholar] [CrossRef]
  39. Le Bahers, T.; Adamo, C.; Ciofini, I. A Qualitative Index of Spatial Extent in Charge-Transfer Excitations. J. Chem. Theory Comput. 2011, 7, 2498–2506. [Google Scholar] [CrossRef] [PubMed]
  40. Cancés, M.T.; Mennucci, B.; Tomasi, J. A New Integral Equation Formalism for the Polarizable Continuum Model: Theoretical Background and Applications to Isotropic and Anisotropic Dielectrics. J. Chem. Phys. 1997, 107, 3032–3041. [Google Scholar] [CrossRef]
  41. Arivazhagan, M.; Muniappan, P.; Meenakshi, R.; Rajavel, G. PCM/TD-DFT Analysis of 1-Bromo-2,3-Dichlorobenzene—A Combined Study of Experimental (FT-IR and FT-Raman) and Theoretical Calculations. Spectrochim. Acta Part. A 2013, 105, 497–508. [Google Scholar] [CrossRef] [PubMed]
  42. Boyd, R.W. Nonlinear Optics, 2nd ed.; Academic Press: London, UK, 2003; p. 521. [Google Scholar]
  43. Craig, D.P.; Thirunamachandran, T. Theoretical Study of the Two-Photon Absorption Properties of Several Asymmetrically Substituted Stilbenoid Molecules. J. Chem. Phys. 2007, 127, 084504–084515. [Google Scholar] [CrossRef]
  44. Zaleśny, R.; Bartkowiak, W.; Styrcz, S.; Leszczynski, J. Solvent Effects on Conformationally Induced Enhancement of the Two-Photon Absorption Cross Section of a Pyridinium-N-Phenolate Betaine Dye: A Quantum Chemical Study. J. Phys. Chem. A 2002, 106, 4032–4037. [Google Scholar] [CrossRef]
  45. Olsen, J.; Jorgensen, P. Linear and Nonlinear Response Functions for an Exact State and for an MCSCF State. J. Chem. Phys. 1985, 82, 3235–3264. [Google Scholar] [CrossRef]
  46. Sałek, P.; Vahtras, O.; Guo, J.D.; Luo, Y.; Helgaker, T.; Ågren, H. Calculations of Two-Photon Absorption Cross Sections by Means of Density-Functional Theory. Chem. Phys. Lett. 2003, 374, 446–452. [Google Scholar] [CrossRef]
  47. DALTON, A Molecular Electronic Structure Program, Release Dalton 2011. Available online: http://daltonprogram.org (accessed on 27 June 2025).
  48. LSDALTON, A Linear Scaling Molecular Electronic Structure Program, Release Dalton 2011. Available online: http://daltonprogram.org (accessed on 27 June 2025).
  49. Trott, O.; Olson, A.J. AutoDock Vina: Improving the Speed and Accuracy of Docking with a New Scoring Function, Efficient Optimization, and Multithreading. J. Comput. Chem. 2010, 31, 455–461. [Google Scholar] [CrossRef]
  50. Panjikar, C.S.; Tucker, P.A.; Weiss, M.S. On the Routine Use of Soft X-Rays in Macromolecular Crystallography, Part III—The Optimal Data Collection Wavelength. Acta Crystallogr. D Biol. Crystallogr. 2005, 61, 1263–1272. [Google Scholar] [CrossRef]
  51. Potemkin, V.; Grishina, M. A New Paradigm for Pattern Recognition of Drugs. J. Comput. Aided Mol. Des. 2008, 22, 489–505. [Google Scholar] [CrossRef]
  52. Potemkin, V.; Grishina, M. Principles for 3D/4D QSAR Classification of Drugs. Drug Discov. Today 2008, 13, 952–959. [Google Scholar] [CrossRef] [PubMed]
  53. Saeed, A.; Mahesar, P.A.; Channar, P.A.; Abbas, Q.; Larik, F.A.; Hassan, M.; Raza, H.; Seo, S.-Y. Synthesis, molecular docking studies of coumarinyl-pyrazolinyl substituted thiazoles as non-competitive inhibitors of mushroom tyrosinase. Bioorg. Chem. 2017, 74, 187–196. [Google Scholar]
  54. Rosada, B.; Bekier, A.; Cytarska, J.; Płaziński, W.; Zavyalova, O.; Sikora, A.; Dzitko, K.; Łączkowski, K.Z. Benzo[b]thiophene-Thiazoles as Potent Anti-Toxoplasma gondii Agents: Design, Synthesis, Tyrosinase/Tyrosine Hydroxylase Inhibitors, Molecular Docking Study, and Antioxidant Activity. Eur. J. Med. Chem. 2019, 184, 111765. [Google Scholar] [CrossRef]
  55. Shin, N.H.; Ryu, S.Y.; Choi, E.J.; Kang, S.H.; Chang, I.M.; Min, K.R.; Kim, Y. Oxyresveratrol as the potent inhibitor on dopa oxidase activity of mushroom tyrosinase. Biochem. Biophys. Res. Commun. 1998, 243, 801–803. [Google Scholar] [CrossRef] [PubMed]
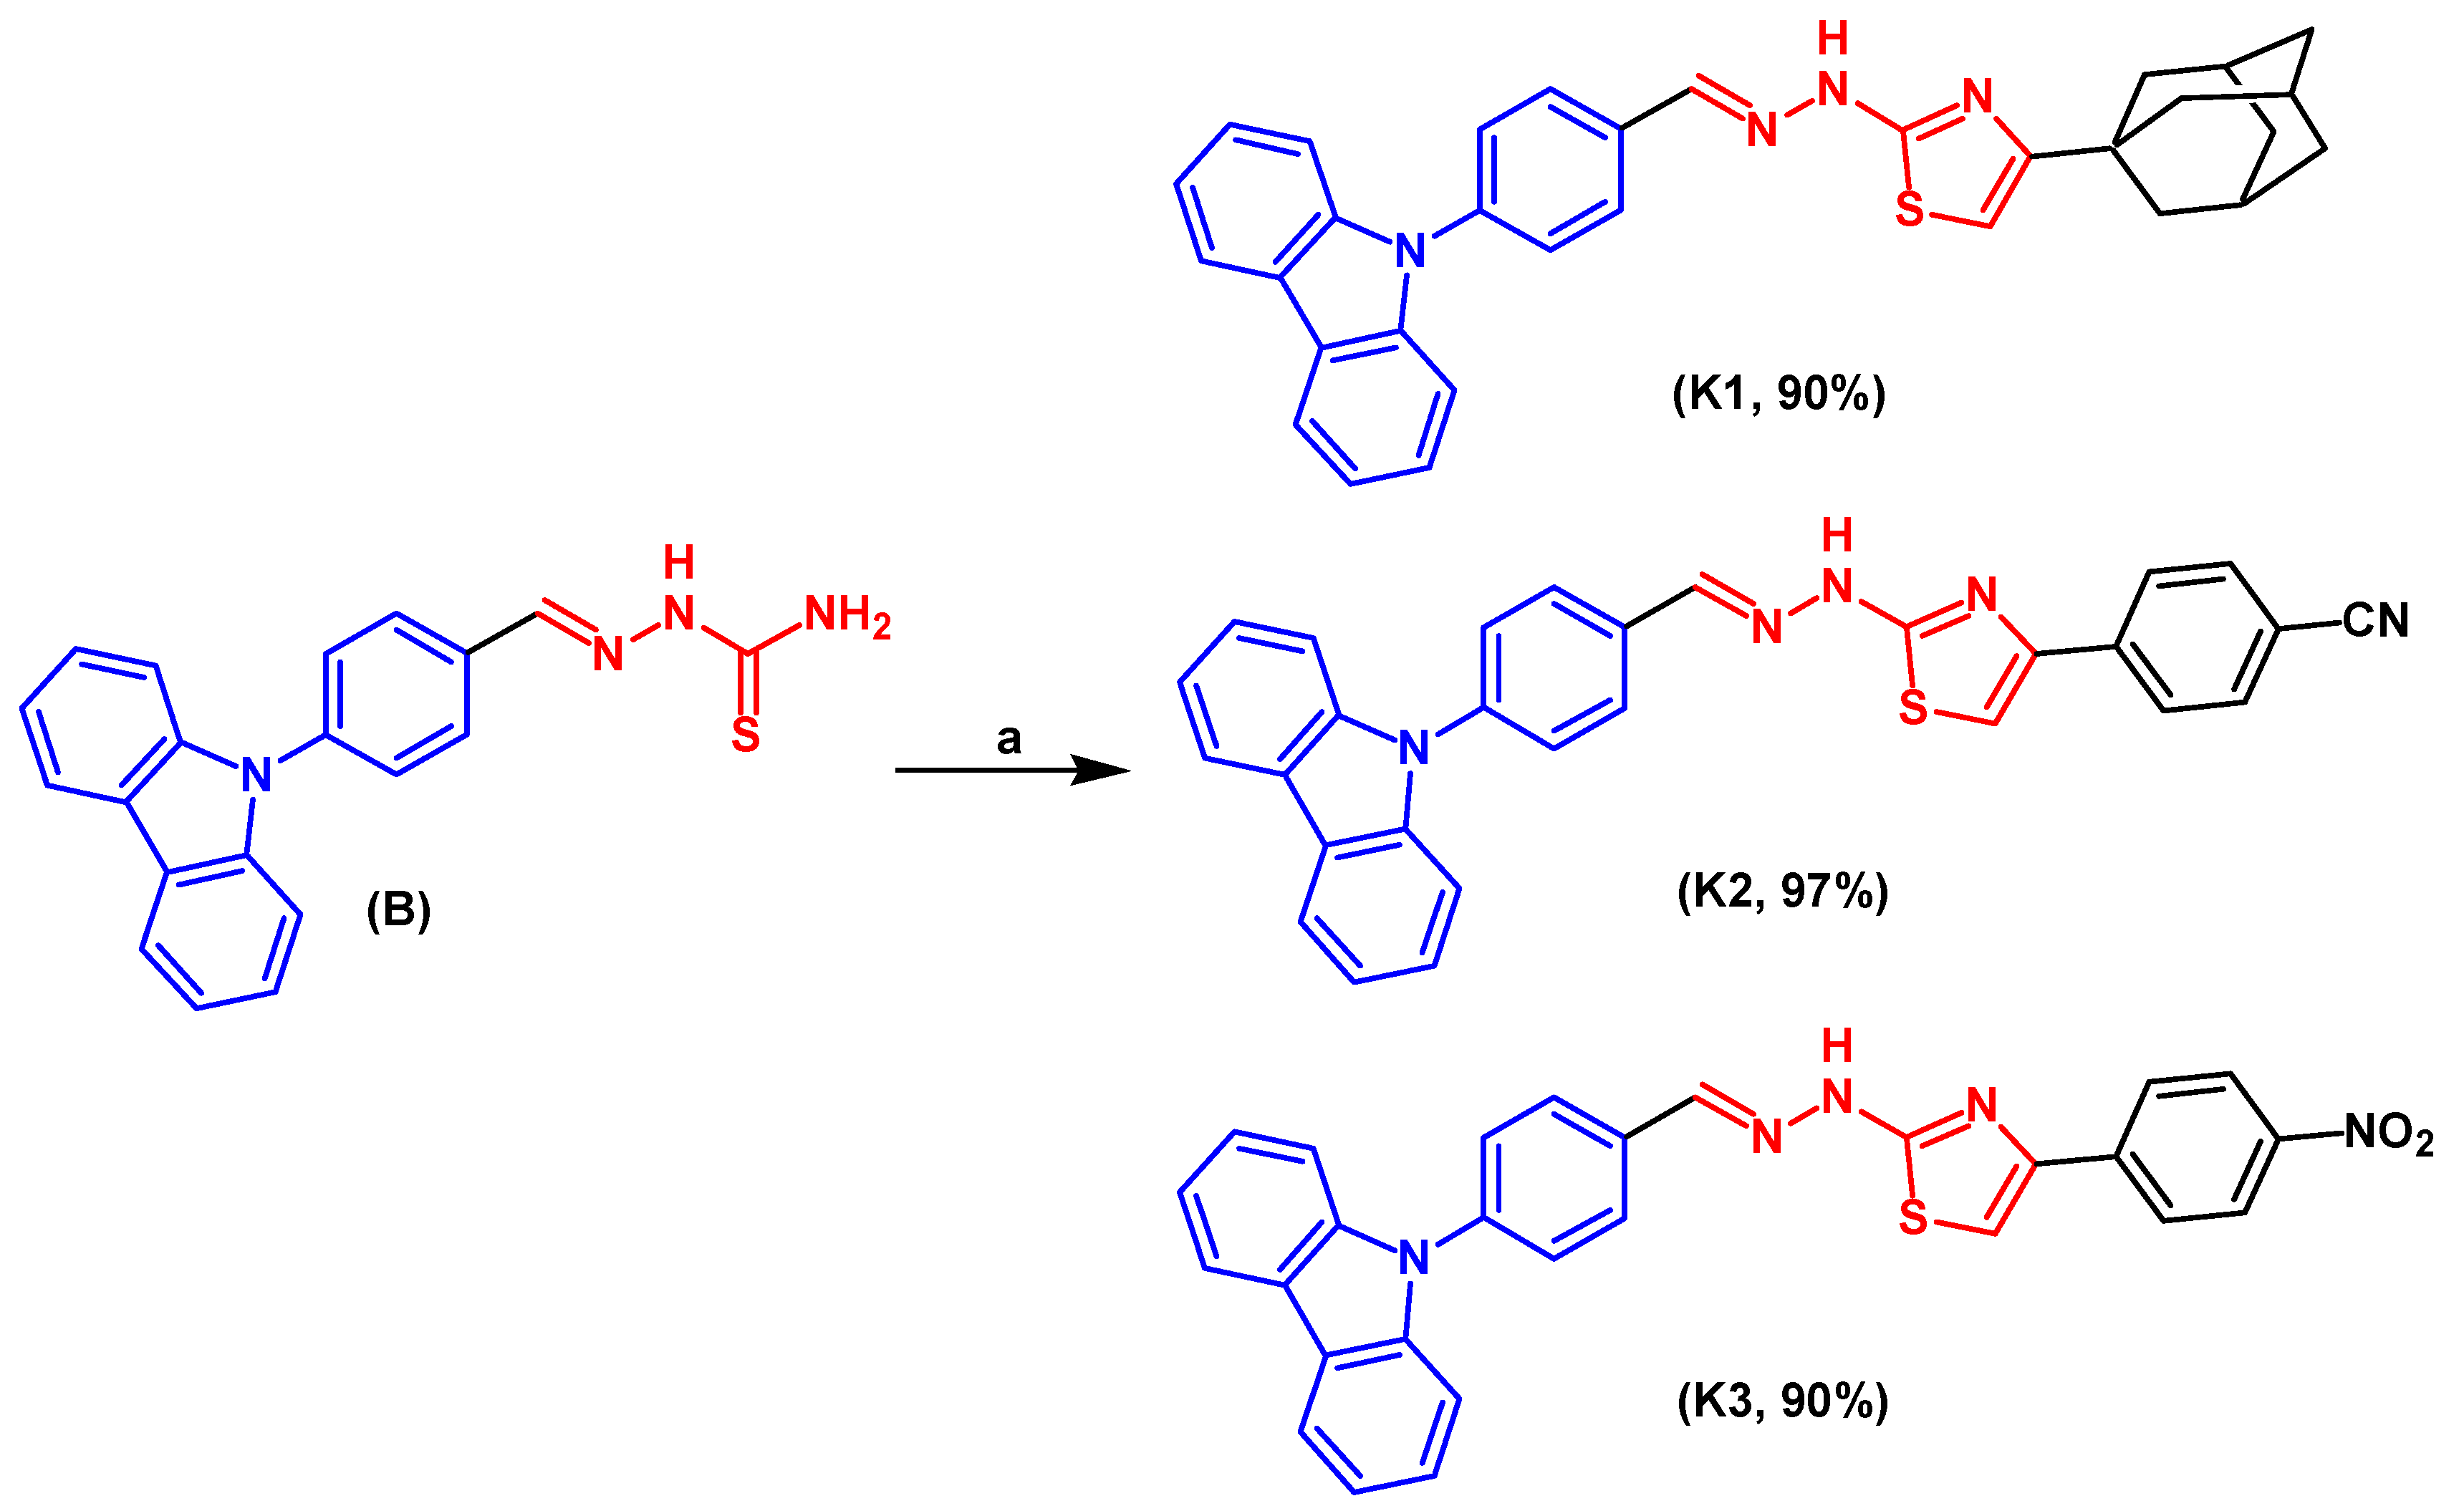
Scheme 1. General synthesis of compounds K1K3: Reagents and conditions: (a) 2-bromoketones, EtOH, reflux, 20 h.
Ijms 26 07945 sch001
Figure 1. Lineweaver–Burk plot for inhibition of tyrosinase for tested K3. The plot is expressed as 1/velocity [ΔA475/min−1] vs. 1/substrate concentration [mM−1].
Ijms 26 07945 g001
Figure 2. Thermogravimetric analysis thermogram of K1K3.
Ijms 26 07945 g002
Figure 3. Absorption (a) and emission (b) spectra for K1.
Ijms 26 07945 g003
Figure 4. Cyclic voltammetry of K1, K2, and K3 compounds in Bu4NBF4/CH2Cl2 electrolyte.
Ijms 26 07945 g004
Figure 5. Cyclic voltammetry of (a) 1 mM solution of K3 in Bu4NBF4/CH2Cl2 electrolyte and (b) electrochemically generated poly (K3) film in monomer free electrolyte.
Ijms 26 07945 g005
Figure 6. Theoretical UV–Vis absorption spectra of K1K3 obtained from TDDFT/PBE0 calculations, illustrating solvent effects on electronic transitions.
Ijms 26 07945 g006
Table 1. Tyrosinase inhibitory activity of tested carbazoles compared to standard inhibitors. Determined inhibition type, maximum velocity (Vmax), and inhibition constant (Km) of K1K3 carbazoles.
CompoundIC50 ± SD [µM]Inhibitory MechanismVmax
[mM/min]
Km
[mM/min]
K159.36 ± 1.427Mixed0.26080.655
K281.99 ± 3.387Mixed0.40780.314
K345.95 ± 3.152Mixed0.47180.751
Ascorbic acid386.50 ± 11.958---
Kojic acid72.27 ± 3.145---
Table 2. Thermal properties of K1K3.
CompoundT5 a [°C]T10 a [°C]Tmax b [°C]
K1222279301, 468
K2231252313
K3244271298, 668
a T5 and T10 are temperature at 5% and 10% weight loss, respectively. b Temperature of maximum decomposition rate.
Table 3. Optical characterization of K1K3.
CompoundAbsorption (λabs) [nm]ε
[M−1 cm−1]
Emission
em) [nm]
Stokes Shift a
[cm−1]
K1Toluene362
340
326
291
18,949
15,630
12,532
12,910
41654
CHCl3363
340
326
291
16,942
13,099
11,245
10,984
43975
THF357
291
20,853
12,831
456100
EtOH355
291
26,895
16,018
468115
DMSO362
293
22,354
14,292
485123
K2Toluene362
340
328
293
10,289
10,811
10,289
9859
409; 43247; 70
CHCl3367
326
291
258
20,657
20,988
21,829
33,111
45184
THF342
291
281
257
21,634
14,393
16,167
24,112
43997
EtOH342
291
254
28,198
18,266
30,235
44199
DMSO345
293
281
28,389
19,278
21,595
462117
K3Toluene----
CHCl3361
291
26,666
17,688
44483
THF358
291
283
27,103
16,416
14,577
nd-
EtOH356
291
281
14,913
9712
8671
44792
DMSO362
293
35,033
22,045
475113
a λem—λabs for solutions; nd—not detected.
Disclaimer/Publisher’s Note: The statements, opinions and data contained in all publications are solely those of the individual author(s) and contributor(s) and not of MDPI and/or the editor(s). MDPI and/or the editor(s) disclaim responsibility for any injury to people or property resulting from any ideas, methods, instructions or products referred to in the content.