
Prevalence and Levels of Thyroid Autoantibodies in Polycystic Ovary Syndrome—Impact of TSH- and BMI-Matched Comparisons: A Systematic Review and Meta-Analysis

Abstract
1. Introduction
2. Materials and Methods
2.1. Registration and Search Strategy
2.2. Eligibility Criteria and Study Selection
2.3. Data Extraction
- Study characteristics (first author, publication year, type of work, country of origin);
- Participants’ characteristics (total number of participants, number of PCOS and control women, diagnostic criteria used for PCOS diagnosis, age, BMI, and whether matching for TSH, age, and/or BMI was performed);
- Autoantibody details (types of autoantibodies analyzed, measurement method);
- Outcome details (prevalence of autoantibody positivity and/or serum levels of anti-TPO and anti-TG in PCOS women versus controls, along with reported associations with clinical or biochemical parameters).
2.4. Risk of Bias Assessment and Statistical Analysis
- Study quality was assessed independently by two investigators (J.K. and N.A.) using a modified version of the Newcastle–Ottawa Scale (NOS) adapted for observational studies (Supplementary Material S2). Stars (points) were assigned in three main categories: Selection, Comparability, and Outcome. In the Selection domain, points were awarded for the use of an internationally recognized PCOS definition, clearly defined and appropriate inclusion/exclusion criteria, proper selection and description of a control group, and the use and reporting of a validated method for autoantibody measurement (maximum 4 points).
- In the Comparability domain, one point was given for age matching between groups, and an additional point was awarded if either BMI or TSH levels were matched between the PCOS and control groups (maximum 2 points).
- In the Outcome domain, studies were evaluated based on the clarity of outcome presentation, the consideration of potential confounders influencing autoantibody levels or prevalence (particularly history of thyroid disease or euthyroid status), and the application and reporting of appropriate statistical methods (maximum 3 points).
3. Results
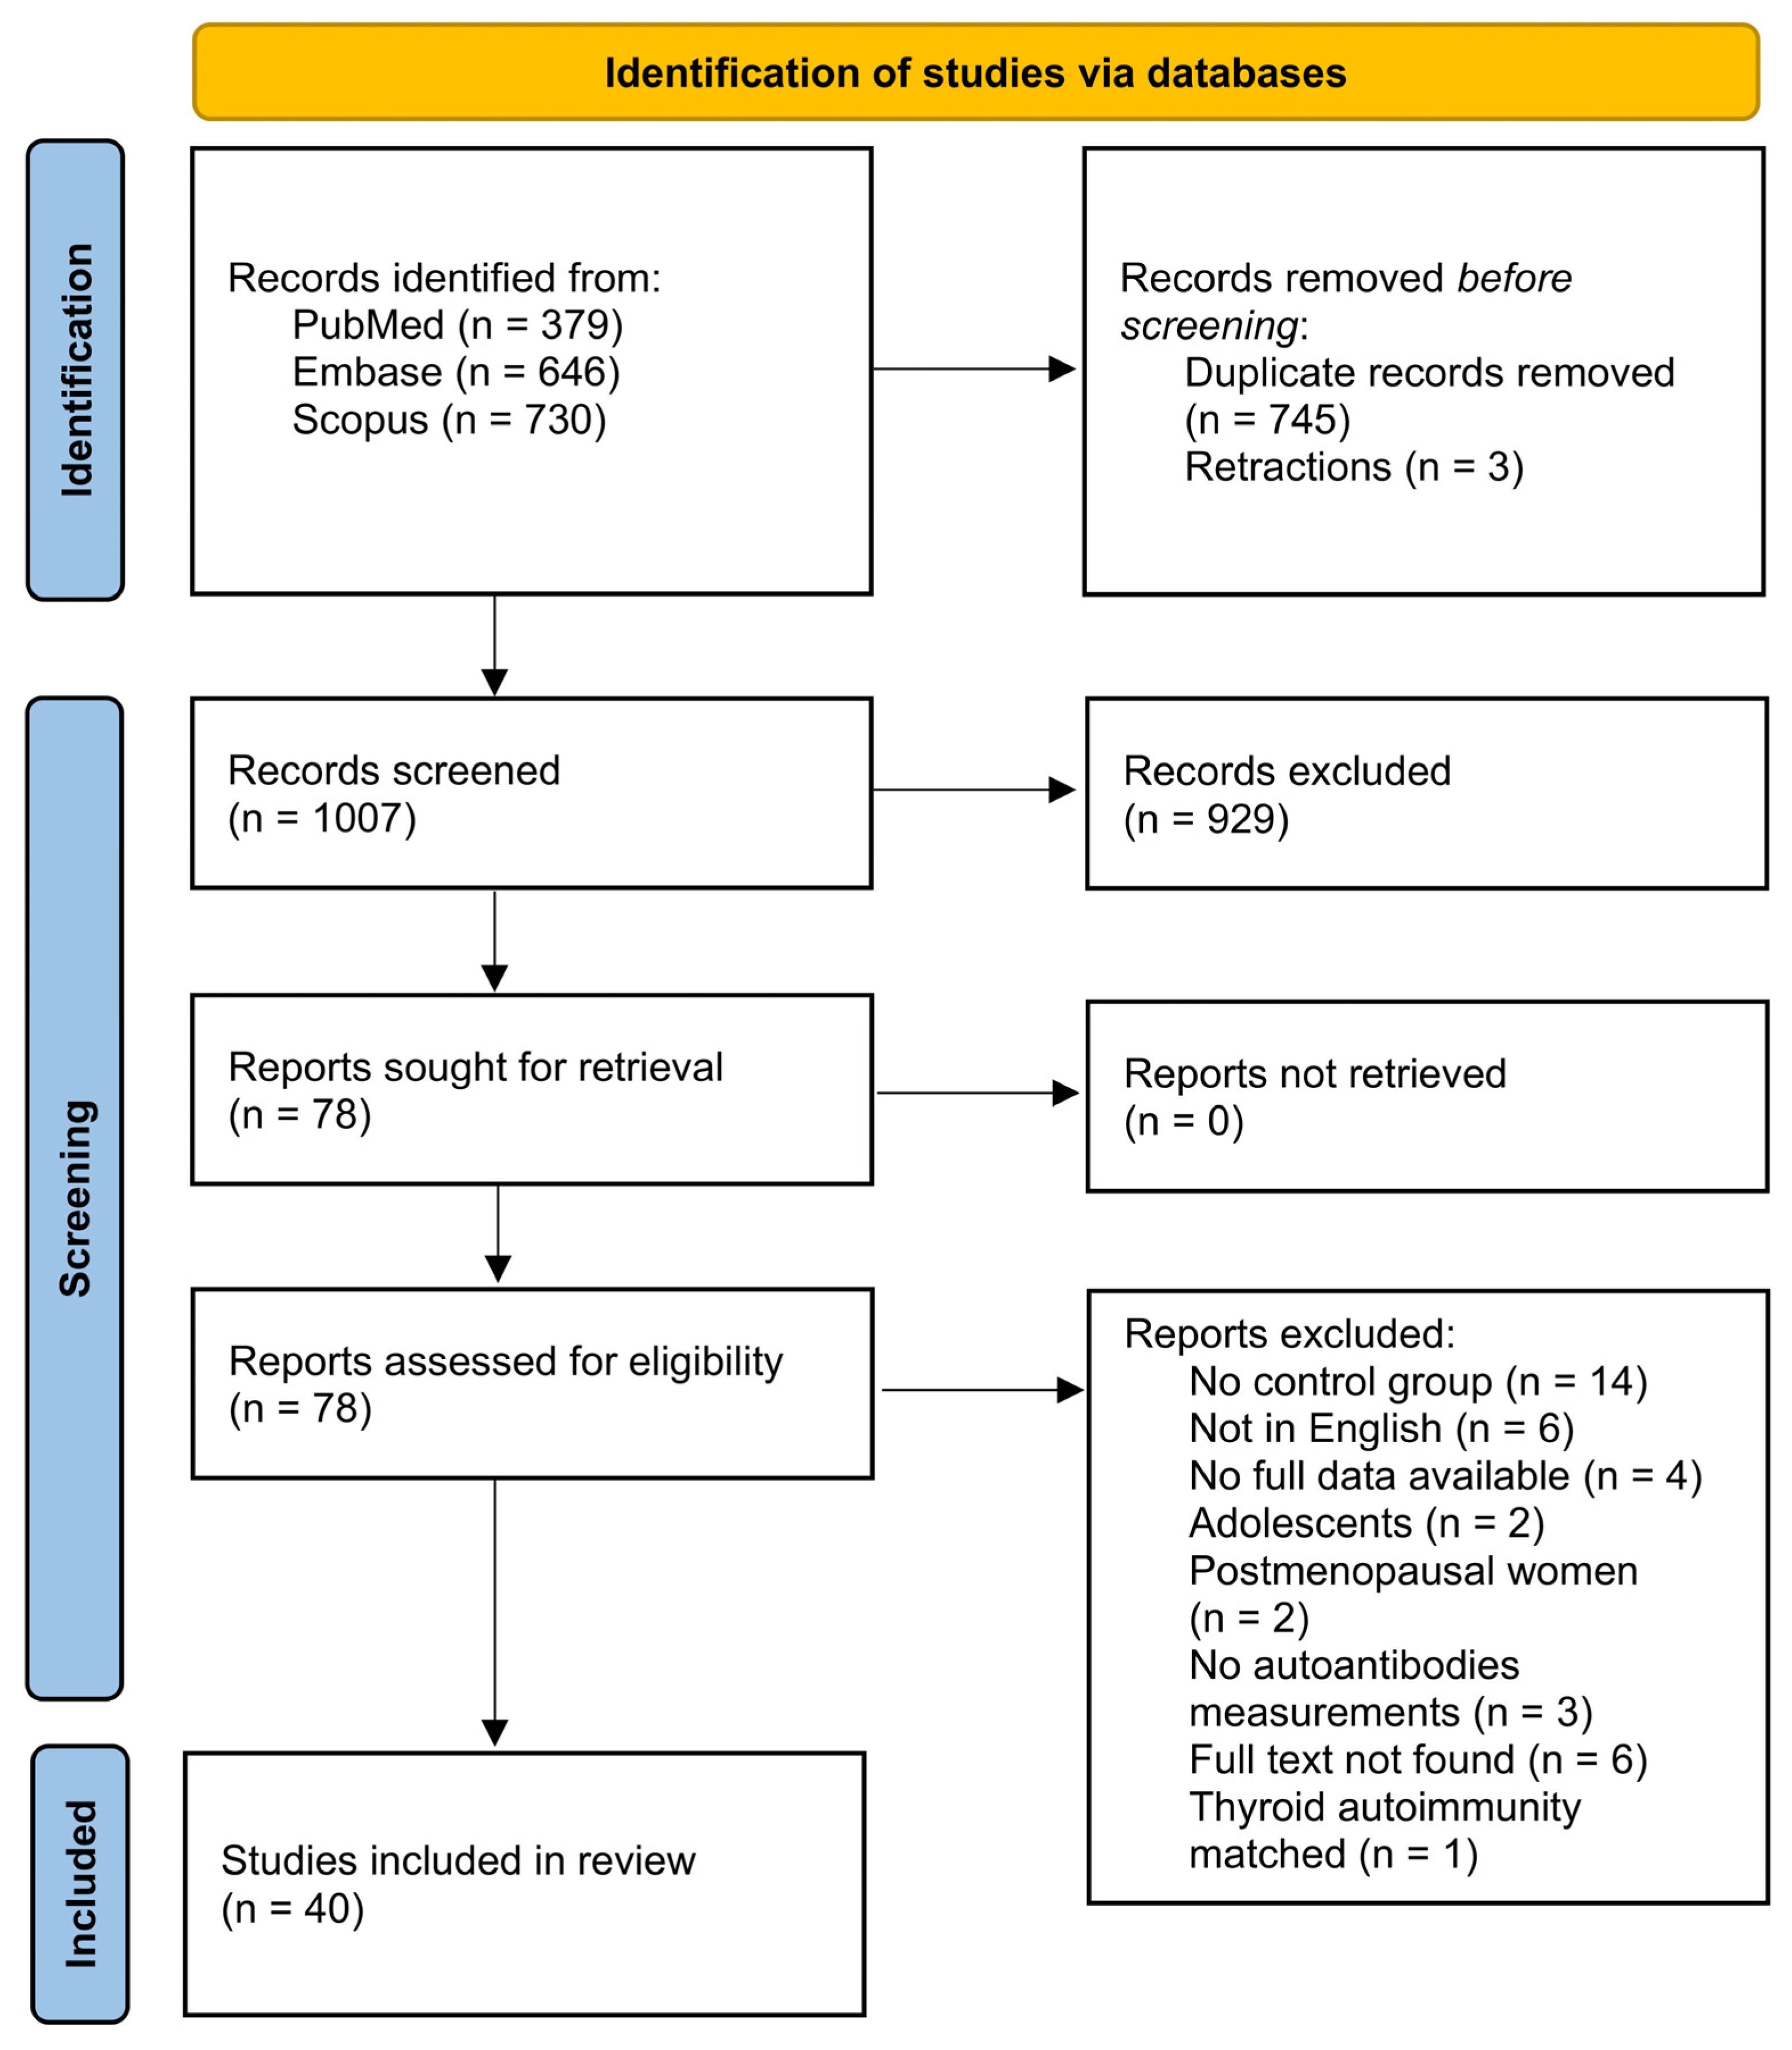
3.1. Study Selection Process
3.2. Summary of Included Studies Characteristics

| Author, Year | Country | Type of Study | Control Group | PCOS Criteria | PCOS | Control | Antibody Measurement Method | ||||
|---|---|---|---|---|---|---|---|---|---|---|---|
| N | Age | BMI | N | Age | BMI | ||||||
| Studies assessing only anti-TG antibodies (n = 1) | |||||||||||
| Kamil et al., 2020 [31] | Sudan | cross-sectional | Age-matched healthy women (no history of thyroid disease) | not specified | 50 | 30.18 ± 3.78 | ND | 50 | 28.88 ± 3.51 | ND | ELISA |
| Studies assessing only anti-TPO antibodies (n = 16) | |||||||||||
| Adamska et al., 2020 [33] | Poland | cross-sectional | Age-, TSH-matched women without PCOS | 2003 Rotterdam criteria | 141 | ND | ND | 88 | 25 (22.5; 27) | 22 (20.7; 24.1) | RIA |
| Arora et al., 2016 [34] | India | case-control | Age-, TSH-matched healthy women | 2003 Rotterdam criteria | 55 | 23.27 ± 5.83 | ND | 51 | 22.8 ± 4.4 | ND | ELISA |
| Dhoriyani et al., 2024 [35] | India | cross-sectional | Age-, TSH-matched healthy women (no history of thyroid disease) | 2003 Rotterdam criteria | 60 | 25.6 ± 3.7 | 28.95 ± 6.15 | 20 | 24 ± 4.2 | 22.5 ± 2.1 | ECLIA |
| Gudovan et al., 2008 [36] | Romania | case-control | Age-matched women without PCOS | 2003 Rotterdam criteria | 25 | 25.1 ± 2.3 | 32.7 ± 2.9 | 20 | 25.4 ± 2.1 | 24.5 ± 2.1 | immunometric assay |
| Heidarpour et al., 2023 [32] | Iran | cross-sectional | Healthy women | other | 76 | 26.62 ± 5.58 | ND | 66 | ND | ND | ELISA |
| Jameel et al., 2022 [30] | Iraq | cross-sectional | Age-, TSH-matched euthyroid healthy women | not specified | 35 | 25.37 ± 4.5 | 29.91 ± 5.1 | 30 | 27.1 ± 3.9 | 26.3 ± 4.7 | ECLIA |
| Kim et al., 2022 [37] | South Korea | case-control | Age-, TSH-, BMI-matched women without PCOS (no history of thyroid disease) | 2003 Rotterdam criteria | 210 | 33.3 ± 5.3 | 20.4 ± 2.8 | 343 | 33.4 ± 4.9 | 20.1 ± 2.3 | IRMA |
| Menon et al., 2017 [38] | India | case-control | Age-, TSH-matched women without PCOS | 2003 Rotterdam criteria | 90 | 30.02 ± 8.51 | 24.6 ± 4 | 90 | 31.4 ± 8.6 | 21.3 ± 2.8 | CLIA |
| Naruka et al., 2023 [39] | India | case-control | Age-, TSH-matched healthy women (no history of thyroid disease) | 2003 Rotterdam criteria | 75 | 30.13 ± 5.32 | ND | 75 | 28.54 ± 6.78 | ND | CLIA |
| Shafi et al., 2024 [40] | India | cross-sectional | Age-, BMI-matched healthy women | 2003 Rotterdam criteria | 90 | 25.7 ± 4.16 | 25.3 ± 2.53 | 90 | 26.8 ± 5.13 | 24.9 ± 1.64 | ND |
| Sinha et al., 2013 [41] | India | cross-sectional, case-control | BMI-matched women without PCOS | 2003 Rotterdam criteria | 80 | 22.7 ± 5.3 | 24.68 ± 3.07 | 80 | 24.3 ± 5.69 | 23.55 ± 3.02 | EIA |
| Tran et al., 2023 [42] | Vietnam | retrospective cohort study | Age-, TSH-matched women without PCOS | 2003 Rotterdam criteria | 904 | 29 ± 3.58 | 22.8 ± 3.84 | 904 | 29.1 ± 3.4 | 19.9 ± 2.23 | competitive CLIA |
| Van der Ham et al., 2023 [43] | Netherlands | cross-sectional | TSH-matched women without PCOS | 2003 Rotterdam criteria | 1429 | 28.2 (24.6; 31.7) | 25.5 (21.9; 30.7) | 299 | 32.8 (29.7; 35.8) | 24.4 (22.3; 27.5) | FIA |
| Wang et al., 2018 [28] | China | retrospective cohort study | Tubal obstruction infertile patients with no other chronic diseases (no history of thyroid disease, negative for anti-TG and anti-TM) | Chinese Ministry of Health (2011) Industry Standard | 124 | ND | ND | 108 | ND | ND | ND |
| Yasar et al., 2022 [44] | Turkey | cross-sectional, case-control | Age-, TSH-, BMI-matched healthy women (no history of thyroid disease) | 2003 Rotterdam criteria | 180 | 25.94 ± 6.18 | 29.77 ± 6.65 | 100 | 28.12 ± 7.27 | 28.04 ± 6.16 | CLIA |
| Yu et al., 2016 [45] | China | case-control | Age-, TSH-matched euthyroid healthy women | 2003 Rotterdam criteria | 68 | 26.37 ± 4.5 | 30.91 ± 5.1 | 91 | 28.1 ± 3.9 | 27.3 ± 4.7 | ECLIA |
| Studies assessing both anti-TG and anti-TPO antibodies (n = 23) | |||||||||||
| Al-Karawi et al., 2024 [29] | Iraq | case-control | Healthy women | not specified | 150 | ND | ND | 150 | ND | ND | LIA |
| Al-Saab et al., 2014 [46] | Syria | case-control | BMI-, TSH-matched euthyroid women without PCOS | 2003 Rotterdam criteria | 56 | 23.8 ± 5.6 | 24.9 ± 5.9 | 30 | 28.9 ± 5.8 | 23.9 ± 2.9 | ECLIA |
| Anaforoglu et al., 2011 [47] | Turkey | case-control | Age-, TSH-matched euthyroid healthy women | 2003 Rotterdam criteria | 84 | 23.7 ± 6.8 | 30.1 ± 8.3 | 81 | 24.5 ± 7.1 | 27.2 ± 6.9 | CLIA |
| Anusha et al., 2024 [48] | India | cross-sectional | Age-matched euthyroid infertile women without PCOS | 2003 Rotterdam criteria | 66 | 28.73 ± 3.28 | 26.52 ± 4.6 | 66 | 29.27 ± 3.97 | 24.31 ± 3.1 | ELISA |
| Arduc et al., 2015 [49] | Turkey | cross-sectional | Age-, BMI-matched healthy women (no history of thyroid disease) | 2003 Rotterdam criteria | 86 | 24.6 ± 5.7 | 24.9 ± 3.6 | 60 | 26.17 ± 5 | 23.4 ± 2.9 | ECLIA |
| Auda et al., 2023 [50] | Iraq | case-control | Age-matched women without PCOS | 2003 Rotterdam criteria | 85 | 27.2 ± 6.4433 | 27.4575 ± 1.70508 | 50 | 26.7 ± 4.4272 | 23.0571 ± 1.9972 | ELISA |
| De Souza Mayrink Novais et al., 2015 [51] | Brazil | cross-sectional | Women without PCOS (no history of thyroid disease) | 2003 Rotterdam criteria | 65 | 27.8 ± 6.9 | 34.8 ± 8.9 | 65 | 33.5 ± 5.7 | 28.4 ± 4.8 | ECLIA |
| Duran et al., 2015 [52] | Turkey | case-control | Age-, TSH-matched women without PCOS | 2003 Rotterdam criteria | 73 | 22 [18; 37] | 27.45 ± 5.73 | 60 | 20.5 [19; 35] | 22.55 ± 3.78 | CLIA |
| El-Din et al., 2015 [53] | Egypt | case-control | TSH-matched euthyroid women without PCOS | 2003 Rotterdam criteria | 45 | 22.24 ± 4.7 | 25.9 ± 2.5 | 18 | 27.89 ± 5.4 | 24.2 ± 2 | ELISA |
| Garelli et al., 2013 [54] | Italy | case-control | Healthy women (no history of thyroid disease) | 2003 Rotterdam criteria | 113 | 24 ± 6.3 | ND | 100 | 27.1 ± 1.2 | ND | CLIA |
| Hepşen et al., 2019 [55] | Turkey | case-control | Age-, TSH-matched healthy women (no history of thyroid disease) | 2003 Rotterdam criteria | 184 | 23.9 ± 5.6 | 26.4 [16; 44] | 106 | 24.3 ± 4.3 | 22.1 [16; 40.4] | competitive CLIA |
| Janssen et al., 2004 [56] | Germany | case-control | Age-matched women without PCOS | NIH | 175 | 28.4 ± 6.5 | 30 ± 7.9 | 168 | 29.8 ± 7.4 | 25.5 ± 7.1 | immunometric assay |
| Kachuei et al., 2012 [57] | Iran | case-control | Age-, TSH-matched women without PCOS | 2003 Rotterdam criteria | 78 | 23.95 ± 5.2 | ND | 350 | 24.38 ± 3.17 | ND | ELISA |
| Karaköse et al., 2013 [58] | Turkey | cross-sectional | Age-, TSH-, BMI-matched healthy women (no history of thyroid disease) | 2003 Rotterdam criteria | 52 | 24.4 ± 10.5 | 26.5 ± 6.1 | 68 | 26.5 ± 6.5 | 24.8 ± 4.9 | ELISA |
| Karaköse et al., 2017 [59] | Turkey | case-control | Age-, TSH-matched healthy women with no chronic disease | 2003 Rotterdam criteria | 97 | 24.1 ± 6 | 27.5 ± 6 | 71 | 24.4 ± 4.5 | 23.4 ± 5 | competitive CLIA |
| Malik Aubead et al., 2020 [60] | Iraq | case-control | Age-matched women without PCOS | 2003 Rotterdam criteria | 35 | 27.2 ± 6.7 | 29.4 ± 3.1 | 35 | 28.3 ± 7.2 | 27.7 ± 3.6 | ND |
| Mitkov et al., 2015 [61] | Bulgaria | case-control | Age-, BMI-, TSH-matched euthyroid healthy women | 2003 Rotterdam criteria | 70 | 25.06 {0.69} | 26.5 {0.83} | 22 | 26.78 {1.7} | 23.36 {1.4} | CLIA |
| Mohammed et al., 2017 [62] | Sudan | case-control | Age-, TSH-matched infertile women without PCOS | 2003 Rotterdam criteria | 55 | 27.3 ± 5.2 | 28.2 ± 5.3 | 55 | 27.1 ± 4.8 | 25.3 ± 5.8 | ELISA |
| Ott et al., 2010 [63] | Austria | retrospective cohort study | Women without PCOS | 2003 Rotterdam criteria | 196 | 27.1 ± 5.1 | 25.5 ± 3.3 | 100 | 27.8 ± 6.7 | 27.3 ± 5.7 | ND |
| Petrikova et al., 2015 [64] | Slovak Republic | case-control | Age-, TSH-matched healthy women (no history of autoimmune disease) | 2003 Rotterdam criteria | 64 | 31 ± 4.5 | 28.08 ± 6.91 | 68 | 29 ± 3.9 | 21.31 ± 3.05 | CLIA |
| Saleh et al., 2021 [65] | Iraq | case-control | Healthy women | 2003 Rotterdam criteria | 50 | [18; 39] | ND | 25 | ND | ND | CLIA |
| Vryonidou et al., 2025 [66] | Greece | case-control | Age-, BMI-, TSH-matched women without PCOS (no history of thyroid disease) | NIH | 257 | 24.56 ± 5.98 | 27.96 ± 7.15 | 143 | 25.17 ± 5.97 | 26.58 ± 7.34 | ECLIA |
| Yasar et al., 2016 [67] | Iraq | case-control | Age-, BMI-, TSH-matched overweight or obese healthy women (no history of thyroid disease) | 2003 Rotterdam criteria | 122 | 25.65 ± 5.89 | 33.51 ± 5.16 | 65 | 27.1 ± 7.53 | 32.31 ± 5.31 | CLIA |
| Age-, BMI-, TSH-matched healthy women with normal BMI (no history of thyroid disease) | 2003 Rotterdam criteria | 95 | 23.98 ± 6.11 | 21.96 ± 1.7 | 66 | 25.15 ± 7.03 | 21.47 ± 1.97 | CLIA | |||
- ·
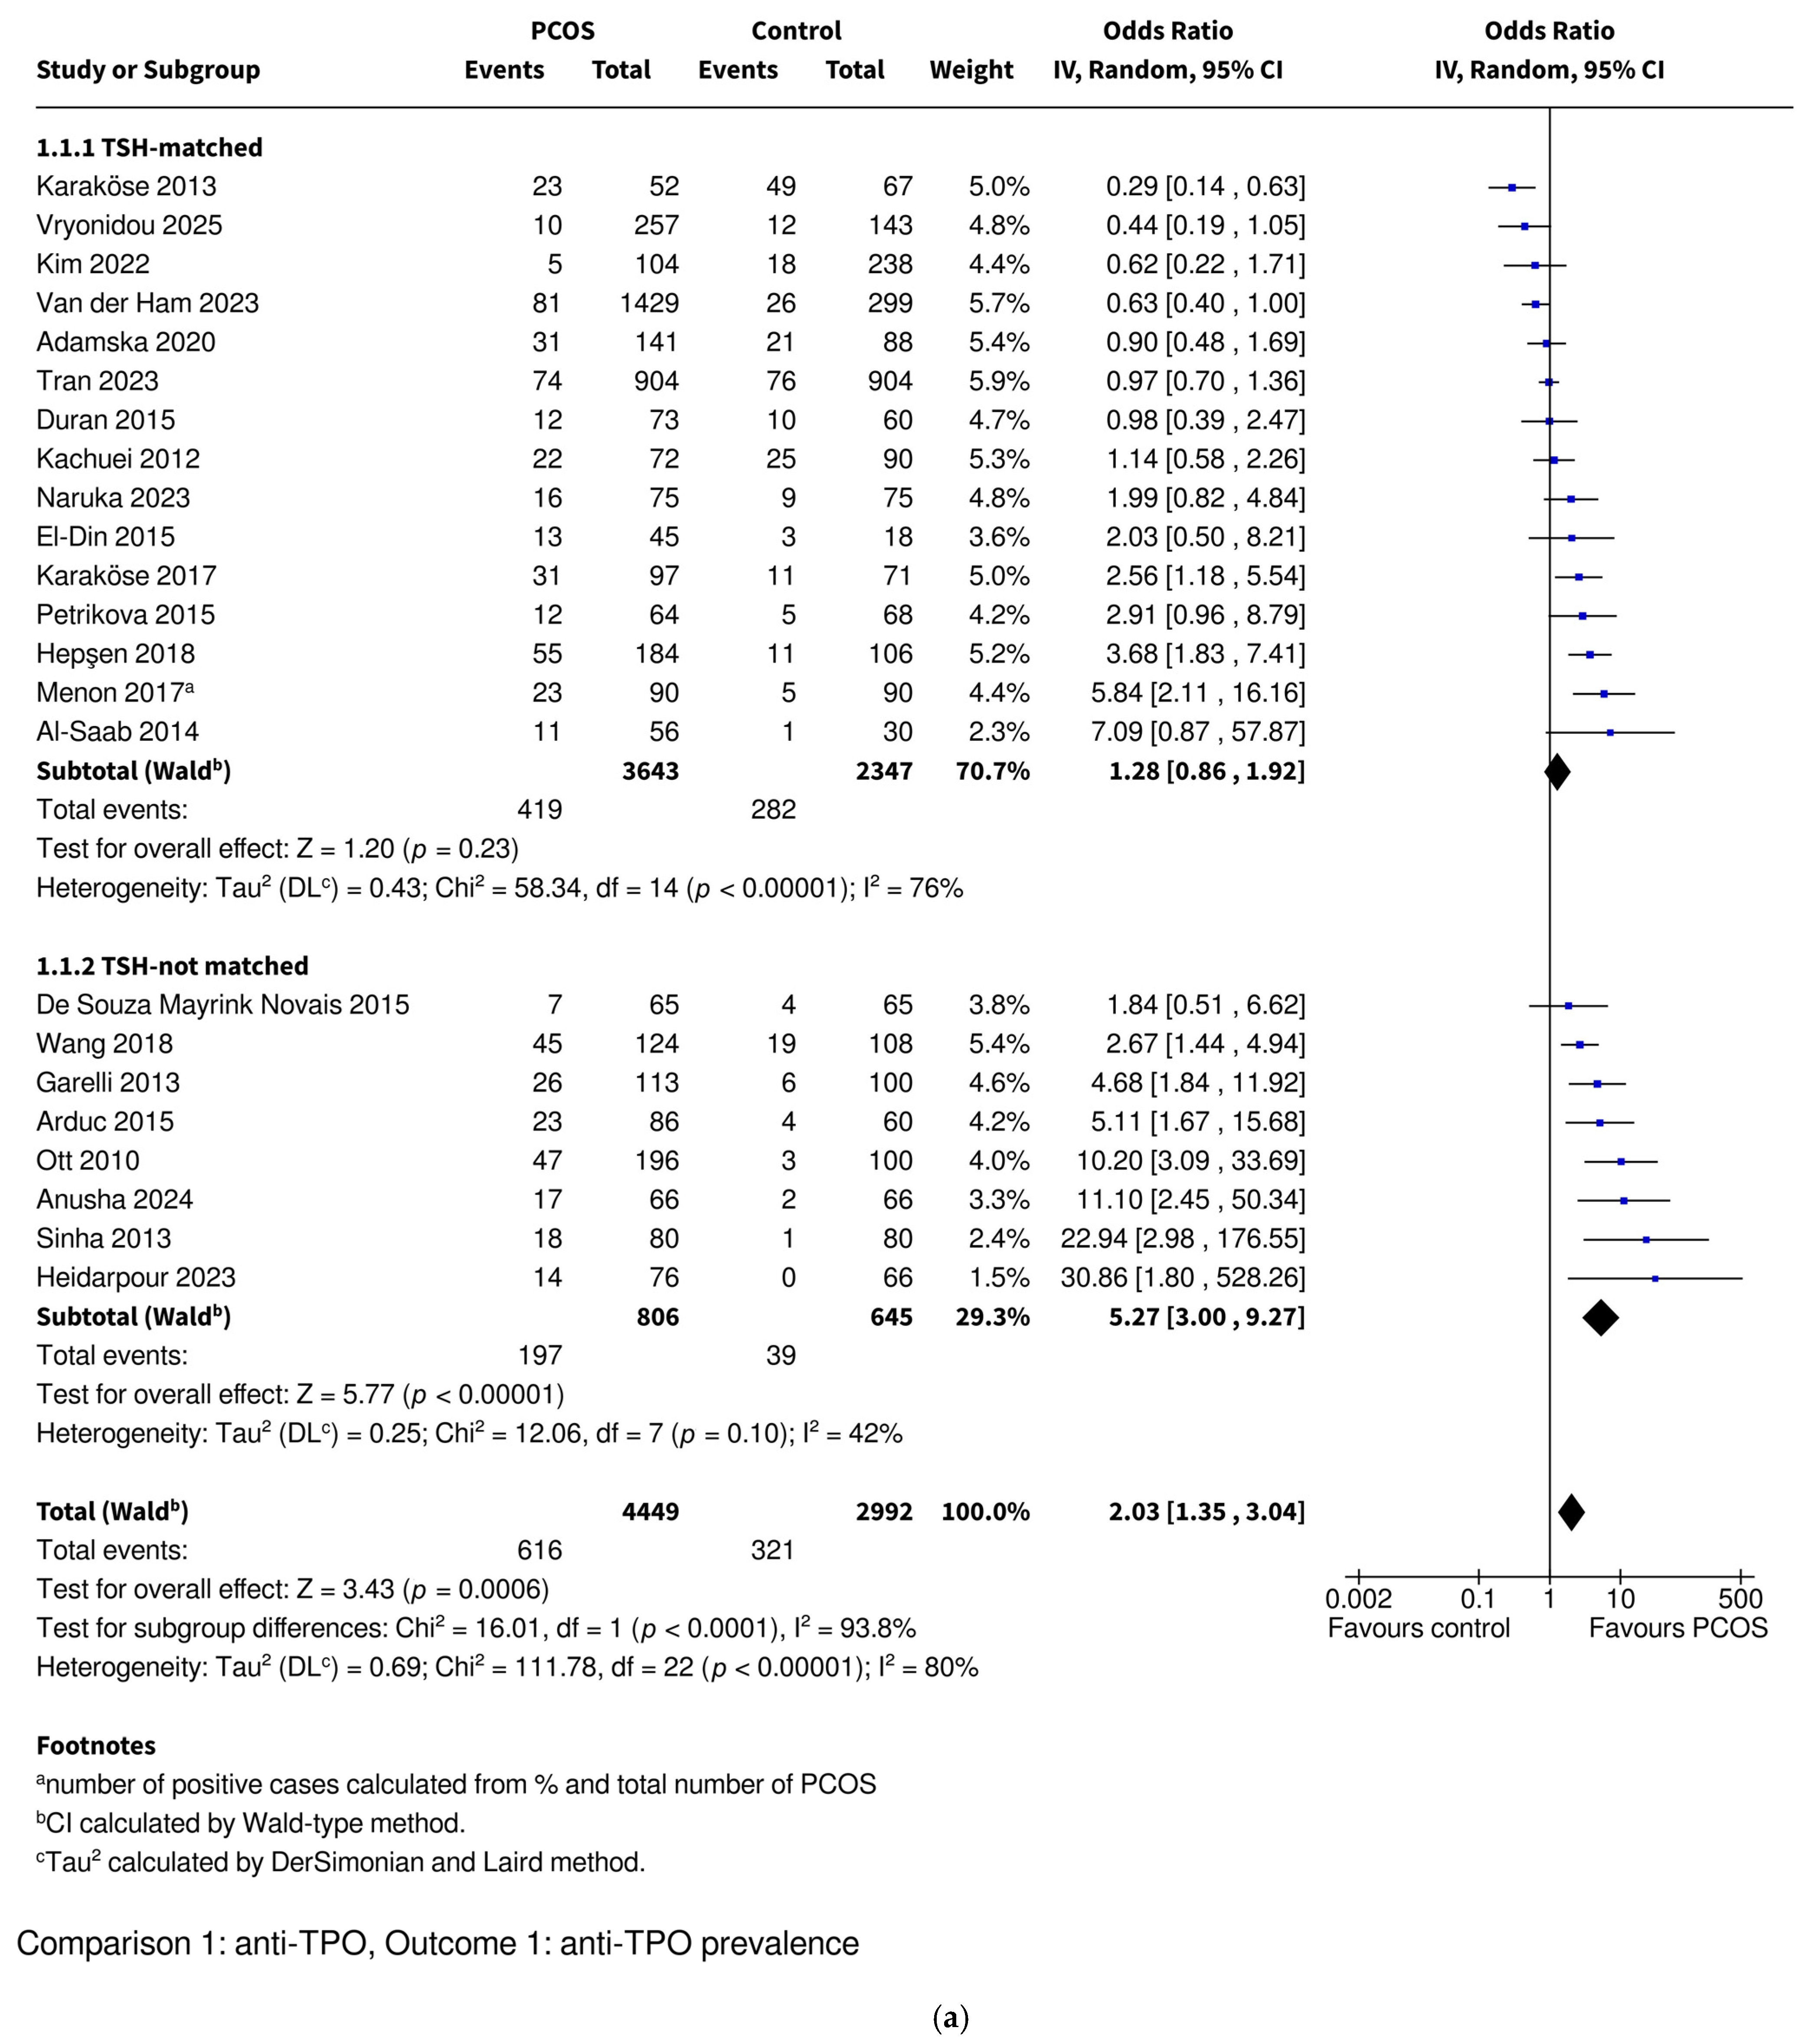
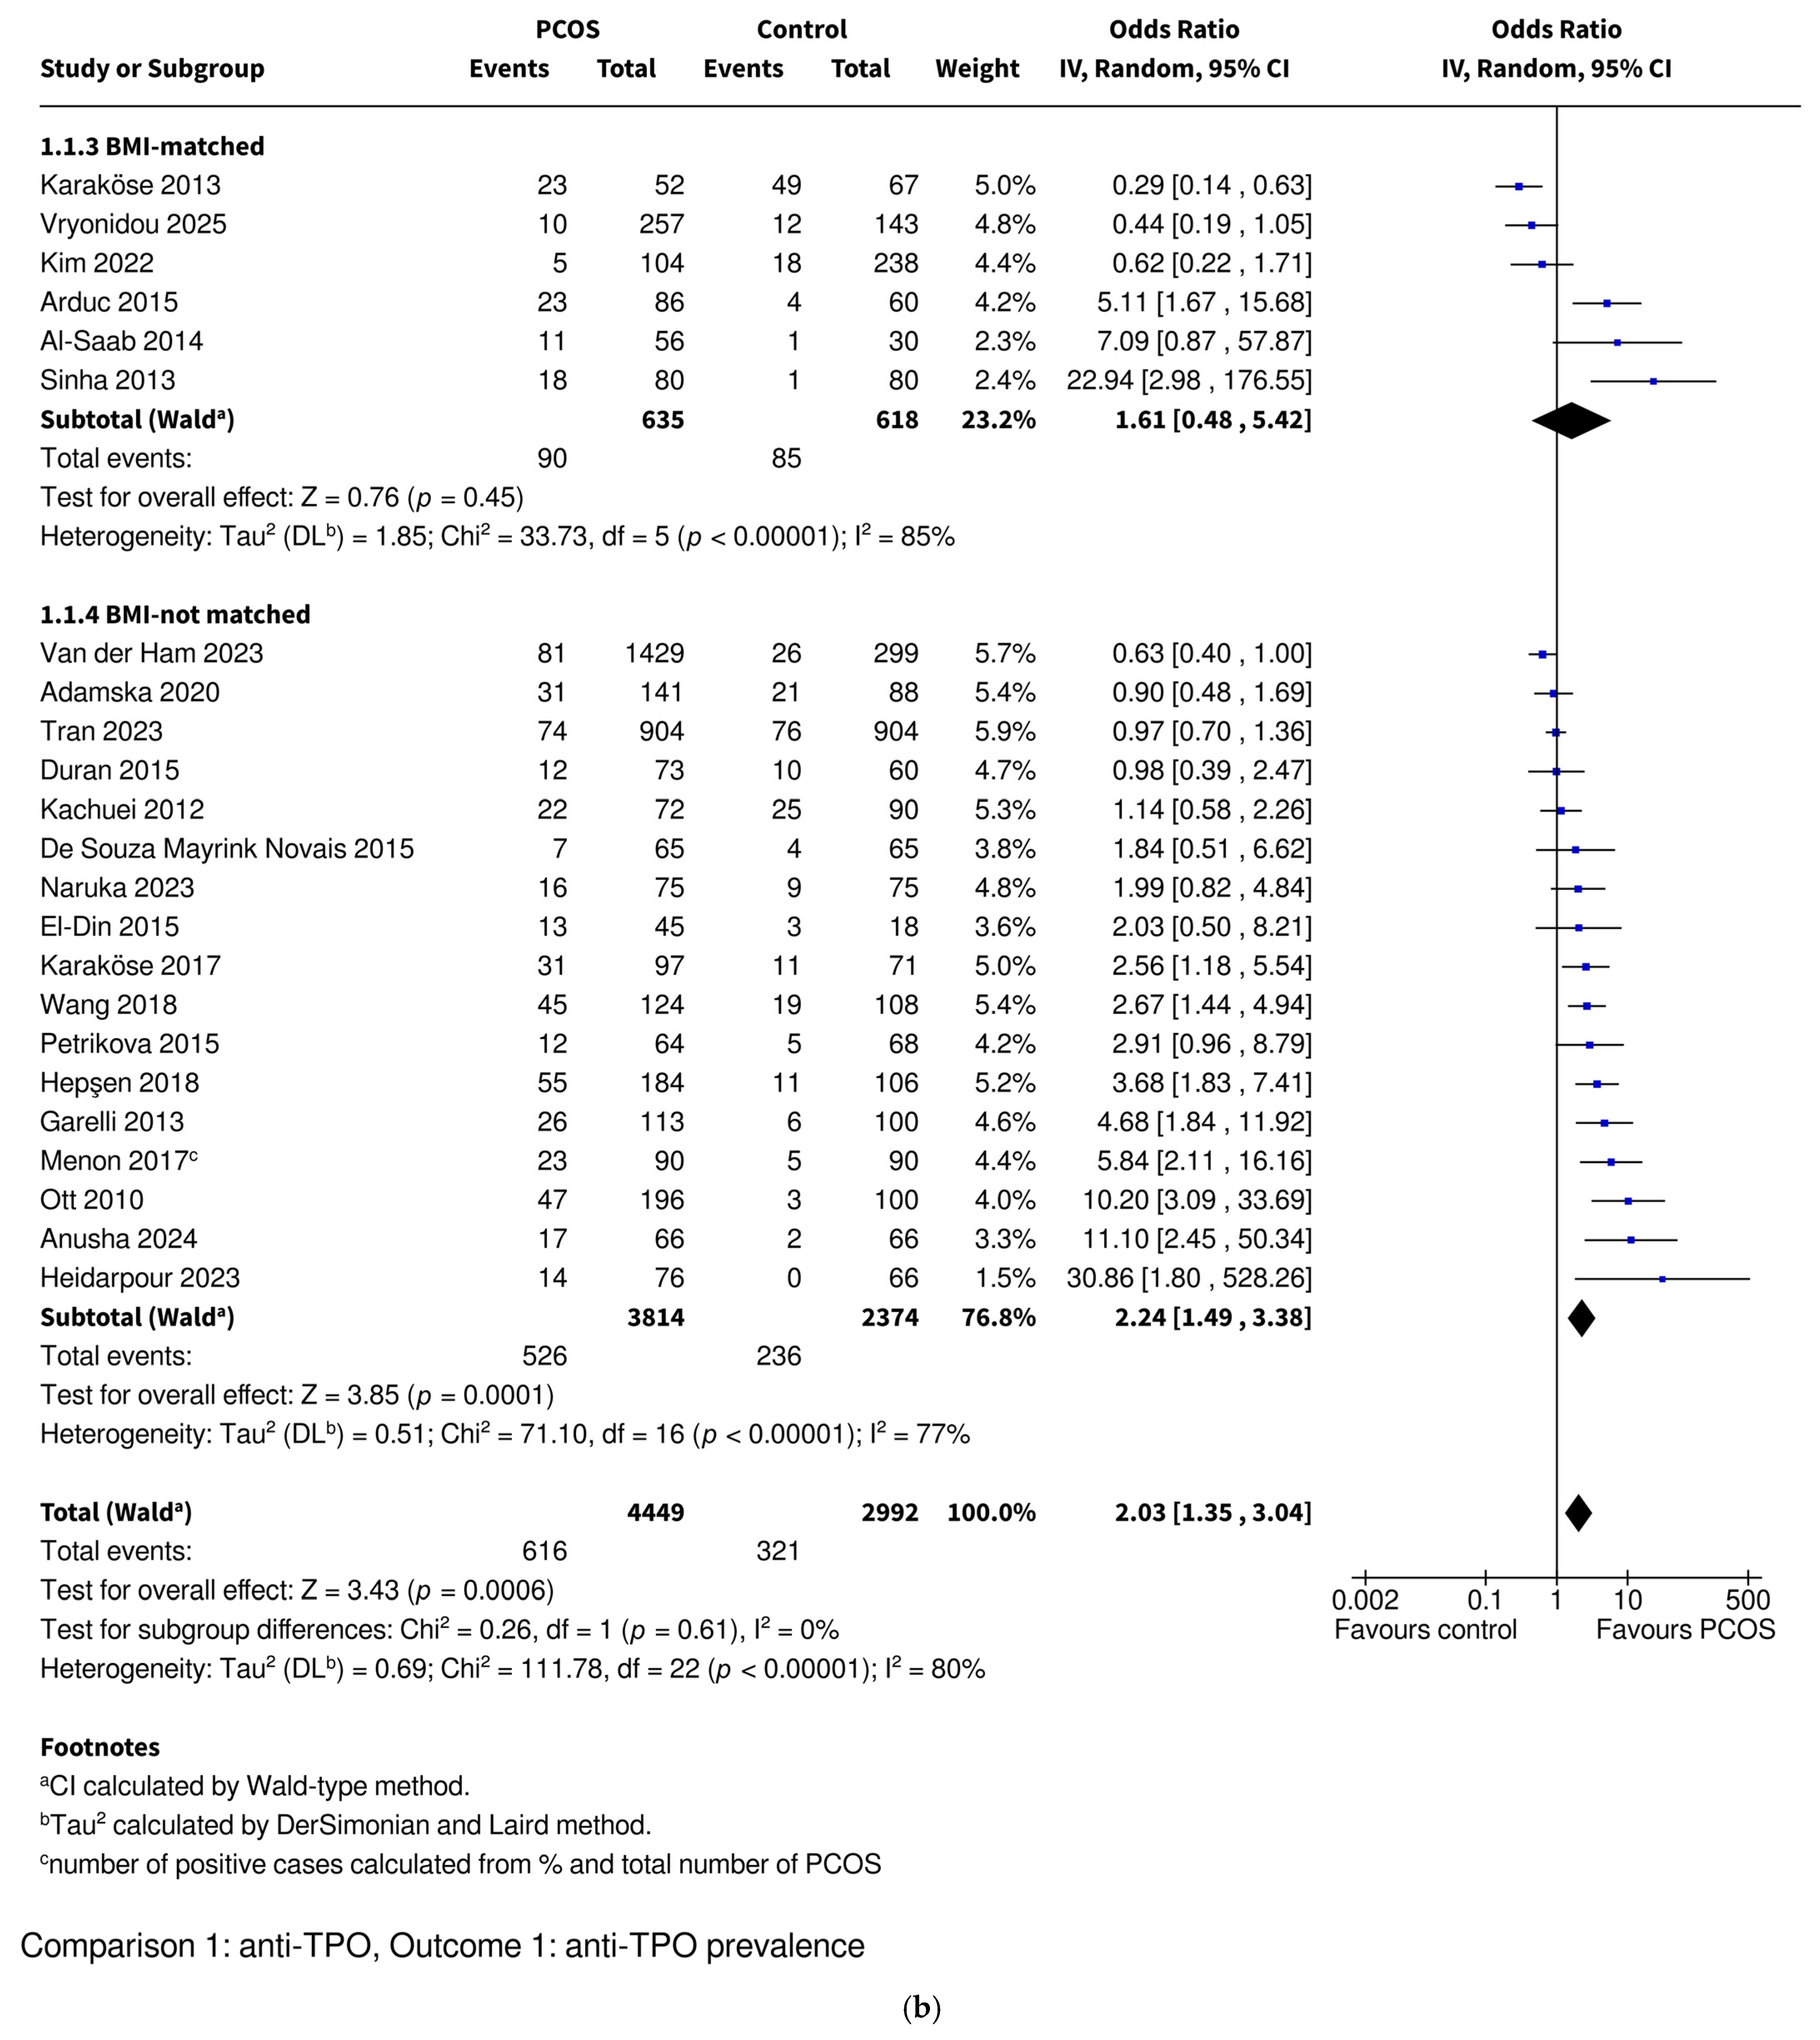
- Anti-TPO antibody prevalence was found to be significantly higher in the women with PCOS in 13 studies, while 10 studies reported no significant difference.
- ·
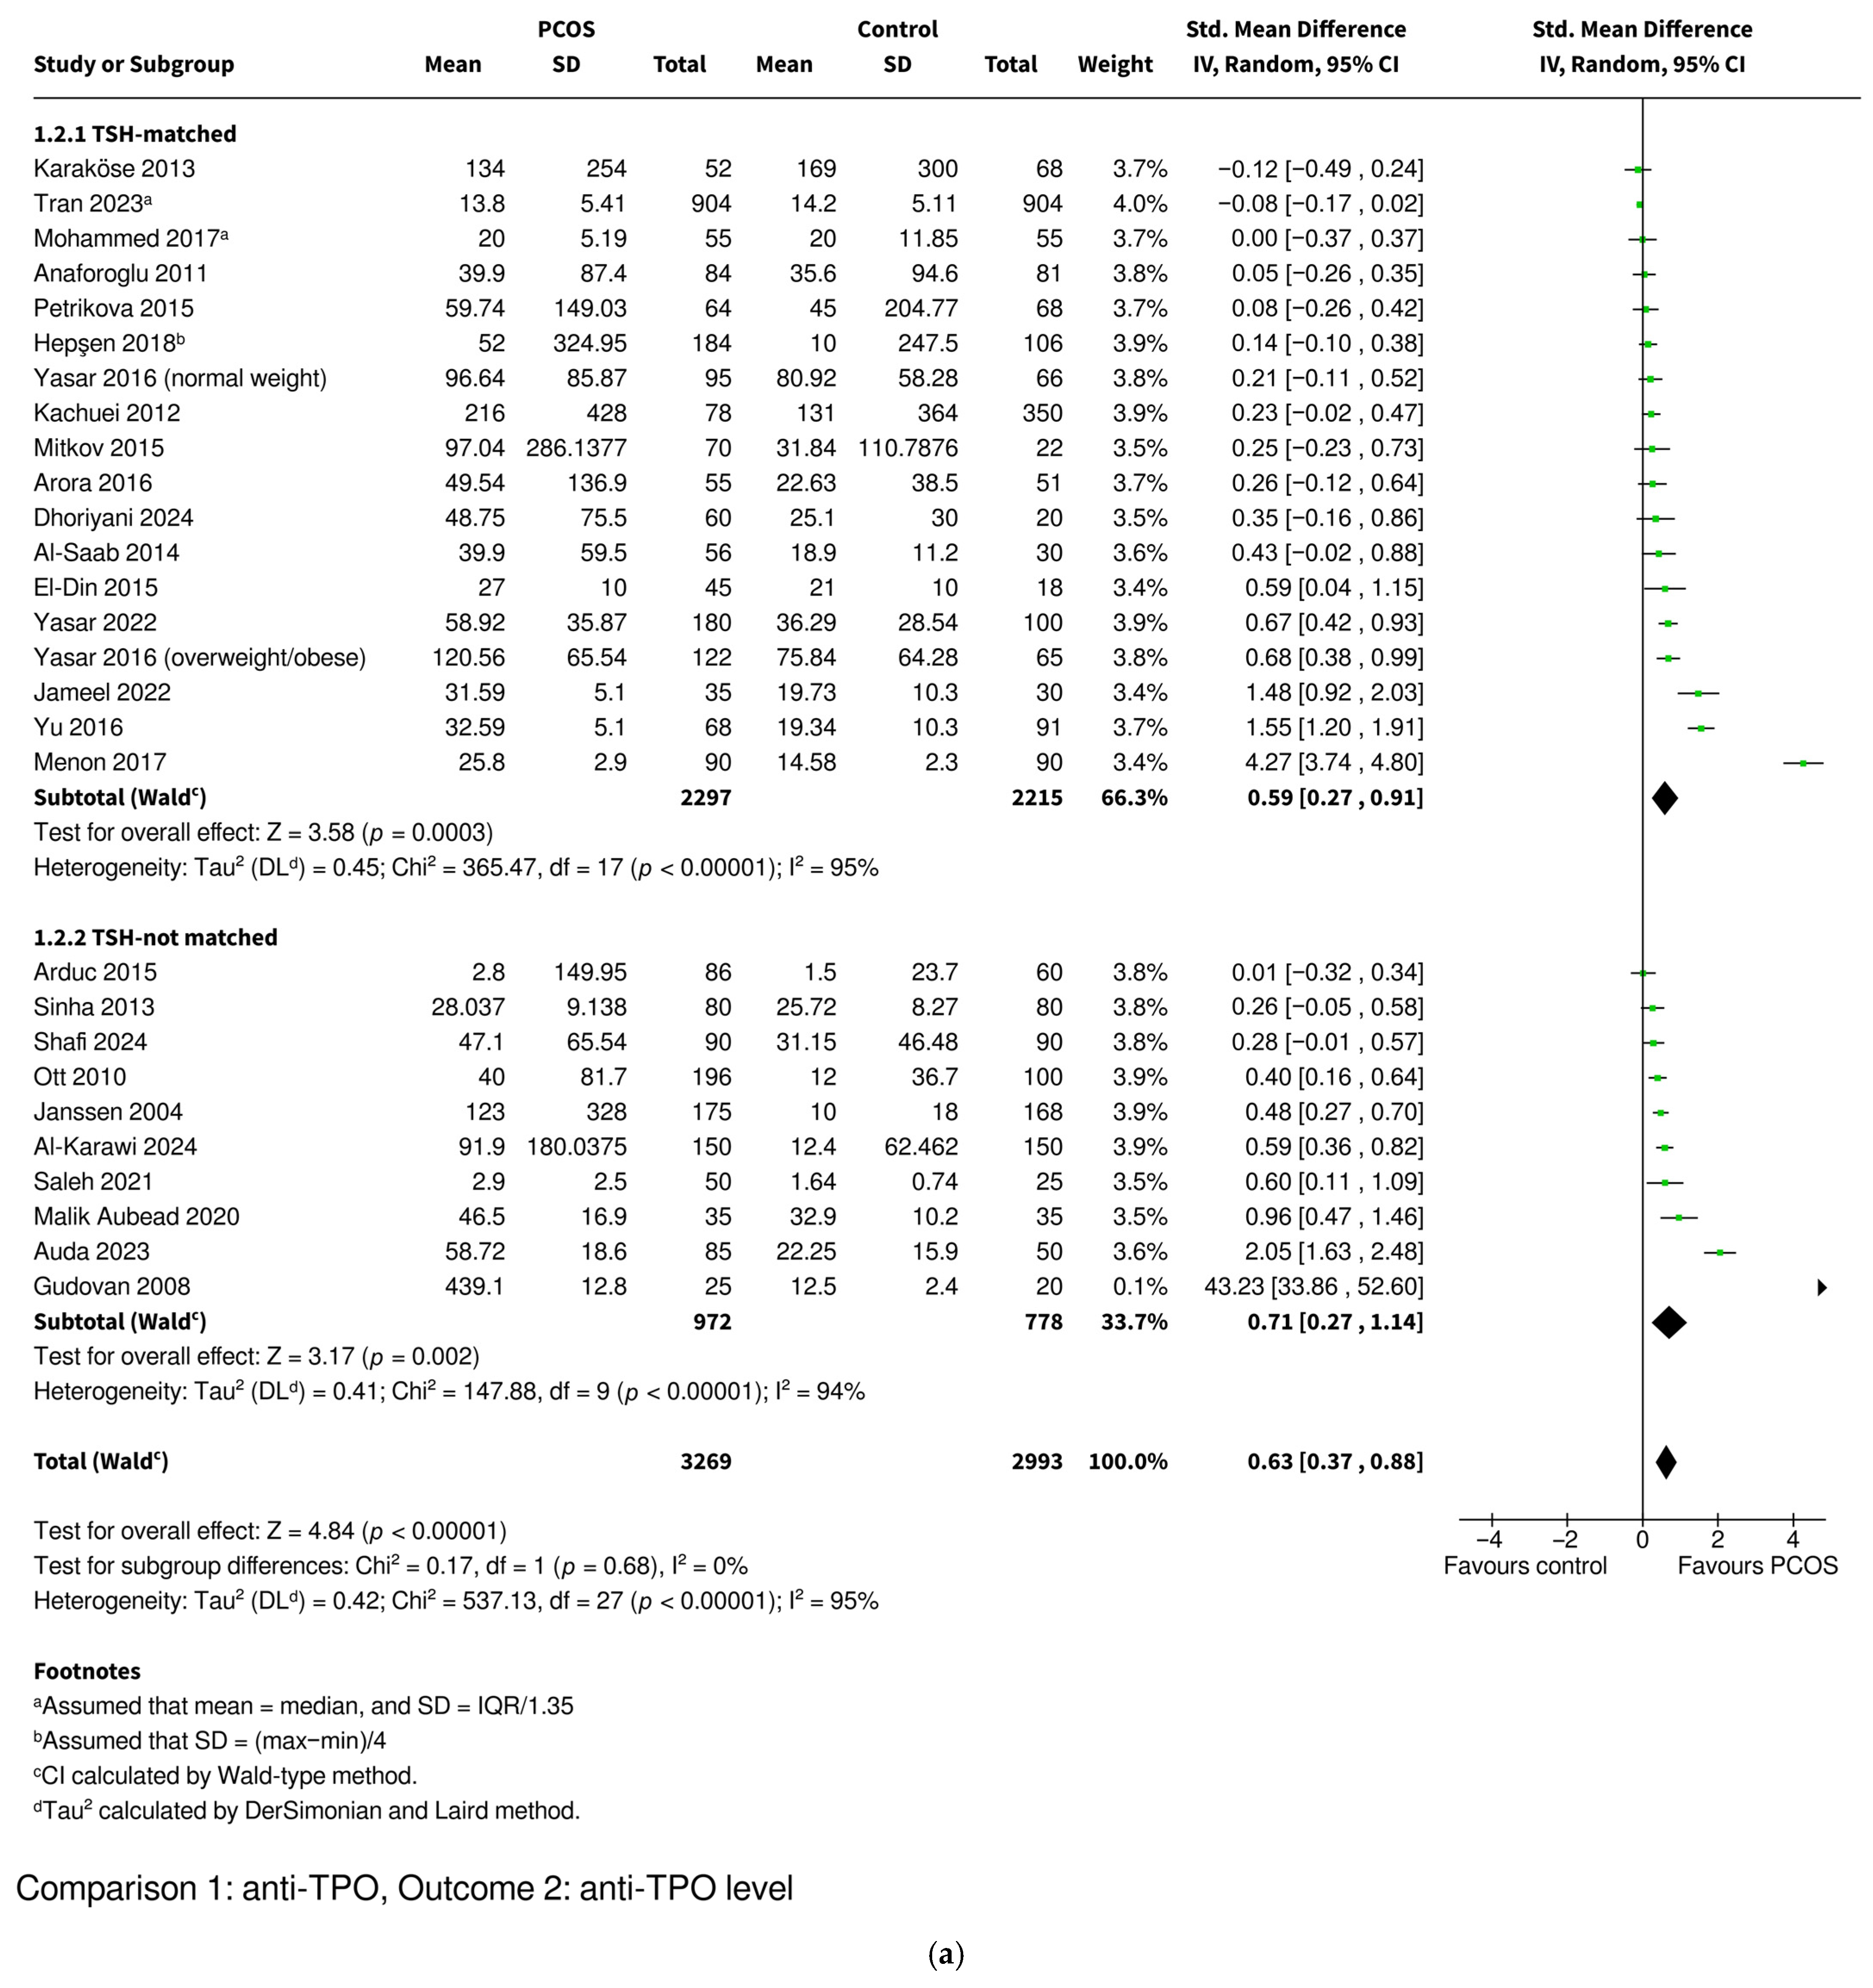
- Anti-TPO levels were significantly elevated in the women with PCOS in 16 studies, with 11 studies observing no significant difference.
- ·
- Anti-TG antibody prevalence was significantly higher in the women with PCOS in five studies, whereas nine found no significant difference.
- ·
- Anti-TG levels were significantly increased in 10 studies, while 9 reported comparable levels between the PCOS and control groups.
3.3. Main Findings
3.3.1. Anti-TPO Prevalence
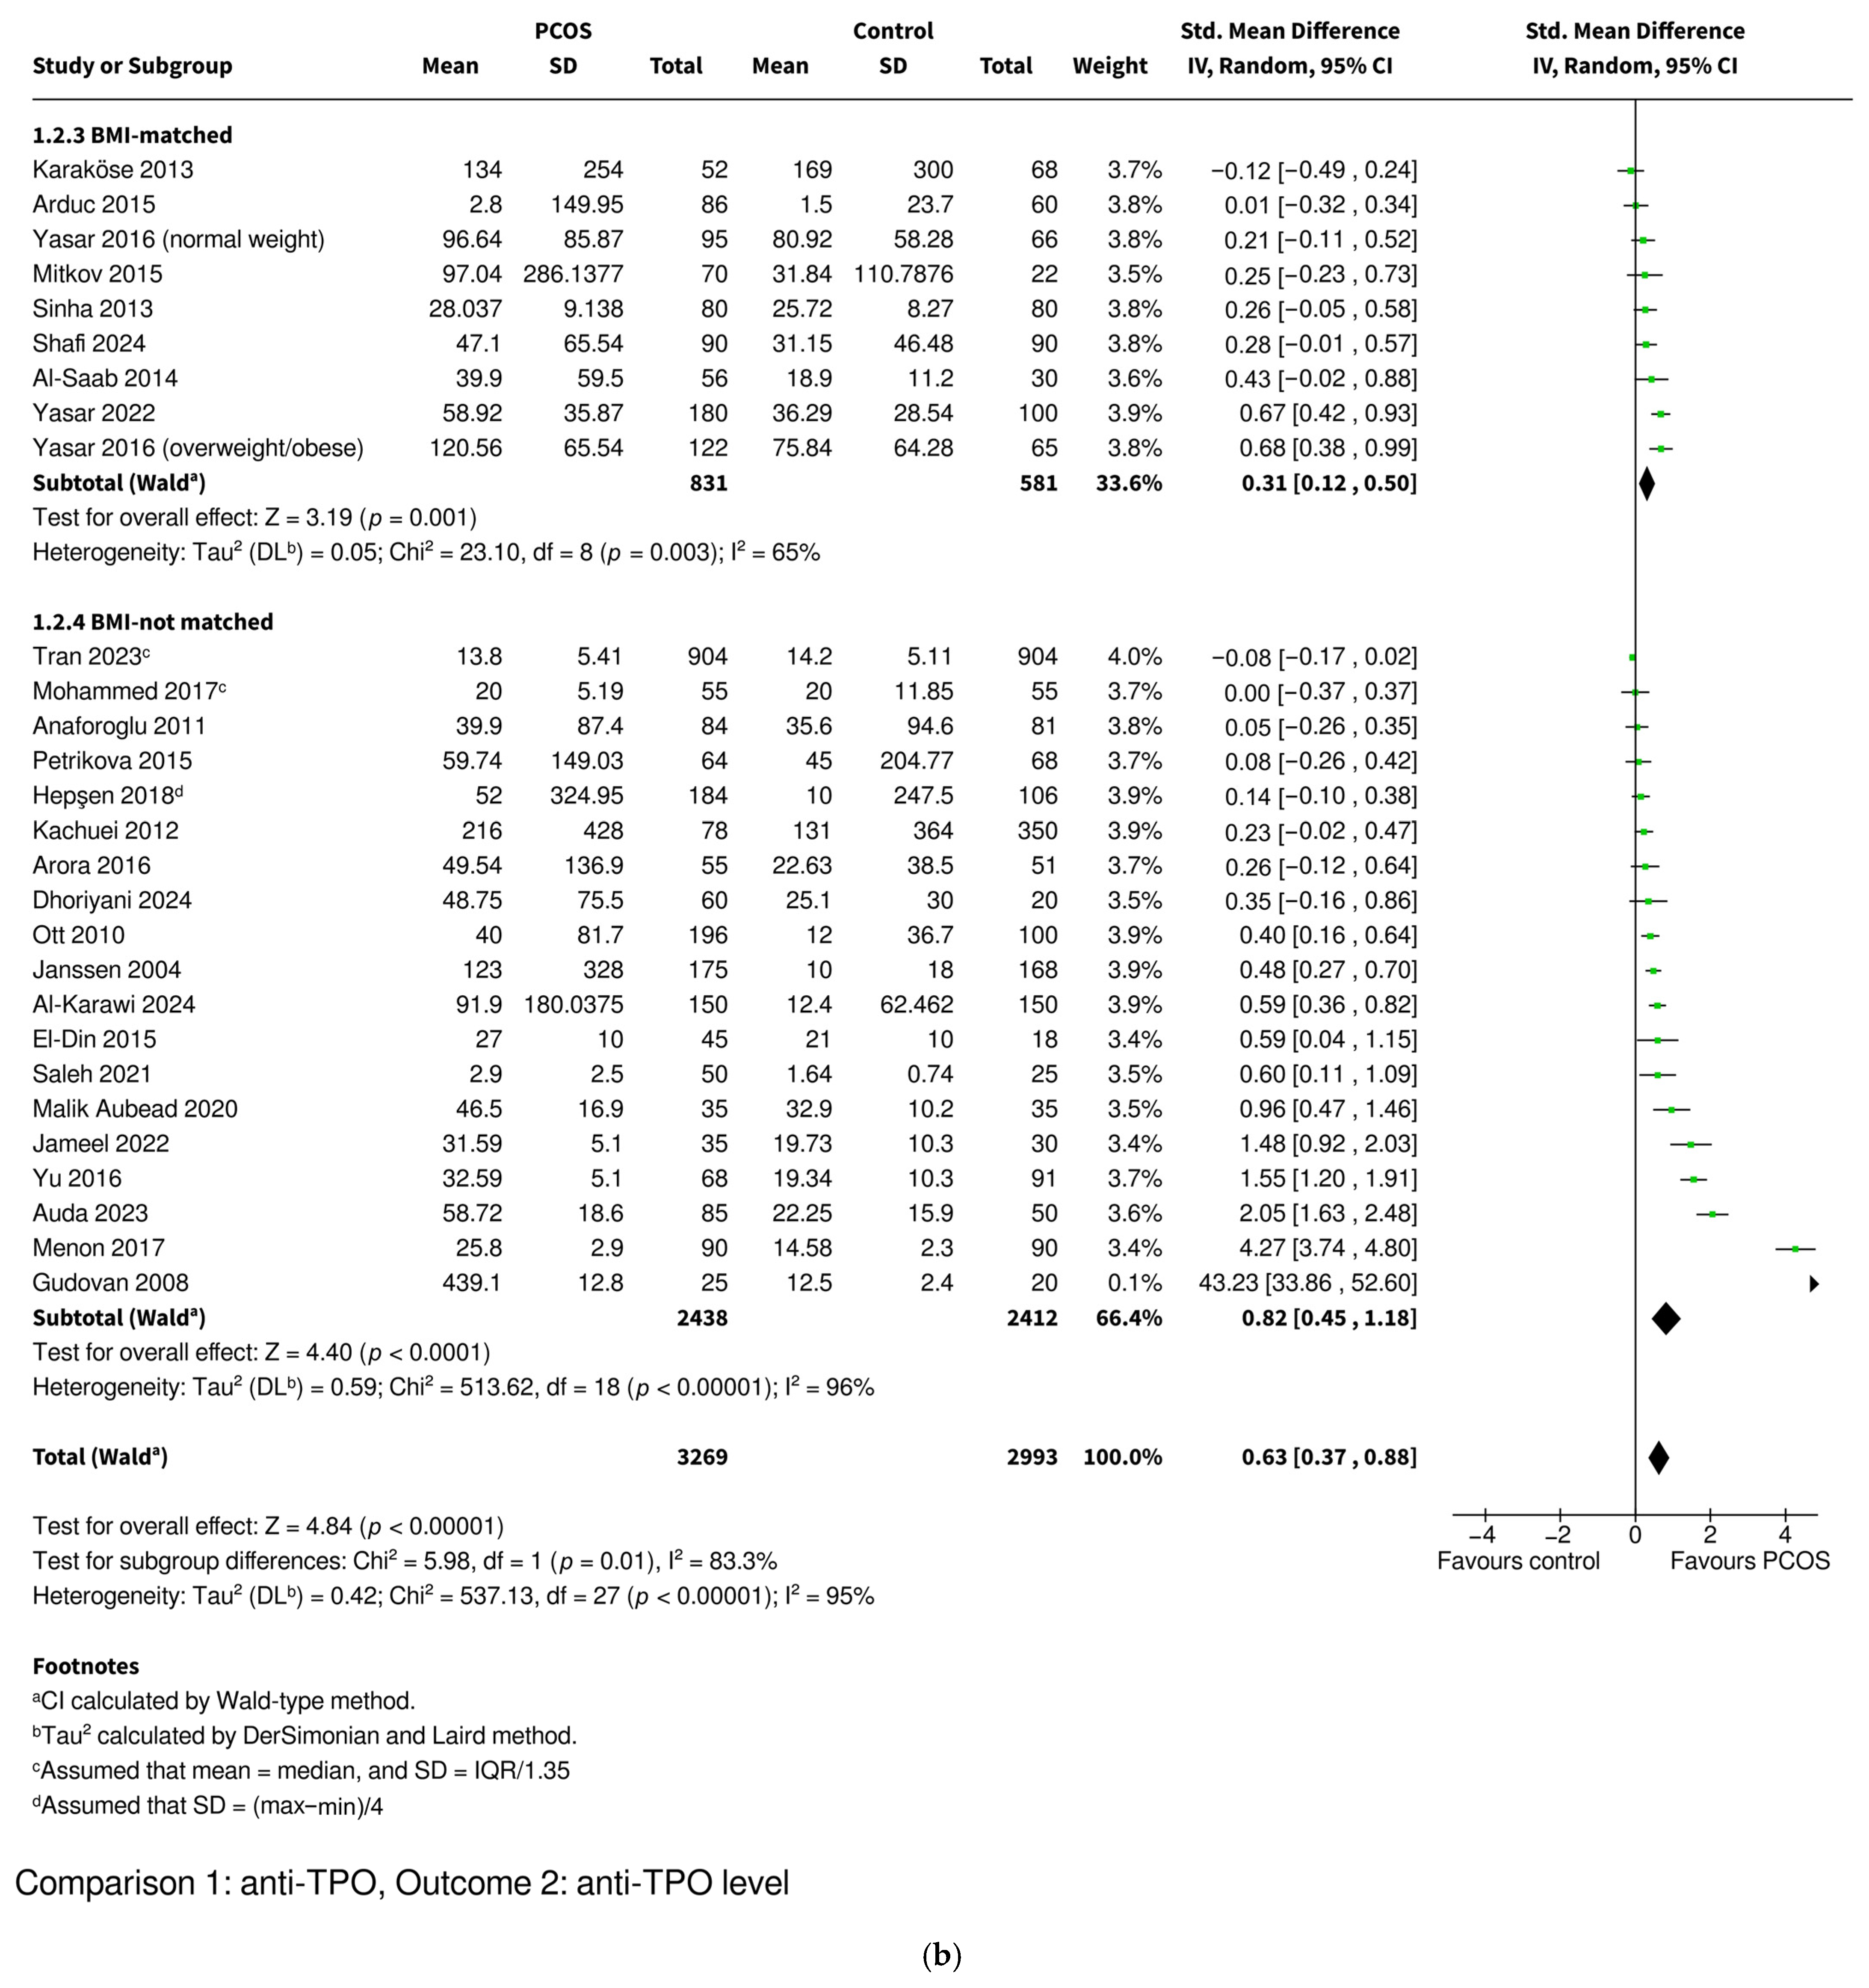
3.3.2. Anti-TPO Level
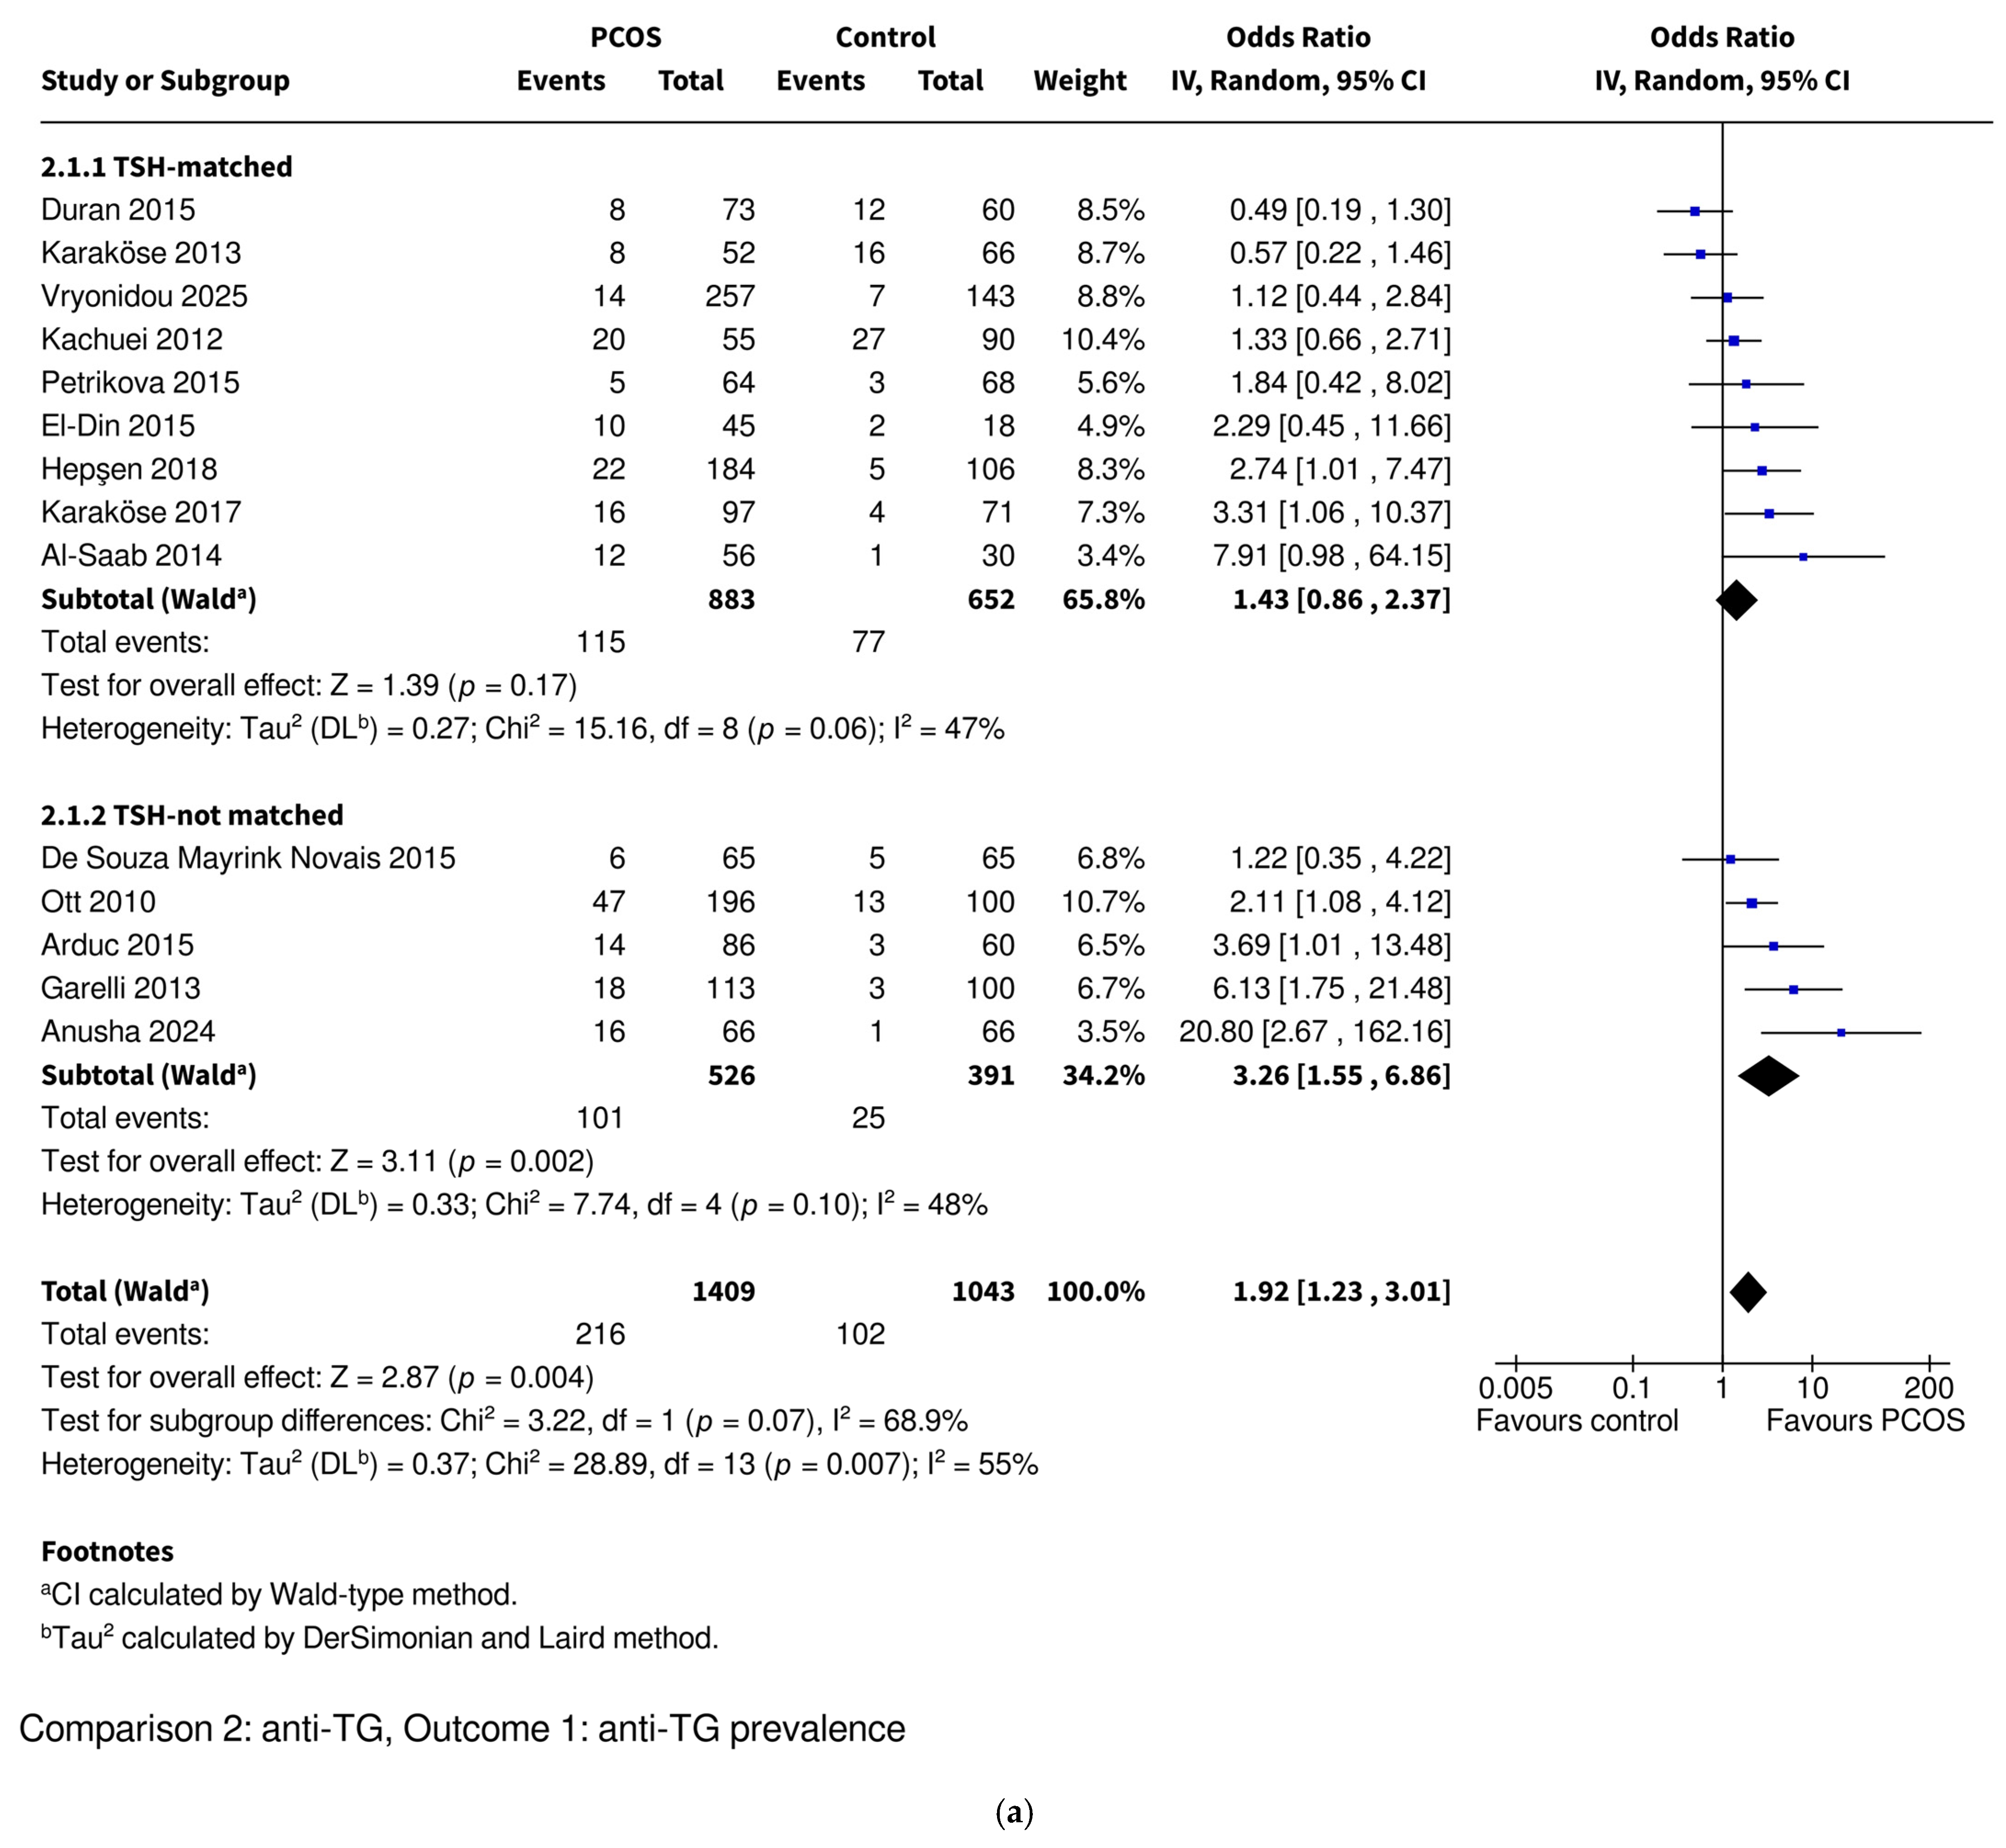
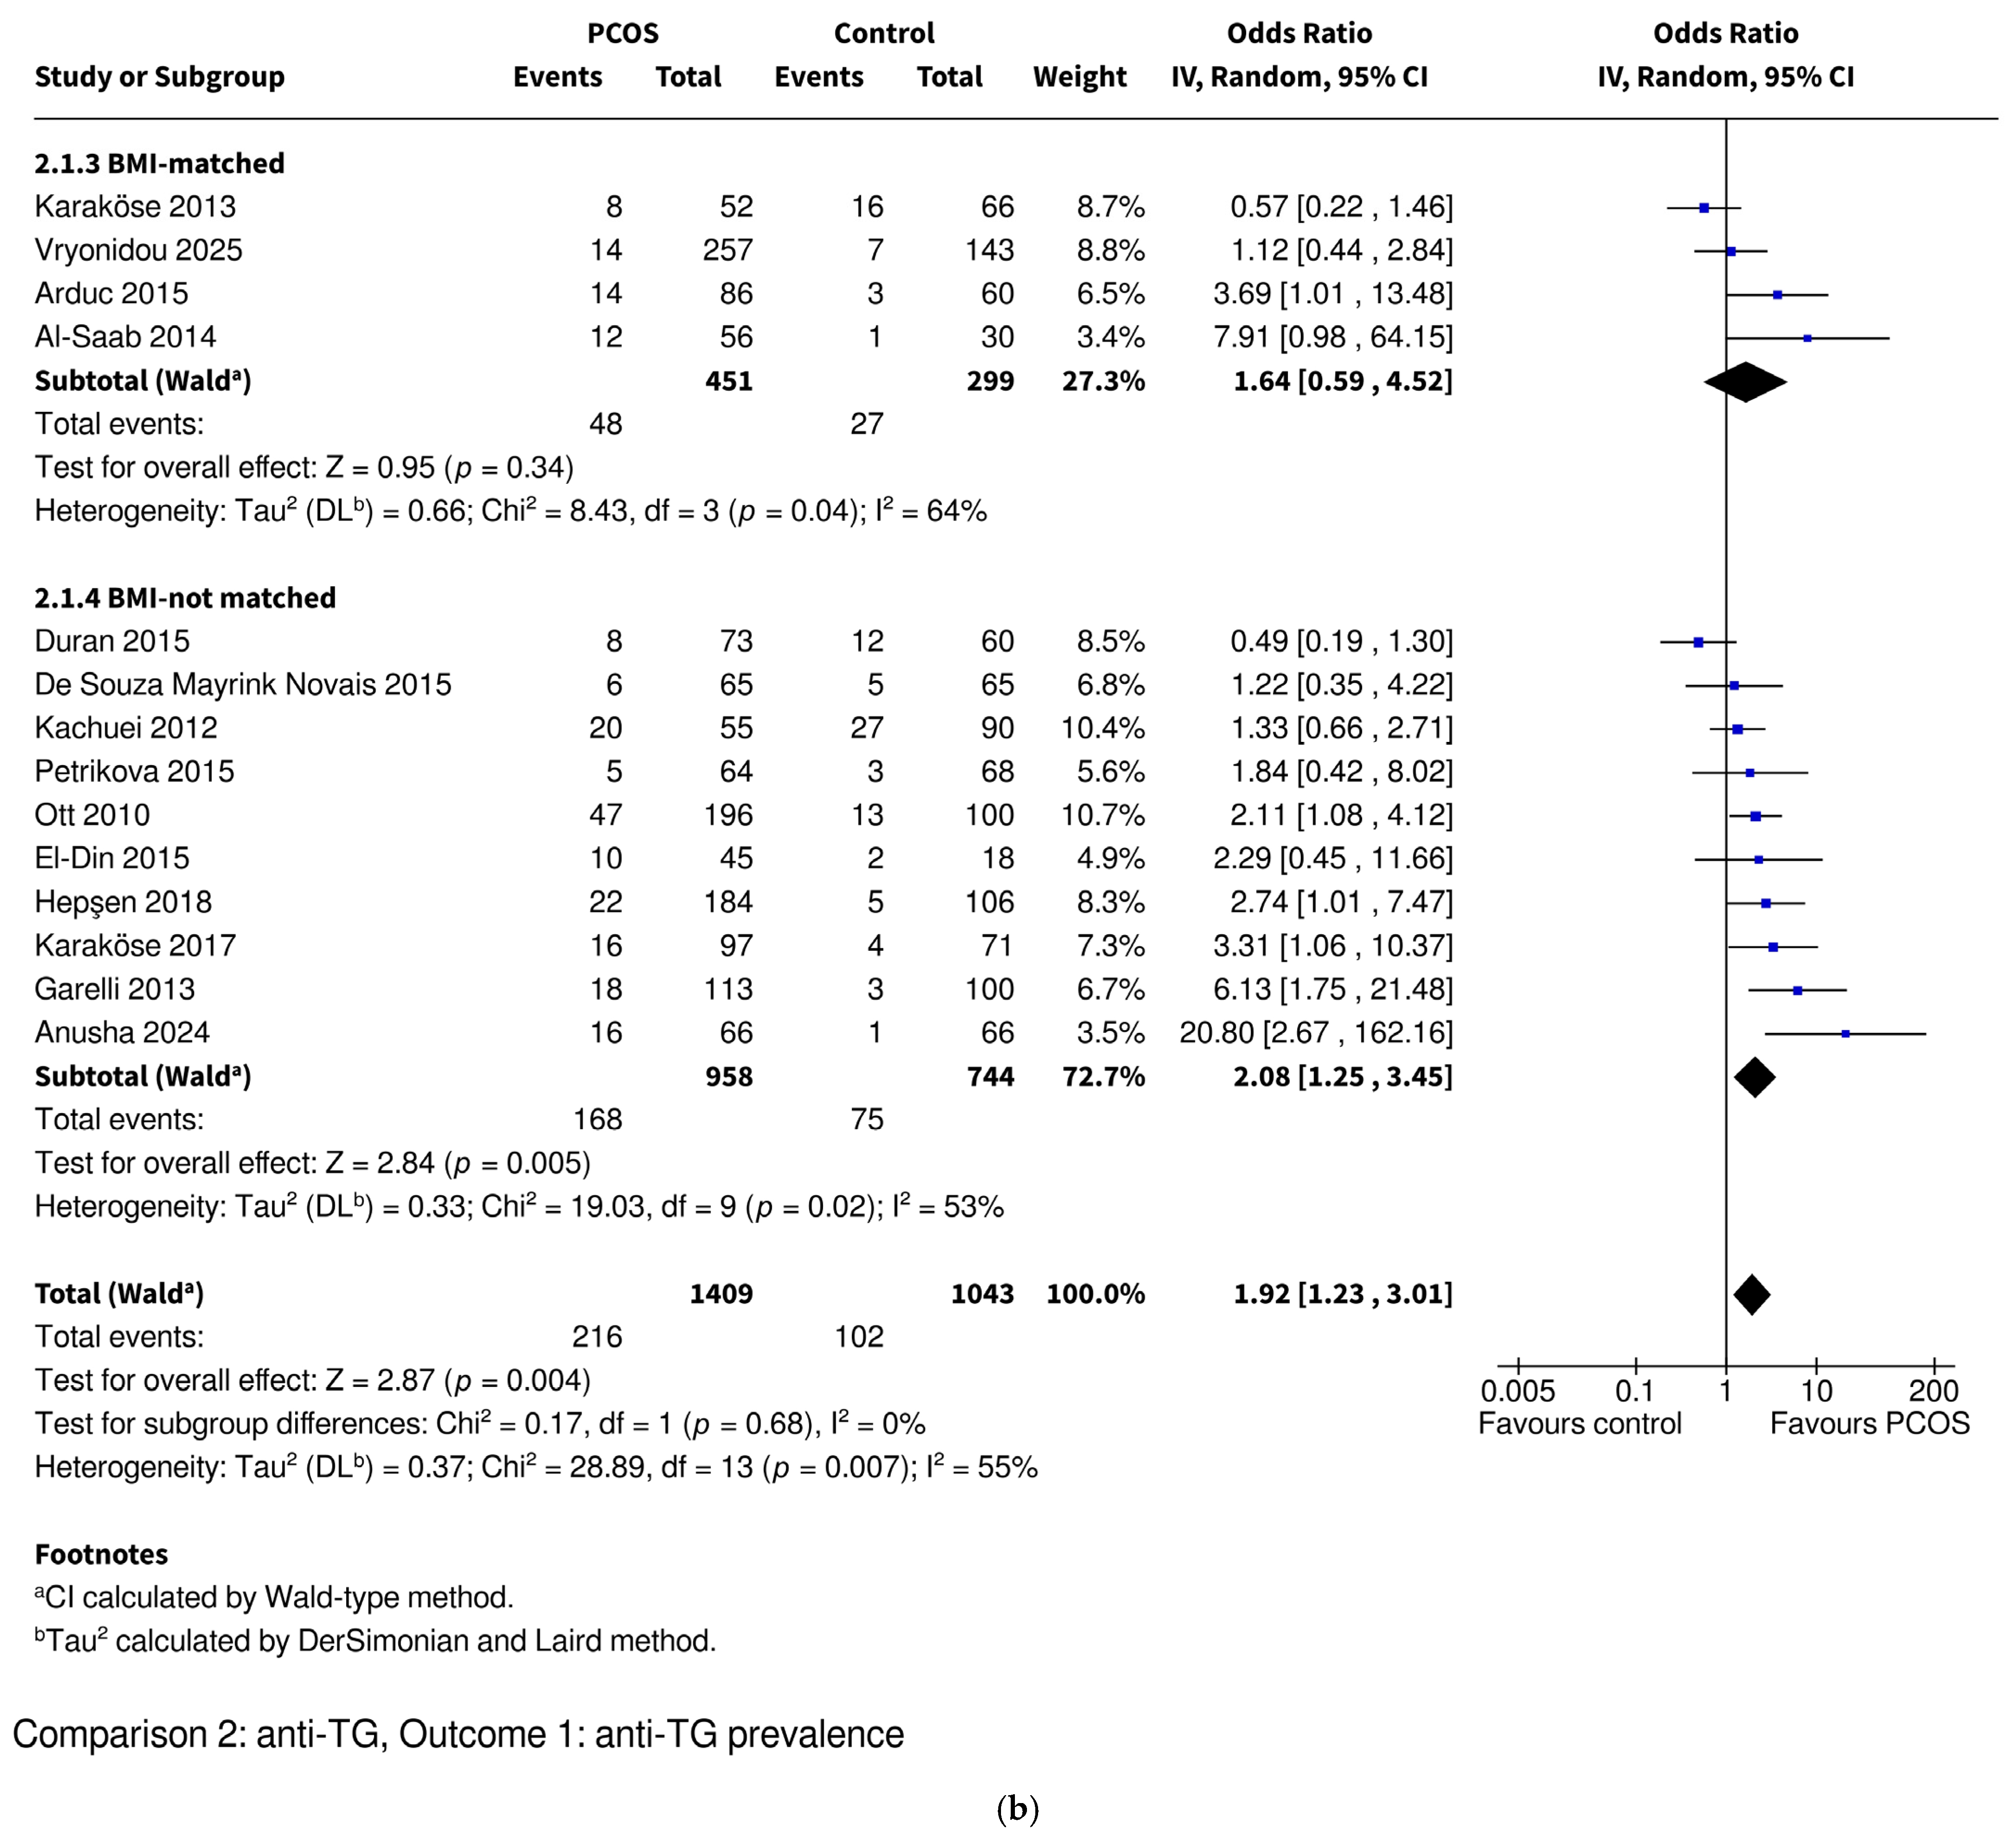
3.3.3. Anti-TG Prevalence
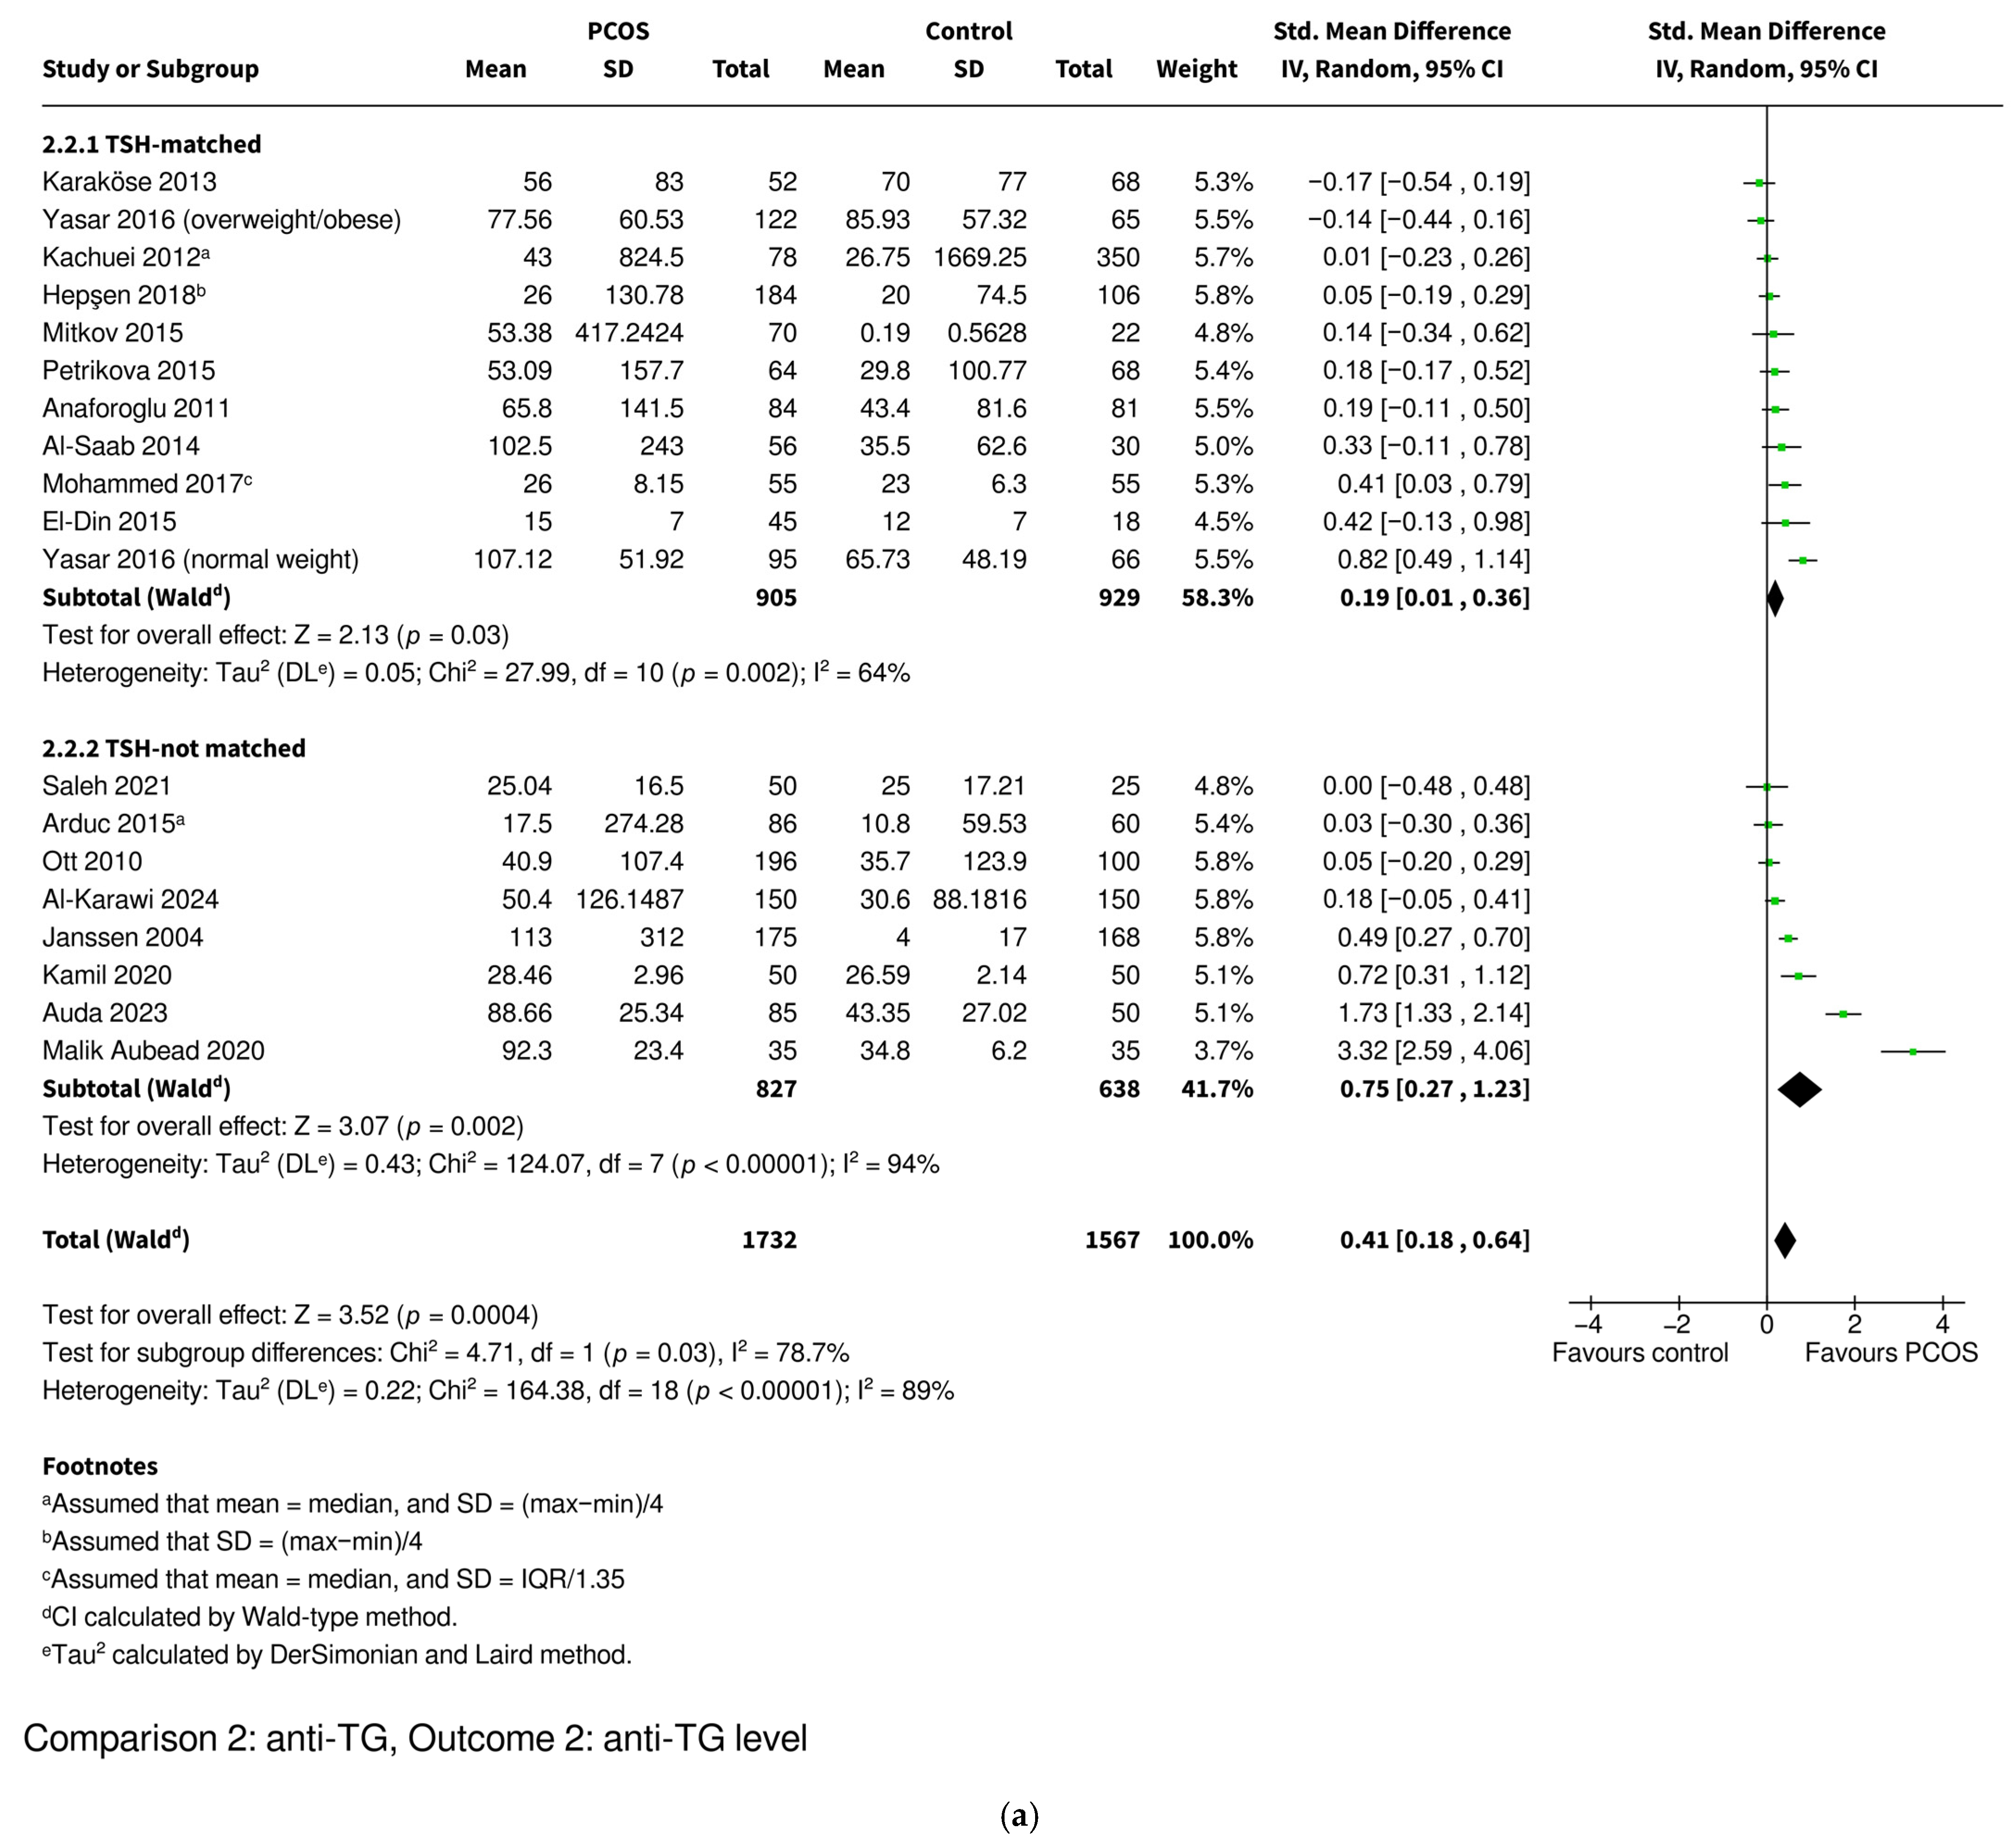
3.3.4. Anti-TG Level
4. Discussion
5. Conclusions
Supplementary Materials
Author Contributions
Funding
Data Availability Statement
Conflicts of Interest
References
- Ganie, M.A.; Vasudevan, V.; Wani, I.A.; Baba, M.S.; Arif, T.; Rashid, A. Epidemiology, pathogenesis, genetics & management of polycystic ovary syndrome in India. Indian J. Med. Res. 2019, 150, 333–344. [Google Scholar] [CrossRef]
- Cunha, A.; Povoa, A.M. Infertility management in women with polycystic ovary syndrome: A review. Porto Biomed. J. 2021, 6, e116. [Google Scholar] [CrossRef]
- Su, P.; Chen, C.; Sun, Y. Physiopathology of polycystic ovary syndrome in endocrinology, metabolism and inflammation. J. Ovarian Res. 2025, 18, 34. [Google Scholar] [CrossRef] [PubMed]
- Christakou, C.D.; Diamanti-Kandarakis, E. Role of androgen excess on metabolic aberrations and cardiovascular risk in women with polycystic ovary syndrome. Womens Health 2008, 4, 583–594. [Google Scholar] [CrossRef] [PubMed]
- Liu, Q.; Tang, B.; Zhu, Z.; Kraft, P.; Deng, Q.; Stener-Victorin, E.; Jiang, X. A genome-wide cross-trait analysis identifies shared loci and causal relationships of type 2 diabetes and glycaemic traits with polycystic ovary syndrome. Diabetologia 2022, 65, 1483–1494. [Google Scholar] [CrossRef]
- Cooney, L.G.; Lee, I.; Sammel, M.D.; Dokras, A. High prevalence of moderate and severe depressive and anxiety symptoms in polycystic ovary syndrome: A systematic review and meta-analysis. Hum. Reprod. 2017, 32, 1075–1091. [Google Scholar] [CrossRef] [PubMed]
- Rao, P.; Bhide, P. Controversies in the diagnosis of polycystic ovary syndrome. Ther. Adv. Reprod. Health 2020, 14, 2633494120913032. [Google Scholar] [CrossRef]
- Teede, H.J.; Tay, C.T.; Laven, J.J.E.; Dokras, A.; Moran, L.J.; Piltonen, T.T.; Costello, M.F.; Boivin, J.; Redman, L.M.; Boyle, J.A.; et al. Recommendations From the 2023 International Evidence-based Guideline for the Assessment and Management of Polycystic Ovary Syndrome. J. Clin. Endocrinol. Metab. 2023, 108, 2447–2469. [Google Scholar] [CrossRef]
- Sadeghi, H.M.; Adeli, I.; Calina, D.; Docea, A.O.; Mousavi, T.; Daniali, M.; Nikfar, S.; Tsatsakis, A.; Abdollahi, M. Polycystic Ovary Syndrome: A Comprehensive Review of Pathogenesis, Management, and Drug Repurposing. Int. J. Mol. Sci. 2022, 23, 583. [Google Scholar] [CrossRef]
- Azziz, R. How polycystic ovary syndrome came into its own. F S Sci. 2021, 2, 2–10. [Google Scholar] [CrossRef]
- Ee, C.; Tay, C.T. Pharmacological management of polycystic ovary syndrome. Aust. Prescr. 2024, 47, 109–112. [Google Scholar] [CrossRef]
- Dutta, C.; Maddukuri, S. Beyond Hormones: A Systematic Review of the Risk of Cardiovascular Diseases in Polycystic Ovary Syndrome. Cureus 2024, 16, e72987. [Google Scholar] [CrossRef]
- Silva, M.S.B.; Campbell, R.E. Polycystic Ovary Syndrome and the Neuroendocrine Consequences of Androgen Excess. Compr. Physiol. 2022, 12, 3347–3369. [Google Scholar] [CrossRef]
- Rudnicka, E.; Suchta, K.; Grymowicz, M.; Calik-Ksepka, A.; Smolarczyk, K.; Duszewska, A.M.; Smolarczyk, R.; Meczekalski, B. Chronic Low Grade Inflammation in Pathogenesis of PCOS. Int. J. Mol. Sci. 2021, 22, 3789. [Google Scholar] [CrossRef]
- Murri, M.; Luque-Ramirez, M.; Insenser, M.; Ojeda-Ojeda, M.; Escobar-Morreale, H.F. Circulating markers of oxidative stress and polycystic ovary syndrome (PCOS): A systematic review and meta-analysis. Hum. Reprod. Update 2013, 19, 268–288. [Google Scholar] [CrossRef]
- Petrikova, J.; Lazurova, I.; Yehuda, S. Polycystic ovary syndrome and autoimmunity. Eur. J. Intern. Med. 2010, 21, 369–371. [Google Scholar] [CrossRef] [PubMed]
- Bahreiny, S.S.; Ahangarpour, A.; Amraei, M.; Mansouri, Z.; Pirsadeghi, A.; Kazemzadeh, R.; Javidan, M.; Karamali, N.; Bastani, M.N.; Dabbagh, M.R. Autoimmune thyroid disorders and polycystic ovary syndrome: Tracing links through systematic review and meta-analysis. J. Reprod. Immunol. 2024, 163, 104215. [Google Scholar] [CrossRef]
- Antonelli, A.; Ferrari, S.M.; Corrado, A.; Di Domenicantonio, A.; Fallahi, P. Autoimmune thyroid disorders. Autoimmun. Rev. 2015, 14, 174–180. [Google Scholar] [CrossRef] [PubMed]
- Ragusa, F.; Fallahi, P.; Elia, G.; Gonnella, D.; Paparo, S.R.; Giusti, C.; Churilov, L.P.; Ferrari, S.M.; Antonelli, A. Hashimotos’ thyroiditis: Epidemiology, pathogenesis, clinic and therapy. Best Pract. Res. Clin. Endocrinol. Metab. 2019, 33, 101367. [Google Scholar] [CrossRef] [PubMed]
- Du, D.; Li, X. The relationship between thyroiditis and polycystic ovary syndrome: A meta-analysis. Int. J. Clin. Exp. Med. 2013, 6, 880–889. [Google Scholar]
- Romitti, M.; Fabris, V.C.; Ziegelmann, P.K.; Maia, A.L.; Spritzer, P.M. Association between PCOS and autoimmune thyroid disease: A systematic review and meta-analysis. Endocr. Connect. 2018, 7, 1158–1167. [Google Scholar] [CrossRef] [PubMed]
- Ho, C.W.; Chen, H.H.; Hsieh, M.C.; Chen, C.C.; Hsu, S.P.; Yip, H.T.; Kao, C.H. Increased Risk of Polycystic Ovary Syndrome and It’s Comorbidities in Women with Autoimmune Thyroid Disease. Int. J. Environ. Res. Public Health 2020, 17, 2422. [Google Scholar] [CrossRef]
- Suchta, K.; Zeber-Lubecka, N.; Grymowicz, M.; Smolarczyk, R.; Kulecka, M.; Hennig, E.E. Autoimmune Processes and Chronic Inflammation as Independent Risk Factors for Metabolic Complications in Women with Polycystic Ovary Syndrome. Metabolites 2025, 15, 141. [Google Scholar] [CrossRef] [PubMed]
- Jia, C.; Zhang, L.; Liu, W.; Zhang, X.; Wu, H. Assessment of glucose and lipid metabolism in patients with polycystic ovary syndrome with and without Hashimoto’s thyroiditis. Medicine 2023, 102, e33205. [Google Scholar] [CrossRef] [PubMed]
- Carra, M.C.; Romandini, P.; Romandini, M. Risk of Bias Evaluation of Cross-Sectional Studies: Adaptation of the Newcastle-Ottawa Scale. J. Periodontal Res. 2025, 1–10. [Google Scholar] [CrossRef]
- Fuentes-Abolafio, I.J.; Stubbs, B.; Perez-Belmonte, L.M.; Bernal-Lopez, M.R.; Gomez-Huelgas, R.; Cuesta-Vargas, A.I. Physical functional performance and prognosis in patients with heart failure: A systematic review and meta-analysis. BMC Cardiovasc. Disord. 2020, 20, 512. [Google Scholar] [CrossRef]
- Azziz, R. Diagnostic criteria for polycystic ovary syndrome: A reappraisal. Fertil. Steril. 2005, 83, 1343–1346. [Google Scholar] [CrossRef]
- Wang, X.; Ding, X.; Xiao, X.; Xiong, F.; Fang, R. An exploration on the influence of positive simple thyroid peroxidase antibody on female infertility. Exp. Ther. Med. 2018, 16, 3077–3081. [Google Scholar] [CrossRef]
- Al-Karawi, A.S.; Kadhim, A.S. Exploring the role of autoantibodies in Iraqi females with polycystic ovary syndrome. J. Adv. Biotechnol. Exp. Ther. 2024, 7, 147–156. [Google Scholar] [CrossRef]
- Jameel, Z.Y.; Hamza, M.I. Association Between Lipid Profiles, Frequency of Thyroid Hormone and Insulin Resistance in Poly Cystic Ovarian Syndrome. Al-Nahrain J. Sci. 2022, 25, 1–8. [Google Scholar] [CrossRef]
- Kamil, R.A.; Abubaker, N.E.; Mohamed, S.A.; Ibrahim, M.A.; Abd Alla, A.B. Evaluation of thyroid hormones and anti-thyroglobulin antibodies among sudanese polycystic ovarian syndrome patients. Med. Mod. 2020, 27, 191–194. [Google Scholar] [CrossRef]
- Heidarpour, H.; Hooshmand, F.; Isapanah Amlashi, F.; Khodabakhshi, B.; Mahmoudi, M.; Amiriani, T.; Besharat, S. Unexpected high frequency of anti-thyroid peroxidase (anti-TPO) antibodies in Golestan province, Iran. Casp. J. Intern. Med. 2023, 14, 371–375. [Google Scholar] [CrossRef]
- Adamska, A.; Łebkowska, A.; Krentowska, A.; Hryniewicka, J.; Adamski, M.; Leśniewska, M.; Polak, A.M.; Kowalska, I. Ovarian Reserve and Serum Concentration of Thyroid Peroxidase Antibodies in Euthyroid Women with Different Polycystic Ovary Syndrome Phenotypes. Front. Endocrinol. 2020, 11, 440. [Google Scholar] [CrossRef] [PubMed]
- Arora, S.; Sinha, K.; Kolte, S.; Mandal, A. Endocrinal and autoimmune linkage: Evidences from a controlled study of subjects with polycystic ovarian syndrome. J. Hum. Reprod. Sci. 2016, 9, 18–22. [Google Scholar] [CrossRef]
- Dhoriyani, A.A.; Dhoriyani, A.A.; Dhoriyani, J.B.; Jayantilal, A.R. A Correlative Study of Clinical Features, Ultrasound Findings, and Biochemical Markers in PCOS. Int. J. Toxicol. Pharmacol. Res. 2024, 14, 124–128. [Google Scholar]
- Gudovan, E.; Diaconescu, C.; Oros, S.; Neamtu, C. Autoimmune thyroiditis associated with polycystic ovary syndrome—Comments about 25 cases. Acta Endocrinol. 2008, 4, 173–180. [Google Scholar] [CrossRef]
- Kim, J.J.; Yoon, J.W.; Kim, M.J.; Kim, S.M.; Hwang, K.R.; Choi, Y.M. Thyroid autoimmunity markers in women with polycystic ovary syndrome and controls. Hum. Fertility 2022, 25, 128–134. [Google Scholar] [CrossRef]
- Menon, M.; Ramachandran, V. Antithyroid Peroxidase Antibodies in Women with Polycystic Ovary Syndrome. J. Obstet. Gynecol. India 2017, 67, 61–65. [Google Scholar] [CrossRef]
- Naruka, M.; Kshetrimayum, V.; Vijaylakshmi, P.; Manohar, S.M.R.U.; Kumar, R. Drawing Association between Thyroid Function and Auto Immune Status in Female Patients with Polycystic Ovarian Syndrome. Int. J. Pharm. Clin. Res. 2023, 15, 8–14. [Google Scholar]
- Shafi, H.; Mearaj, S.; Bhat, K.A.; Lone, S.U.D.; Pala, N.A.; Majid, S.; Sayeed, S.I. Evaluation of thyroid status in newly diagnosed treatment naive women with polycystic ovarian syndrome. J. Popul. Ther. Clin. Pharmacol. 2024, 31, 1425–1433. [Google Scholar] [CrossRef]
- Sinha, U.; Sinharay, K.; Saha, S.; Longkumer, T.A.; Baul, S.N.; Pal, S.K. Thyroid disorders in polycystic ovarian syndrome subjects: A tertiary hospital based cross-sectional study from Eastern India. Indian J. Endocrinol. Metab. 2013, 17, 304–309. [Google Scholar] [CrossRef]
- Tran, V.T.T.; Ly, L.D.; Nguyen, M.H.N.; Pham, T.D.; Tran, L.T.H.; Tran, M.T.N.; Ho, V.N.A.; Nguyen, N.T.; Hoang, H.L.T.; Vuong, L.N. Thyroid Peroxidase Antibodies in Infertile Women with Polycystic Ovary Syndrome. Reprod. Sci. 2023, 30, 3071–3076. [Google Scholar] [CrossRef] [PubMed]
- van der Ham, K.; Stekelenburg, K.J.; Louwers, Y.V.; van Dorp, W.; Schreurs, M.W.J.; van der Wal, R.; Steegers-Theunissen, R.P.M.; Laven, J.S.E. The prevalence of thyroid dysfunction and hyperprolactinemia in women with PCOS. Front. Endocrinol. 2023, 14, 1245106. [Google Scholar] [CrossRef] [PubMed]
- Yasar, H.Y.; Demirpence, M.; Colak, A.; Zeytinli, M.; Yasar, E.; Taylan, A. Serum neudesin levels in patients with polycystic ovary syndrome. Ginekol. Pol. 2022, 93, 525–530. [Google Scholar] [CrossRef]
- Yu, Q.; Wang, J.B. Subclinical Hypothyroidism in PCOS: Impact on Presentation, Insulin Resistance, and Cardiovascular Risk. BioMed Res. Int. 2016, 2016, 2067087. [Google Scholar] [CrossRef]
- Al-Saab, R.; Haddad, S. Detection of thyroid autoimmunity markers in euthyroid women with polycystic ovary syndrome: A case-control study from syria. Int. J. Endocrinol. Metab. 2014, 12, e17954. [Google Scholar] [CrossRef]
- Anaforoǧlu, Ï.; Topbas, M.; Algun, E. Relative associations of polycystic ovarian syndrome vs metabolic syndrome with thyroid function, volume, nodularity and autoimmunity. J. Endocrinol. Investig. 2011, 34, e259–e264. [Google Scholar] [CrossRef]
- Anusha, K.H.; Thyagaraju, C.; Nandeesha, H. Assessment of Thyroid Auto-antibodies in Euthyroid Infertile Women with Polycystic Ovarian Syndrome—A Cross-sectional Analytical Study. J. Hum. Reprod. Sci. 2024, 17, 269–274. [Google Scholar] [CrossRef]
- Arduc, A.; Dogan, B.A.; Bilmez, S.; Nasiroglu, N.I.; Tuna, M.M.; Isik, S.; Berker, D.; Guler, S. High prevalence of Hashimoto’s thyroiditis in patients with polycystic ovary syndrome: Does the imbalance between estradiol and progesterone play a role? Endocr. Res. 2015, 40, 204–210. [Google Scholar] [CrossRef]
- Auda, S.A.; Gatea, E.A.; Radhi, Z.A. Evaluation of thyroid autoimmunity markers in polycystic ovarian syndrome in women. Biomedicine 2023, 43, 893–896. [Google Scholar] [CrossRef]
- De Souza Mayrink Novais, J.; Benetti-Pinto, C.L.; Garmes, H.M.; Jales, R.M.; Juliato, C.R.T. Polycystic ovary syndrome and chronic autoimmune thyroiditis. Gynecol. Endocrinol. 2015, 31, 48–51. [Google Scholar] [CrossRef]
- Duran, C.; Basaran, M.; Kutlu, O.; Kucukaydin, Z.; Bakdik, S.; Burnik, F.S.; Aslan, U.; Erdem, S.S.; Ecirli, S. Frequency of nodular goiter and autoimmune thyroid disease in patients with polycystic ovary syndrome. Endocrine 2015, 49, 464–469. [Google Scholar] [CrossRef]
- El-Din, A.M.B.; El-Sherbeny, A.A.; El-Hadi, E.A.E.M.A.; Abouellail, H.; Mohsen, M. Assessment of autoimmune thyroid markers in Euthyroid Egyptian patients with polycystic ovary syndrome. Life Sci. J. 2015, 12, 133–138. [Google Scholar] [CrossRef]
- Garelli, S.; Masiero, S.; Plebani, M.; Chen, S.; Furmaniak, J.; Armanini, D.; Betterle, C. High prevalence of chronic thyroiditis in patients with polycystic ovary syndrome. Eur. J. Obstet. Gynecol. Reprod. Biol. 2013, 169, 248–251. [Google Scholar] [CrossRef] [PubMed]
- Hepşen, S.; Karaköse, M.; Çakal, E.; Öztekin, S.; Ünsal, İ.; Akhanlı, P.; Uçan, B.; Özbek, M. The assessment of thyroid autoantibody levels in euthyroid patients with polycystic ovary syndrome. J. Turk. Ger. Gynecol. Assoc. 2018, 19, 215–219. [Google Scholar] [CrossRef] [PubMed]
- Janssen, O.E.; Mehlmauer, N.; Hahn, S.; Öffner, A.H.; Gärtner, R. High prevalence of autoimmune thyroiditis in patients with polycystic ovary syndrome. Eur. J. Endocrinol. 2004, 150, 363–369. [Google Scholar] [CrossRef]
- Kachuei, M.; Jafari, F.; Kachuei, A.; Keshteli, A.H. Prevalence of autoimmune thyroiditis in patients with polycystic ovary syndrome. Arch. Gynecol. Obstet. 2012, 285, 853–856. [Google Scholar] [CrossRef]
- Karaköse, M.; Çakal, E.; Topaloǧlu, O.; Arslan, M.S.; Giniş, Z.; Şahin, M.; Delibaşi, T. Is there a link between polycystic ovary syndrome and non-thyroidal illness syndrome? J. Turk. Ger. Gynecol. Assoc. 2013, 14, 216–220. [Google Scholar] [CrossRef]
- Karaköse, M.; Hepsen, S.; Çakal, E.; Saykı Arslan, M.; Tutal, E.; Akın, Ş.; Ünsal, İ.; Özbek, M. Frequency of nodular goiter and autoimmune thyroid disease and association of these disorders with insulin resistance in polycystic ovary syndrome. J. Turk. Ger. Gynecol. Assoc. 2017, 18, 85–89. [Google Scholar] [CrossRef]
- Malik Aubead, N. Study the association between the thyroid autoimmunity markers and polycystic ovary syndrome in euthyroid women. Med. Leg. Update 2020, 20, 2294–2298. [Google Scholar] [CrossRef]
- Mitkov, M.D.; Nyagolova, P.V.; Orbetzova, M.M. Serum markers off autoimmune thyroiditis in euthyroid women with polycystic ovary syndrome. Endokrinologya 2015, 20, 27–32. [Google Scholar]
- Mohammed, S.; Awooda, H.A.; Rayis, D.A.; Hamdan, H.Z.; Adam, I.; Lutfi, M.F. Thyroid function/antibodies in sudanese women with polycystic ovarian disease. Obstet. Gynecol. Sci. 2017, 60, 187–192. [Google Scholar] [CrossRef] [PubMed]
- Ott, J.; Aust, S.; Kurz, C.; Nouri, K.; Wirth, S.; Huber, J.C.; Mayerhofer, K. Elevated antithyroid peroxidase antibodies indicating Hashimoto’s thyroiditis are associated with the treatment response in infertile women with polycystic ovary syndrome. Fertil. Steril. 2010, 94, 2895–2897. [Google Scholar] [CrossRef] [PubMed]
- Petrikova, J.; Lazurova, I.; Dravecka, I.; Vrbikova, J.; Kozakova, D.; Figurova, J.; Vaczy, Z.; Rosocha, J. The prevalence of non organ specific and thyroid autoimmunity in patients with polycystic ovary syndrome. Biomed. Pap. Med. Fac. Univ. Palacky Olomouc Czech Oslov. 2015, 159, 302–306. [Google Scholar] [CrossRef] [PubMed]
- Saleh, R.A.; Salih, E.G.; Ibrahim, M.M.; Tektook, N.K. The Prevalence of Thyroid Autoimmunity (Anti-thyroid Peroxidase and Anti-thyroglobulin) in Sera of Iraqi Women with Polycystic Ovaries. Int. J. Drug Deliv. Technol. 2021, 11, 1230–1232. [Google Scholar]
- Vryonidou, A.; Mizamtsidi, M.; Palioura, E.; Kalogeris, N.; Vassilatou, E.; Ioannidis, D.; Loi, V.; Paschou, S.A. The prevalence of autoimmune thyroiditis is not increased in women with polycystic ovary syndrome after adjustment for family predisposition. Endocrine 2025, 88, 529–536. [Google Scholar] [CrossRef]
- Yasar, H.Y.; Topaloglu, O.; Demirpence, M.; Ceyhan, B.O.; Guclu, F. Is subclinical hypothyroidism in patients with polycystic ovary syndrome associated with BMI? Acta Endocrinol. 2016, 12, 431–436. [Google Scholar] [CrossRef]
- Hu, X.; Chen, Y.; Shen, Y.; Zhou, S.; Fei, W.; Yang, Y.; Que, H. Correlation between Hashimoto’s thyroiditis and polycystic ovary syndrome: A systematic review and meta-analysis. Front. Endocrinol. 2022, 13, 1025267. [Google Scholar] [CrossRef]
- Wang, J.; Yin, T.; Liu, S. Dysregulation of immune response in PCOS organ system. Front. Immunol. 2023, 14, 1169232. [Google Scholar] [CrossRef]
- Zeber-Lubecka, N.; Hennig, E.E. Genetic Susceptibility to Joint Occurrence of Polycystic Ovary Syndrome and Hashimoto’s Thyroiditis: How Far Is Our Understanding? Front. Immunol. 2021, 12, 606620. [Google Scholar] [CrossRef]
- Chen, W. TGF-beta Regulation of T Cells. Annu. Rev. Immunol. 2023, 41, 483–512. [Google Scholar] [CrossRef]
- Quintero, O.L.; Amador-Patarroyo, M.J.; Montoya-Ortiz, G.; Rojas-Villarraga, A.; Anaya, J.M. Autoimmune disease and gender: Plausible mechanisms for the female predominance of autoimmunity. J. Autoimmun. 2012, 38, J109–J119. [Google Scholar] [CrossRef] [PubMed]
- Deng, H.; Chen, Y.; Xing, J.; Zhang, N.; Xu, L. Systematic low-grade chronic inflammation and intrinsic mechanisms in polycystic ovary syndrome. Front. Immunol. 2024, 15, 1470283. [Google Scholar] [CrossRef] [PubMed]
- Mobeen, H.; Afzal, N.; Kashif, M. Polycystic Ovary Syndrome May Be an Autoimmune Disorder. Scientifica 2016, 2016, 4071735. [Google Scholar] [CrossRef] [PubMed]
- Akpang, N.; Kwiatkowski, J.; Zaborowska, L.; Ludwin, A. Autoantibodies Targeting the Hypothalamic-Pituitary-Ovarian Axis in Polycystic Ovary Syndrome: Emerging Key Players in Pathogenesis? Int. J. Mol. Sci. 2025, 26, 4121. [Google Scholar] [CrossRef]
- Barber, T.M.; Hanson, P.; Weickert, M.O.; Franks, S. Obesity and Polycystic Ovary Syndrome: Implications for Pathogenesis and Novel Management Strategies. Clin. Med. Insights Reprod. Health 2019, 13, 1179558119874042. [Google Scholar] [CrossRef]
- Morciano, A.; Romani, F.; Sagnella, F.; Scarinci, E.; Palla, C.; Moro, F.; Tropea, A.; Policola, C.; Della Casa, S.; Guido, M.; et al. Assessment of insulin resistance in lean women with polycystic ovary syndrome. Fertil. Steril. 2014, 102, 250–256.e3. [Google Scholar] [CrossRef]
- Misra, S.; Gada, J.; Dhole, C.; Varthakavi, P.; Bhagwat, N. Comparative Study of Insulin Sensitivity and Resistance and Their Correlation with Androgens in Lean and Obese Women with Polycystic Ovary Syndrome. Reprod. Sci. 2024, 31, 754–763. [Google Scholar] [CrossRef]
- Ezeh, U.; Yildiz, B.O.; Azziz, R. Referral bias in defining the phenotype and prevalence of obesity in polycystic ovary syndrome. J. Clin. Endocrinol. Metab. 2013, 98, E1088–E1096. [Google Scholar] [CrossRef]
- Huo, J.; Xu, Y.; Yu, J.; Guo, Y.; Hu, X.; Ou, D.; Qu, R.; Zhao, L. Causal association between body mass index and autoimmune thyroiditis: Evidence from Mendelian randomization. Eur. J. Med. Res. 2023, 28, 526. [Google Scholar] [CrossRef]
- Yan, Y.; Xu, M.; Wu, M.; Wang, X.; Li, F.; Zhang, J.; You, L.; Pan, X.; Feng, W.; Wu, J.; et al. Obesity is associated with subclinical hypothyroidism in the presence of thyroid autoantibodies: A cross-sectional study. BMC Endocr. Disord. 2022, 22, 94. [Google Scholar] [CrossRef]
- Marzullo, P.; Minocci, A.; Tagliaferri, M.A.; Guzzaloni, G.; Di Blasio, A.; De Medici, C.; Aimaretti, G.; Liuzzi, A. Investigations of thyroid hormones and antibodies in obesity: Leptin levels are associated with thyroid autoimmunity independent of bioanthropometric, hormonal, and weight-related determinants. J. Clin. Endocrinol. Metab. 2010, 95, 3965–3972. [Google Scholar] [CrossRef]
- Amouzegar, A.; Kazemian, E.; Abdi, H.; Gharibzadeh, S.; Tohidi, M.; Azizi, F. Abdominal Obesity Phenotypes and Incidence of Thyroid Autoimmunity: A 9-Year Follow-up. Endocr. Res. 2020, 45, 202–209. [Google Scholar] [CrossRef] [PubMed]
- McLachlan, S.M.; Aliesky, H.A.; Rapoport, B. To reflect human autoimmune thyroiditis, thyroid peroxidase (not thyroglobulin) antibodies should be measured in female (not sex-independent) NOD.H2(h4) mice. Clin. Exp. Immunol. 2019, 196, 52–58. [Google Scholar] [CrossRef] [PubMed]
- Kofler, H.; Kofler, R.; Wolf, H.; Wick, G. Immunofluorescence studies on the codistribution immune deposits and complement in the thyroid glands of Obese strain (OS) chickens. Immunobiology 1983, 164, 390–401. [Google Scholar] [CrossRef] [PubMed]
- Dittrich, R.; Kajaia, N.; Cupisti, S.; Hoffmann, I.; Beckmann, M.W.; Mueller, A. Association of thyroid-stimulating hormone with insulin resistance and androgen parameters in women with PCOS. Reprod. Biomed. Online 2009, 19, 319–325. [Google Scholar] [CrossRef]
- Morteza Taghavi, S.; Rokni, H.; Fatemi, S. Metformin decreases thyrotropin in overweight women with polycystic ovarian syndrome and hypothyroidism. Diabetes Vasc. Dis. Res. 2011, 8, 47–48. [Google Scholar] [CrossRef]
| Author, Year | Associated Factors | Main Findings |
|---|---|---|
| Studies assessing the prevalence of anti-TPO antibodies only (n = 9) | ||
| Adamska et al., 2020 [33] | estradiol (+), PRL (−) | The prevalence of anti-TPO was not significantly different between women with PCOS and controls. |
| Heidarpour et al., 2023 [32] | ND | The prevalence of anti-TPO was significantly higher in women with PCOS compared to controls. |
| Kim et al., 2022 [37] | ND | The prevalence of anti-TPO was not significantly different between women with PCOS and controls. |
| Menon et al., 2017 [38] | ND | The prevalence of anti-TPO was significantly higher in women with PCOS compared to controls. |
| Naruka et al., 2023 [39] | T4 (−), TSH (+) | The prevalence of anti-TPO was not significantly different between women with PCOS and controls. |
| Sinha et al., 2013 [41] | ND | The prevalence of anti-TPO was significantly higher in women with PCOS compared to controls. |
| Tran et al., 2023 [42] | ND | The prevalence of anti-TPO was not significantly different between women with PCOS and controls. |
| Van der Ham et al., 2023 [43] | ND | The prevalence of anti-TPO was not significantly different between women with PCOS and controls. |
| Wang et al., 2018 [28] | PCOS women aged 28–35 years (+) | The prevalence of anti-TPO was significantly higher in women with PCOS compared to controls. |
| Studies assessing the prevalence of both anti-TG and anti-TPO antibodies (n = 16) | ||
| Al-Saab et al., 2014 [46] | ND | The prevalence of both anti-TPO and anti-TG antibodies was significantly higher in women with PCOS compared to controls. |
| Anusha et al., 2024 [48] | ND | The prevalence of both anti-TPO and anti-TG antibodies was significantly higher in women with PCOS compared to controls. |
| Arduc et al., 2015 [49] | ND | The prevalence of both anti-TPO and anti-TG antibodies was significantly higher in women with PCOS compared to controls. |
| De Souza Mayrink Novais et al., 2015 [51] | ND | The prevalence of both anti-TPO and anti-TG antibodies was not significantly different between women with PCOS and controls. |
| Duran et al., 2015 [52] | ND | The prevalence of both anti-TPO and anti-TG antibodies was not significantly different between women with PCOS and controls. |
| El-Din et al., 2015 [53] | ND | The prevalence of both anti-TPO and anti-TG antibodies was not significantly different between women with PCOS and controls. |
| Garelli et al., 2013 [54] | ND | The prevalence of both anti-TPO and anti-TG antibodies was significantly higher in women with PCOS compared to controls. |
| Hepşen et al., 2019 [55] | ND | The prevalence of both anti-TPO and anti-TG antibodies was significantly higher in women with PCOS compared to controls. |
| Janssen et al., 2004 [56] | ND | The prevalence of thyroid autoantibodies was significantly higher in women with PCOS compared to controls (no separate data available for anti-TPO and anti-TG antibodies). |
| Kachuei et al., 2012 [57] | ND | The prevalence of both anti-TPO and anti-TG antibodies was not significantly different between women with PCOS and controls. |
| Karaköse et al., 2013 [58] | ND | The prevalence of anti-TPO antibodies was significantly higher in women with PCOS, while the prevalence of anti-TG antibodies was not significantly different between groups. |
| Karaköse et al., 2017 [59] | anti-TG: TSH (+) | The prevalence of anti-TPO antibodies was significantly higher in women with PCOS, while the prevalence of anti-TG antibodies was not significantly different between groups. |
| anti-TPO: TSH (+) | ||
| Mitkov et al., 2015 [61] | anti-TG: TSH (+), age (−) | The prevalence of thyroid autoantibodies was not significantly different between women with PCOS and controls (no separate data available for anti-TPO and anti-TG anti-bodies). |
| anti-TPO: TSH (+), testosterone (−), DHEAS (−), age (+) | ||
| Ott et al., 2010 [63] | ND | The prevalence of anti-TPO antibodies was significantly higher in women with PCOS, while the prevalence of anti-TG antibodies was not significantly different between groups. |
| Petrikova et al., 2015 [64] | ND | The prevalence of anti-TPO antibodies was significantly higher in women with PCOS, while the prevalence of anti-TG antibodies was not significantly different between groups. |
| Vryonidou et al., 2025 [66] | ND | The prevalence of both anti-TPO and anti-TG antibodies was not significantly different between women with PCOS and controls. |
| Author, Year | Associated Factors | Main Findings |
|---|---|---|
| Studies assessing the level of anti-TG antibodies only (n = 1) | ||
| Kamil et al., 2020 [31] | BMI (+) | The level of anti-TG antibodies was significantly higher in women with PCOS compared to controls. |
| Studies assessing the level of anti-TPO antibodies only (n = 9) | ||
| Dhoriyani et al., 2024 [35] | BMI ≥ 25 (+), LH (+), FSH (+), PCOM (+) | The level of anti-TPO antibodies was not significantly different between women with PCOS and controls. However, significantly higher levels were observed in PCOS women with PCOM or elevated BMI. |
| Gudovan et al., 2008 [36] | ND | The level of anti-TPO antibodies was significantly higher in women with PCOS compared to controls. |
| Jameel et al., 2022 [30] | ND | The level of anti-TPO antibodies was significantly higher in women with PCOS compared to controls. |
| Menon et al., 2017 [38] | ND | The level of anti-TPO antibodies was significantly higher in women with PCOS compared to controls. |
| Shafi et al., 2024 [40] | ND | The level of anti-TPO antibodies was significantly higher in women with PCOS compared to controls. |
| Sinha et al., 2013 [41] | ND | The level of anti-TPO antibodies was significantly higher in women with PCOS compared to controls. |
| Tran et al., 2023 [42] | ND | The level of anti-TPO antibodies was not significantly different between women with PCOS and controls. |
| Yasar et al., 2022 [44] | ND | The level of anti-TPO antibodies was not significantly different between women with PCOS and controls. |
| Yu et al., 2016 [45] | ND | The level of anti-TPO antibodies was not significantly different between women with PCOS and controls. |
| Studies assessing the level of both anti-TG and anti-TPO antibodies (n = 18) | ||
| Al-Karawi et al., 2024 [29] | ND | The levels of both anti-TPO and anti-TG antibodies were significantly higher in women with PCOS compared to controls. |
| Al-Saab et al., 2014 [46] | ND | The level of anti-TPO antibodies was significantly higher in women with PCOS, while the level of anti-TG antibodies was not significantly different between groups. |
| Anaforoglu et al., 2011 [47] | anti-TG: metabolic syndrome (+), post-prandial glucose (+), LDL (+), triglycerides (+) | The levels of both anti-TPO and anti-TG antibodies were not significantly different between women with PCOS and controls. However, levels were significantly higher in women with metabolic syndrome. |
| anti-TPO: metabolic syndrome (+), age (+), weight (+), waist circumference (+), diastolic blood pressure (+), post-prandial glucose (+), HDL (−) | ||
| Arduc et al., 2015 [49] | ND | The levels of both anti-TPO and anti-TG antibodies were significantly higher in women with PCOS compared to controls. |
| Arora et al., 2016 [34] | ND | The level of anti-TPO antibodies was not significantly different between women with PCOS and controls. The level of anti-TG antibodies was significantly higher in women with PCOS compared to controls, although full results were not available. |
| Auda et al., 2023 [50] | ND | The levels of both anti-TPO and anti-TG antibodies were significantly higher in women with PCOS compared to controls. |
| El-Din et al., 2015 [53] | ND | The level of anti-TPO antibodies was significantly higher in women with PCOS, while the level of anti-TG antibodies was not significantly different between groups. |
| Hepşen et al., 2019 [55] | ND | The levels of both anti-TPO and anti-TG antibodies were significantly higher in women with PCOS compared to controls. |
| Janssen et al., 2004 [56] | ND | The levels of both anti-TPO and anti-TG antibodies were significantly higher in women with PCOS compared to controls. |
| Kachuei et al., 2012 [57] | ND | The level of anti-TPO antibodies was significantly higher in women with PCOS, while the level of anti-TG antibodies was not significantly different between groups. |
| Karaköse et al., 2013 [58] | ND | The levels of both anti-TPO and anti-TG antibodies were not significantly different between women with PCOS and controls. |
| Malik Aubead et al., 2020 [60] | ND | The levels of both anti-TPO and anti-TG antibodies were significantly higher in women with PCOS compared to controls. |
| Mitkov et al., 2015 [61] | anti-TG: TSH (+), age (−) | The level of anti-TG antibodies was significantly higher in women with PCOS, while the level of anti-TPO antibodies was not significantly different between groups. |
| anti-TPO: TSH (+), testosterone (−), DHEAS (−), age (+) | ||
| Mohammed et al., 2017 [62] | ND | The levels of both anti-TPO and anti-TG antibodies were not significantly different between women with PCOS and controls. |
| Ott et al., 2010 [63] | ND | The levels of both anti-TPO and anti-TG antibodies were significantly higher in women with PCOS compared to controls. Elevated anti-TPO levels may indicate a risk for clomiphene citrate resistance. |
| Petrikova et al., 2015 [64] | ND | The levels of both anti-TPO and anti-TG antibodies were not significantly different between women with PCOS and controls. |
| Saleh et al., 2021 [65] | ND | The level of anti-TPO antibodies was significantly higher in women with PCOS, while the level of anti-TG antibodies was not significantly different between groups. |
| Yasar et al., 2016 [67] | ND | The levels of both anti-TPO and anti-TG antibodies were not significantly different between women with PCOS and controls. |
| Author, Year | Selection | Comparability | Outcome | Sum | |||||
|---|---|---|---|---|---|---|---|---|---|
| PCOS Definition | Inclusion/Exclusion Criteria | Control Group | Antibody Measurement | Confounders | Clear Results | Antibodies Influencing Factors | Statistical Analysis | ||
| Adamska et al., 2020 [33] | ★ | ★ | ★ | ★ | ★★ | ★ | ★ | 8 | |
| Al-Karawi et al., 2024 [29] | ★ | ★ | ★ | ★ | 4 | ||||
| Al-Saab et al., 2014 [46] | ★ | ★ | ★ | ★ | ★ | ★ | ★ | ★ | 8 |
| Anaforoglu et al., 2011 [47] | ★ | ★ | ★ | ★ | ★★ | ★ | ★ | ★ | 9 |
| Anusha et al., 2024 [48] | ★ | ★ | ★ | ★ | ★ | ★ | ★ | ★ | 8 |
| Arduc et al., 2015 [49] | ★ | ★ | ★ | ★ | ★★ | ★ | ★ | ★ | 9 |
| Arora et al., 2016 [34] | ★ | ★ | ★ | ★ | ★★ | ★ | ★ | 8 | |
| Auda et al., 2023 [50] | ★ | ★ | ★ | ★ | ★ | ★ | 6 | ||
| De Souza Mayrink Novais et al., 2015 [51] | ★ | ★ | ★ | ★ | ★ | ★ | ★ | 7 | |
| Dhoriyani et al., 2024 [35] | ★ | ★ | ★ | ★★ | ★ | ★ | ★ | 8 | |
| Duran et al., 2025 [52] | ★ | ★ | ★ | ★★ | ★ | ★ | 7 | ||
| El-Din et al., 2015 [53] | ★ | ★ | ★ | ★ | ★ | ★ | ★ | ★ | 8 |
| Garelli et al., 2013 [54] | ★ | ★ | ★ | ★ | ★ | ★ | 6 | ||
| Gudovan et al., 2008 [36] | ★ | ★ | ★ | ★ | 4 | ||||
| Heidarpour et al., 2023 [32] | ★ | ★ | 2 | ||||||
| Hepşen et al., 2018 [55] | ★ | ★ | ★ | ★ | ★★ | ★ | ★ | 8 | |
| Jameel et al., 2022 [30] | ★ | ★ | ★★ | ★ | ★ | ★ | 7 | ||
| Janssen et al., 2022 [30] | ★ | ★ | ★ | ★ | ★ | ★ | ★ | 7 | |
| Kachuei et al., 2012 [57] | ★ | ★ | ★ | ★★ | ★ | ★ | 7 | ||
| Kamil et al., 2020 [31] | ★ | ★ | ★ | ★ | ★ | ★ | 6 | ||
| Karaköse et al., 2013 [58] | ★ | ★ | ★ | ★★ | ★ | ★ | ★ | 8 | |
| Karaköse et al., 2017 [59] | ★ | ★ | ★ | ★★ | ★ | ★ | 7 | ||
| Kim et al., 2022 [37] | ★ | ★ | ★ | ★ | ★★ | ★ | ★ | ★ | 9 |
| Malik Aubead et al., 2020 [60] | ★ | ★ | ★ | ★ | ★ | 5 | |||
| Menon et al., 2017 [38] | ★ | ★ | ★ | ★★ | ★ | ★ | 7 | ||
| Mitkov et al., 2015 [61] | ★ | ★ | ★ | ★★ | ★ | ★ | ★ | 8 | |
| Mohammed et al., 2017 [62] | ★ | ★ | ★ | ★ | ★★ | ★ | ★ | 8 | |
| Naruka et al., 2023 [39] | ★ | ★ | ★ | ★ | ★★ | ★ | ★ | ★ | 9 |
| Ott et al., 2010 [63] | ★ | ★ | ★ | ★ | 4 | ||||
| Petrikova et al., 2015 [64] | ★ | ★ | ★ | ★ | ★★ | ★ | ★ | ★ | 9 |
| Saleh et al., 2021 [65] | ★ | ★ | ★ | ★ | 4 | ||||
| Shafi et al., 2024 [40] | ★ | ★ | ★ | ★★ | ★ | ★ | 7 | ||
| Sinha et al., 2013 [41] | ★ | ★ | ★ | ★ | ★ | ★ | ★ | 7 | |
| Tran et al., 2023 [42] | ★ | ★ | ★ | ★ | ★★ | ★ | ★ | 8 | |
| Van der Ham et al., 2023 [43] | ★ | ★ | ★ | ★ | ★ | ★ | ★ | ★ | 8 |
| Vryonidou et al., 2025 [66] | ★ | ★ | ★ | ★ | ★★ | ★ | ★ | ★ | 9 |
| Wang et al., 2018 [28] | ★ | ★★ | ★ | ★ | ★ | 6 | |||
| Yasar et al., 2016 [67] | ★ | ★ | ★ | ★★ | ★ | ★ | ★ | 8 | |
| Yasar et al., 2022 [44] | ★ | ★ | ★ | ★★ | ★ | ★ | ★ | 8 | |
| Yu et al., 2016 [45] | ★ | ★ | ★ | ★ | ★★ | ★ | ★ | ★ | 9 |
| Antibody | Outcome | Overall | TSH-Matched | TSH-Not Matched | BMI-Matched | BMI-Not Matched |
|---|---|---|---|---|---|---|
| Anti-TPO | Prevalence | OR 2.03 [1.35–3.04], p = 0.0006 * | OR 1.28 [0.86–1.92], p = 0.23 | OR 5.27 [3.00–9.27], p < 0.00001 * | OR 1.61 [0.48–5.42], p = 0.45 | OR 2.24 [1.49–3.38], p = 0.0001 * |
| Level | SMD 0.63 [0.37–0.88], p < 0.00001 * | SMD 0.59 [0.27–0.91], p = 0.0003 * | SMD 0.71 [0.27–1.14], p = 0.002 * | SMD 0.31 [0.12–0.50], p = 0.001 * | SMD 0.82 [0.45–1.18], p < 0.0001 * | |
| Anti-TG | Prevalence | OR 1.92 [1.23–3.01], p = 0.004 * | OR 1.43 [0.86–2.37], p = 0.17 | OR 3.26 [1.55–6.86], p = 0.002 * | OR 1.64 [0.59–4.52], p = 0.34 | OR 2.08 [1.25–3.45], p = 0.005 * |
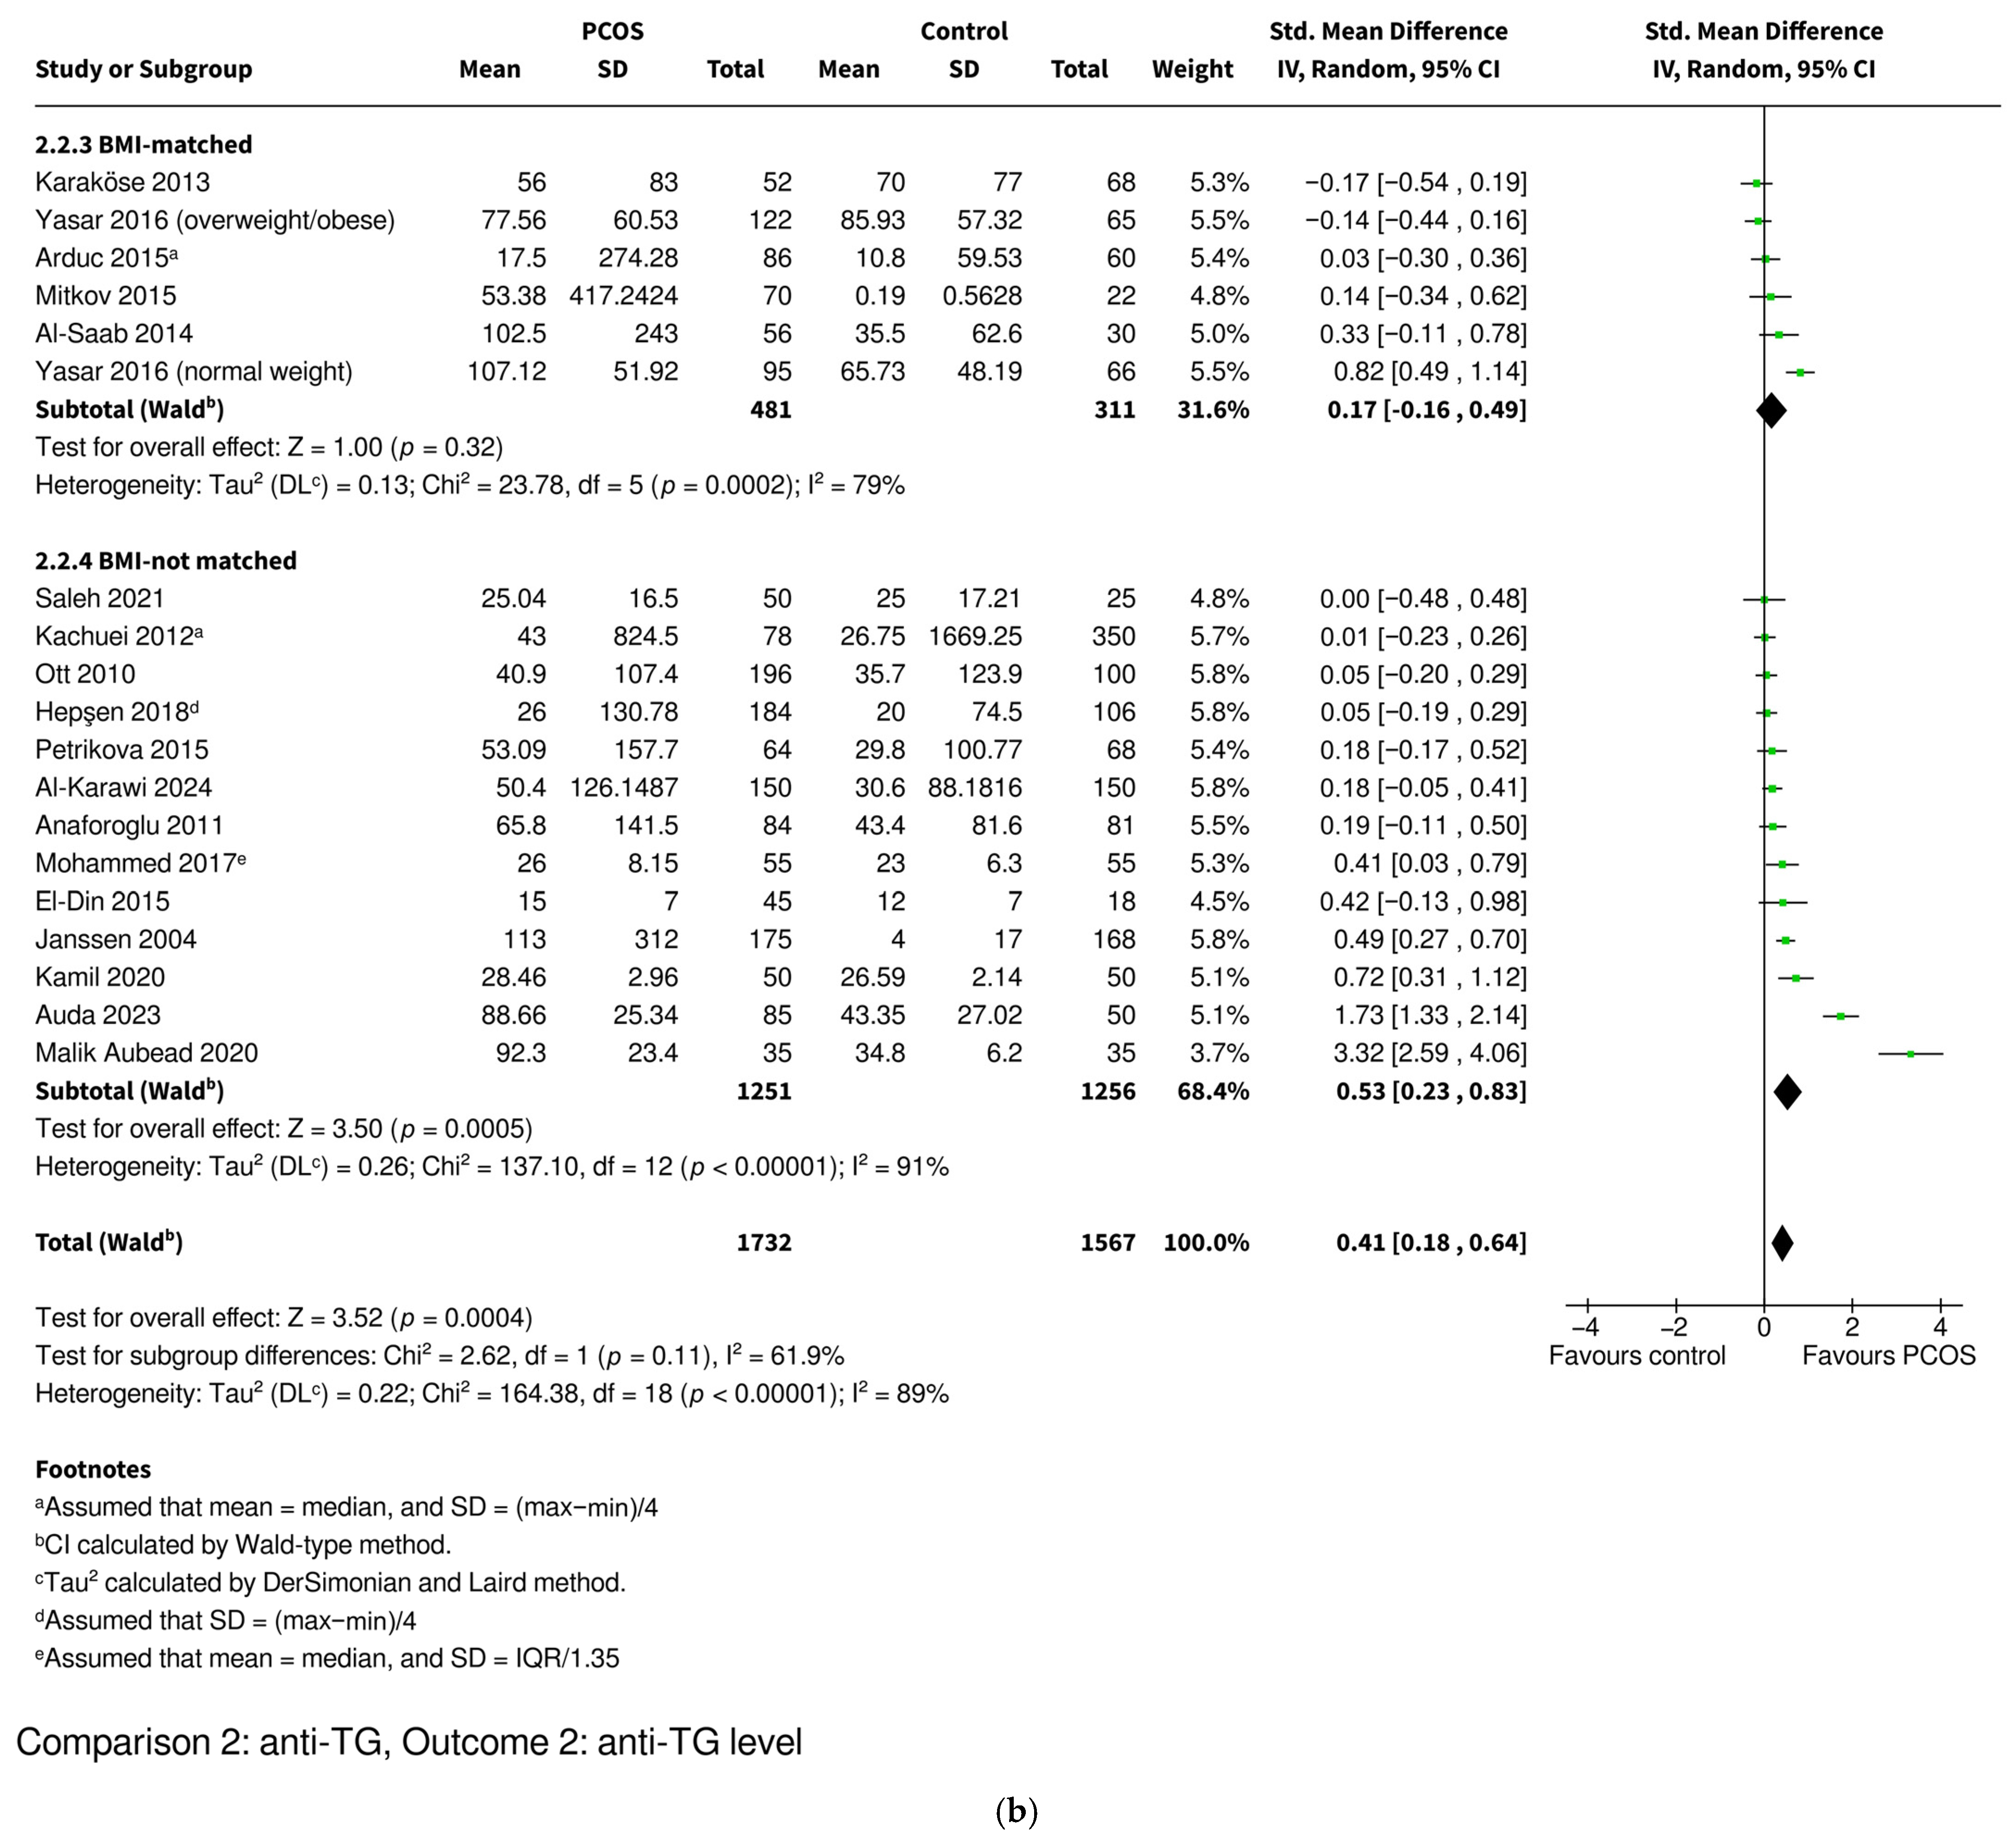
| Level | SMD 0.41 [0.18–0.64], p = 0.0004 * | SMD 0.19 [0.01–0.36], p = 0.03 * | SMD 0.75 [0.27–1.23], p = 0.002 * | SMD 0.17 [−0.16–0.49], p = 0.32 | SMD 0.53 [0.23–0.83], p = 0.0005 * |
Disclaimer/Publisher’s Note: The statements, opinions and data contained in all publications are solely those of the individual author(s) and contributor(s) and not of MDPI and/or the editor(s). MDPI and/or the editor(s) disclaim responsibility for any injury to people or property resulting from any ideas, methods, instructions or products referred to in the content. |
© 2025 by the authors. Licensee MDPI, Basel, Switzerland. This article is an open access article distributed under the terms and conditions of the Creative Commons Attribution (CC BY) license (https://creativecommons.org/licenses/by/4.0/).
Share and Cite
Kwiatkowski, J.; Akpang, N.; Zaborowska, L.; Ludwin, A. Prevalence and Levels of Thyroid Autoantibodies in Polycystic Ovary Syndrome—Impact of TSH- and BMI-Matched Comparisons: A Systematic Review and Meta-Analysis. Int. J. Mol. Sci. 2025, 26, 7525. https://doi.org/10.3390/ijms26157525
Kwiatkowski J, Akpang N, Zaborowska L, Ludwin A. Prevalence and Levels of Thyroid Autoantibodies in Polycystic Ovary Syndrome—Impact of TSH- and BMI-Matched Comparisons: A Systematic Review and Meta-Analysis. International Journal of Molecular Sciences. 2025; 26(15):7525. https://doi.org/10.3390/ijms26157525
Chicago/Turabian StyleKwiatkowski, Jakub, Nicole Akpang, Lucja Zaborowska, and Artur Ludwin. 2025. "Prevalence and Levels of Thyroid Autoantibodies in Polycystic Ovary Syndrome—Impact of TSH- and BMI-Matched Comparisons: A Systematic Review and Meta-Analysis" International Journal of Molecular Sciences 26, no. 15: 7525. https://doi.org/10.3390/ijms26157525
APA StyleKwiatkowski, J., Akpang, N., Zaborowska, L., & Ludwin, A. (2025). Prevalence and Levels of Thyroid Autoantibodies in Polycystic Ovary Syndrome—Impact of TSH- and BMI-Matched Comparisons: A Systematic Review and Meta-Analysis. International Journal of Molecular Sciences, 26(15), 7525. https://doi.org/10.3390/ijms26157525