Profiling the Expression Level of a Gene from the Caspase Family in Triple-Negative Breast Cancer
Abstract
1. Introduction
2. Results
2.1. Determination of the Expression Levels of Genes from the Caspase Family in Patients Diagnosed with Triple-Negative Breast Cancer. Comparative Analysis with the Expression Levels of the Discussed Genes Obtained from the TCGA Database
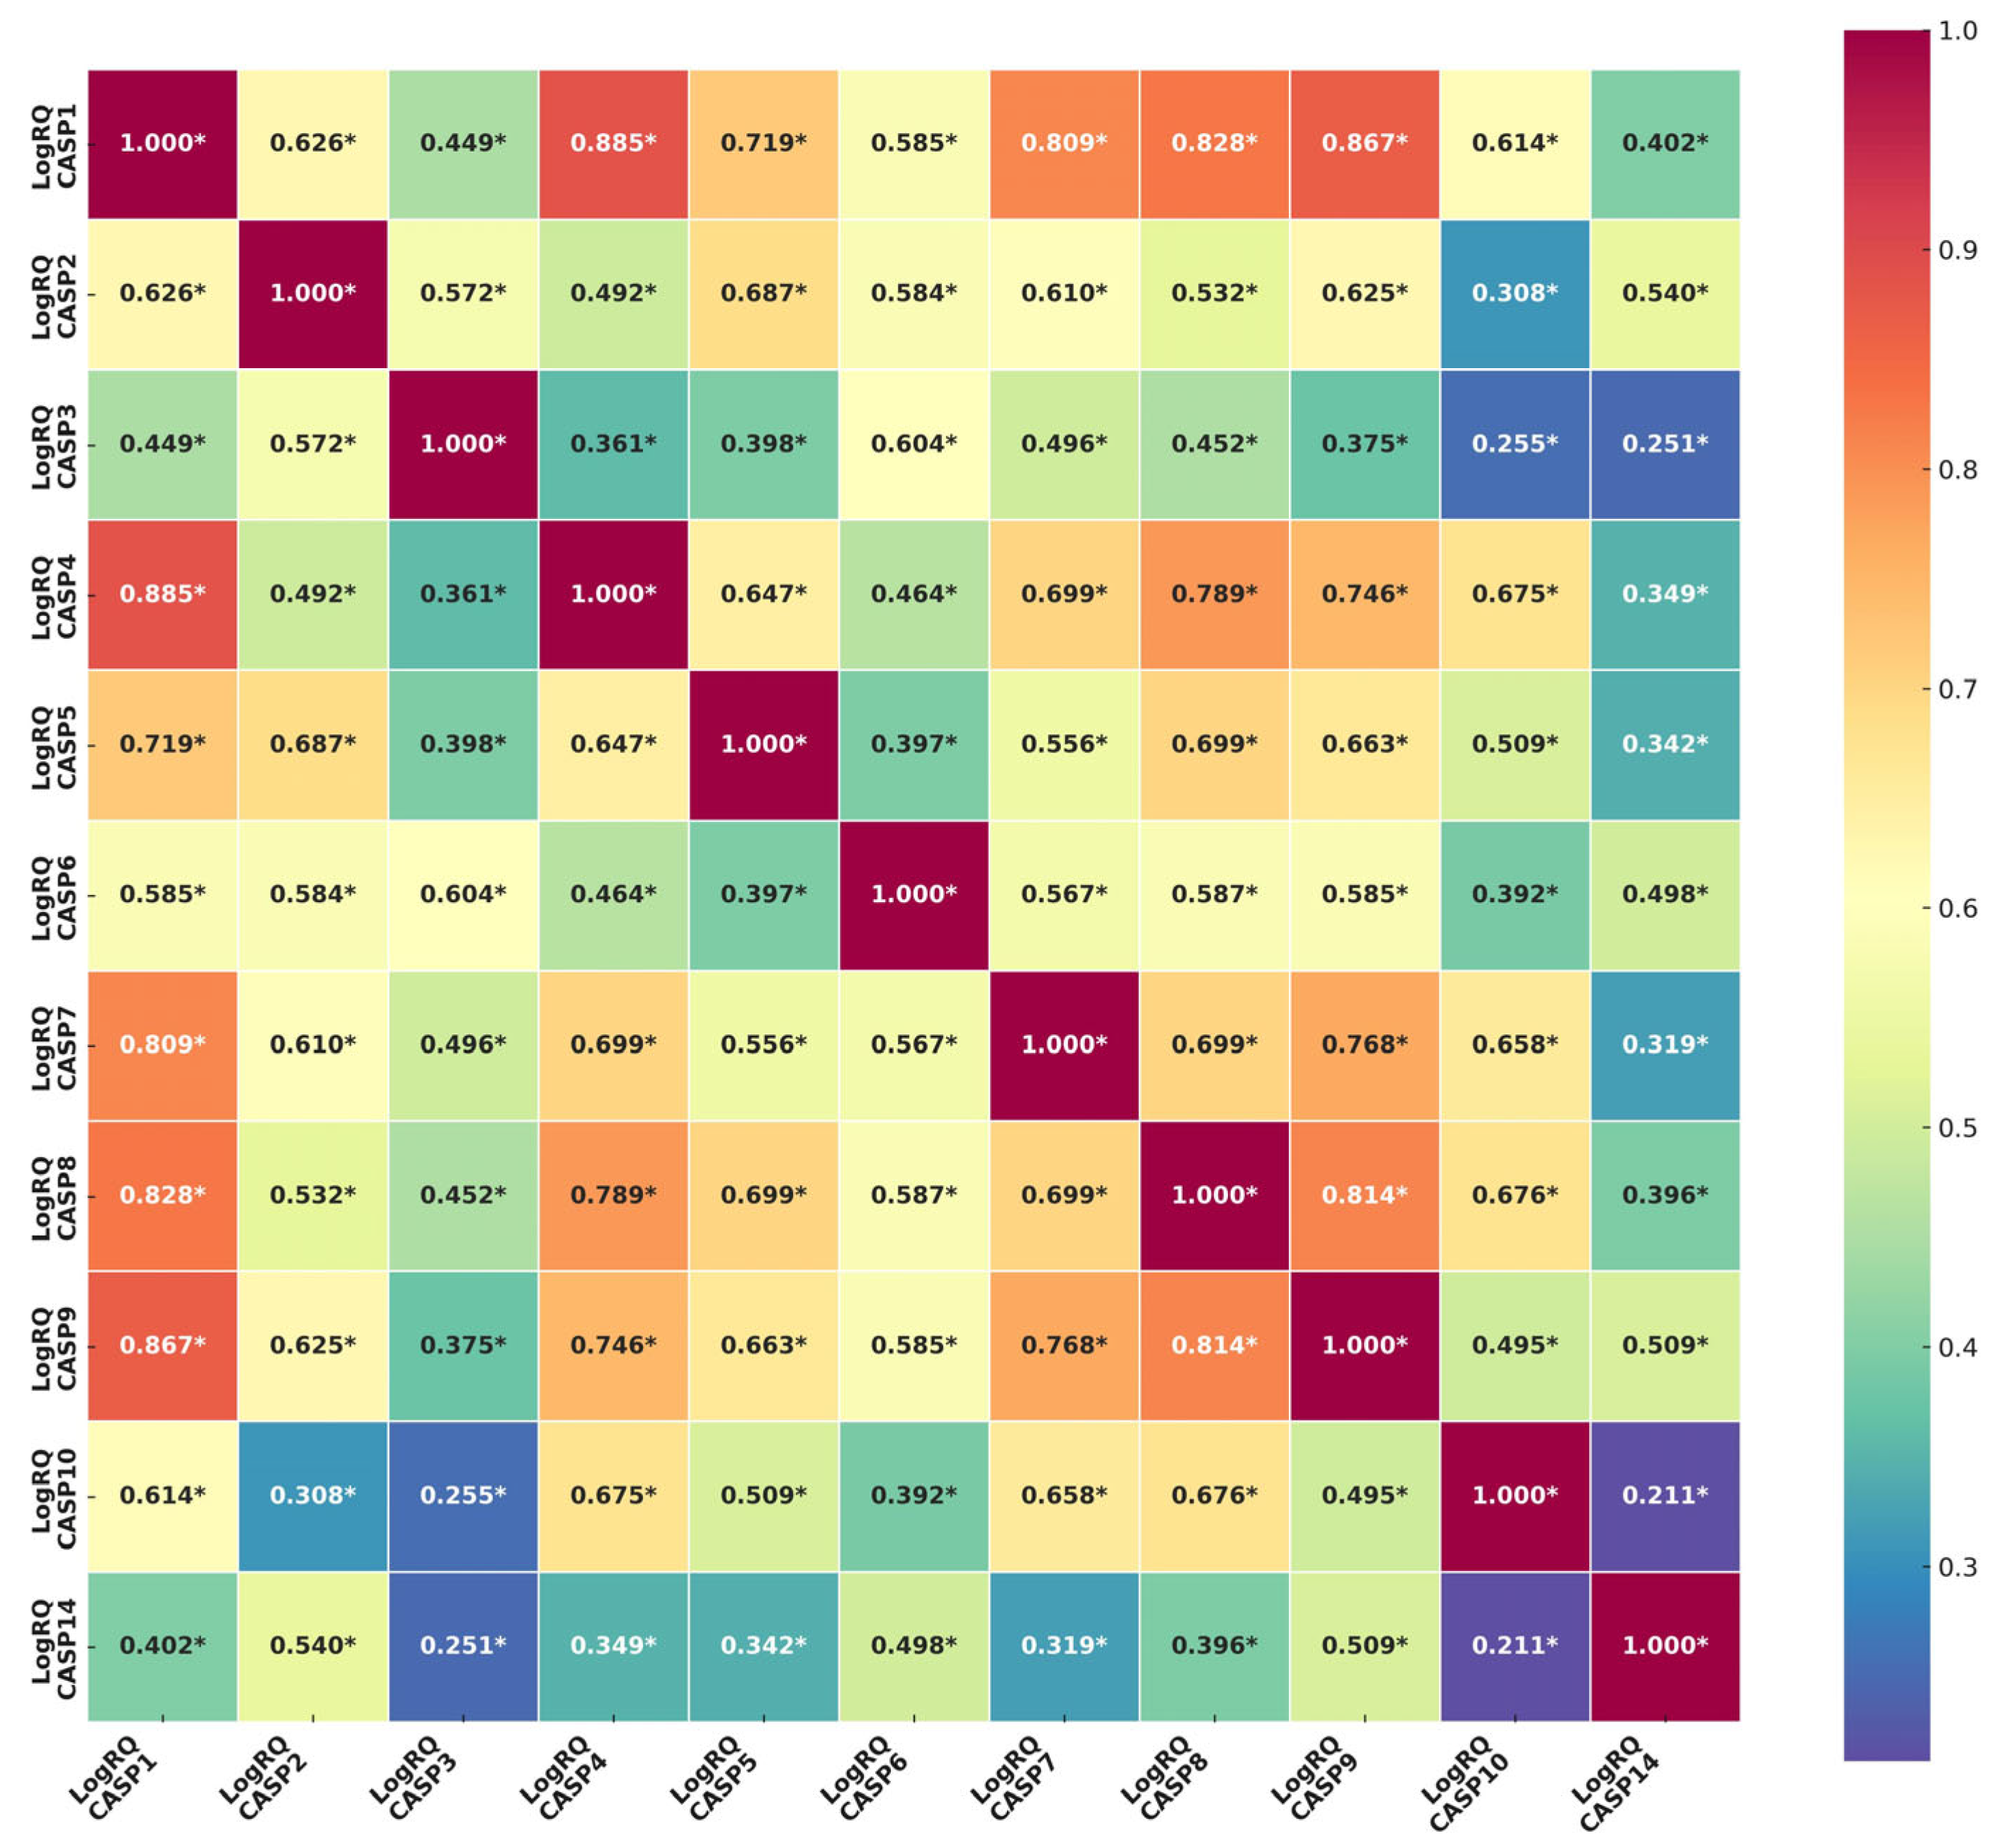
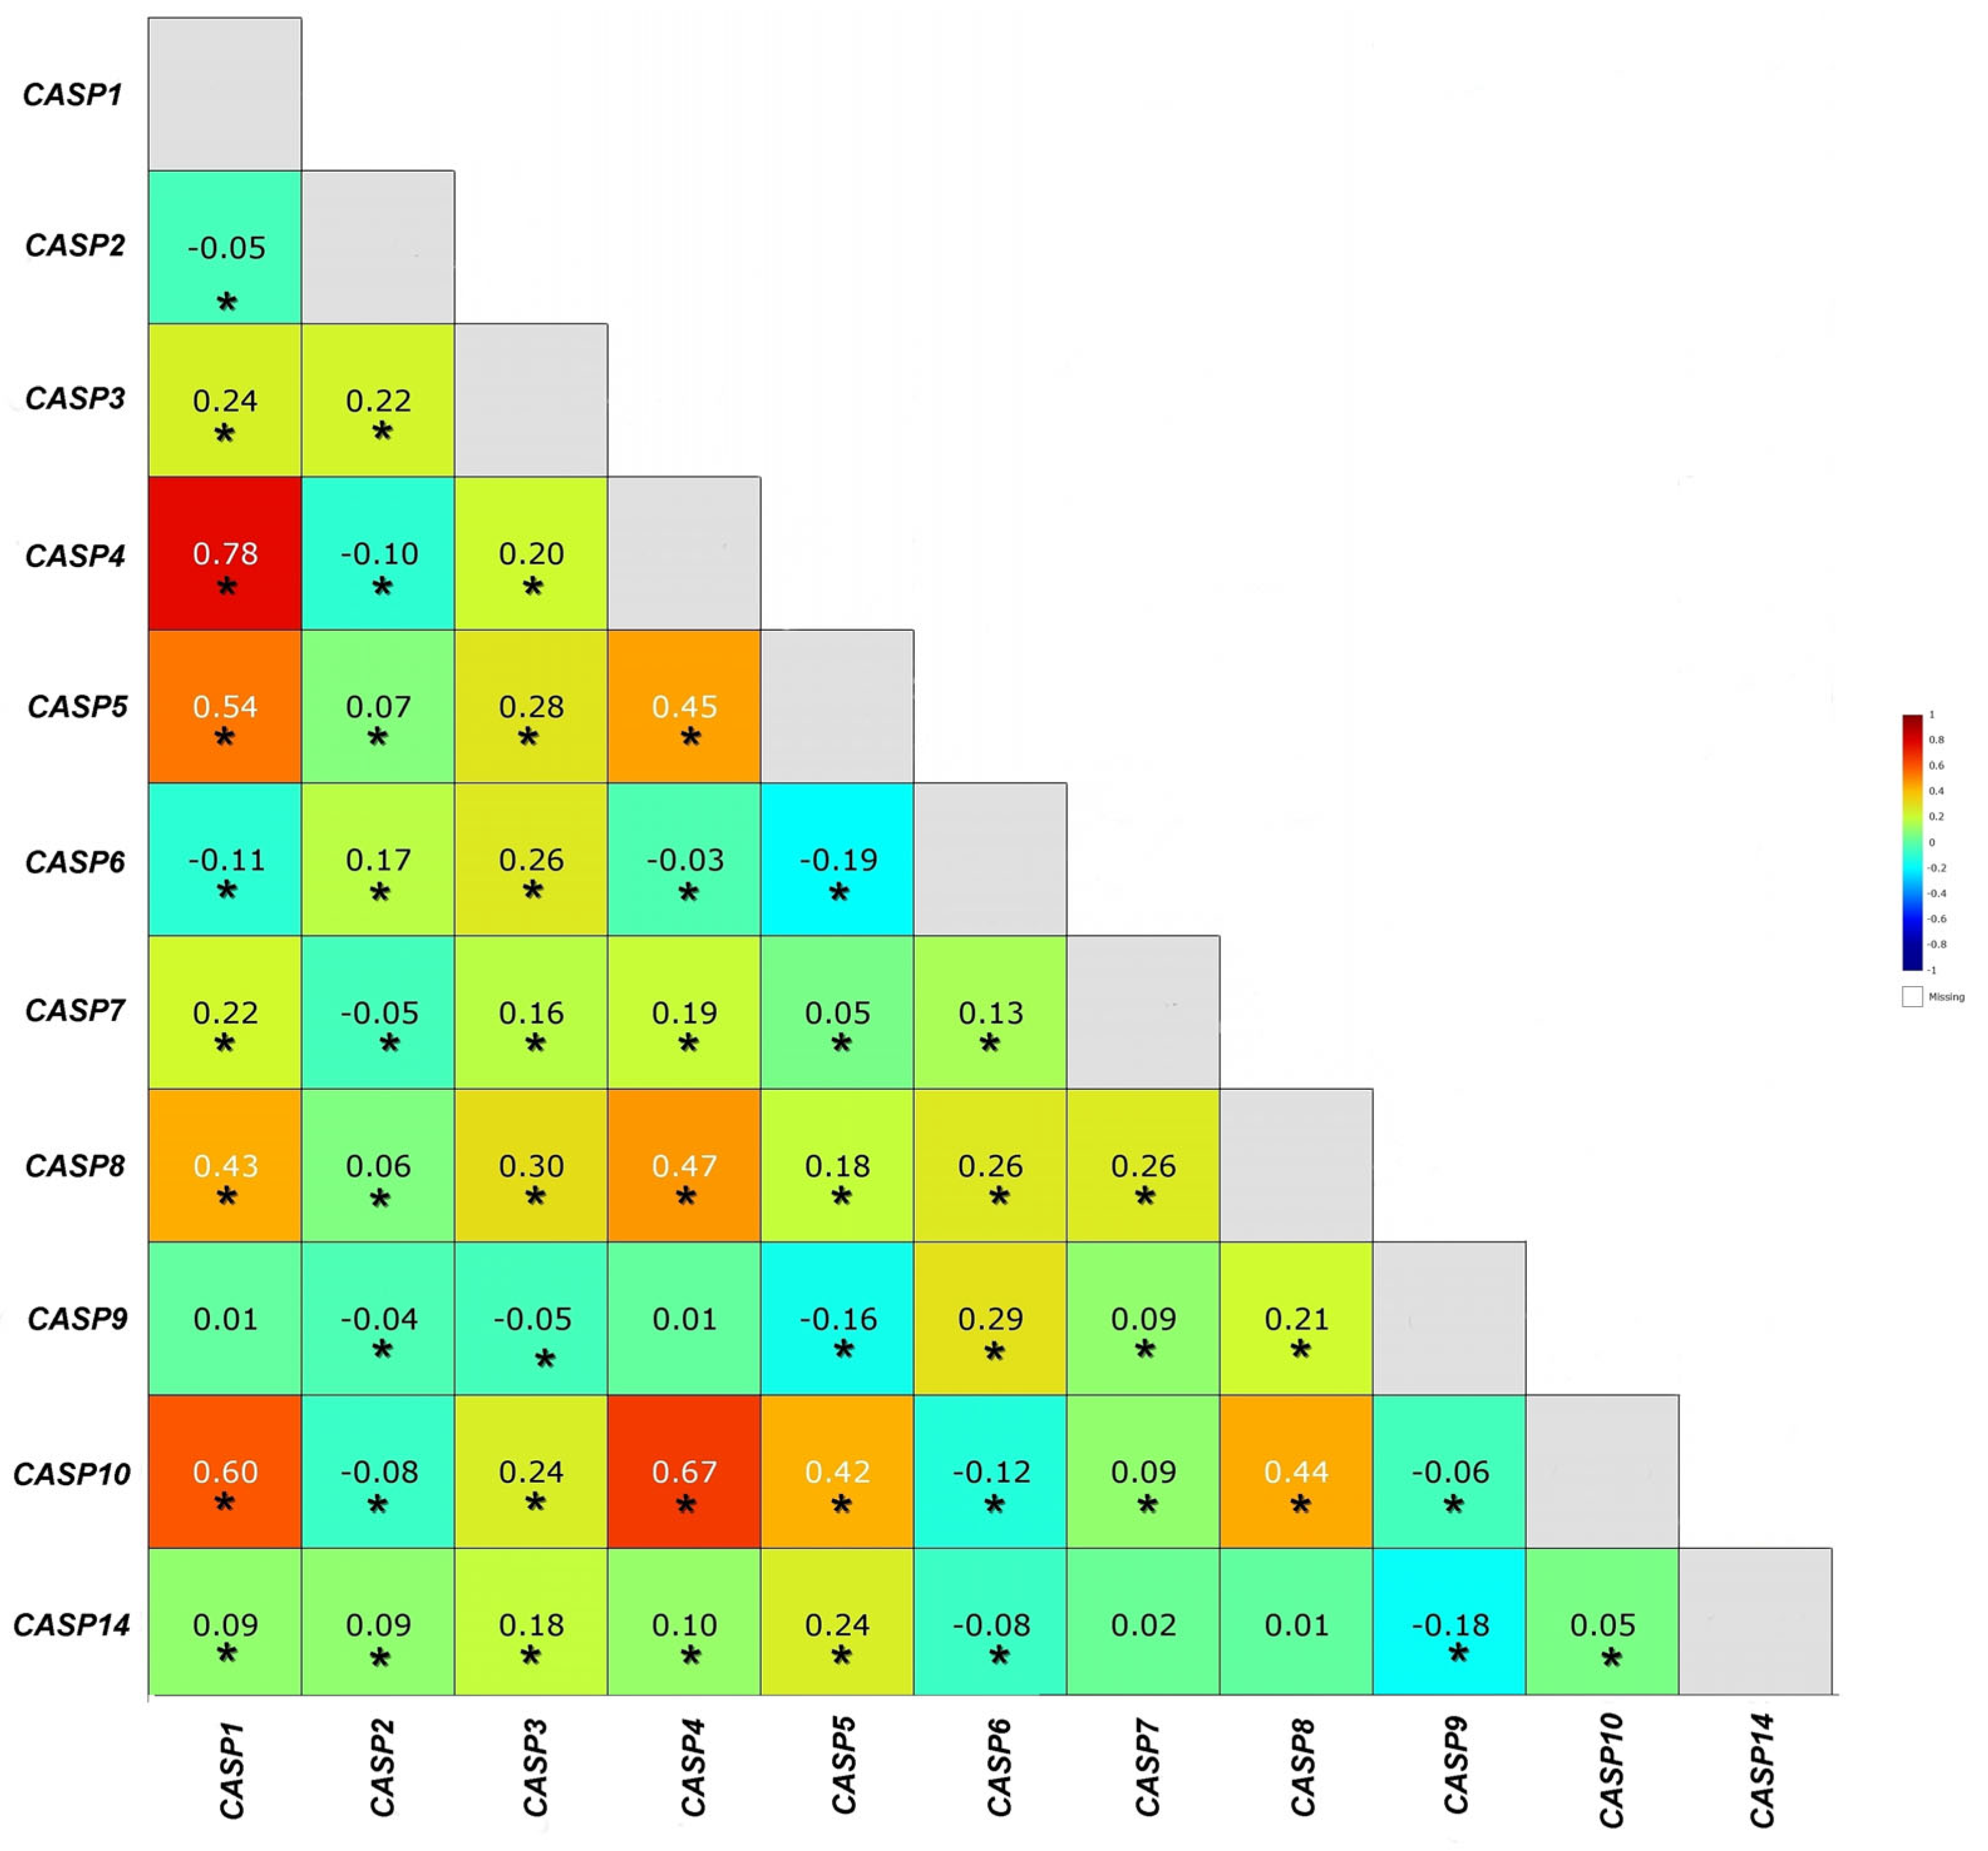
2.2. Determination of the Relationship Between the Genes of the Caspase Family. Comparison of the Results Obtained from the Experiments with the Results from the TCGA Database
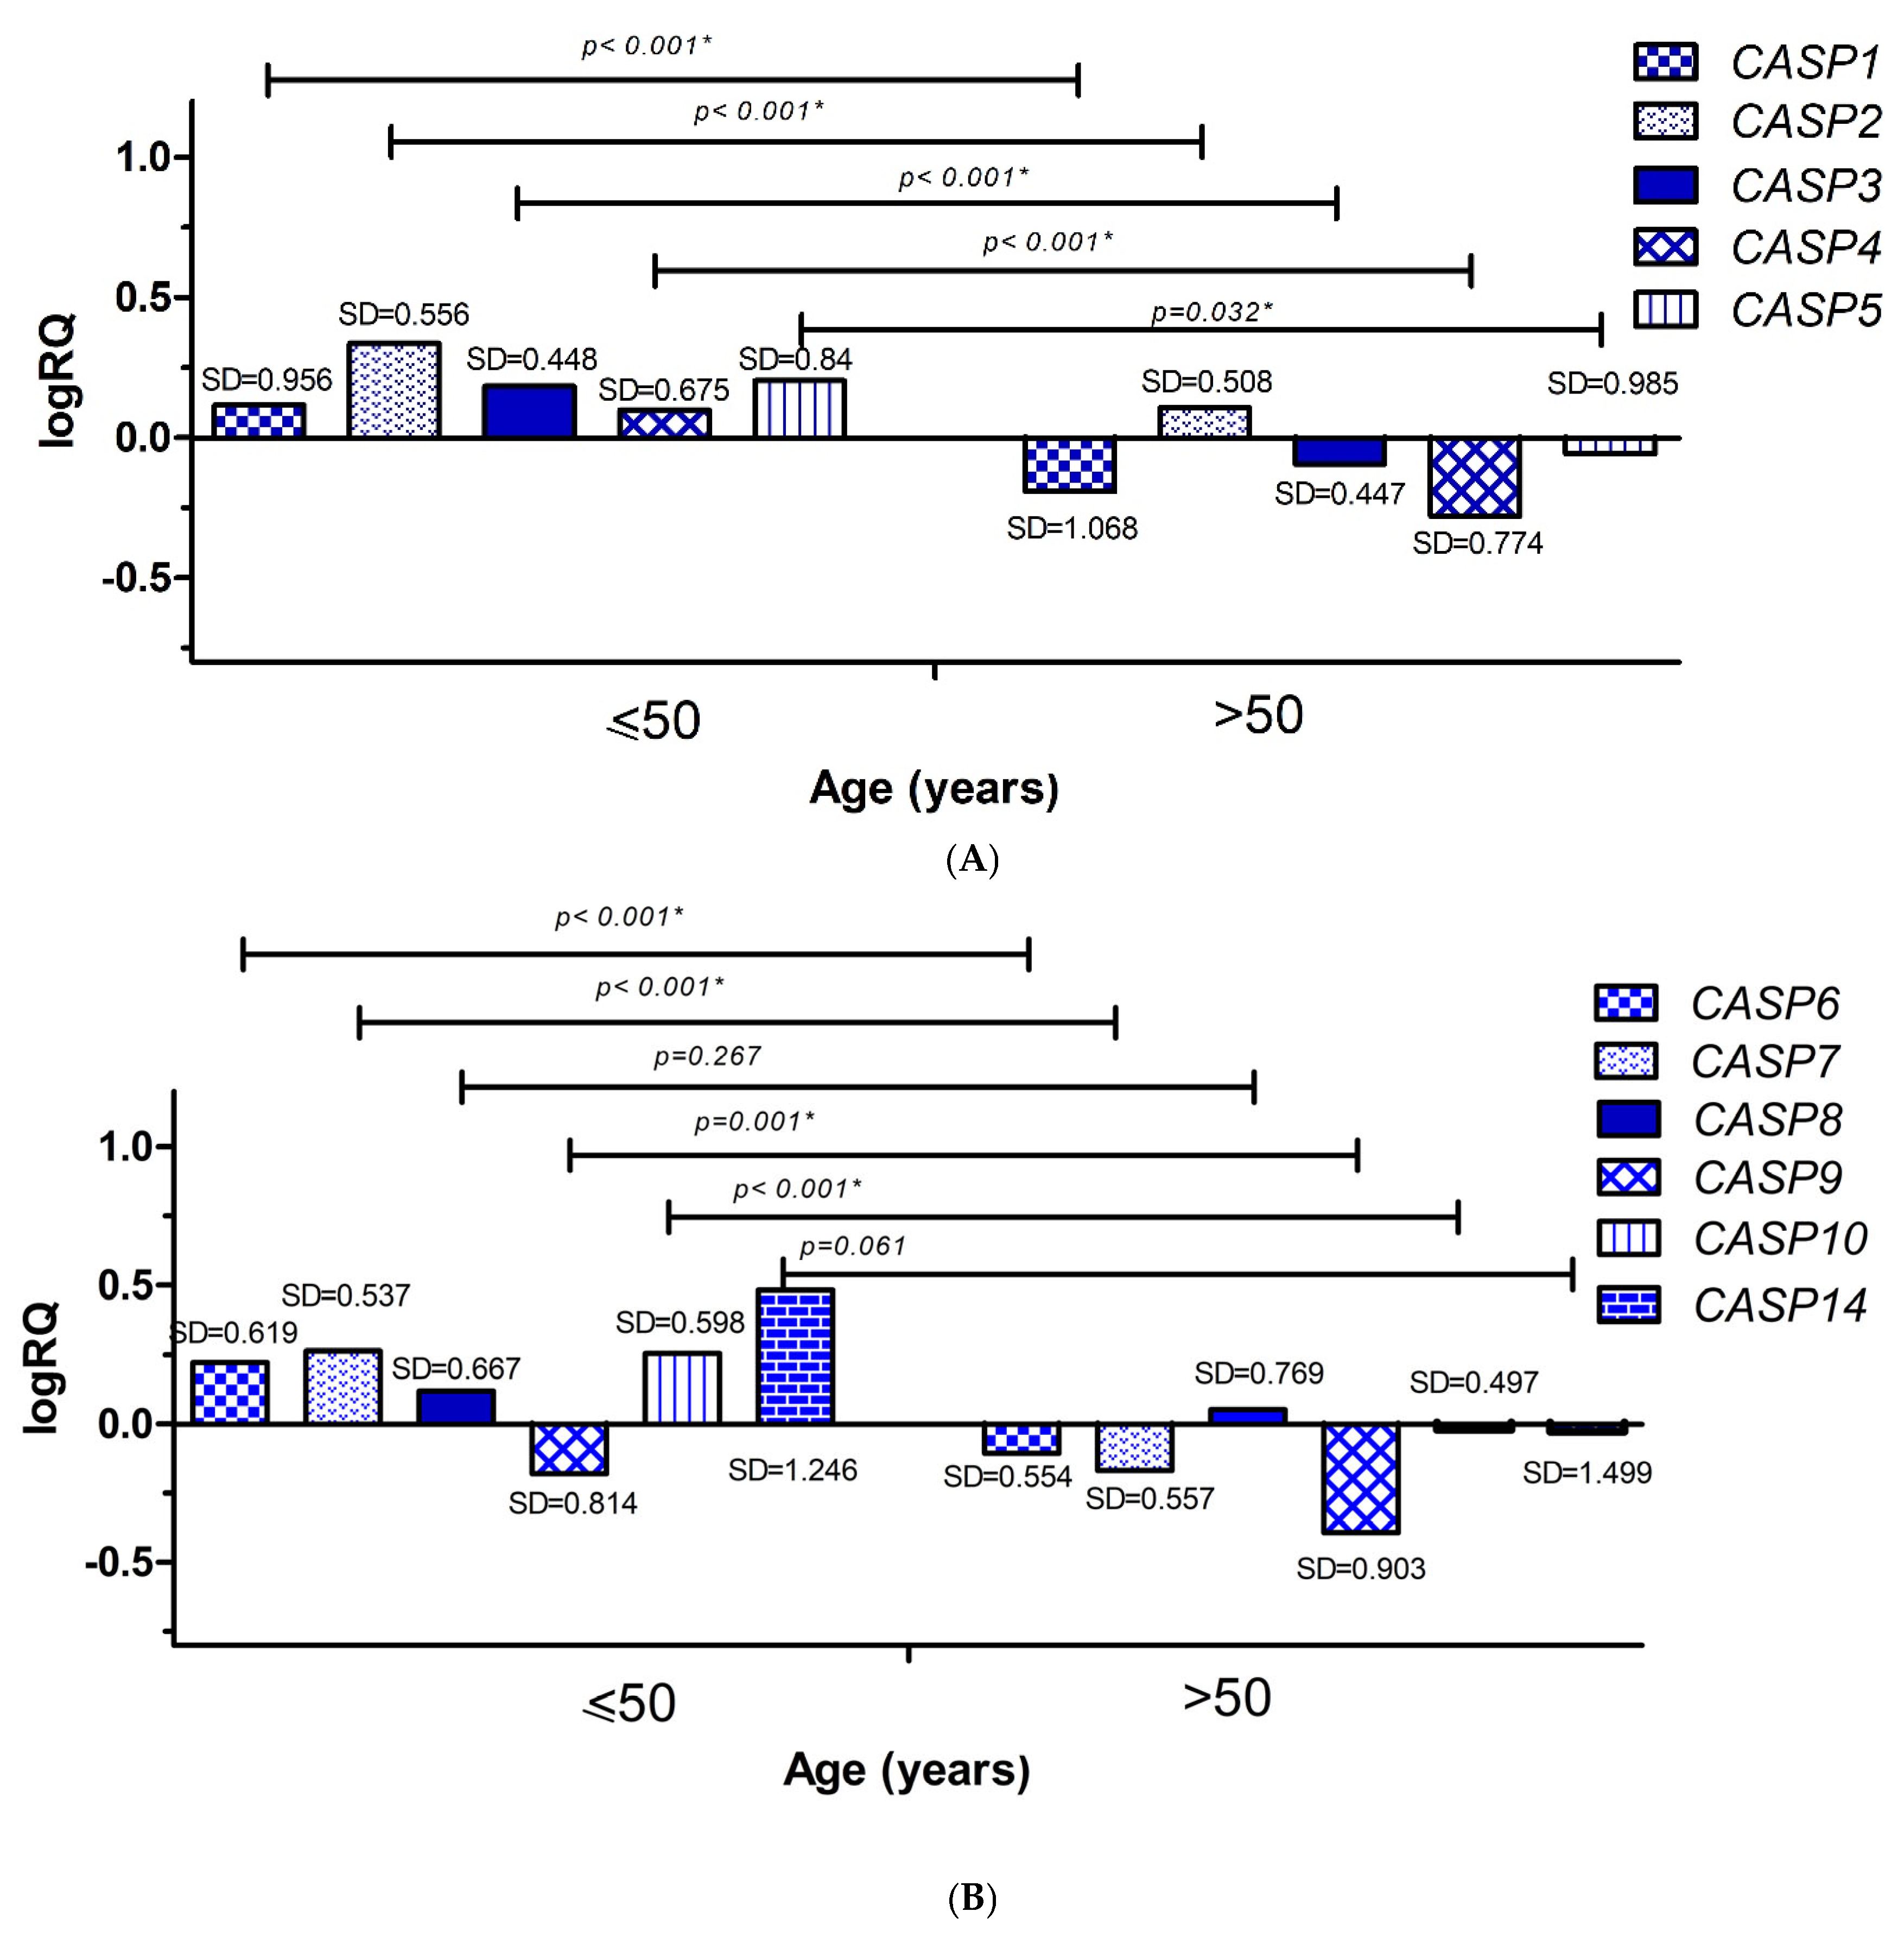
2.3. Analysis of the Relationship Between the Average Levels of Expression of Selected Genes from the Caspase Family and Clinical Data
2.3.1. Age
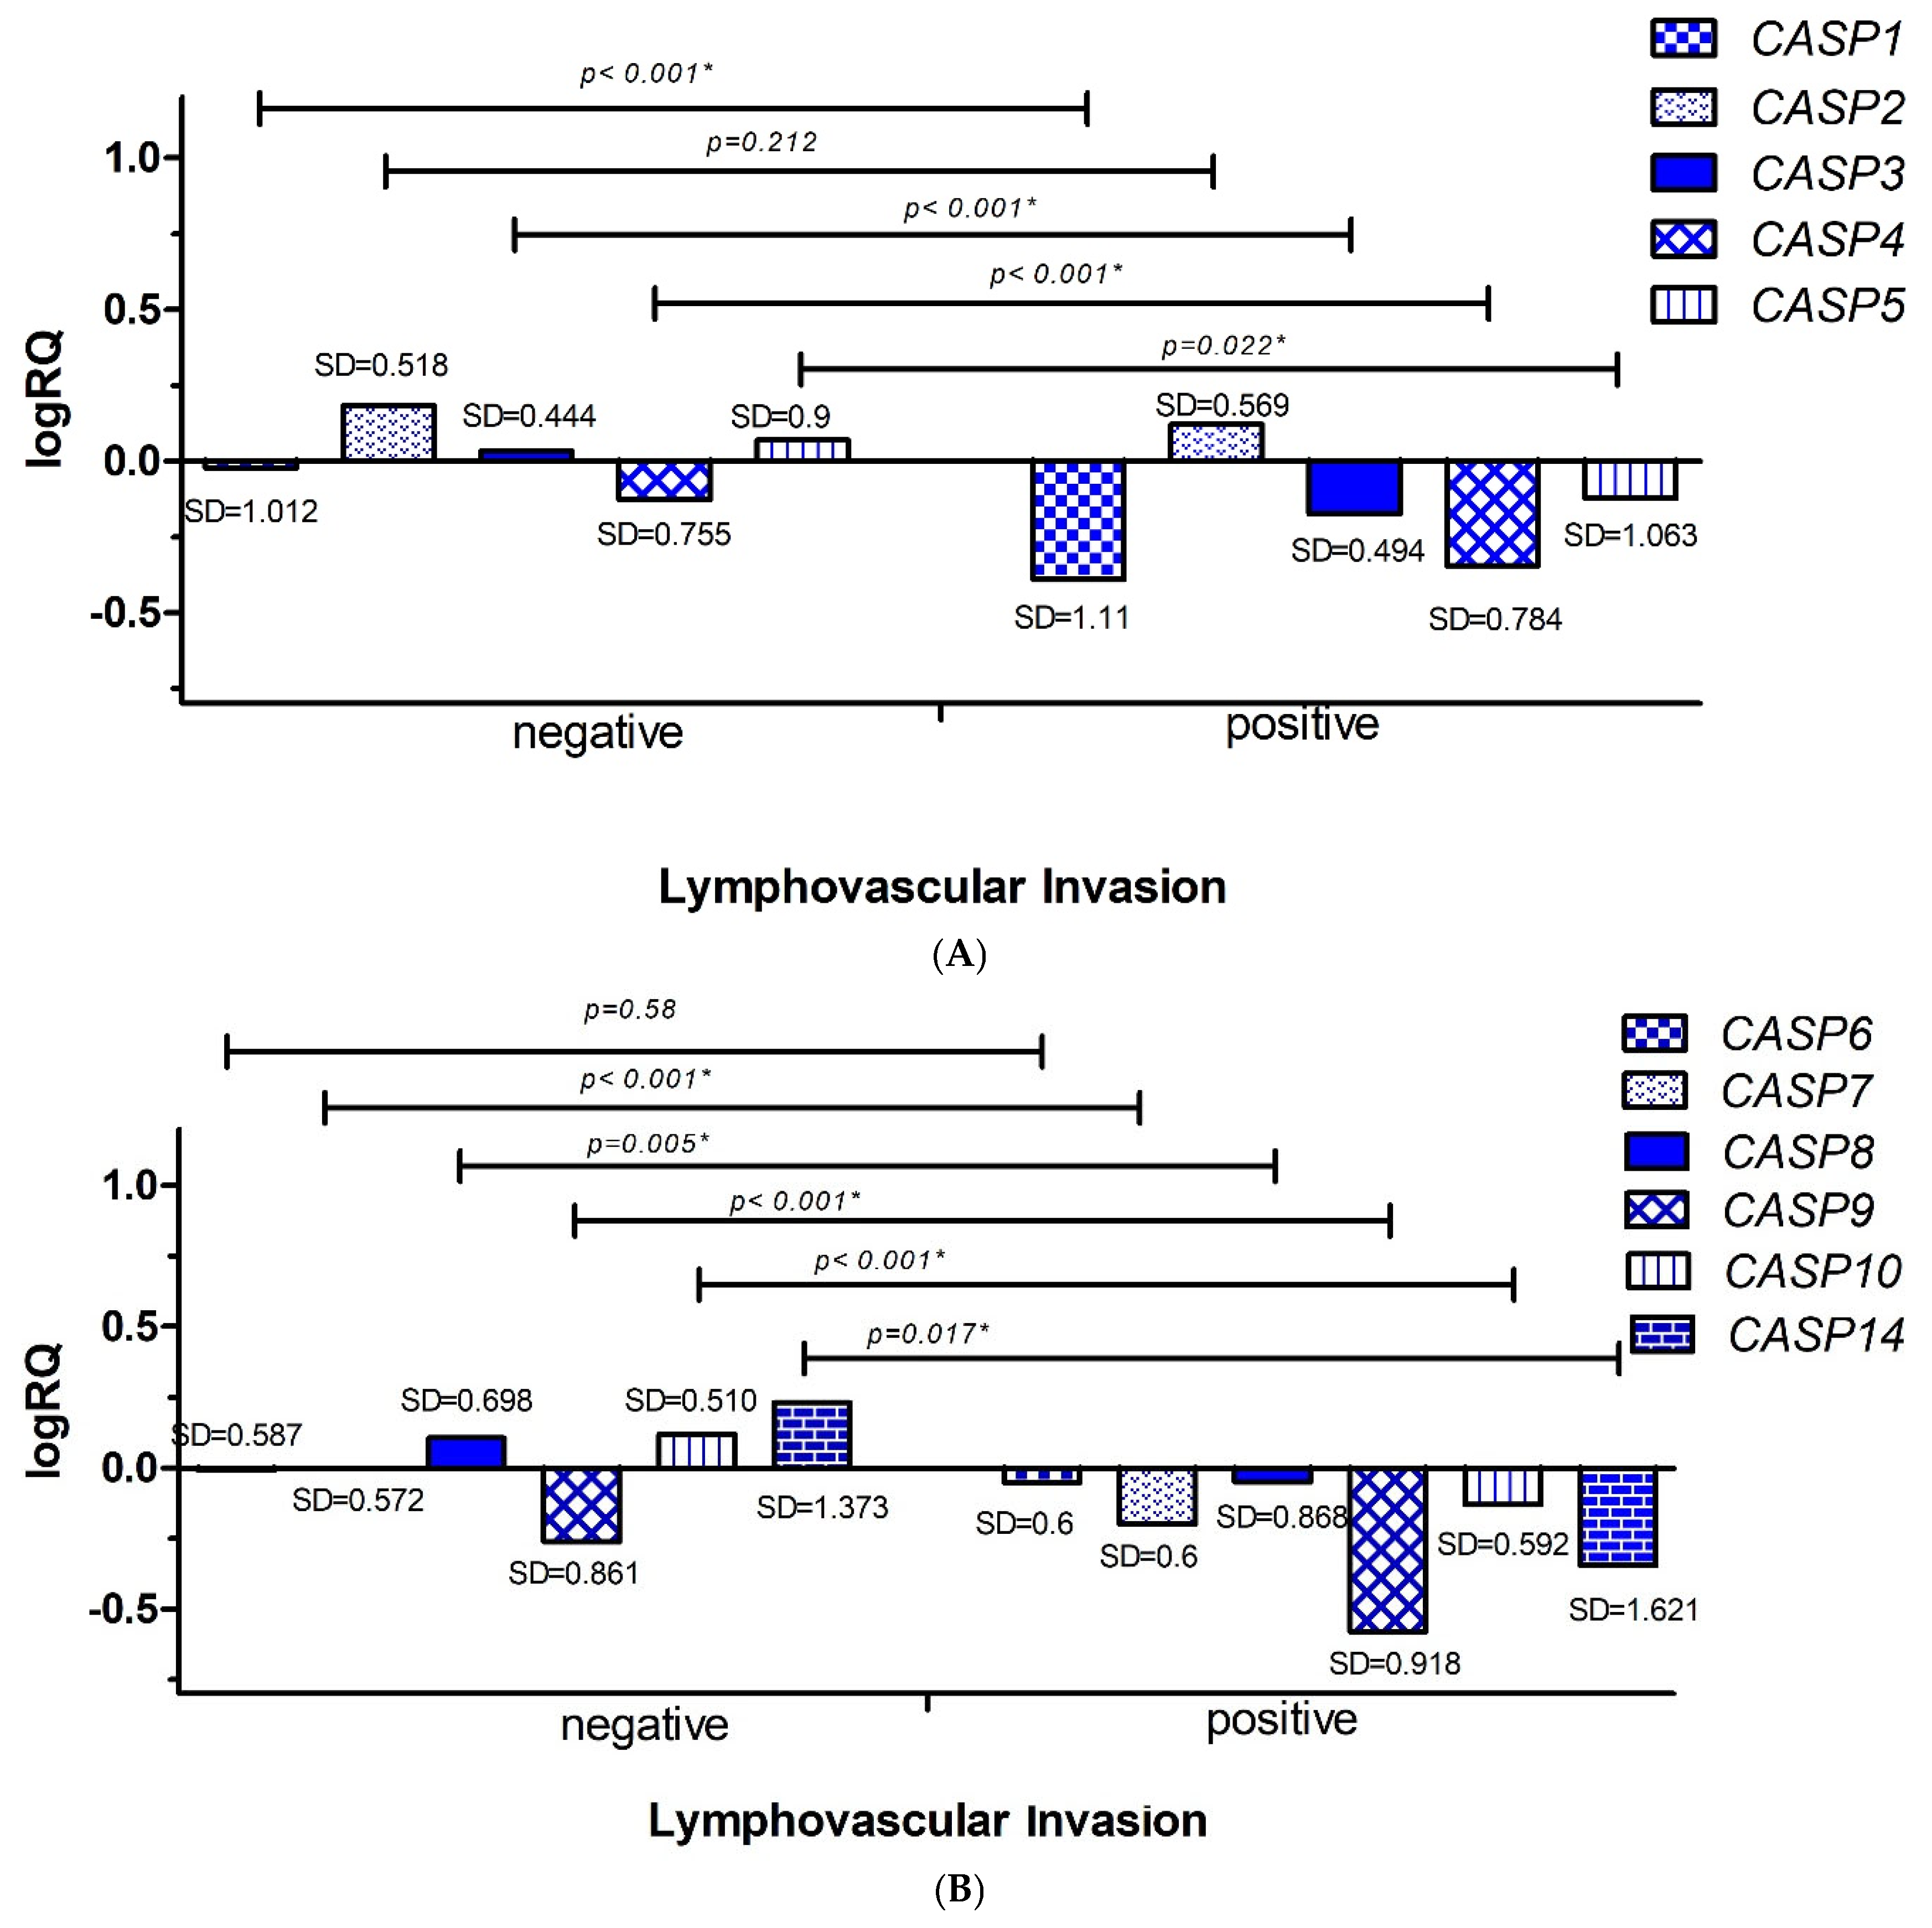
2.3.2. Lymphovascular Invasion
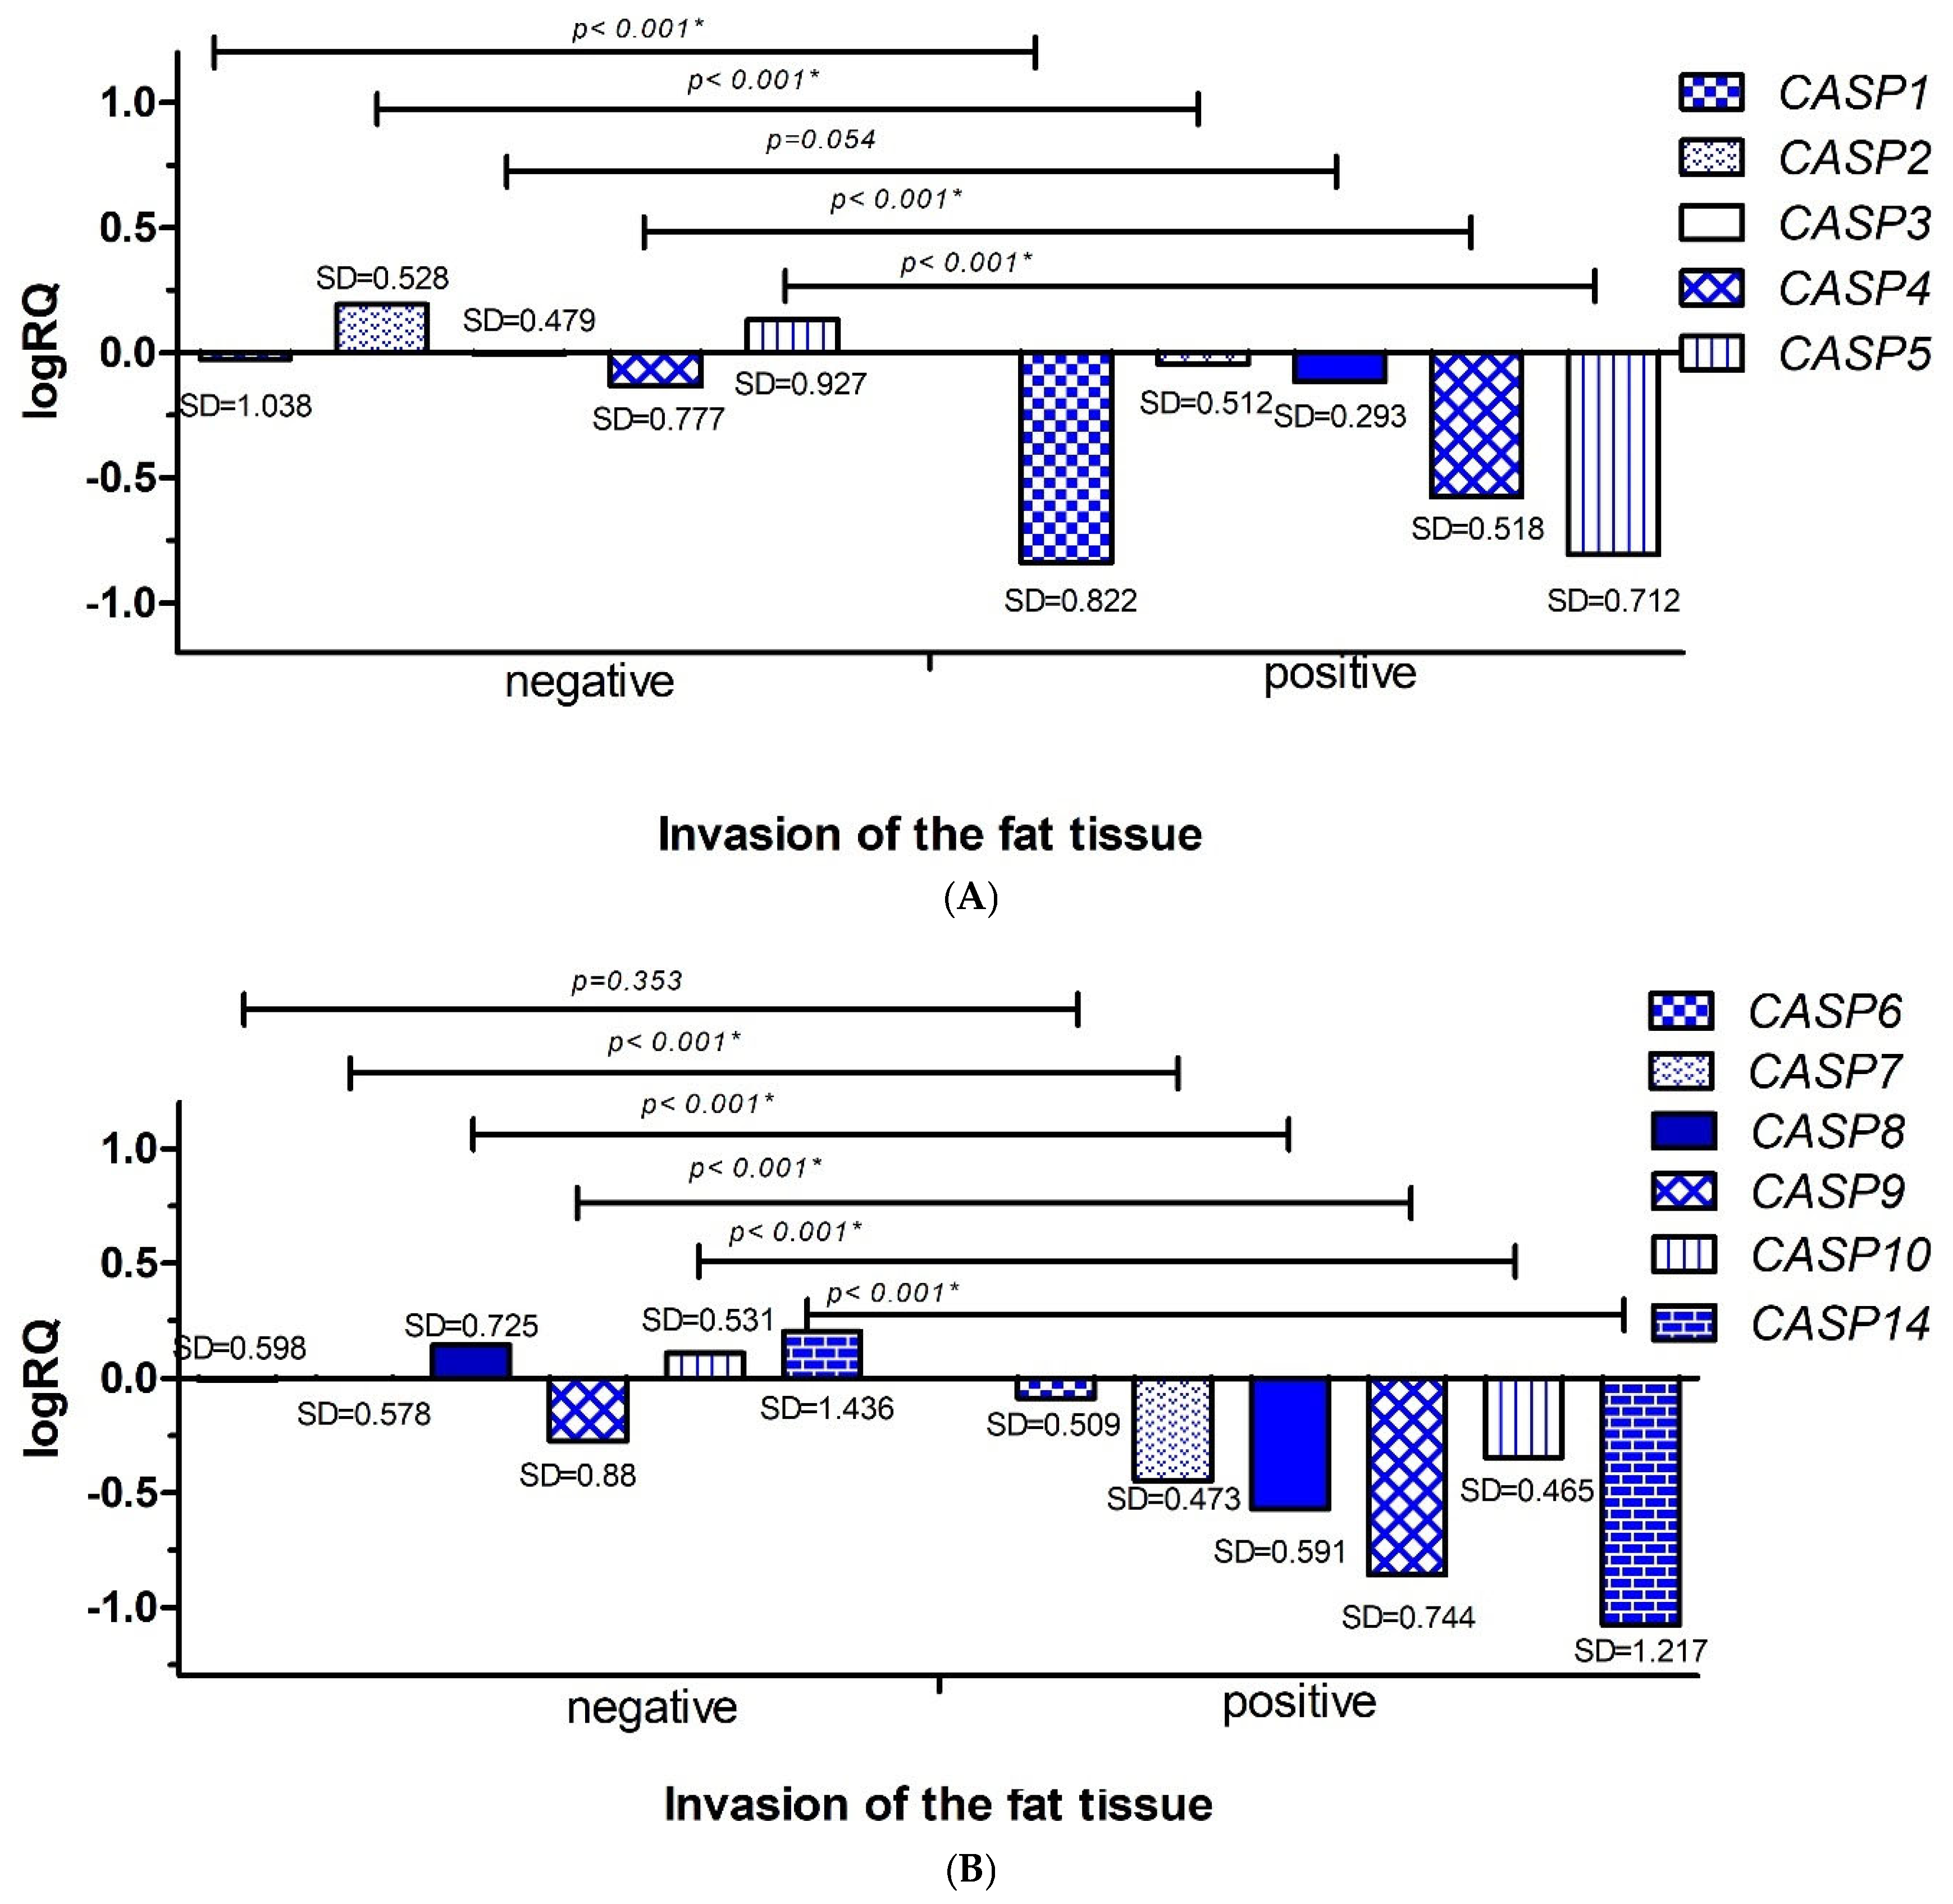
2.3.3. Invasion of the Fat Tissue
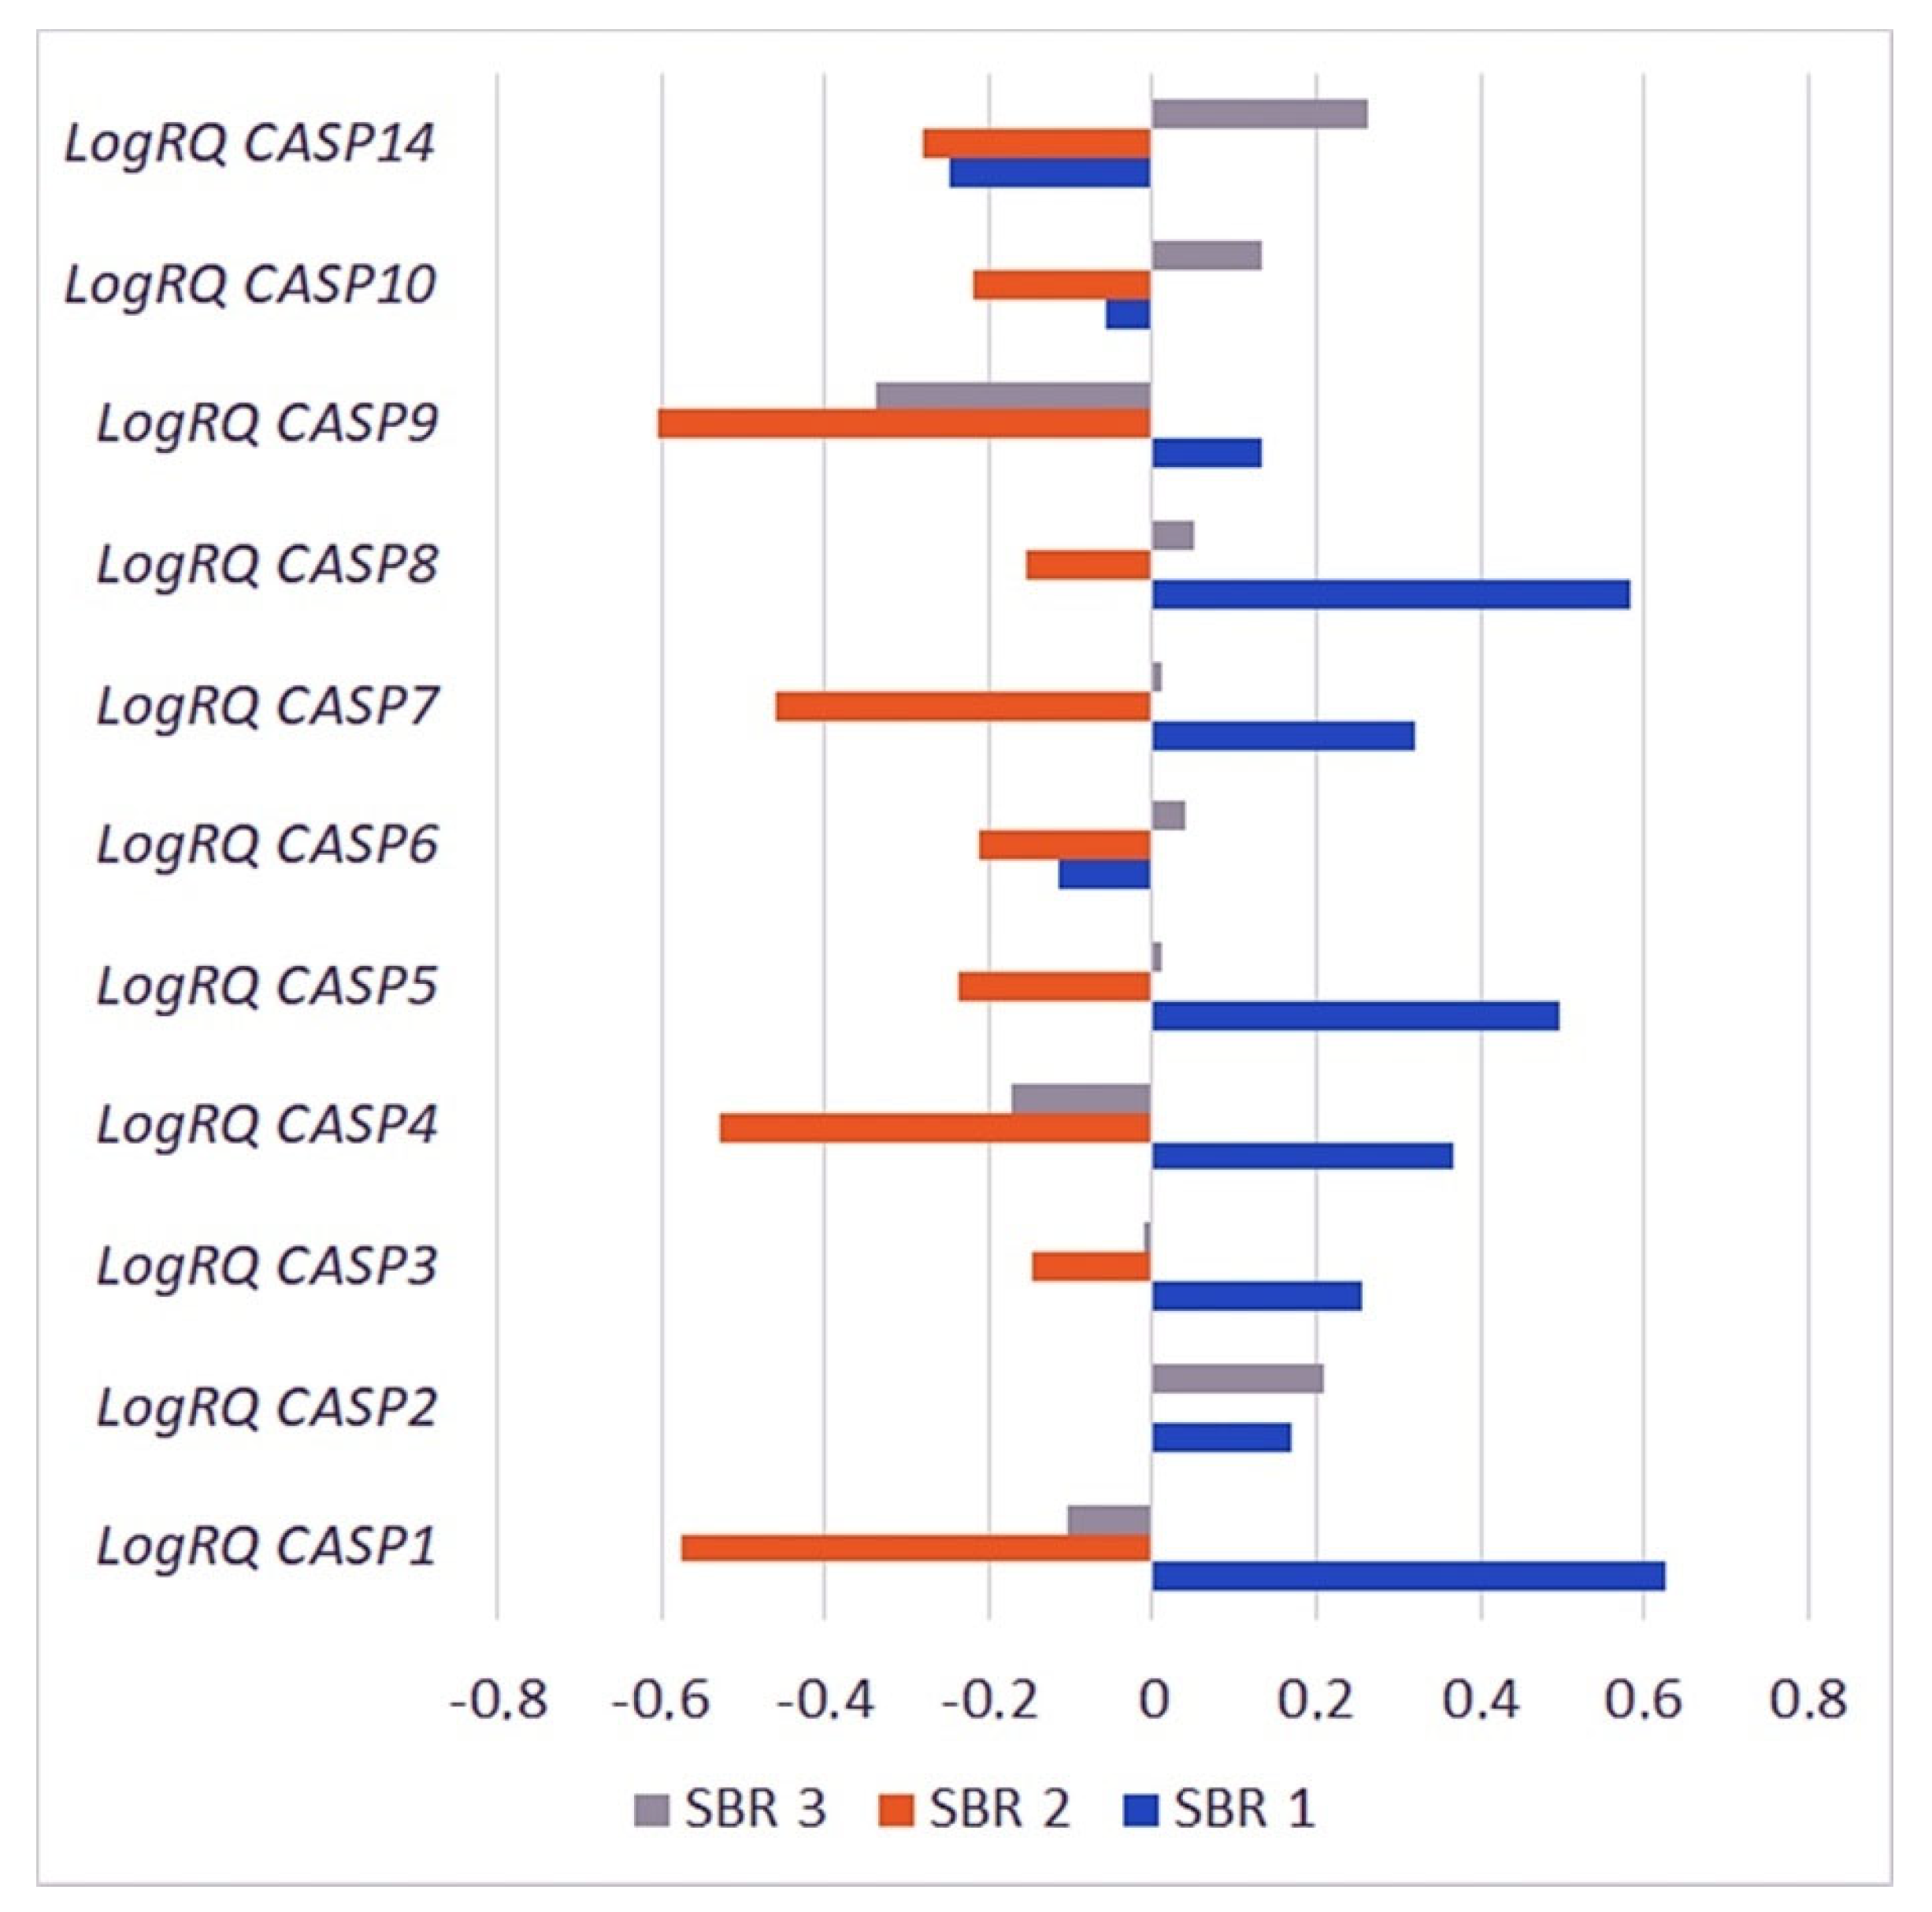
2.3.4. The Scarff–Bloom–Richardson (SBR) Grading System
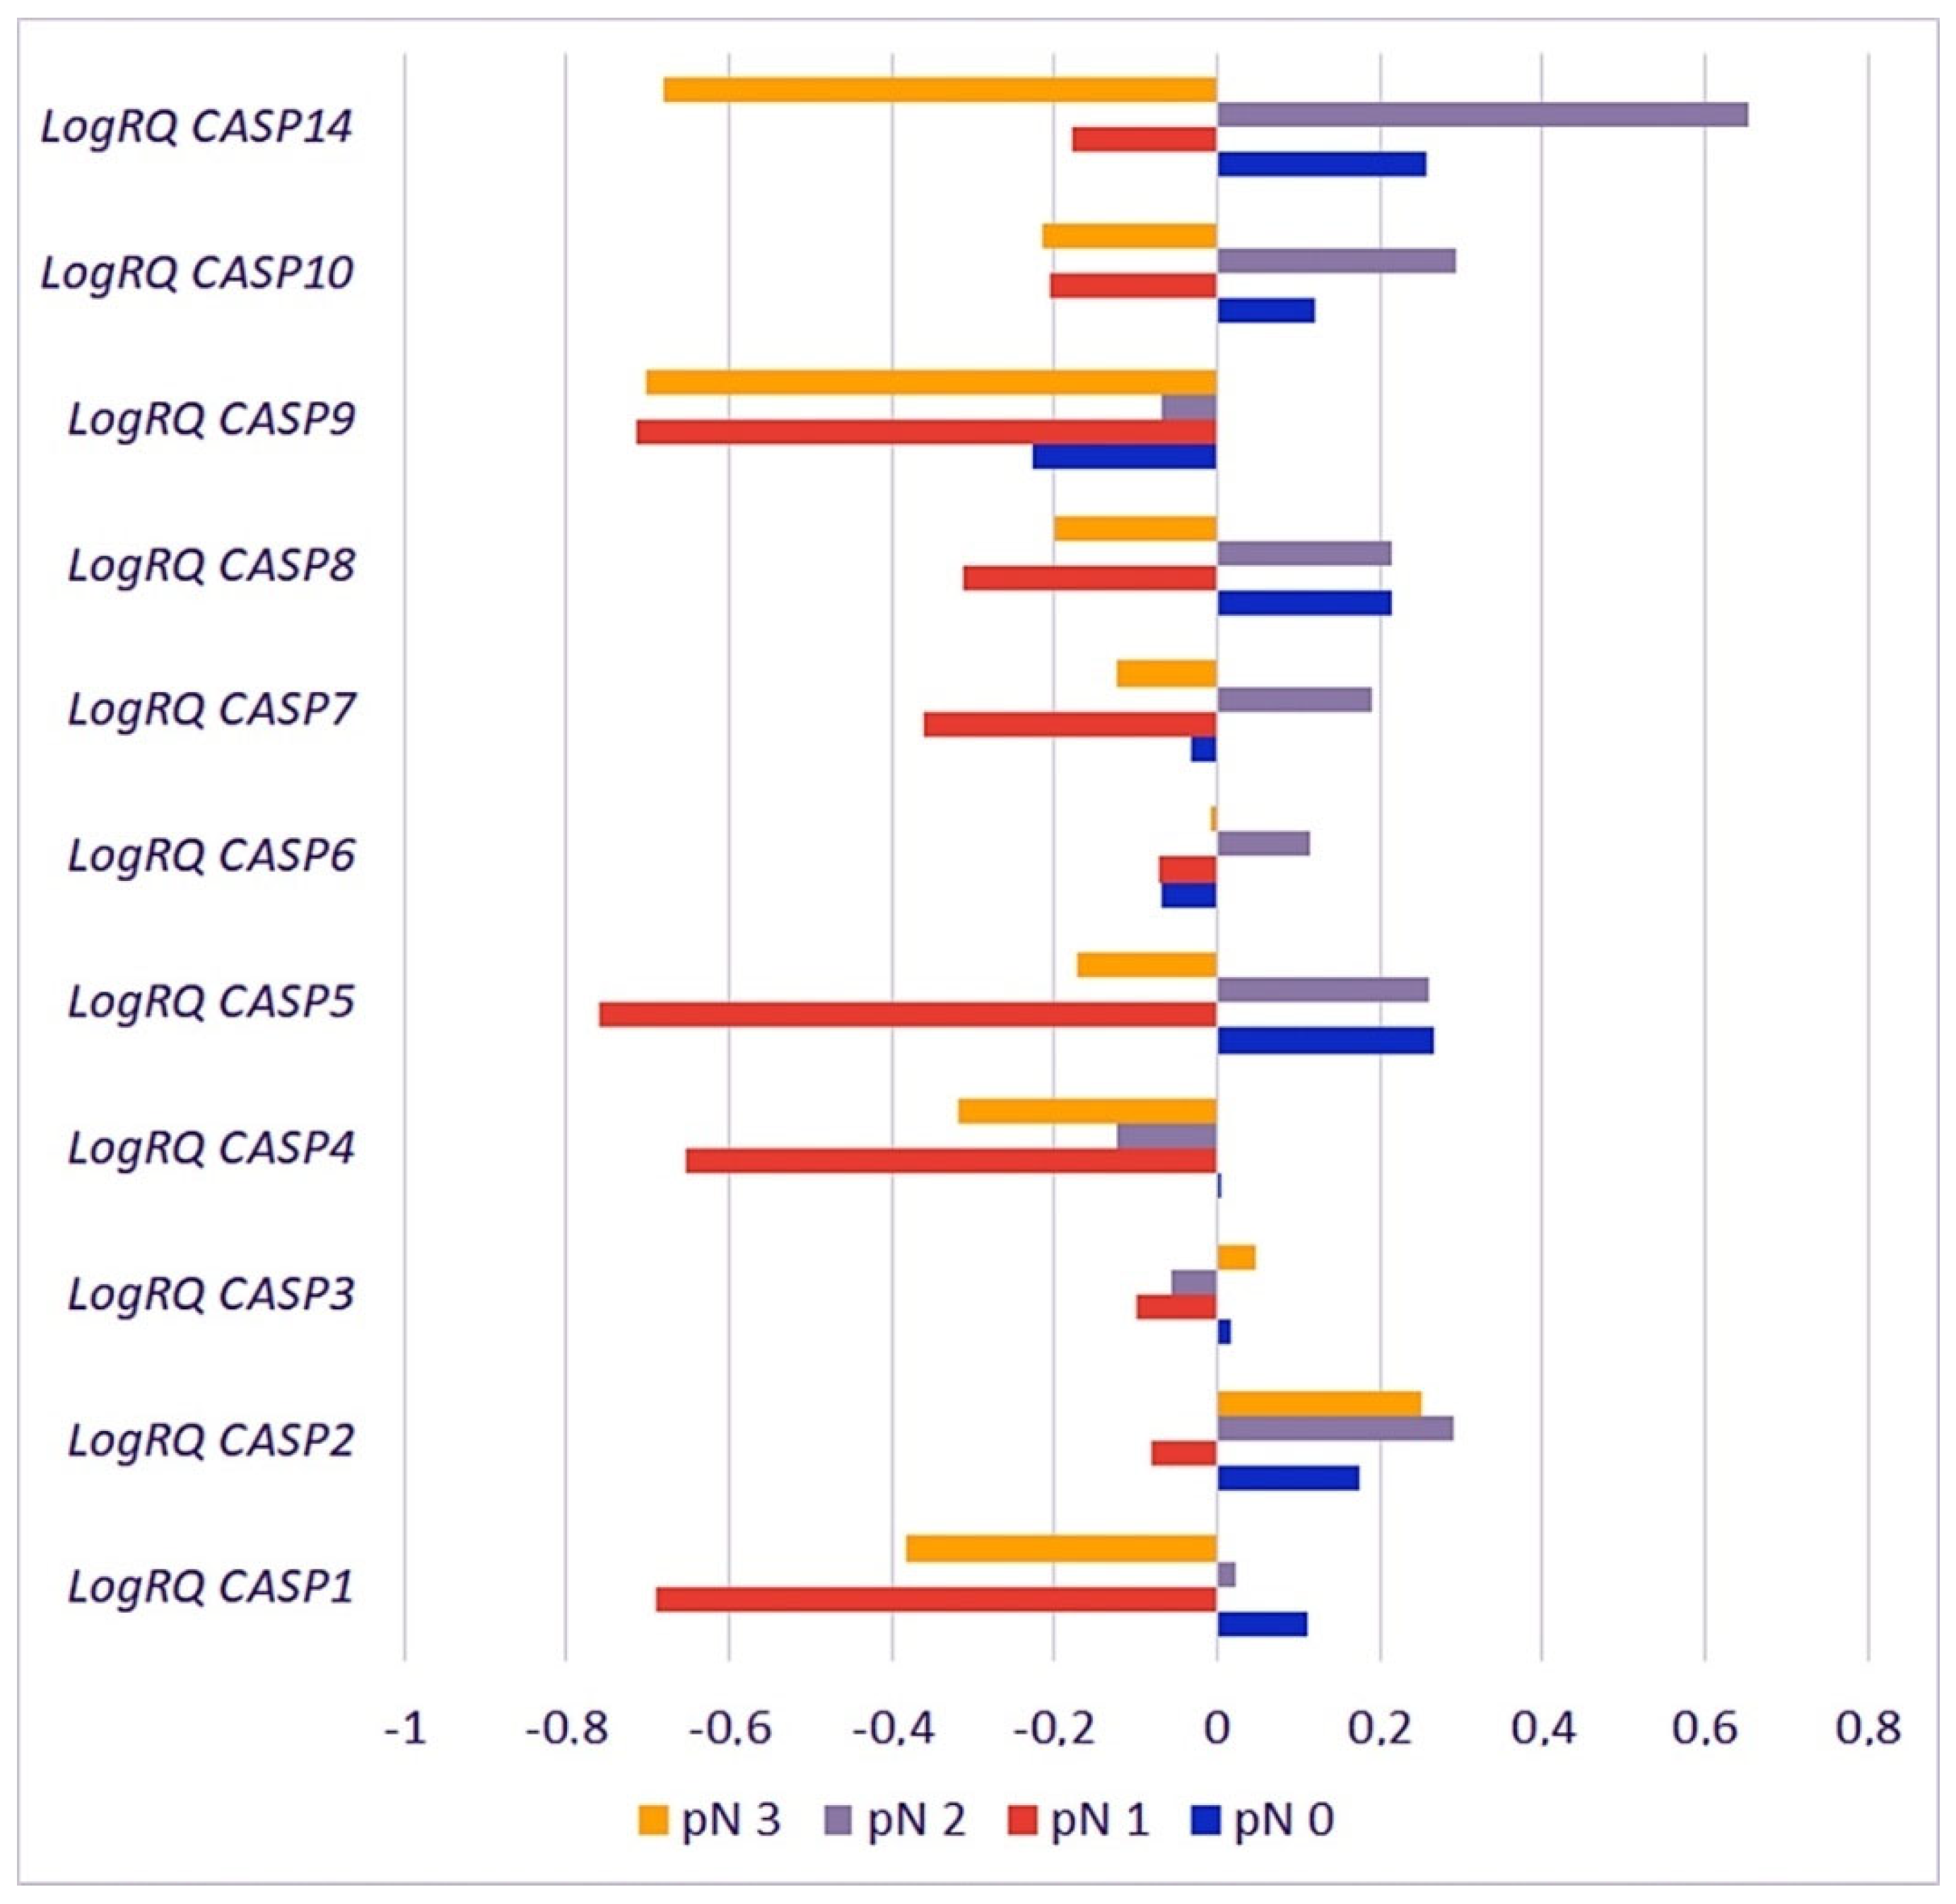
2.3.5. Metastases to the Lymph Nodes
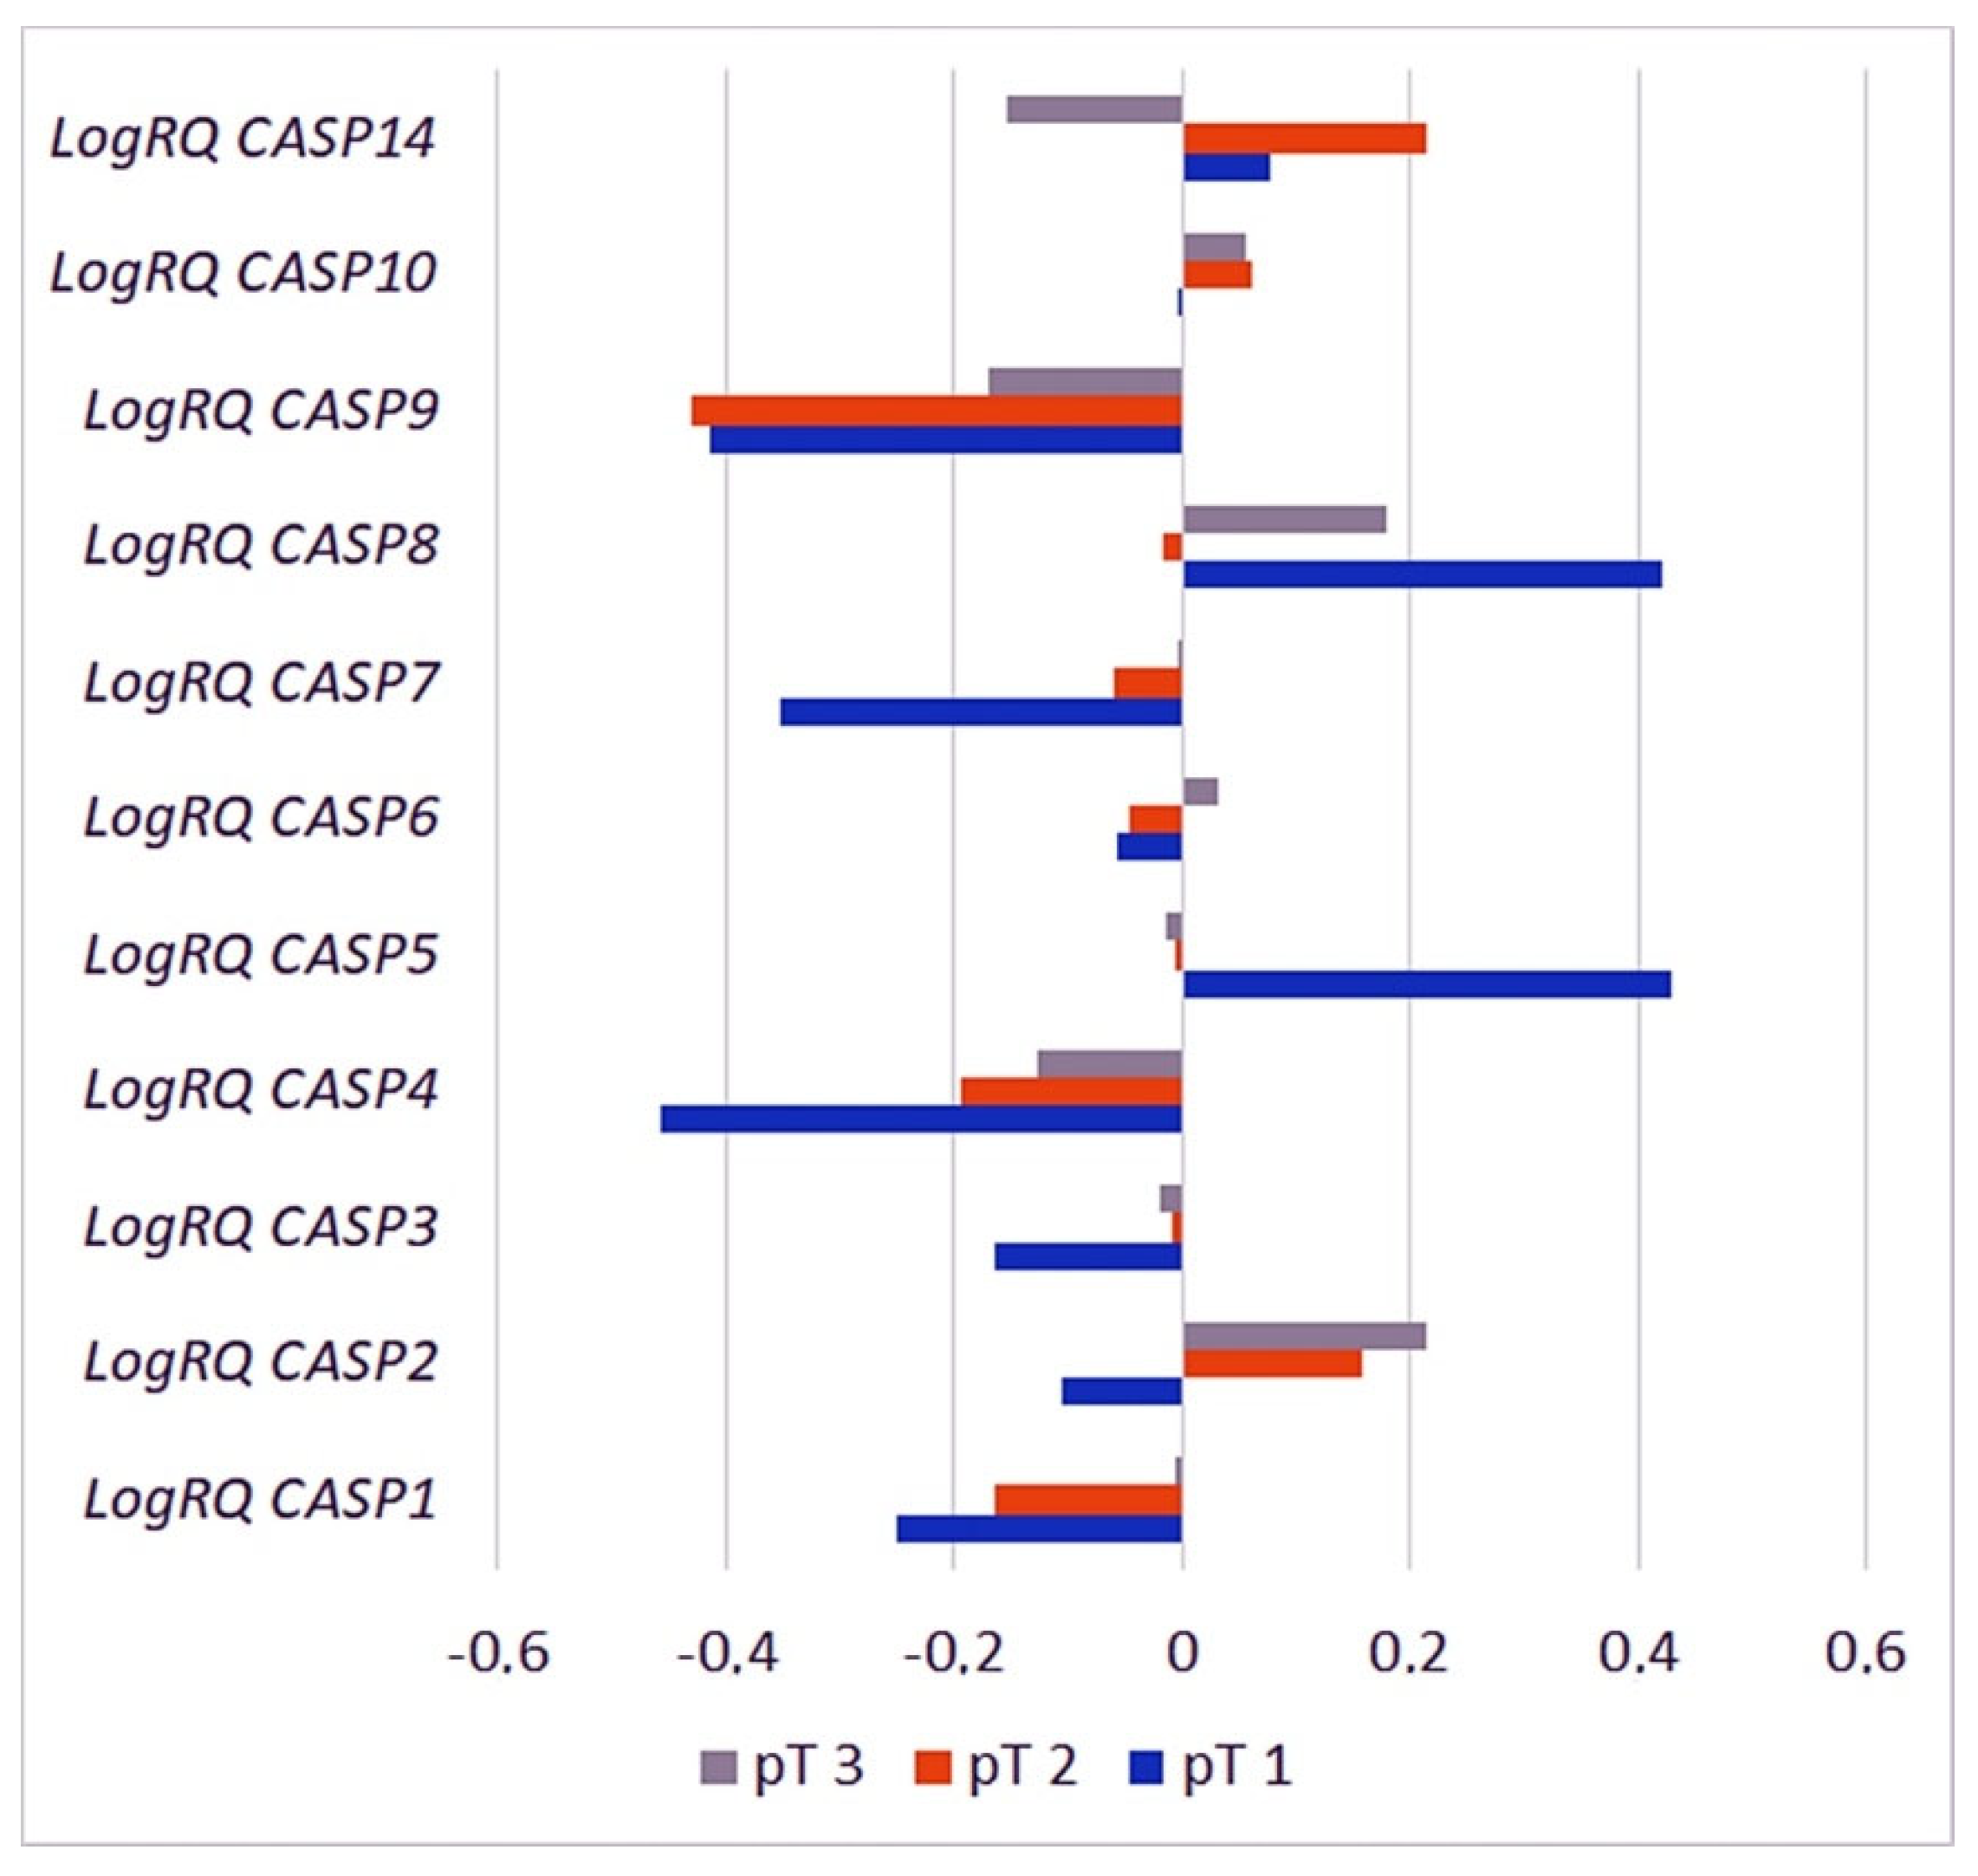
2.3.6. Primary Tumor Size
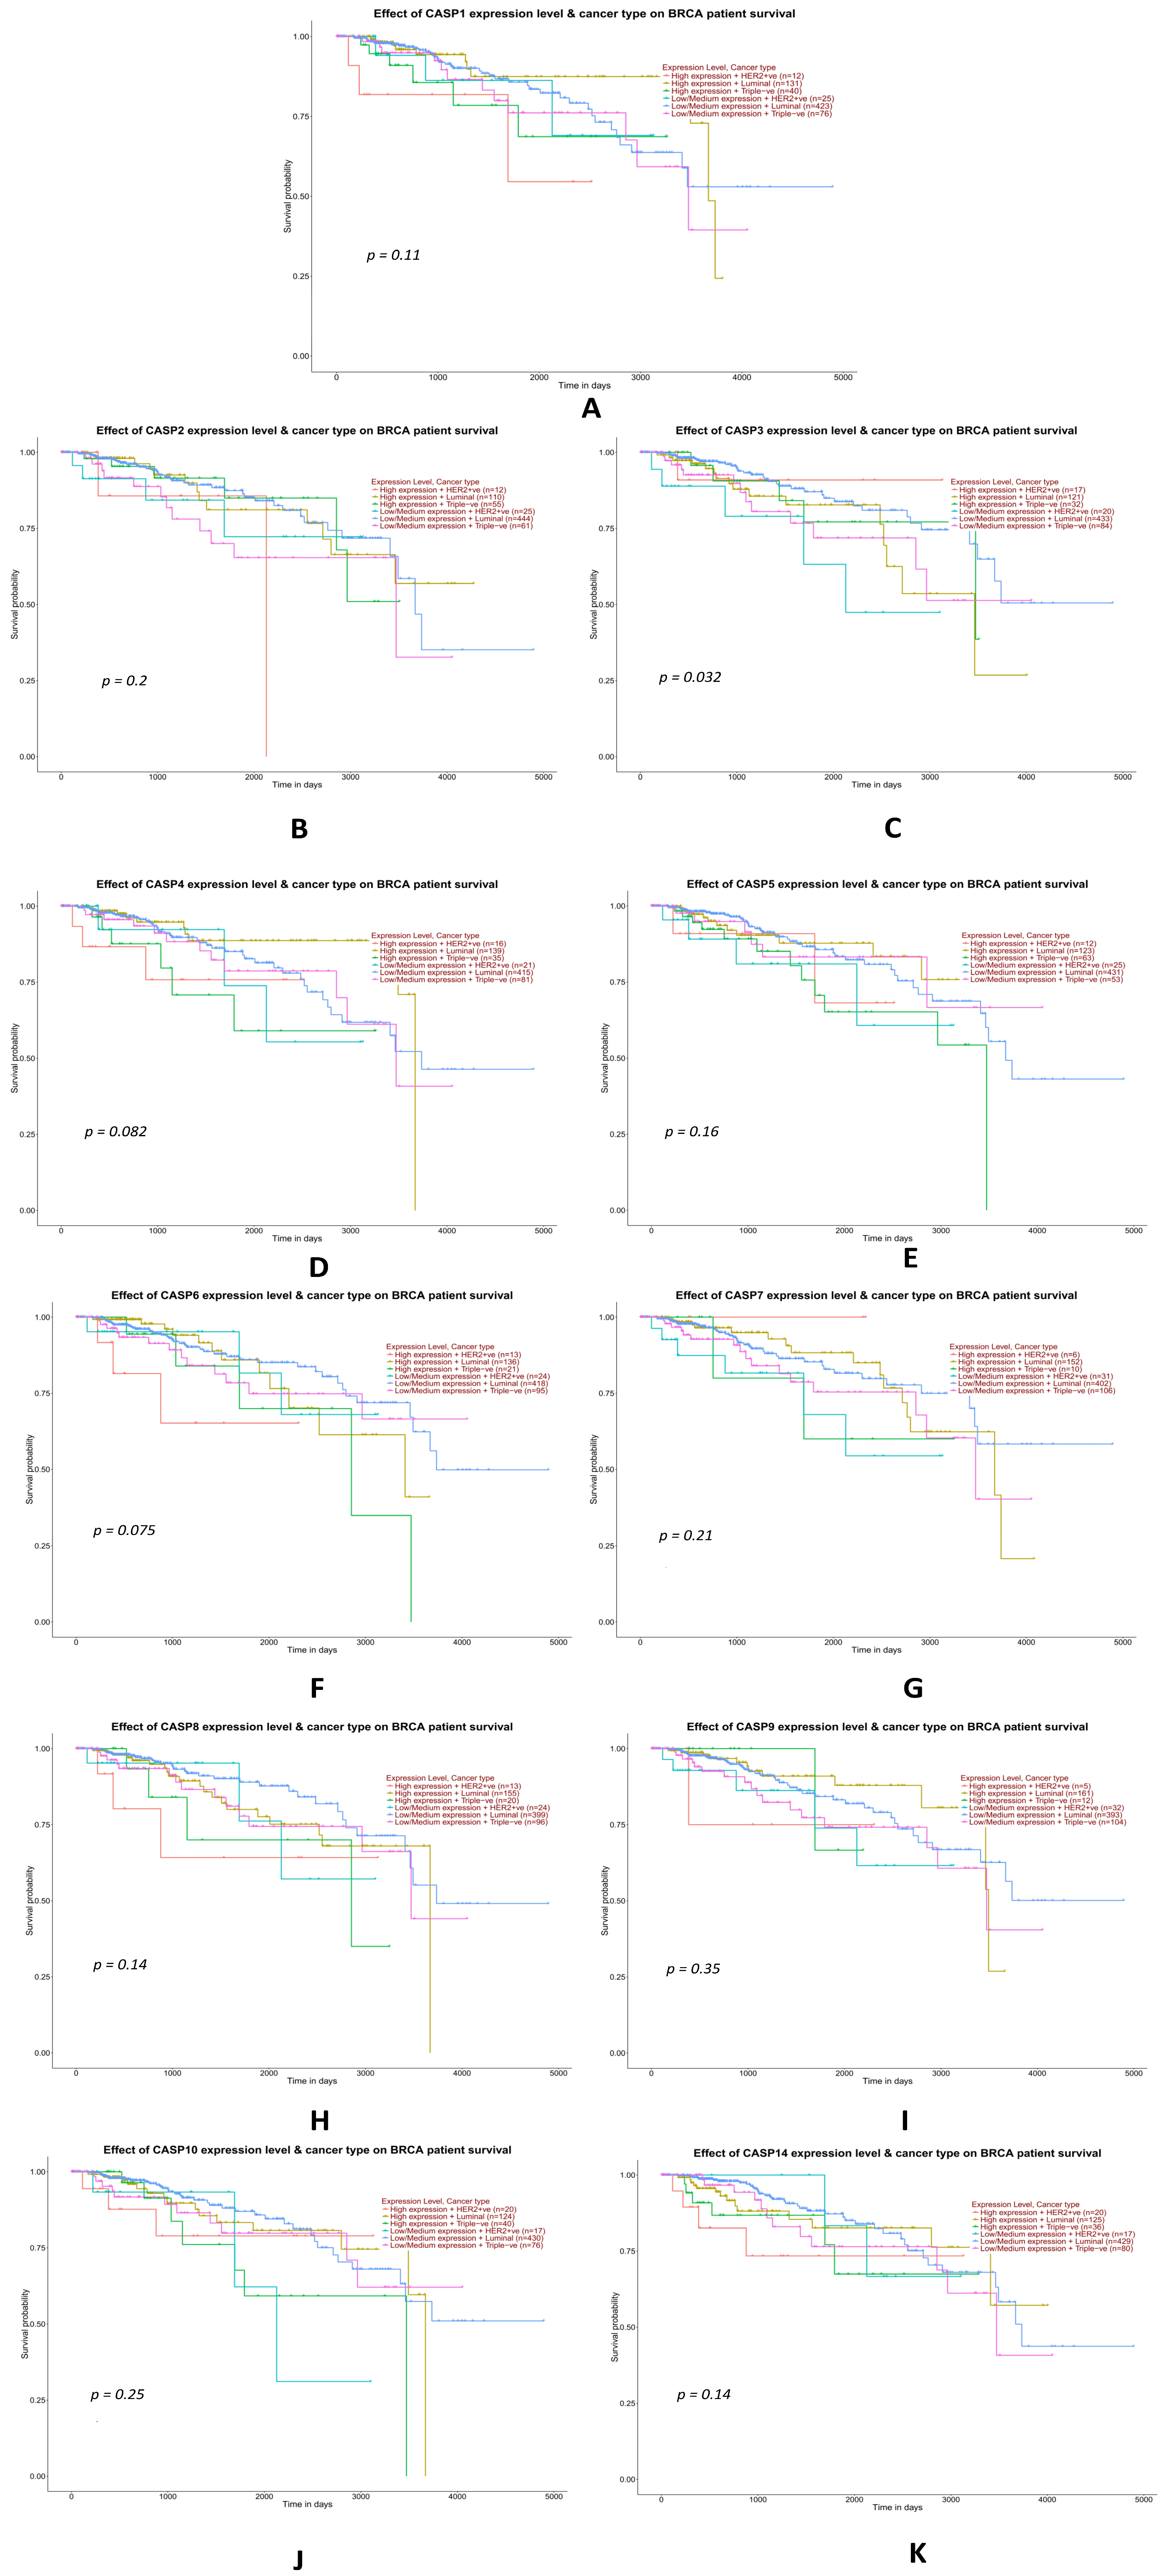
2.3.7. Analysis of Data from the TCGA Database on the Impact of the Expression Levels of Selected Genes from the Caspase Family on the Overall Survival of TNBC Patients
3. Discussion
4. Materials and Methods
4.1. Characteristics of the Study Group of Patients
4.2. Preparation of Material for Research
4.3. RNA Isolation, cDNA Reverse Transcription, and Gene Expression Analysis
4.4. Statistical Data Analysis
Supplementary Materials
Author Contributions
Funding
Institutional Review Board Statement
Informed Consent Statement
Data Availability Statement
Acknowledgments
Conflicts of Interest
References
- Barzaman, K.; Karami, J.; Zarei, Z.; Hosseinzadeh, A.; Kazemi, M.H.; Moradi-Kalbolandi, S.; Safari, E.; Farahmand, L. Breast cancer: Biology, biomarkers, and treatments. Int. Immunopharmacol. 2020, 84, 106535. [Google Scholar] [CrossRef] [PubMed]
- Lehmann, B.D.; Bauer, J.A.; Chen, X.; Sanders, M.E.; Chakravarthy, A.B.; Shyr, Y.; Pietenpol, J.A. Identification of human triple-negative breast cancer subtypes and preclinical models for selection of targeted therapies. J. Clin. Investig. 2011, 121, 2750–2767. [Google Scholar] [CrossRef] [PubMed]
- Liedtke, C.; Mazouni, C.; Hess, K.R.; André, F.; Tordai, A.; Mejia, J.A.; Symmans, W.F.; Gonzalez-Angulo, A.M.; Hennessy, B.; Green, M.; et al. Response to neoadjuvant therapy and long-term survival in patients with triple-negative breast cancer. J. Clin. Oncol. 2008, 26, 1275–1281. [Google Scholar] [CrossRef] [PubMed]
- Won, K.-A.; Spruck, C. Triple-negative breast cancer therapy: Current and future perspectives (Review). Int. J. Oncol. 2020, 57, 1245–1261. [Google Scholar] [CrossRef]
- Bonotto, M.; Gerratana, L.; Poletto, E.; Driol, P.; Giangreco, M.; Russo, S.; Minisini, A.M.; Andreetta, C.; Mansutti, M.; Pisa, F.E.; et al. Measures of outcome in metastatic breast cancer: Insights from a real-world scenario. Oncologist 2014, 19, 608–615. [Google Scholar] [CrossRef]
- Kumar, P.; Aggarwal, R. An overview of triple-negative breast cancer. Arch. Gynecol. Obstet. 2016, 293, 247–269. [Google Scholar] [CrossRef]
- Hu, Y.; Wang, C.; Liang, H.; Li, J.; Yang, Q. The treatment landscape of triple-negative breast cancer. Med. Oncol. 2024, 41, 236. [Google Scholar] [CrossRef]
- Raman, R.; Debata, S.; Govindarajan, T.; Kumar, P. Targeting Triple-Negative Breast Cancer: Resistance Mechanisms and Therapeutic Advancements. Cancer Med. 2025, 14, e70803. [Google Scholar] [CrossRef]
- Boatright, K.M.; Salvesen, G.S. Mechanisms of caspase activation. Curr. Opin. Cell Biol. 2003, 15, 725–731. [Google Scholar] [CrossRef]
- Rastogi, R.P.; Sinha, R.P.; Sinha, R.P. Apoptosis: Molecular mechanisms and pathogenicity. EXCLI J. 2009, 8, 155–181. [Google Scholar]
- Shalini, S.; Dorstyn, L.; Dawar, S.; Kumar, S. Old, new and emerging functions of caspases. Cell Death Differ. 2015, 22, 526–539. [Google Scholar] [CrossRef]
- White, K.; Arama, E.; Hardwick, J.M. Controlling caspase activity in life and death. PLoS Genet. 2017, 13, e1006545. [Google Scholar] [CrossRef] [PubMed]
- Taylor, R.C.; Cullen, S.P.; Martin, S.J. Apoptosis: Controlled demolition at the cellular level. Nat. Rev. Mol. Cell Biol. 2008, 9, 231–241. [Google Scholar] [CrossRef] [PubMed]
- Song, C.; Kendi, A.T.; Shim, J.Y.; Jung, D.; Kang, P.S.; Lowe, V.J.; Lee, S. ER–/PR+ breast cancer is controlled more effectively with an inflammatory inhibitor than hormonal inhibitor. Breast Cancer 2023, 30, 436–452. [Google Scholar] [CrossRef] [PubMed]
- McIlwain, D.R.; Berger, T.; Mak, T.W. Caspase functions in cell death and disease. Cold. Spring. Harb. Perspect. Biol. 2015, 5, a008656. [Google Scholar] [CrossRef]
- Adinew, G.M.; Messeha, S.; Taka, E.; Ahmed, S.A.; Soliman, K.F.A. The Role of Apoptotic Genes and Protein-Protein Interactions in Triple-negative Breast Cancer. Cancer Genom. Proteom. 2023, 20, 247–272. [Google Scholar] [CrossRef]
- Wittekind, C.; Meyer, H.J. TNM: Classification of Malignant Tumors, 7th ed.; Wiley-VCH: Weinheim, Germany, 2010; pp. 347–376. [Google Scholar]
- Ho, L.H.; Taylor, R.; Dorstyn, L.; Cakouros, D.; Bouillet, P.; Kumar, S. A tumor suppressor function for caspase-2. Proc. Natl. Acad. Sci. USA 2009, 106, 5336–5341. [Google Scholar] [CrossRef]
- Song, C.; Kendi, A.T.; Lowe, V.J.; Lee, S. The A20/TNFAIP3-CDC20-CASP1 Axis Promotes Inflammation-mediated Metastatic Disease in Triple-negative Breast Cancer. Anticancer Res. 2022, 42, 681–695. [Google Scholar] [CrossRef]
- Peng, J.; Wei, Q.; Zhou, S.; Gu, Z.; Lv, K. Effect of caspase-1 (CASP1) combined with multimodal ultrasound features on the prognosis of breast cancer patients. Transl. Cancer Res. 2023, 12, 2138–2154. [Google Scholar] [CrossRef]
- Kolacinska, A.; Fendler, W.; Szemraj, J.; Szymanska, B.; Borowska-Garganisz, E.; Nowik, M.; Chalubinska, J.; Kubiak, R.; Pawlowska, Z.; Blasinska-Morawiec, M.; et al. Gene expression and pathologic response to neoadjuvant chemotherapy in breast cancer. Mol. Biol. Rep. 2012, 39, 7435–7441. [Google Scholar] [CrossRef]
- Zheng, W.; Marini, W.; Murakami, K.; Sotov, V.; Butler, M.; Gorrini, C.; Ohashi, P.S.; Reedijk, M. Caspase-1-dependent spatiality in triple-negative breast cancer and response to immunotherapy. Nat. Commun. 2024, 15, 8514. [Google Scholar] [CrossRef]
- Lakhani, S.R.; Ellis, I.O.; Schnitt, S.; Tan, P.H.; van de Vijver, M. WHO Classification of Tumours of the Breast, 4th ed.; IARC: Lyon, France, 2012. [Google Scholar]
- Chomczynski, P.; Sacchi, N. Single-step method of RNA isolation by acid guanidinum thiocyanate-phenol-chloroform extraction. Anal. Biochem. 1987, 162, 156–159. [Google Scholar] [CrossRef]
- Makuch-Kocka, A.; Kocki, J.; Brzozowska, A.; Bogucki, J.; Kołodziej, P.; Płachno, B.J.; Bogucka-Kocka, A. The BIRC Family Genes Expression in Patients with Triple Negative Breast Cancer. Int. J. Mol. Sci. 2021, 22, 1820. [Google Scholar] [CrossRef] [PubMed]
- Livak, K.J.; Schmittgen, T.D. Analysis of relative gene expression data using real-time quantitative PCR and the 2−ΔΔCT Method. Method 2001, 25, 402–408. [Google Scholar] [CrossRef] [PubMed]
- Kocki, J.; Ułamek-Kozioł, M.; Bogucka-Kocka, A.; Januszewski, S.; Jabłoński, M.; Gil-Kulik, P.; Brzozowska, J.; Petniak, A.; Furmaga-Jabłońska, W.; Bogucki, J.; et al. Dysregulation of Amyloid-β Protein Precursor, β-Secretase, Presenilin 1 and 2 Genes in the Rat Selectively Vulnerable CA1 Subfield of Hippocampus Following Transient Global Brain Ischemia. J. Alzheimers Dis. 2015, 47, 1047–1056. [Google Scholar] [CrossRef] [PubMed]
- Chandrashekar, D.S.; Bashel, B.; Balasubramanya, S.A.H.; Creighton, C.J.; Ponce-Rodriguez, I.; Chakravarthi, B.V.S.K.; Varambally, S. UALCAN: A portal for facilitating tumor subgroup gene expression and survival analyses. Neoplasia 2017, 19, 649–658. [Google Scholar] [CrossRef]
- Jezequel, P.; Campone, M.; Gouraud, W.; Guérin-Charbonnel, C.; Leux, C.; Ricolleau, G.; Campion, L. bc-GenExMiner: An easy-to-use online platform for gene prognostic analyses in breast cancer. Breast Cancer Res. Treat. 2012, 131, 765–775. [Google Scholar] [CrossRef]
- Jézéquel, P.; Gouraud, W.; Ben Azzouz, F.; Guérin-Charbonnel, C.; Juin, P.P.; Lasla, H.; Campone, M. bc-GenExMiner 4.5: New mining module computes breast cancer differential gene expression analyses. Database 2021, 2021, baab007. [Google Scholar] [CrossRef]
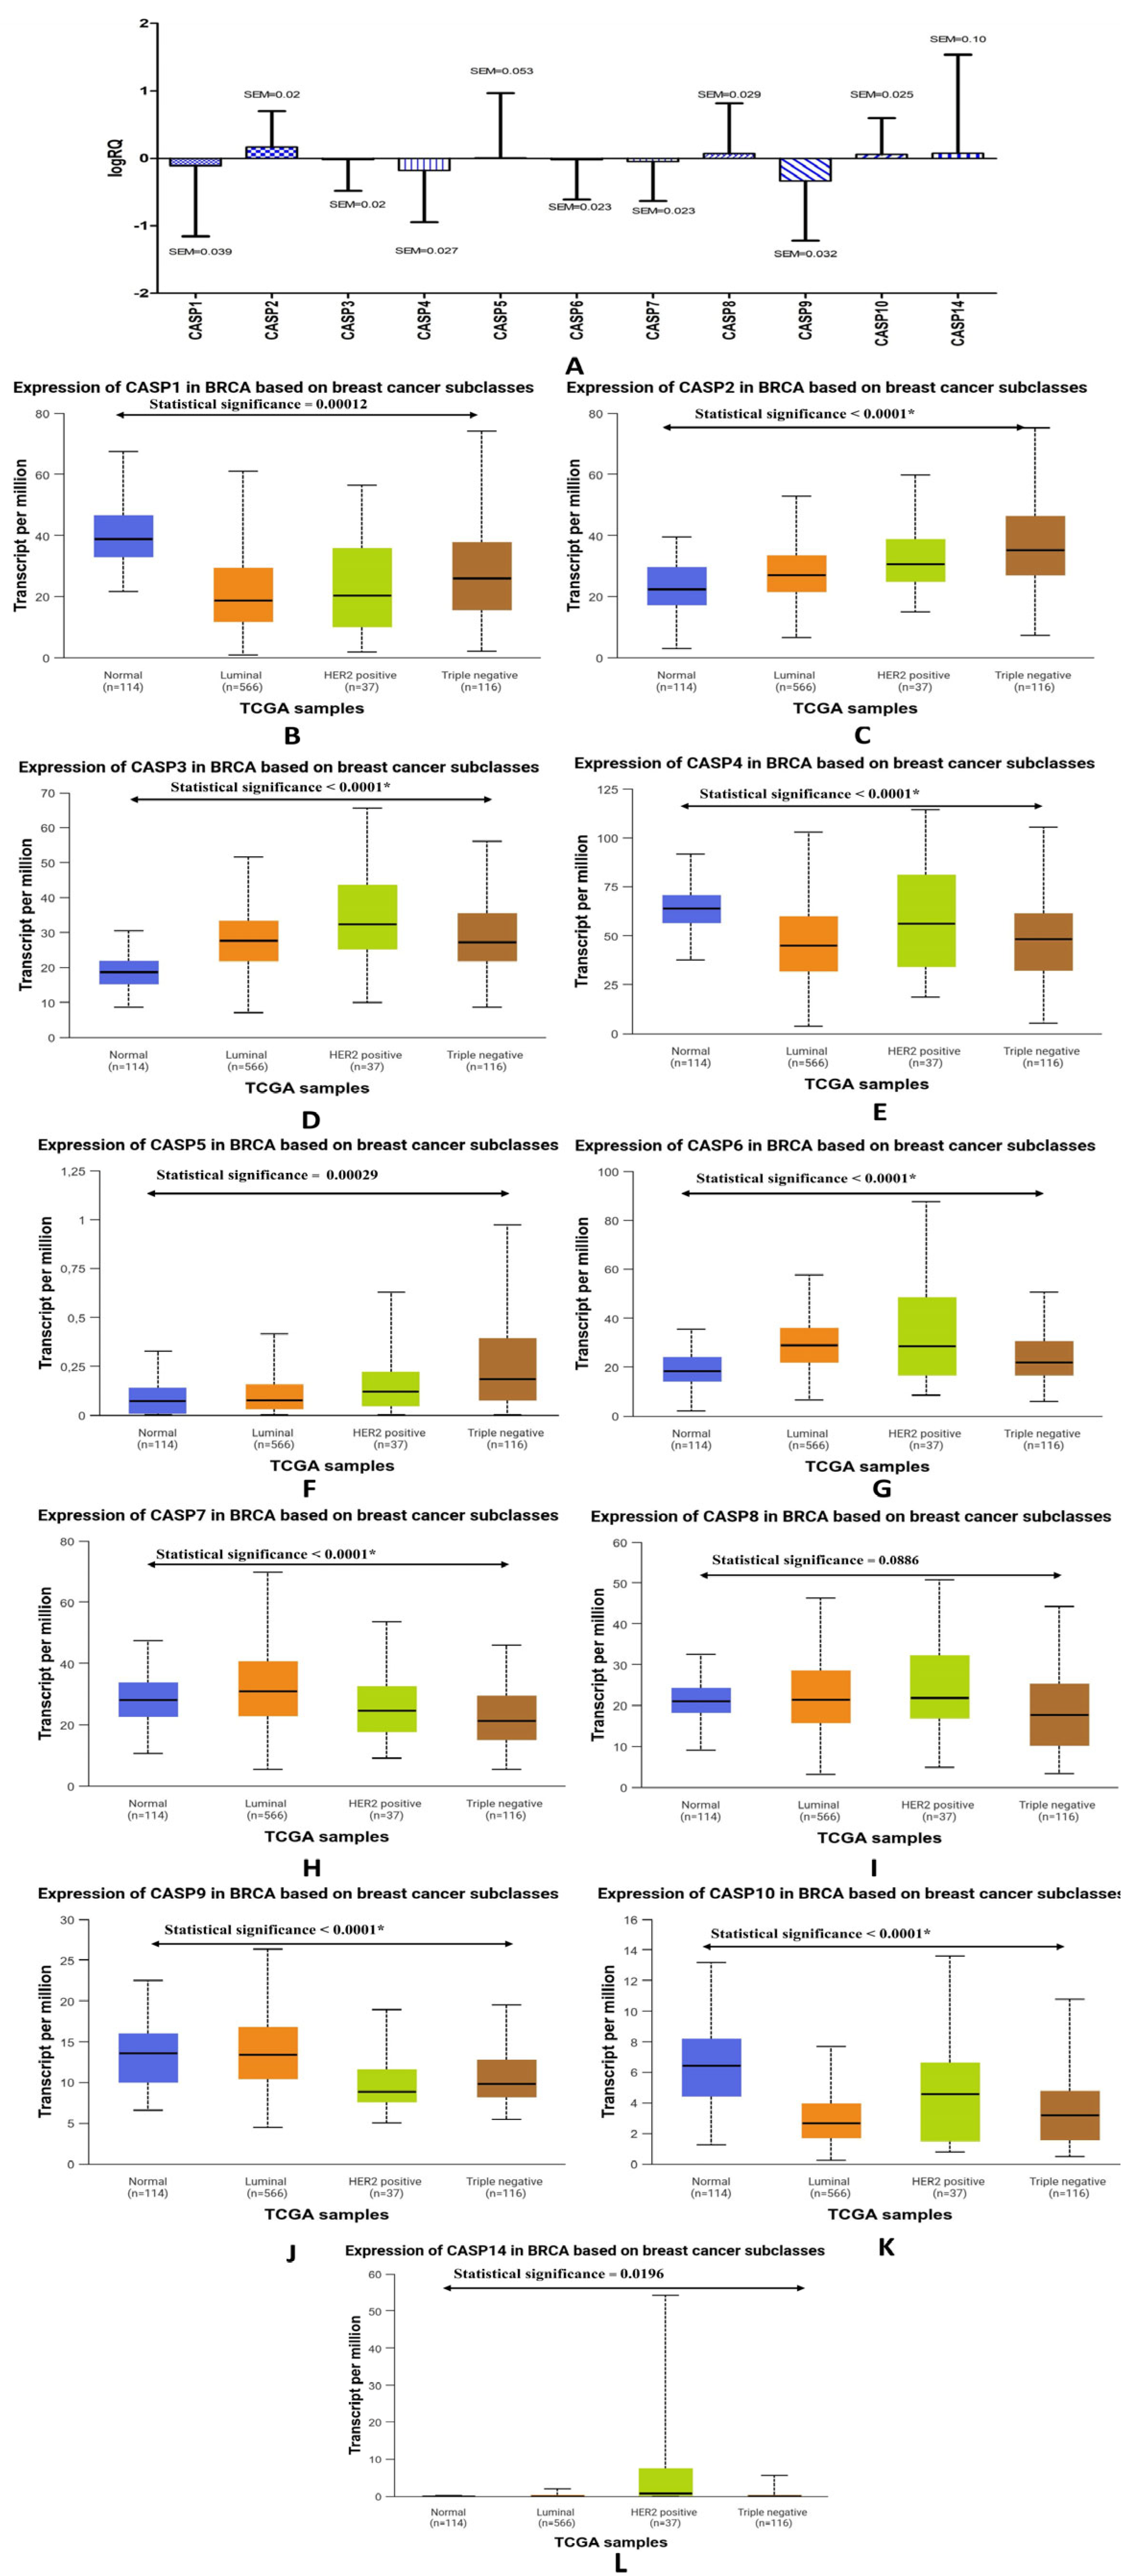
| Genes | The Descriptive Statistics | ||
|---|---|---|---|
| Mean [logRQ] | Median [logRQ] | SD [logRQ] | |
| CASP10 | 0.057785 | 0.032619 | 0.542092 |
| CASP14 | 0.073982 | 0.075004 | 1.464060 |
| CASP1 | −0.108449 | −0.122647 | 1.046686 |
| CASP2 | 0.168929 | 0.147210 | 0.530418 |
| CASP3 | −0.017374 | 0.003029 | 0.464245 |
| CASP4 | −0.178954 | −0.219323 | 0.766781 |
| CASP5 | 0.010069 | 0.035222 | 0.954855 |
| CASP6 | −0.018187 | 0.015360 | 0.589457 |
| CASP7 | −0.048439 | −0.044794 | 0.583761 |
| CASP8 | 0.070524 | 0.055187 | 0.743734 |
| CASP9 | −0.334912 | −0.268816 | 0.884664 |
| Gene | SBR1 | SBR2 | SBR3 | p for Multiple Comparisons | |||
|---|---|---|---|---|---|---|---|
| Mean | SD | Mean | SD | Mean | SD | ||
| CASP1 | 0.627288 | 1.252566 | −0.57593 | 0.797737 | −0.10253 | 1.007902 | SBR1 * SBR2 < 0.001 * SBR1 * SBR3 = 0.000013 * SBR2 * SBR3 = 0.000011 * |
| CASP2 | 0.170370 | 0.479500 | −0.00523 | 0.496358 | 0.208315 | 0.537377 | SBR1 * SBR2 = 0.098684 SBR1 * SBR3 = 1.000000 SBR2 * SBR3 = 0.000636 * |
| CASP3 | 0.255295 | 0.552613 | −0.14869 | 0.296613 | −0.01232 | 0.476031 | SBR1 * SBR2 = 0.000134 * SBR1 * SBR3 = 0.042713 * SBR2 * SBR3 = 0.003578* |
| CASP4 | 0.365875 | 0.931848 | −0.52752 | 0.524590 | −0.17403 | 0.744731 | SBR1 * SBR2 < 0.001 * SBR1 * SBR3 = 0.000014 * SBR2 * SBR3 = 0.000001 * |
| CASP5 | 0.495700 | 0.945985 | −0.23547 | 0.872046 | 0.010710 | 0.956223 | SBR1 * SBR2 = 0.006246 * SBR1 * SBR3 = 0.046082 * SBR2 * SBR3 = 0.373080 |
| CASP6 | −0.11524 | 0.511974 | −0.21179 | 0.524557 | 0.039048 | 0.603032 | SBR1 * SBR2 = 0.898806 SBR1 * SBR3 = 0.178429 SBR2 * SBR3 = 0.000326 * |
| CASP7 | 0.320073 | 0.492996 | −0.45854 | 0.410338 | 0.011265 | 0.579266 | SBR1 * SBR2 < 0.001 * SBR1 * SBR3 = 0.001310 * SBR2 * SBR3 < 0.001 * |
| CASP8 | 0.581905 | 0.880059 | −0.15437 | 0.654879 | 0.051903 | 0.711396 | SBR1 * SBR2 < 0.001 * SBR1 * SBR3 = 0.000017 * SBR2 * SBR3 = 0.029074 * |
| CASP9 | 0.134908 | 1.169259 | −0.60581 | 0.748388 | −0.33741 | 0.842666 | SBR1 * SBR2 = 0.000012 * SBR1 * SBR3 = 0.008075 * SBR2 * SBR3 = 0.006561 * |
| CASP10 | −0.05715 | 0.332730 | −0.21906 | 0.302225 | 0.134646 | 0.578614 | SBR1 * SBR2 = 0.181732 SBR1 * SBR3 = 0.180342 SBR2 * SBR3 < 0.001 * |
| CASP14 | −0.24895 | 1.444192 | −0.28108 | 1.394317 | 0.263434 | 1.469308 | SBR1 * SBR2 = 1.000000 SBR1 * SBR3 = 0.457148 SBR2 * SBR3 = 0.062783 |
| Gene | pN0 | pN1 | pN2 | pN3 | p for Multiple Comparisons | ||||
|---|---|---|---|---|---|---|---|---|---|
| Mean | SD | Mean | SD | Mean | SD | Mean | SD | ||
| CASP1 | 0.1118 | 1.043590 | −0.69059 | 0.780221 | 0.023440 | 1.069785 | −0.38247 | 0.98516 | pN0 * pN1 < 0.001 * pN0 * pN2 = 1.000000 pN0 * pN3 = 0.000826 * pN1 * pN2 < 0.001 * pN1 * pN3 = 0.097954 pN2 * pN3 = 0.031642 * |
| CASP2 | 0.1735 | 0.500488 | −0.08197 | 0.502774 | 0.291364 | 0.493958 | 0.252147 | 0.62238 | pN0 * pN1 = 0.000122 * pN0 * pN2 = 0.137078 pN0 * pN3 = 1.000000 pN1 * pN2 < 0.001 * pN1 * pN3 = 0.000256 * pN2 * pN3 = 1.000000 |
| CASP3 | 0.0151 | 0.478217 | −0.10083 | 0.370662 | −0.055502 | 0.497965 | 0.048096 | 0.45006 | pN0 * pN1 = 0.714210 pN0 * pN2 = 1.000000 pN0 * pN3 = 1.000000 pN1 * pN2 = 0.438126 pN1 * pN3 = 0.183985 pN2 * pN3 = 1.000000 |
| CASP4 | 0.0028 | 0.786656 | −0.65385 | 0.531883 | −0.123283 | 0.777332 | −0.31901 | 0.65038 | pN0 * pN1 < 0.001 * pN0 * pN2 = 0.593256 pN0 * pN3 = 0.003190 * pN1 * pN2 < 0.001 * pN1 * pN3 = 0.000736 * pN2 * pN3 = 0.333208 |
| CASP5 | 0.2668 | 0.861490 | −0.75940 | 0.795295 | 0.258955 | 1.000320 | −0.17339 | 0.82103 | pN0 * pN1 < 0.001 * pN0 * pN2 = 1.000000 pN0 * pN3 = 0.032629 * pN1 * pN2 < 0.001 * pN1 * pN3 = 0.003011 * pN2 * pN3 = 0.245349 |
| CASP6 | −0.0682 | 0.599605 | −0.07289 | 0.511774 | 0.114987 | 0.517253 | −0.00789 | 0.72181 | pN0 * pN1 = 1.000000 pN0 * pN2 = 0.003984 * pN0 * pN3 = 1.000000 pN1 * pN2 = 0.047924 * pN1 * pN3 = 1.000000 pN2 * pN3 = 0.321549 |
| CASP7 | −0.0336 | 0.568902 | −0.36232 | 0.413360 | 0.190619 | 0.558199 | −0.12252 | 0.66397 | pN0 * pN1 = 0.000001 * pN0 * pN2 = 0.000330 * pN0 * pN3 = 1.000000 pN1 * pN2 < 0.001 * pN1 * pN3 = 0.009891 * pN2 * pN3 = 0.000315 * |
| CASP8 | 0.2136 | 0.776767 | −0.31340 | 0.498986 | 0.213449 | 0.708702 | −0.2005 | 0.70443 | pN0 * pN1 < 0.001 * pN0 * pN2 = 1.000000 pN0 * pN3 = 0.000466 * pN1 * pN2 < 0.001 * pN1 * pN3 = 0.500580 pN2 * pN3 = 0.000819 * |
| CASP9 | −0.2274 | 0.902092 | −0.71541 | 0.702409 | −0.068607 | 0.868688 | −0.70153 | 0.78951 | pN0 * pN1 = 0.000001 * pN0 * pN2 = 0.249799 pN0 * pN3 = 0.000073 * pN1 * pN2 < 0.001 * pN1 * pN3 = 1.000000 pN2 * pN3 < 0.001 * |
| CASP10 | 0.1206 | 0.552777 | −0.20566 | 0.330053 | 0.293681 | 0.493669 | −0.21419 | 0.56373 | pN0 * pN1 = 0.000021 * pN0 * pN2 = 0.002295 * pN0 * pN3 = 0.002056 * pN1 * pN2 < 0.001 * pN1 * pN3 = 1.000000 pN2 * pN3 < 0.001 * |
| CASP14 | 0.2582 | 1.340609 | −0.17743 | 1.442055 | 0.651824 | 1.555936 | −0.68073 | 1.42050 | pN0 * pN1 = 0.945887 pN0 * pN2 = 0.824875 pN0 * pN3 = 0.004822 * pN1 * pN2 = 0.113133 pN1 * pN3 = 0.956608 pN2 * pN3 = 0.000522 * |
| Gene | T1 | T2 | T3 | p for Multiple Comparisons | |||
|---|---|---|---|---|---|---|---|
| Mean | SD | Mean | SD | Mean | SD | ||
| CASP1 | −0.2498 | 0.7375 | −0.163883 | 0.935099 | −0.0049 | 1.2235 | pT1 * pT2 = 1.000000 pT1 * pT3 = 1.000000 pT2 * pT3 = 0.662447 |
| CASP2 | −0.105558 | 0.4376 | 0.156733 | 0.538141 | 0.2138 | 0.5183 | pT1 * pT2 = 0.054775 pT1 * pT3 = 0.011970 * pT2 * pT3 = 0.385085 |
| CASP3 | −0.163935 | 0.2853 | −0.008704 | 0.451807 | −0.0183 | 0.4988 | pT1 * pT2 = 0.345270 pT1 * pT3 = 0.202814 pT2 * pT3 = 1.000000 |
| CASP4 | −0.458602 | 0.4964 | −0.194676 | 0.705438 | −0.1278 | 0.8717 | pT1 * pT2 = 0.204427 pT1 * pT3 = 0.226328 pT2 * pT3 = 1.000000 |
| CASP5 | 0.430275 | 0.6449 | −0.005756 | 0.857957 | −0.0148 | 1.1276 | pT1 * pT2 = 0.155125 pT1 * pT3 = 0.078932 pT2 * pT3 = 1.000000 |
| CASP6 | −0.057051 | 0.4842 | −0.047054 | 0.629186 | 0.0326 | 0.5262 | pT1 * pT2 = 1.000000 pT1 * pT3 = 1.000000 pT2 * pT3 = 0.128775 |
| CASP7 | −0.351795 | 0.4073 | −0.058370 | 0.551302 | −0.0002 | 0.6445 | pT1 * pT2 = 0.047008 * pT1 * pT3 = 0.017040 * pT2 * pT3 = 0.867840 |
| CASP8 | 0.420419 | 0.4699 | −0.016343 | 0.648543 | 0.1809 | 0.8764 | pT1 * pT2 = 0.001782 * pT1 * pT3 = 0.067416 pT2 * pT3 = 0.008345 * |
| CASP9 | −0.414304 | 0.7011 | −0.430672 | 0.791872 | −0.171 | 1.0130 | pT1 * pT2 = 1.000000 pT1 * pT3 = 1.000000 pT2 * pT3 = 0.004854 * |
| CASP10 | −0.001267 | 0.2651 | 0.062373 | 0.542842 | 0.0559 | 0.5628 | pT1 * pT2 = 1.000000 pT1 * pT3 = 1.000000 pT2 * pT3 = 1.000000 |
| CASP14 | 0.076860 | 1.3229 | 0.214341 | 1.386394 | −0.1525 | 1.5893 | pT1 * pT2 = 1.000000 pT1 * pT3 = 1.000000 pT2 * pT3 = 0.308856 * |
| Characteristics | Patients with TNBC (n = 29) |
|---|---|
| Age ≤50 >50 | 8 (≈27.59%) 21 (≈72.41%) |
| Gender: Female Male | 29 (100%) 0 (0%) |
| Lymphovascular invasion Yes No | 7 (≈24.14%) 22 (≈75.86%) |
| Invasion of the fat tissue Yes No | 3 (≈10.34%) 26 (≈89.66%) |
| Tumor size T1 T2 T3 | 3 (≈10.34%) 18 (≈62.07%) 8 (≈27.59%) |
| Lymph nodes N0 N1 N2 N3 | 16 (≈55.17%) 6 (≈20.69%) 5 (≈17.24%) 2 (≈6.9%) |
| SBR grade SBR I SBR II SBR III | 3 (≈10.34%) 5 (≈17.24%) 21 (≈72.41%) |
Disclaimer/Publisher’s Note: The statements, opinions and data contained in all publications are solely those of the individual author(s) and contributor(s) and not of MDPI and/or the editor(s). MDPI and/or the editor(s) disclaim responsibility for any injury to people or property resulting from any ideas, methods, instructions or products referred to in the content. |
© 2025 by the authors. Licensee MDPI, Basel, Switzerland. This article is an open access article distributed under the terms and conditions of the Creative Commons Attribution (CC BY) license (https://creativecommons.org/licenses/by/4.0/).
Share and Cite
Makuch-Kocka, A.; Kocki, J.; Bogucki, J.; Kołodziej, P.; Lejman, M.; Szalast, K.; Bogucka-Kocka, A. Profiling the Expression Level of a Gene from the Caspase Family in Triple-Negative Breast Cancer. Int. J. Mol. Sci. 2025, 26, 7463. https://doi.org/10.3390/ijms26157463
Makuch-Kocka A, Kocki J, Bogucki J, Kołodziej P, Lejman M, Szalast K, Bogucka-Kocka A. Profiling the Expression Level of a Gene from the Caspase Family in Triple-Negative Breast Cancer. International Journal of Molecular Sciences. 2025; 26(15):7463. https://doi.org/10.3390/ijms26157463
Chicago/Turabian StyleMakuch-Kocka, Anna, Janusz Kocki, Jacek Bogucki, Przemysław Kołodziej, Monika Lejman, Karolina Szalast, and Anna Bogucka-Kocka. 2025. "Profiling the Expression Level of a Gene from the Caspase Family in Triple-Negative Breast Cancer" International Journal of Molecular Sciences 26, no. 15: 7463. https://doi.org/10.3390/ijms26157463
APA StyleMakuch-Kocka, A., Kocki, J., Bogucki, J., Kołodziej, P., Lejman, M., Szalast, K., & Bogucka-Kocka, A. (2025). Profiling the Expression Level of a Gene from the Caspase Family in Triple-Negative Breast Cancer. International Journal of Molecular Sciences, 26(15), 7463. https://doi.org/10.3390/ijms26157463


