
Impaired Mitochondrial DNA Copy Number in Visceral Adipose Tissue of Insulin-Resistant Individuals: Implications for Metabolic Dysregulation

Abstract
1. Introduction
2. Results
2.1. Characteristic of Study Cohort
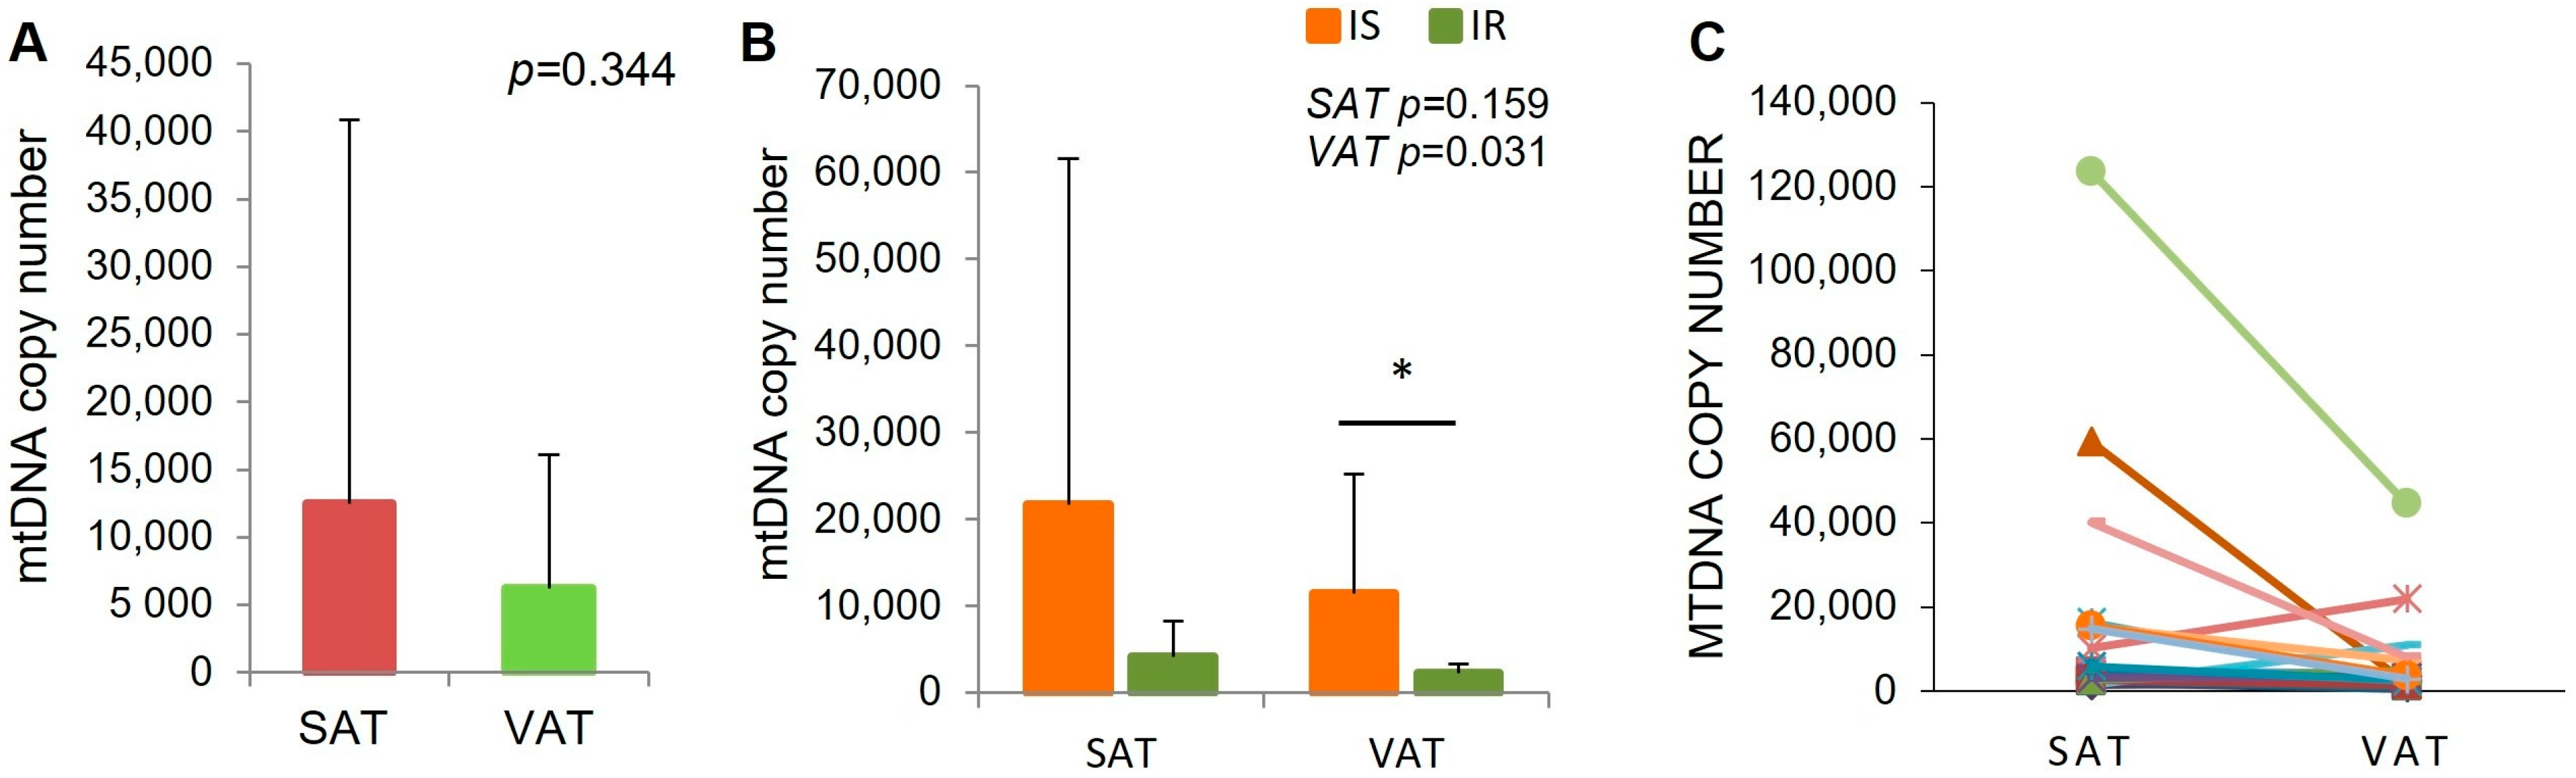
2.2. MtDNA Content in Adipose Tissue Biopsies in IR and Is Subjects
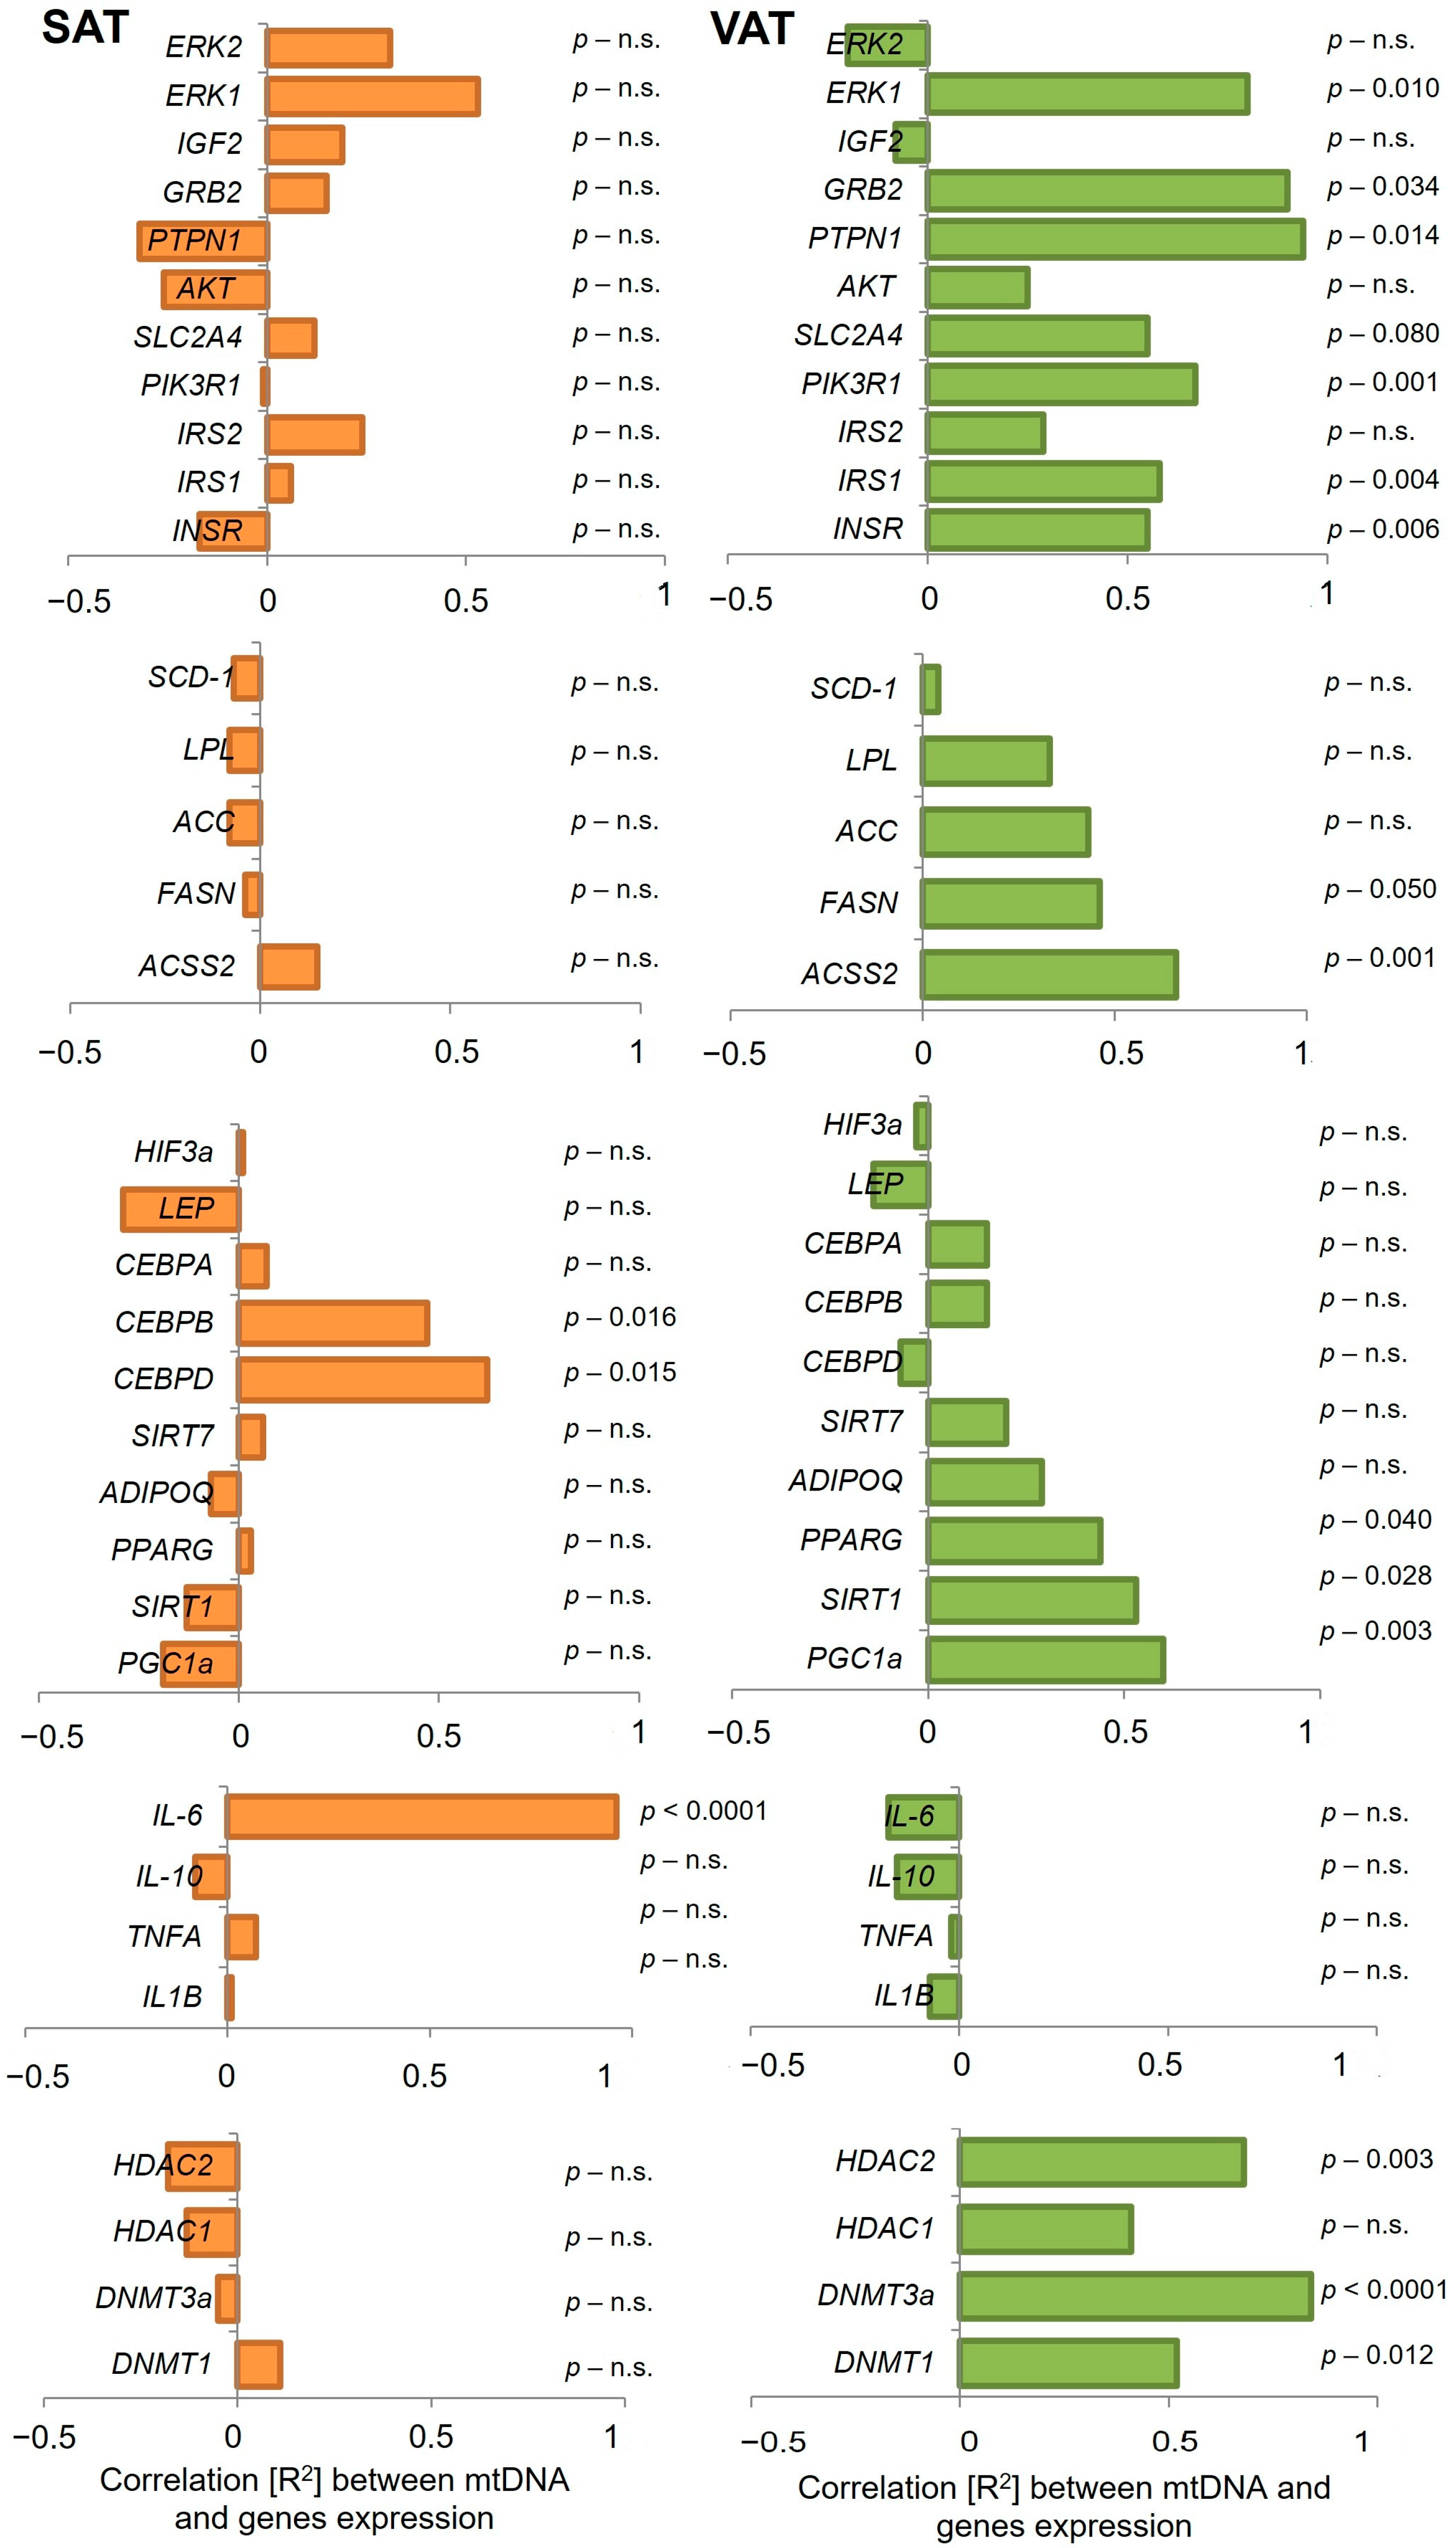
2.3. Analysis of Gene Expression and Correlation with mtDNA Content in SAT and VAT
3. Discussion
4. Materials and Methods
4.1. Study Cohort Inclusion Criteria and Adipose Tissues Collection
- (1)
- HOMA-IR = [(glucose [mmol/l] × insulin [μU/mL])/22.5]
- (2)
- QUICKI = [1/(log glucose [mg/dl] + log insulin [μU/mL])]
4.2. Genetic Material Extraction
4.3. Insulin Level Determination
4.4. Gene Expression
4.5. MtDNA Copy Number Determination
- (1)
- ∆∆Cq = ∆Cq (mtDNA) − ∆Cq (SCR),
- (2)
- mtDNA copy number = (724 ± 16) × 2 − ∆∆Cq,
4.6. Statistical Analysis
5. Conclusions
Author Contributions
Funding
Institutional Review Board Statement
Informed Consent Statement
Data Availability Statement
Conflicts of Interest
Abbreviations
| IR | insulin-resistant |
| IS | insulin-sensitive |
| mtDNA | mitochondrial DNA |
| ROS | reactive oxygen species |
| SAT | subcutaneous adipose tissue |
| VAT | visceral adipose tissue |
References
- Lee, S.-H.; Park, S.-Y.; Choi, C.S. Insulin Resistance: From Mechanisms to Therapeutic Strategies. Diabetes Metab. J. 2021, 46, 15–37. [Google Scholar] [CrossRef]
- Kim, J.; Wei, Y.; Sowers, J.R. Role of Mitochondrial Dysfunction in Insulin Resistance. Circ. Res. 2008, 102, 401–414. [Google Scholar] [CrossRef]
- Brand, M.D.; Orr, A.L.; Perevoshchikova, I.V.; Quinlan, C.L. The Role of Mitochondrial Function and Cellular Bioenergetics in Ageing and Disease. Br. J. Dermatol. 2013, 169, 1–8. [Google Scholar] [CrossRef]
- Asmann, Y.W.; Stump, C.S.; Short, K.R.; Coenen-Schimke, J.M.; Guo, Z.; Bigelow, M.L.; Nair, K.S. Skeletal Muscle Mitochondrial Functions, Mitochondrial DNA Copy Numbers, and Gene Transcript Profiles in Type 2 Diabetic and Nondiabetic Subjects at Equal Levels of Low or High Insulin and Euglycemia. Diabetes 2006, 55, 3309–3319. [Google Scholar] [CrossRef] [PubMed]
- Petersen, M.C.; Shulman, G.I. Mechanisms of Insulin Action and Insulin Resistance. Physiol. Rev. 2018, 98, 2133–2223. [Google Scholar] [CrossRef] [PubMed]
- Stump, C.S.; Short, K.R.; Bigelow, M.L.; Schimke, J.M.; Nair, K.S. Effect of Insulin on Human Skeletal Muscle Mitochondrial ATP Production, Protein Synthesis, and mRNA Transcripts. Proc. Natl. Acad. Sci. USA 2003, 100, 7996–8001. [Google Scholar] [CrossRef] [PubMed]
- Bordoni, L.; Perugini, J.; Petracci, I.; Mercurio, E.D.; Lezoche, G.; Guerrieri, M.; Giordano, A.; Gabbianelli, R. Mitochondrial DNA in Visceral Adipose Tissue in Severe Obesity: From Copy Number to D-Loop Methylation. Front. Biosci. Landmark 2022, 27, 172. [Google Scholar] [CrossRef]
- DeBarmore, B.; Longchamps, R.J.; Zhang, Y.; Kalyani, R.R.; Guallar, E.; Arking, D.E.; Selvin, E.; Young, J.H. Mitochondrial DNA Copy Number and Diabetes: The Atherosclerosis Risk in Communities (ARIC) Study. BMJ Open Diabetes Res. Care 2020, 8, e001204. [Google Scholar] [CrossRef]
- Todosenko, N.; Khaziakhmatova, O.; Malashchenko, V.; Yurova, K.; Bograya, M.; Beletskaya, M.; Vulf, M.; Gazatova, N.; Litvinova, L. Mitochondrial Dysfunction Associated with mtDNA in Metabolic Syndrome and Obesity. Int. J. Mol. Sci. 2023, 24, 12012. [Google Scholar] [CrossRef]
- Szendroedi, J.; Phielix, E.; Roden, M. The Role of Mitochondria in Insulin Resistance and Type 2 Diabetes Mellitus. Nat. Rev. Endocrinol. 2011, 8, 92–103. [Google Scholar] [CrossRef]
- Sangwung, P.; Petersen, K.F.; Shulman, G.I.; Knowles, J.W. Mitochondrial Dysfunction, Insulin Resistance, and Potential Genetic Implications. Endocrinology 2020, 161, bqaa017. [Google Scholar] [CrossRef]
- Pagel-Langenickel, I.; Bao, J.; Pang, L.; Sack, M.N. The Role of Mitochondria in the Pathophysiology of Skeletal Muscle Insulin Resistance. Endocr. Rev. 2010, 31, 25–51. [Google Scholar] [CrossRef]
- Sultana, M.A.; Hia, R.A.; Akinsiku, O.; Hegde, V. Peripheral Mitochondrial Dysfunction: A Potential Contributor to the Development of Metabolic Disorders and Alzheimer’s Disease. Biology 2023, 12, 1019. [Google Scholar] [CrossRef] [PubMed]
- Bhatti, J.S.; Bhatti, G.K.; Reddy, P.H. Mitochondrial Dysfunction and Oxidative Stress in Metabolic Disorders—A Step towards Mitochondria Based Therapeutic Strategies. Biochim. Biophys. Acta 2017, 1863, 1066–1077. [Google Scholar] [CrossRef]
- Song, J.; Oh, J.Y.; Sung, Y.-A.; Pak, Y.K.; Park, K.S.; Lee, H.K. Peripheral Blood Mitochondrial DNA Content Is Related to Insulin Sensitivity in Offspring of Type 2 Diabetic Patients. Diabetes Care 2001, 24, 865–869. [Google Scholar] [CrossRef]
- Mootha, V.K.; Lindgren, C.M.; Eriksson, K.-F.; Subramanian, A.; Sihag, S.; Lehar, J.; Puigserver, P.; Carlsson, E.; Ridderstråle, M.; Laurila, E.; et al. PGC-1α-Responsive Genes Involved in Oxidative Phosphorylation Are Coordinately Downregulated in Human Diabetes. Nat. Genet. 2003, 34, 267–273. [Google Scholar] [CrossRef]
- Petersen, K.F.; Dufour, S.; Befroy, D.; Garcia, R.; Shulman, G.I. Impaired Mitochondrial Activity in the Insulin-Resistant Offspring of Patients with Type 2 Diabetes. N. Engl. J. Med. 2004, 350, 664–671. [Google Scholar] [CrossRef] [PubMed]
- Boudina, S.; Graham, T.E. Mitochondrial Function/Dysfunction in White Adipose Tissue. Exp. Physiol. 2014, 99, 1168–1178. [Google Scholar] [CrossRef] [PubMed]
- Lee, J.H.; Park, A.; Oh, K.-J.; Lee, S.C.; Kim, W.K.; Bae, K.-H. The Role of Adipose Tissue Mitochondria: Regulation of Mitochondrial Function for the Treatment of Metabolic Diseases. Int. J. Mol. Sci. 2019, 20, 4924. [Google Scholar] [CrossRef]
- Kusminski, C.M.; Scherer, P.E. Mitochondrial Dysfunction in White Adipose Tissue. Trends Endocrinol. Metab. TEM 2012, 23, 435–443. [Google Scholar] [CrossRef]
- Montgomery, M.K.; Turner, N. Mitochondrial Dysfunction and Insulin Resistance: An Update. Endocr. Connect. 2014, 4, R1–R15. [Google Scholar] [CrossRef]
- He, F.; Huang, Y.; Song, Z.; Zhou, H.J.; Zhang, H.; Perry, R.J.; Shulman, G.I.; Min, W. Mitophagy-Mediated Adipose Inflammation Contributes to Type 2 Diabetes with Hepatic Insulin Resistance. J. Exp. Med. 2021, 218, e20201416. [Google Scholar] [CrossRef]
- Vernochet, C.; Damilano, F.; Mourier, A.; Bezy, O.; Mori, M.A.; Smyth, G.; Rosenzweig, A.; Larsson, N.-G.; Kahn, C.R. Adipose Tissue Mitochondrial Dysfunction Triggers a Lipodystrophic Syndrome with Insulin Resistance, Hepatosteatosis, and Cardiovascular Complications. FASEB J. 2014, 28, 4408–4419. [Google Scholar] [CrossRef]
- Ibrahim, M.M. Subcutaneous and Visceral Adipose Tissue: Structural and Functional Differences. Obes. Rev. 2010, 11, 11–18. [Google Scholar] [CrossRef] [PubMed]
- Wajchenberg, B.L. Subcutaneous and Visceral Adipose Tissue: Their Relation to the Metabolic Syndrome. Endocr. Rev. 2000, 21, 697–738. [Google Scholar] [CrossRef] [PubMed]
- Shulman, G.I. Ectopic Fat in Insulin Resistance, Dyslipidemia, and Cardiometabolic Disease. N. Engl. J. Med. 2014, 371, 1131–1141. [Google Scholar] [CrossRef] [PubMed]
- Kraunsøe, R.; Boushel, R.; Hansen, C.N.; Schjerling, P.; Qvortrup, K.; Støckel, M.; Mikines, K.J.; Dela, F. Mitochondrial Respiration in Subcutaneous and Visceral Adipose Tissue from Patients with Morbid Obesity. J. Physiol. 2010, 588, 2023–2032. [Google Scholar] [CrossRef] [PubMed]
- Takano, C.; Ogawa, E.; Hayakawa, S. Insulin Resistance in Mitochondrial Diabetes. Biomolecules 2023, 13, 126. [Google Scholar] [CrossRef] [PubMed]
- Palikaras, K.; Lionaki, E.; Tavernarakis, N. Mechanisms of mitophagy in cellular homeostasis, physiology and pathology. Nat. Cell Biol. 2018, 20, 1013–1022. [Google Scholar] [CrossRef]
- Kurihara, Y.; Kanki, T.; Aoki, Y.; Hirota, Y.; Saigusa, T.; Uchiumi, T.; Kang, D. Mitophagy Plays an Essential Role in Reducing Mitochondrial Production of Reactive Oxygen Species and Mutation of Mitochondrial DNA by Maintaining Mitochondrial Quantity and Quality in Yeast. J. Biol. Chem. 2012, 287, 3265–3272. [Google Scholar] [CrossRef]
- Amaral, A.; Ramalho-Santos, J.; John, J.C.S. The expression of polymerase gamma and mitochondrial transcription factor A and the regulation of mitochondrial DNA content in mature human sperm. Hum. Reprod. 2007, 22, 1585–1596. [Google Scholar] [CrossRef] [PubMed]
- Gorman, G.S.; Chinnery, P.F.; DiMauro, S.; Hirano, M.; Koga, Y.; McFarland, R.; Suomalainen, A.; Thorburn, D.R.; Zeviani, M.; Turnbull, D.M. Mitochondrial diseases. Nat. Rev. Dis. Prim. 2016, 2, 16080. [Google Scholar] [CrossRef] [PubMed]
- Ekstrand, M.I.; Falkenberg, M.; Rantanen, A.; Park, C.B.; Gaspari, M.; Hultenby, K.; Rustin, P.; Gustafsson, C.M.; Larsson, N.-G. Mitochondrial transcription factor A regulates mtDNA copy number in mammals. Hum. Mol. Genet. 2004, 13, 935–944. [Google Scholar] [CrossRef] [PubMed]
- Stiles, A.R.; Simon, M.T.; Stover, A.; Eftekharian, S.; Khanlou, N.; Wang, H.L.; Magaki, S.; Lee, H.; Partynski, K.; Dorrani, N.; et al. Mutations in TFAM, encoding mitochondrial transcription factor A, cause neonatal liver failure associated with mtDNA depletion. Mol. Genet. Metab. 2016, 119, 91–99. [Google Scholar] [CrossRef]
- Stewart, J.D.; Schoeler, S.; Sitarz, K.S.; Horvath, R.; Hallmann, K.; Pyle, A.; Yu-Wai-Man, P.; Taylor, R.W.; Samuels, D.C.; Kunz, W.S.; et al. POLG mutations cause decreased mitochondrial DNA repopulation rates following induced depletion in human fibroblasts. Biochim. et Biophys. Acta (BBA). Mol. Basis Dis. 2011, 1812, 321–325. [Google Scholar] [CrossRef]
- Lee, H. Somatic mutations in the D-loop and decrease in the copy number of mitochondrial DNA in human hepatocellular carcinoma. Mutat. Res. Mol. Mech. Mutagen. 2004, 547, 71–78. [Google Scholar] [CrossRef]
- Kong, M.; Guo, L.; Xu, W.; He, C.; Jia, X.; Zhao, Z.; Gu, Z. Aging-associated accumulation of mitochondrial DNA mutations in tumor origin. Life Med. 2022, 1, 149–167. [Google Scholar] [CrossRef]
- Liao, S.; Chen, L.; Song, Z.; He, H. The Fate of Damaged Mitochondrial DNA in the Cell. Biochim. Biophys. Acta BBA Mol. Cell Res. 2022, 1869, 119233. [Google Scholar] [CrossRef]
- Abd Radzak, S.M.; Mohd Khair, S.Z.N.; Ahmad, F.; Patar, A.; Idris, Z.; Mohamed Yusoff, A.A. Insights Regarding Mitochondrial DNA Copy Number Alterations in Human Cancer (Review). Int. J. Mol. Med. 2022, 50, 104. [Google Scholar] [CrossRef]
- Lee, J.-Y.; Lee, D.-C.; Im, J.-A.; Lee, J.-W. Mitochondrial DNA Copy Number in Peripheral Blood Is Independently Associated with Visceral Fat Accumulation in Healthy Young Adults. Int. J. Endocrinol. 2014, 2014, 586017. [Google Scholar] [CrossRef]
- Sergi, D.; Naumovski, N.; Heilbronn, L.K.; Abeywardena, M.; O’Callaghan, N.; Lionetti, L.; Luscombe-Marsh, N. Mitochondrial (Dys)Function and Insulin Resistance: From Pathophysiological Molecular Mechanisms to the Impact of Diet. Front. Physiol. 2019, 10, 532. [Google Scholar] [CrossRef] [PubMed]
- Zorzano, A.; Liesa, M.; Palacín, M. Mitochondrial Dynamics as a Bridge between Mitochondrial Dysfunction and Insulin Resistance. Arch. Physiol. Biochem. 2009, 115, 1–12. [Google Scholar] [CrossRef] [PubMed]
- Scarpulla, R.C.; Vega, R.B.; Kelly, D.P. Transcriptional Integration of Mitochondrial Biogenesis. Trends Endocrinol. Metab. TEM 2012, 23, 459–466. [Google Scholar] [CrossRef] [PubMed]
- Boucher, J.; Kleinridders, A.; Kahn, C.R. Insulin Receptor Signaling in Normal and Insulin-Resistant States. Cold Spring Harb. Perspect. Biol. 2014, 6, a009191. [Google Scholar] [CrossRef]
- Zhou, Q.; Yu, J.; Yuan, X.; Wang, C.; Zhu, Z.; Zhang, A.; Gu, W. Clinical and Functional Characterization of Novel INSR Variants in Two Families With Severe Insulin Resistance Syndrome. Front. Endocrinol. 2021, 12, 606964. [Google Scholar] [CrossRef]
- Gao, Z.; Hwang, D.; Bataille, F.; Lefevre, M.; York, D.; Quon, M.J.; Ye, J. Serine Phosphorylation of Insulin Receptor Substrate 1 by Inhibitor Kappa B Kinase Complex. J. Biol. Chem. 2002, 277, 48115–48121. [Google Scholar] [CrossRef]
- Guilherme, A.; Virbasius, J.V.; Puri, V.; Czech, M.P. Adipocyte Dysfunctions Linking Obesity to Insulin Resistance and Type 2 Diabetes. Nat. Rev. Mol. Cell Biol. 2008, 9, 367–377. [Google Scholar] [CrossRef]
- Morigny, P.; Houssier, M.; Mouisel, E.; Langin, D. Adipocyte Lipolysis and Insulin Resistance. Biochimie 2016, 125, 259–266. [Google Scholar] [CrossRef]
- Christen, T.; Sheikine, Y.; Rocha, V.Z.; Hurwitz, S.; Goldfine, A.B.; Di Carli, M.; Libby, P. Increased Glucose Uptake in Visceral Versus Subcutaneous Adipose Tissue Revealed by PET Imaging. JACC Cardiovasc. Imaging 2010, 3, 843–851. [Google Scholar] [CrossRef]
- Kojta, I.; Chacińska, M.; Błachnio-Zabielska, A. Obesity, Bioactive Lipids, and Adipose Tissue Inflammation in Insulin Resistance. Nutrients 2020, 12, 1305. [Google Scholar] [CrossRef]
- Jin, X.; Qiu, T.; Li, L.; Yu, R.; Chen, X.; Li, C.; Proud, C.G.; Jiang, T. Pathophysiology of Obesity and Its Associated Diseases. Acta Pharm. Sin. B 2023, 13, 2403–2424. [Google Scholar] [CrossRef]
- Wróblewski, A.; Strycharz, J.; Oszajca, K.; Czarny, P.; Świderska, E.; Matyjas, T.; Zieleniak, A.; Rucińska, M.; Pomorski, L.; Drzewoski, J.; et al. Dysregulation of Inflammation, Oxidative Stress, and Glucose Metabolism-Related Genes and miRNAs in Visceral Adipose Tissue of Women with Type 2 Diabetes Mellitus. Med. Sci. Monit. Int. Med. J. Exp. Clin. Res. 2023, 29, e939299. [Google Scholar] [CrossRef]
- Rutanen, J.; Yaluri, N.; Modi, S.; Pihlajamäki, J.; Vänttinen, M.; Itkonen, P.; Kainulainen, S.; Yamamoto, H.; Lagouge, M.; Sinclair, D.A.; et al. SIRT1 mRNA Expression May Be Associated With Energy Expenditure and Insulin Sensitivity. Diabetes 2010, 59, 829–835. [Google Scholar] [CrossRef] [PubMed]
- Walczak, R.; Tontonoz, P. PPARadigms and PPARadoxes: Expanding Roles for PPARγ in the Control of Lipid Metabolism. J. Lipid Res. 2002, 43, 177–186. [Google Scholar] [CrossRef] [PubMed]
- Rosen, E.D.; Hsu, C.-H.; Wang, X.; Sakai, S.; Freeman, M.W.; Gonzalez, F.J.; Spiegelman, B.M. C/EBPα Induces Adipogenesis through PPARγ: A Unified Pathway. Genes Dev. 2002, 16, 22–26. [Google Scholar] [CrossRef] [PubMed]
- Ziegler, A.K.; Scheele, C. Human Adipose Depots’ Diverse Functions and Dysregulations during Cardiometabolic Disease. Npj Metab. Health Dis. 2024, 2, 34. [Google Scholar] [CrossRef]
- Dhokte, S.; Czaja, K. Visceral Adipose Tissue: The Hidden Culprit for Type 2 Diabetes. Nutrients 2024, 16, 1015. [Google Scholar] [CrossRef]
- Gabriely, I.; Ma, X.H.; Yang, X.M.; Atzmon, G.; Rajala, M.W.; Berg, A.H.; Scherer, P.; Rossetti, L.; Barzilai, N. Removal of Visceral Fat Prevents Insulin Resistance and Glucose Intolerance of Aging: An Adipokine-Mediated Process? Diabetes 2002, 51, 2951–2958. [Google Scholar] [CrossRef]
- Boone, C.; Lewis, S.C. Bridging Lipid Metabolism and Mitochondrial Genome Maintenance. J. Biol. Chem. 2024, 300, 107498. [Google Scholar] [CrossRef]
- Villarroya, J.; Giralt, M.; Villarroya, F. Mitochondrial DNA: An Up-and-Coming Actor in White Adipose Tissue Pathophysiology. Obesity 2009, 17, 1814–1820. [Google Scholar] [CrossRef]
- Kaaman, M.; Sparks, L.M.; van Harmelen, V.; Smith, S.R.; Sjölin, E.; Dahlman, I.; Arner, P. Strong Association between Mitochondrial DNA Copy Number and Lipogenesis in Human White Adipose Tissue. Diabetologia 2007, 50, 2526–2533. [Google Scholar] [CrossRef]
- Scarpulla, R.C. Nuclear Control of Respiratory Gene Expression in Mammalian Cells. J. Cell. Biochem. 2006, 97, 673–683. [Google Scholar] [CrossRef] [PubMed]
- Cecil, J.E.; Watt, P.; Palmer, C.N.; Hetherington, M. Energy Balance and Food Intake: The Role of PPARgamma Gene Polymorphisms. Physiol. Behav. 2006, 88, 227–233. [Google Scholar] [CrossRef] [PubMed]
- Li, X. SIRT1 and Energy Metabolism. Acta Biochim. Biophys. Sin. 2013, 45, 51–60. [Google Scholar] [CrossRef]
- Liang, H.; Ward, W.F. PGC-1α: A Key Regulator of Energy Metabolism. Adv. Physiol. Educ. 2006, 30, 145–151. [Google Scholar] [CrossRef]
- Cedikova, M.; Kripnerová, M.; Dvorakova, J.; Pitule, P.; Grundmanova, M.; Babuska, V.; Mullerova, D.; Kuncova, J. Mitochondria in White, Brown, and Beige Adipocytes. Stem Cells Int. 2016, 2016, 6067349. [Google Scholar] [CrossRef]
- Van Nguyen, T.-T.; Van Vu, V.; Van Pham, P. Brown Adipocyte and Browning Thermogenesis: Metabolic Crosstalk beyond Mitochondrial Limits and Physiological Impacts. Adipocyte 2023, 12, 2237164. [Google Scholar] [CrossRef]
- Deng, T.; Sieglaff, D.H.; Zhang, A.; Lyon, C.J.; Ayers, S.D.; Cvoro, A.; Gupte, A.A.; Xia, X.; Baxter, J.D.; Webb, P.; et al. A Peroxisome Proliferator-Activated Receptor γ (PPARγ)/PPARγ Coactivator 1β Autoregulatory Loop in Adipocyte Mitochondrial Function. J. Biol. Chem. 2011, 286, 30723–30731. [Google Scholar] [CrossRef]
- Lefterova, M.I.; Lazar, M.A. New Developments in Adipogenesis. Trends Endocrinol. Metab. 2009, 20, 107–114. [Google Scholar] [CrossRef]
- Guerrier, L.; Malpuech-Brugère, C.; Richard, R.; Touron, J. Mitochondrial Function in Healthy Human White Adipose Tissue: A Narrative Review. Nutrients 2023, 15, 4430. [Google Scholar] [CrossRef]
- Petersen, K.F.; Shulman, G.I. Etiology of Insulin Resistance. Am. J. Med. 2006, 119, S10–S16. [Google Scholar] [CrossRef]
- Rosen, E.D.; MacDougald, O.A. Adipocyte Differentiation from the inside Out. Nat. Rev. Mol. Cell Biol. 2006, 7, 885–896. [Google Scholar] [CrossRef]
- Kwon, D.-H.; Ryu, J.; Kim, Y.-K.; Kook, H. Roles of Histone Acetylation Modifiers and Other Epigenetic Regulators in Vascular Calcification. Int. J. Mol. Sci. 2020, 21, 3246. [Google Scholar] [CrossRef]
- Maresca, A.; Zaffagnini, M.; Caporali, L.; Carelli, V.; Zanna, C. DNA Methyltransferase 1 Mutations and Mitochondrial Pathology: Is mtDNA Methylated? Front. Genet. 2015, 6, 90. [Google Scholar] [CrossRef] [PubMed]
- Wallace, D.C.; Fan, W. Energetics, Epigenetics, Mitochondrial Genetics. Mitochondrion 2010, 10, 12–31. [Google Scholar] [CrossRef] [PubMed]
- Devall, M.; Roubroeks, J.; Mill, J.; Weedon, M.; Lunnon, K. Epigenetic Regulation of Mitochondrial Function in Neurodegenerative Disease: New Insights from Advances in Genomic Technologies. Neurosci. Lett. 2016, 625, 47–55. [Google Scholar] [CrossRef] [PubMed]
- Wellen, K.E.; Hotamisligil, G.S. Inflammation, Stress, and Diabetes. J. Clin. Investig. 2005, 115, 1111–1119. [Google Scholar] [CrossRef]
- Makki, K.; Froguel, P.; Wolowczuk, I. Adipose Tissue in Obesity-Related Inflammation and Insulin Resistance: Cells, Cytokines, and Chemokines. Int. Sch. Res. Not. 2013, 2013, 139239. [Google Scholar] [CrossRef]
- Chatterjee, D.; Das, P.; Chakrabarti, O. Mitochondrial Epigenetics Regulating Inflammation in Cancer and Aging. Front. Cell Dev. Biol. 2022, 10, 929708. [Google Scholar] [CrossRef]
- Gao, W.; Liu, J.-L.; Lu, X.; Yang, Q. Epigenetic Regulation of Energy Metabolism in Obesity. J. Mol. Cell Biol. 2021, 13, 480–499. [Google Scholar] [CrossRef]
- Zheng, L.D.; Linarelli, L.E.; Liu, L.; Wall, S.S.; Greenawald, M.H.; Seidel, R.W.; Estabrooks, P.A.; Almeida, F.A.; Cheng, Z. Insulin Resistance Is Associated with Epigenetic and Genetic Regulation of Mitochondrial DNA in Obese Humans. Clin. Epigenetics 2015, 7, 60. [Google Scholar] [CrossRef]
- Kim, A.Y.; Park, Y.J.; Pan, X.; Shin, K.C.; Kwak, S.-H.; Bassas, A.F.; Sallam, R.M.; Park, K.S.; Alfadda, A.A.; Xu, A.; et al. Obesity-Induced DNA Hypermethylation of the Adiponectin Gene Mediates Insulin Resistance. Nat. Commun. 2015, 6, 7585. [Google Scholar] [CrossRef] [PubMed]
- You, D.; Nilsson, E.; Tenen, D.E.; Lyubetskaya, A.; Lo, J.C.; Jiang, R.; Deng, J.; Dawes, B.A.; Vaag, A.; Ling, C.; et al. Dnmt3a Is an Epigenetic Mediator of Adipose Insulin Resistance. eLlife 2017, 6, e30766. [Google Scholar] [CrossRef]
- Galmozzi, A.; Mitro, N.; Ferrari, A.; Gers, E.; Gilardi, F.; Godio, C.; Cermenati, G.; Gualerzi, A.; Donetti, E.; Rotili, D.; et al. Inhibition of Class I Histone Deacetylases Unveils a Mitochondrial Signature and Enhances Oxidative Metabolism in Skeletal Muscle and Adipose Tissue. Diabetes 2013, 62, 732–742. [Google Scholar] [CrossRef]
- Ruano, M.; Silvestre, V.; Castro, R.; García-Lescún, M.C.G.; Aguirregoicoa, E.; Marco, A.; Rodríguez, A.; García-Blanch, G. HOMA, QUICKI and MFfm to Measure Insulin Resistance in Morbid Obesity. Obes. Surg. 2006, 16, 549–553. [Google Scholar] [CrossRef]
- Cierzniak, A.; Pawelka, D.; Kaliszewski, K.; Rudnicki, J.; Dobosz, T.; Malodobra-Mazur, M. DNA methylation in adipocytes from visceral and subcutaneous adipose tissue influences insulin-signaling gene expression in obese individuals. Int. J. Obes. 2021, 45, 650–658. [Google Scholar] [CrossRef]
- Małodobra-Mazur, M.; Cierzniak, A.; Pawełka, D.; Kaliszewski, K.; Rudnicki, J.; Dobosz, T. Metabolic Differences between Subcutaneous and Visceral Adipocytes Differentiated with an Excess of Saturated and Monounsaturated Fatty Acids. Genes 2020, 11, 1092. [Google Scholar] [CrossRef]


| Parameter | IS a [Mean ± SD] | IR b [Mean ± SD] | p Value |
|---|---|---|---|
| Number [F/M] | 13 [4/9] | 14 [3/11] | n.s. c |
| Age [years] | 44.2 ± 8 | 47.7 ± 8 | n.s. |
| BMI [kg/m2] | 24.6 ± 5.0 | 27.7 ± 5.1 | n.s. |
| Glucose [mg/dL] | 89.9 ± 7 | 97.7 ± 16 | n.s. |
| Insulin [µU/mL] | 7.8 ± 2.7 | 18.5 ± 13 | 0.010 |
| HOMA-IR | 1.71 ± 0.6 | 4.3 ± 2.9 | 0.006 |
| QUICKI | 0.359 ± 0.03 | 0.320 ± 0.03 | 0.007 |
| Cholesterol [mg/dL] | 244 ± 75 | 200 ± 40 | n.s. |
| TG [mg/dL] | 69 ± 22 | 140 ± 44 | <0.0001 |
| LDL [mg/dL] | 138 ± 76 | 128 ± 34 | n.s. |
| HDL [mg/dL] | 84 ± 14 | 45 ± 7 | 0.005 |
| mtDNA | IS [Mean ± SD] | IR [Mean ± SD] | p Value |
|---|---|---|---|
| SAT | 21.736 ± 39.812 | 4089 ± 4162 | 0.159 |
| VAT | 11.471 ± 13.790 | 2288 ± 1004 | 0.031 |
| Parameter | SAT | VAT | ||
|---|---|---|---|---|
| R2 | p Value | R2 | p Value | |
| Age [years] | −0.62 | 0.002 | −0.05 | n.s. a |
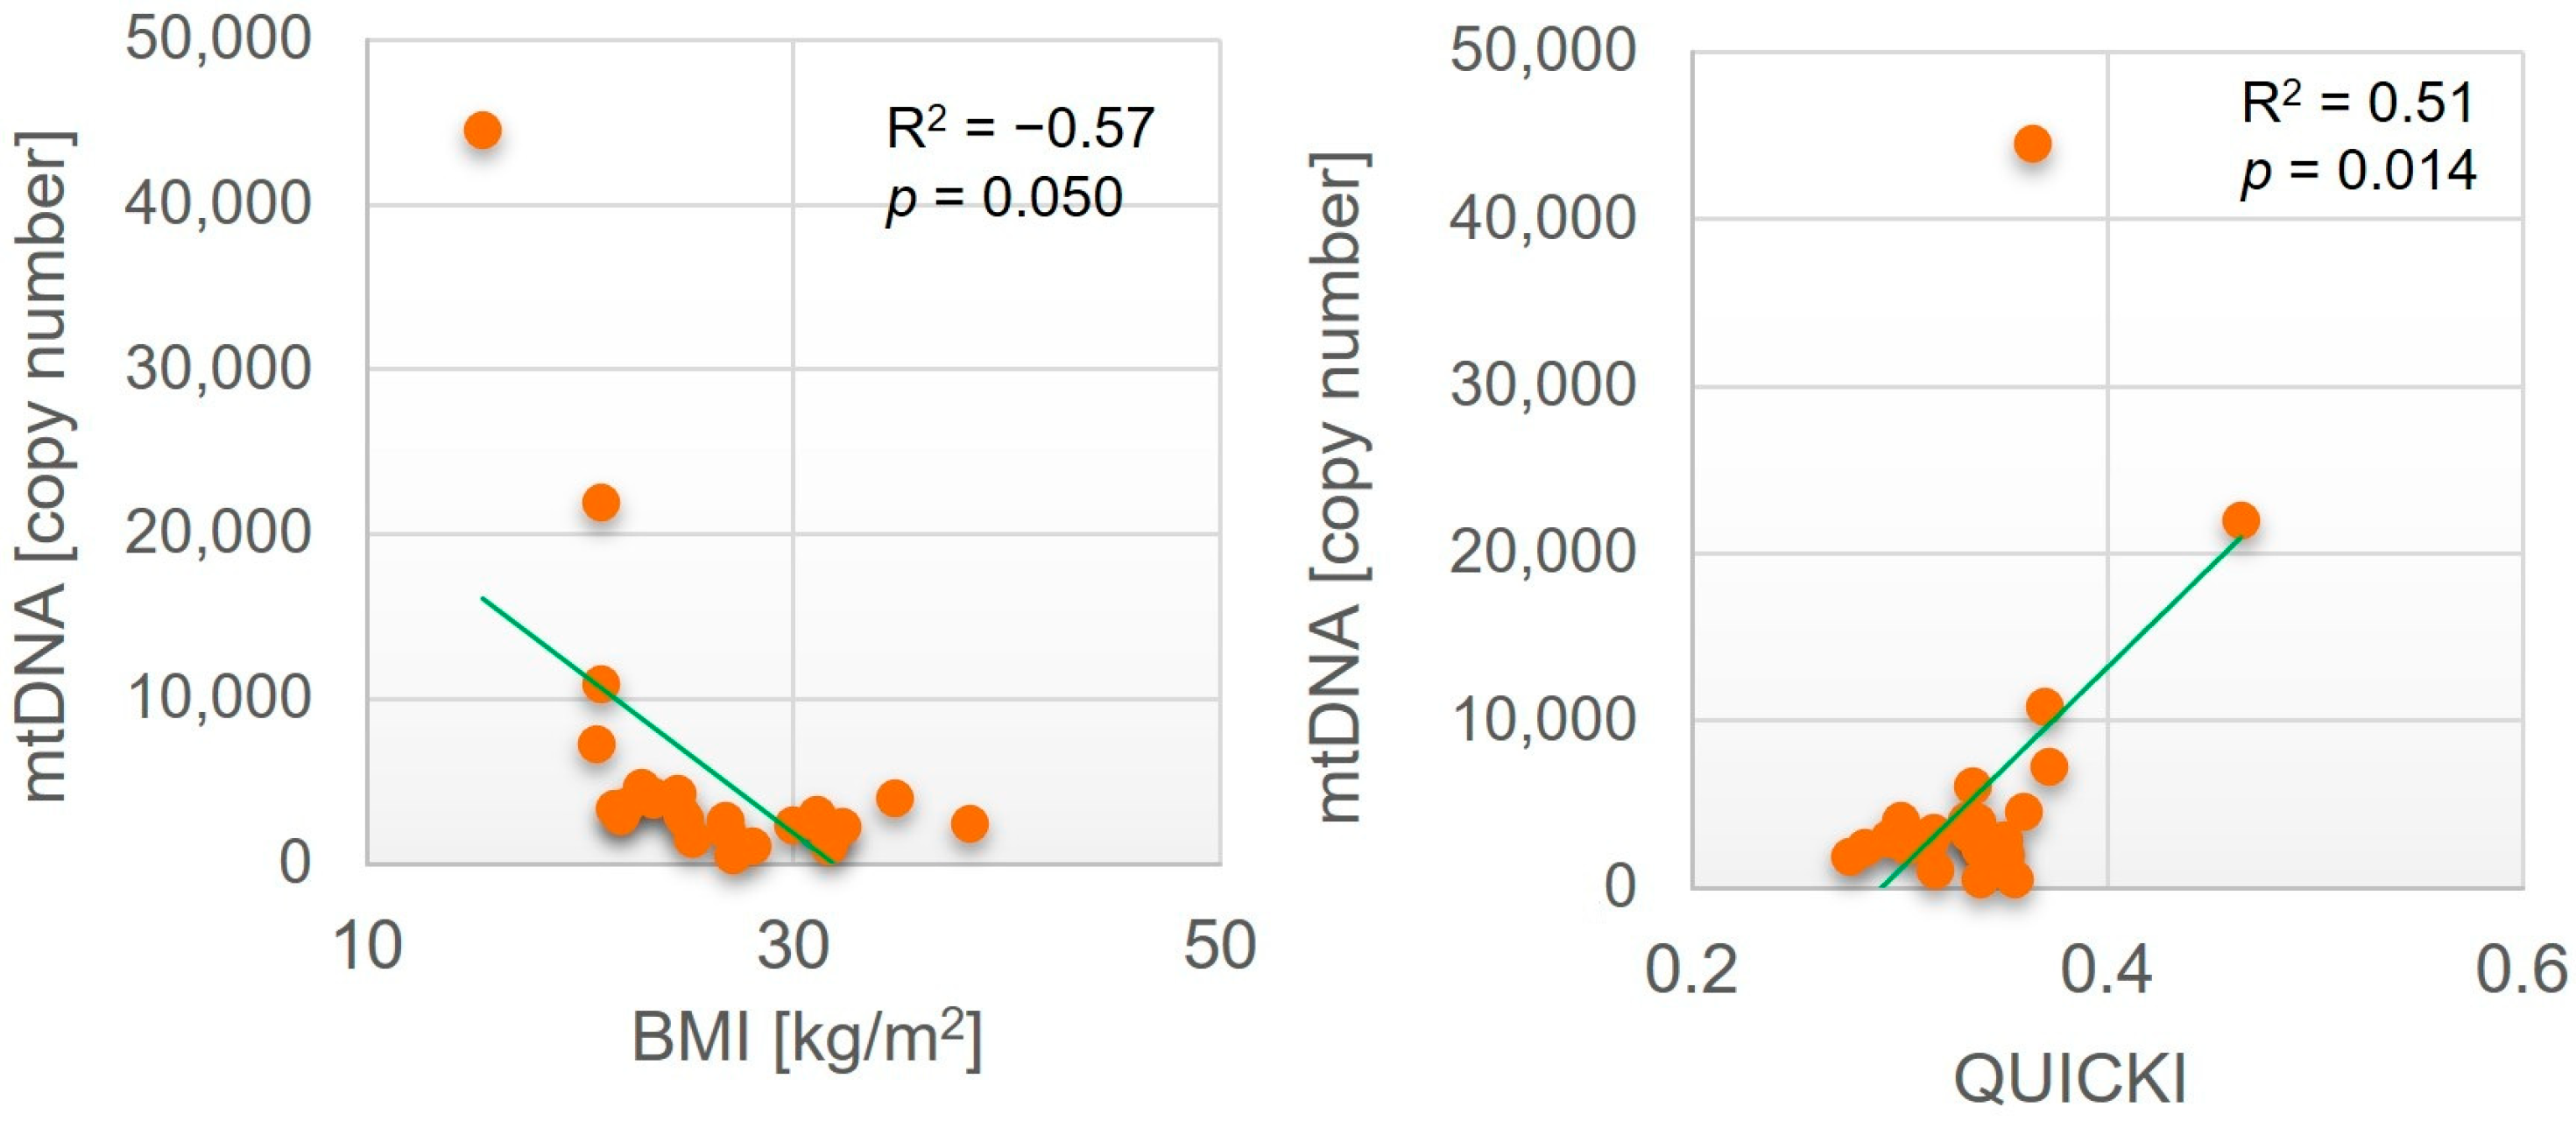
| BMI [kg/m2] | −0.17 | n.s. | −0.57 | 0.050 |
| Glucose [mg/dL] | −0.17 | n.s. | −0.07 | n.s. |
| Insulin [µU/mL] | 0.04 | n.s. | −0.31 | n.s. |
| HOMA-IR | 0.00 | n.s. | −0.31 | n.s. |
| QUICKI | −0.05 | n.s. | 0.51 | 0.014 |
| Cholesterol [mg/dL] | −0.07 | n.s. | 0.05 | n.s. |
| TG [mg/dL] | −0.22 | n.s. | −0.28 | n.s. |
| LDL [mg/dL] | 0.25 | n.s. | 0.32 | n.s. |
| HDL [mg/dL] | −0.11 | n.s. | 0.02 | n.s. |
| Gene | SAT | VAT | ||||||
|---|---|---|---|---|---|---|---|---|
| IR | IS | IR | IS | |||||
| R2 | p Value | R2 | p Value | R2 | p Value | R2 | p Value | |
| HDAC1 | −0.13 | n.s. | −0.09 | n.s. | 0.05 | n.s. | 0.60 | 0.043 |
| HDAC2 | −0.08 | n.s. | −0.19 | n.s. | 0.66 | 0.021 | 0.84 | 0.008 |
| SIRT 1 | −0.10 | n.s. | −0.12 | n.s. | 0.83 | 0.001 | 0.56 | n.s. |
| INSR | −0.37 | n.s. | −0.28 | n.s. | 0.77 | 0.003 | 0.47 | n.s. |
| AKT | −0.16 | n.s. | −0.31 | n.s. | 0.69 | 0.015 | 0.08 | n.s. |
| SLC2A4 | −0.42 | n.s. | 0.04 | n.s. | 0.91 | <0.0001 | 0.73 | 0.008 |
| PPARG | −0.26 | n.s. | −0.06 | n.s. | 0.87 | <0.0001 | 0.24 | n.s. |
| IL6 | 0.28 | n.s. | 0.99 | <0.0001 | −0.27 | n.s. | −0.23 | n.s. |
| IL10 | 0.17 | n.s. | −0.08 | n.s. | −0.22 | n.s. | −0.17 | n.s. |
| PIK3R1 | −0.11 | n.s. | −0.05 | n.s. | 0.88 | 0.001 | 0.61 | 0.036 |
| LEP | −0.36 | n.s. | −0.32 | n.s. | 0.03 | n.s. | −0.28 | n.s. |
| ADIPOQ | −0.41 | n.s. | −0.14 | n.s. | 0.84 | <0.0001 | −0.15 | n.s. |
| RBP4 | −0.35 | n.s. | −0.14 | n.s. | 0.78 | 0.003 | −0.02 | n.s. |
| LPL | −0.38 | n.s. | −0.19 | n.s. | 0.78 | 0.003 | 0.08 | n.s. |
| ACC | −0.57 | n.s. | −0.16 | n.s. | 0.88 | <0.0001 | 0.28 | n.s. |
| DNMT1 | 0.31 | n.s. | 0.12 | n.s. | 0.71 | 0.011 | 0.57 | n.s. |
| DNMT3A | −0.15 | n.s. | −0.11 | n.s. | 0.38 | n.s. | 0.92 | 0.001 |
| CEBPA | −0.13 | n.s. | −0.01 | n.s. | 0.80 | 0.002 | −0.26 | n.s. |
| CEBPB | 0.96 | 0.008 | 0.97 | 0.012 | 0.44 | n.s. | 0.03 | n.s. |
| CEPBD | 0.96 | 0.001 | 0.99 | 0.001 | −0.04 | n.s. | −0.10 | n.s. |
| TNF | 0.03 | n.s. | 0.11 | n.s. | −0.21 | n.s. | −0.02 | n.s. |
| FASN | −0.45 | n.s. | −0.15 | n.s. | 0.91 | <0.0001 | 0.32 | n.s. |
| ACSS2 | −0.41 | n.s. | 0.11 | n.s. | 0.87 | 0.003 | 0.79 | 0.002 |
| SCD1 | −0.28 | n.s. | −0.13 | n.s. | 0.59 | 0.046 | −0.05 | n.s. |
| SIRT7 | 0.31 | n.s. | −0.01 | n.s. | 0.58 | 0.049 | 0.21 | n.s. |
| HIF3a | 0.42 | n.s. | −0.09 | n.s. | 0.06 | n.s. | −0.07 | n.s. |
| PGC1a | −0.38 | n.s. | −0.28 | n.s. | −0.22 | n.s. | 0.82 | 0.001 |
| IGF2 | 0.23 | n.s. | 0.16 | n.s. | −0.04 | n.s. | −0.09 | n.s. |
Disclaimer/Publisher’s Note: The statements, opinions and data contained in all publications are solely those of the individual author(s) and contributor(s) and not of MDPI and/or the editor(s). MDPI and/or the editor(s) disclaim responsibility for any injury to people or property resulting from any ideas, methods, instructions or products referred to in the content. |
© 2025 by the authors. Licensee MDPI, Basel, Switzerland. This article is an open access article distributed under the terms and conditions of the Creative Commons Attribution (CC BY) license (https://creativecommons.org/licenses/by/4.0/).
Share and Cite
Ołdakowska, M.; Cierzniak, A.; Jurek, T.; Małodobra-Mazur, M. Impaired Mitochondrial DNA Copy Number in Visceral Adipose Tissue of Insulin-Resistant Individuals: Implications for Metabolic Dysregulation. Int. J. Mol. Sci. 2025, 26, 7398. https://doi.org/10.3390/ijms26157398
Ołdakowska M, Cierzniak A, Jurek T, Małodobra-Mazur M. Impaired Mitochondrial DNA Copy Number in Visceral Adipose Tissue of Insulin-Resistant Individuals: Implications for Metabolic Dysregulation. International Journal of Molecular Sciences. 2025; 26(15):7398. https://doi.org/10.3390/ijms26157398
Chicago/Turabian StyleOłdakowska, Monika, Aneta Cierzniak, Tomasz Jurek, and Małgorzata Małodobra-Mazur. 2025. "Impaired Mitochondrial DNA Copy Number in Visceral Adipose Tissue of Insulin-Resistant Individuals: Implications for Metabolic Dysregulation" International Journal of Molecular Sciences 26, no. 15: 7398. https://doi.org/10.3390/ijms26157398
APA StyleOłdakowska, M., Cierzniak, A., Jurek, T., & Małodobra-Mazur, M. (2025). Impaired Mitochondrial DNA Copy Number in Visceral Adipose Tissue of Insulin-Resistant Individuals: Implications for Metabolic Dysregulation. International Journal of Molecular Sciences, 26(15), 7398. https://doi.org/10.3390/ijms26157398