1. Introduction
Chromobox family (CBX) proteins, known as integral components of polycomb group complexes, play crucial roles in numerous biological processes such as embryonic development, stem cell maintenance, cell proliferation, and apoptosis [
1]. Increasing evidence suggests their involvement in regulating tumor-related processes like cell cycle [
2], chemotherapy and radiotherapy sensitivity [
3], tumor cell stemness [
4], and metabolism [
5], affecting tumor initiation and progression significantly [
6,
7].
The CBX family can be categorized into two subgroups based on their molecular structure: the HP1 group (including CBX1, CBX3, and CBX5) and the Pc group (including CBX2, CBX4, CBX6, CBX7, and CBX8). While some CBX genes and proteins have been studied in relation to cancers like breast, liver, and gastric cancer, the roles of CBX family members in colorectal cancer (CRC) are still unclear [
8]. The biological functions and prognostic significance of CBX1-8 in cancer progression remain uncertain, with misregulation of CBX proteins being linked to various cancer types. Further research is needed to determine the specific functions and prognostic values of different CBX family members in CRC.
Colorectal cancer (CRC) is the third most prevalent form of cancer worldwide and the second leading cause of cancer-related mortality [
9]. Its incidence is rising among the young [
10]. Guidelines now recommend screening for colon cancer at age 45 [
11]. Circulating tumor DNA can be used to select patients for adjuvant chemotherapy. Immunotherapy is an option for patients with mismatch repair protein deficiencies, but its efficacy outside of this group remains unclear. Targeted therapies such as BRAF inhibitors are an option for patients with poor prognoses, for whom chemotherapy is ineffective [
12].
Understanding the molecular mechanisms through which CBX proteins modulate tumorigenesis may reveal novel therapeutic targets for cancer intervention. Several chromatin-associated regulatory proteins have already been identified as candidate targets for anti-cancer therapy, with small-molecule inhibitors currently in development or undergoing clinical trials. This underscores the increasing scientific and clinical interest in CBX proteins and their associated signaling pathways as viable targets in oncology. In this context, we expanded our investigation to CRC, utilizing multiple large-scale datasets to assess the potential oncogenic roles of individual CBX family members in CRC. Moreover, we aimed to deepen the role of CBX4 in CRC. Among the CBX family members, CBX4 stands out due to its dual functionality, combining both epigenetic and post-translational regulatory roles [
13]. CBX4 has been implicated in tumor progression in hepatocellular [
14,
15], gastric [
4], and lung cancers [
16,
17] through mechanisms involving angiogenesis, SUMOylation, and epigenetic repression. However, despite growing interest in CBX proteins as key players in cancer biology, the role of CBX4 in CRC remains poorly investigated, particularly in relation to its potential involvement in inflammatory signaling pathways, which are central to colorectal tumorigenesis. Therefore, we focused our study on CBX4, characterizing its expression profile, regulatory functions, and clinical significance in CRC. By integrating analyses of clinical samples, in vitro cell models, and patient-derived organoids, we also linked CBX4 regulators to inflammation-driven tumor progression in CRC.
3. Discussion
CBXs form a family of eight proteins that are integral components of polycomb group complexes and play a crucial role in epigenetic regulation, gene silencing, and chromatin remodeling [
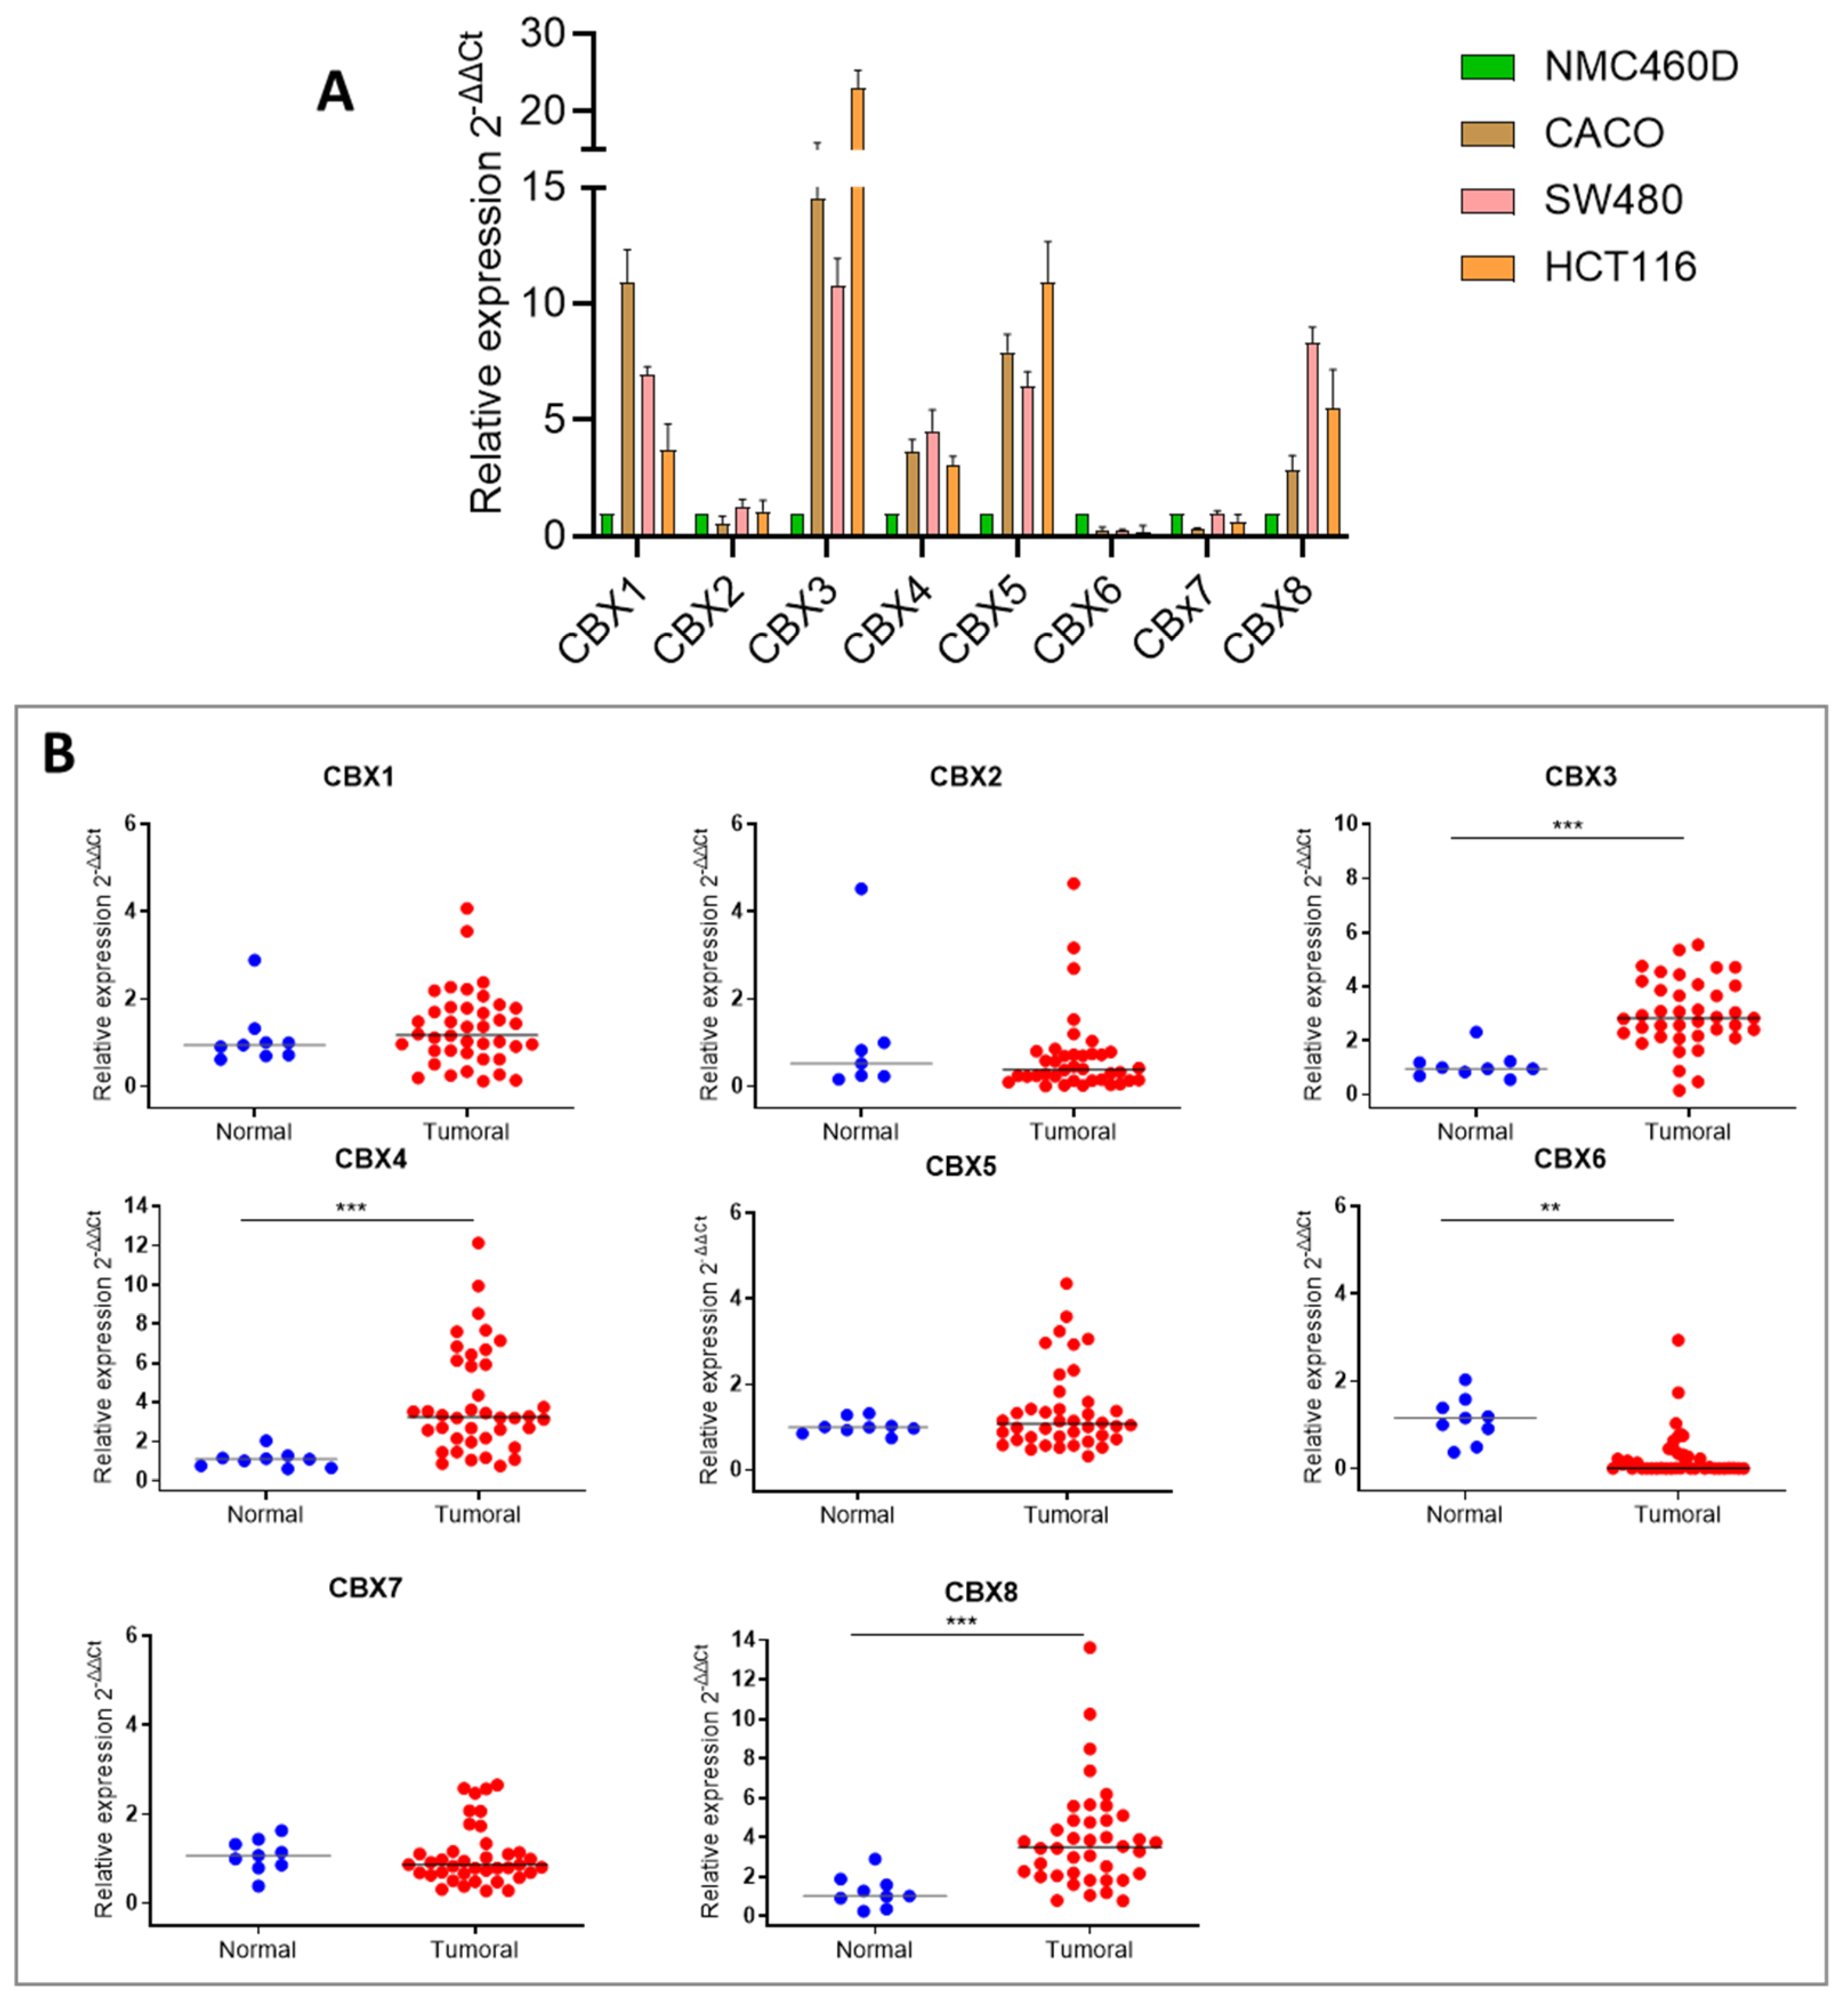
18]. In this study, we first provide a comprehensive analysis of the expression patterns and functional relevance of CBX proteins in CRC.
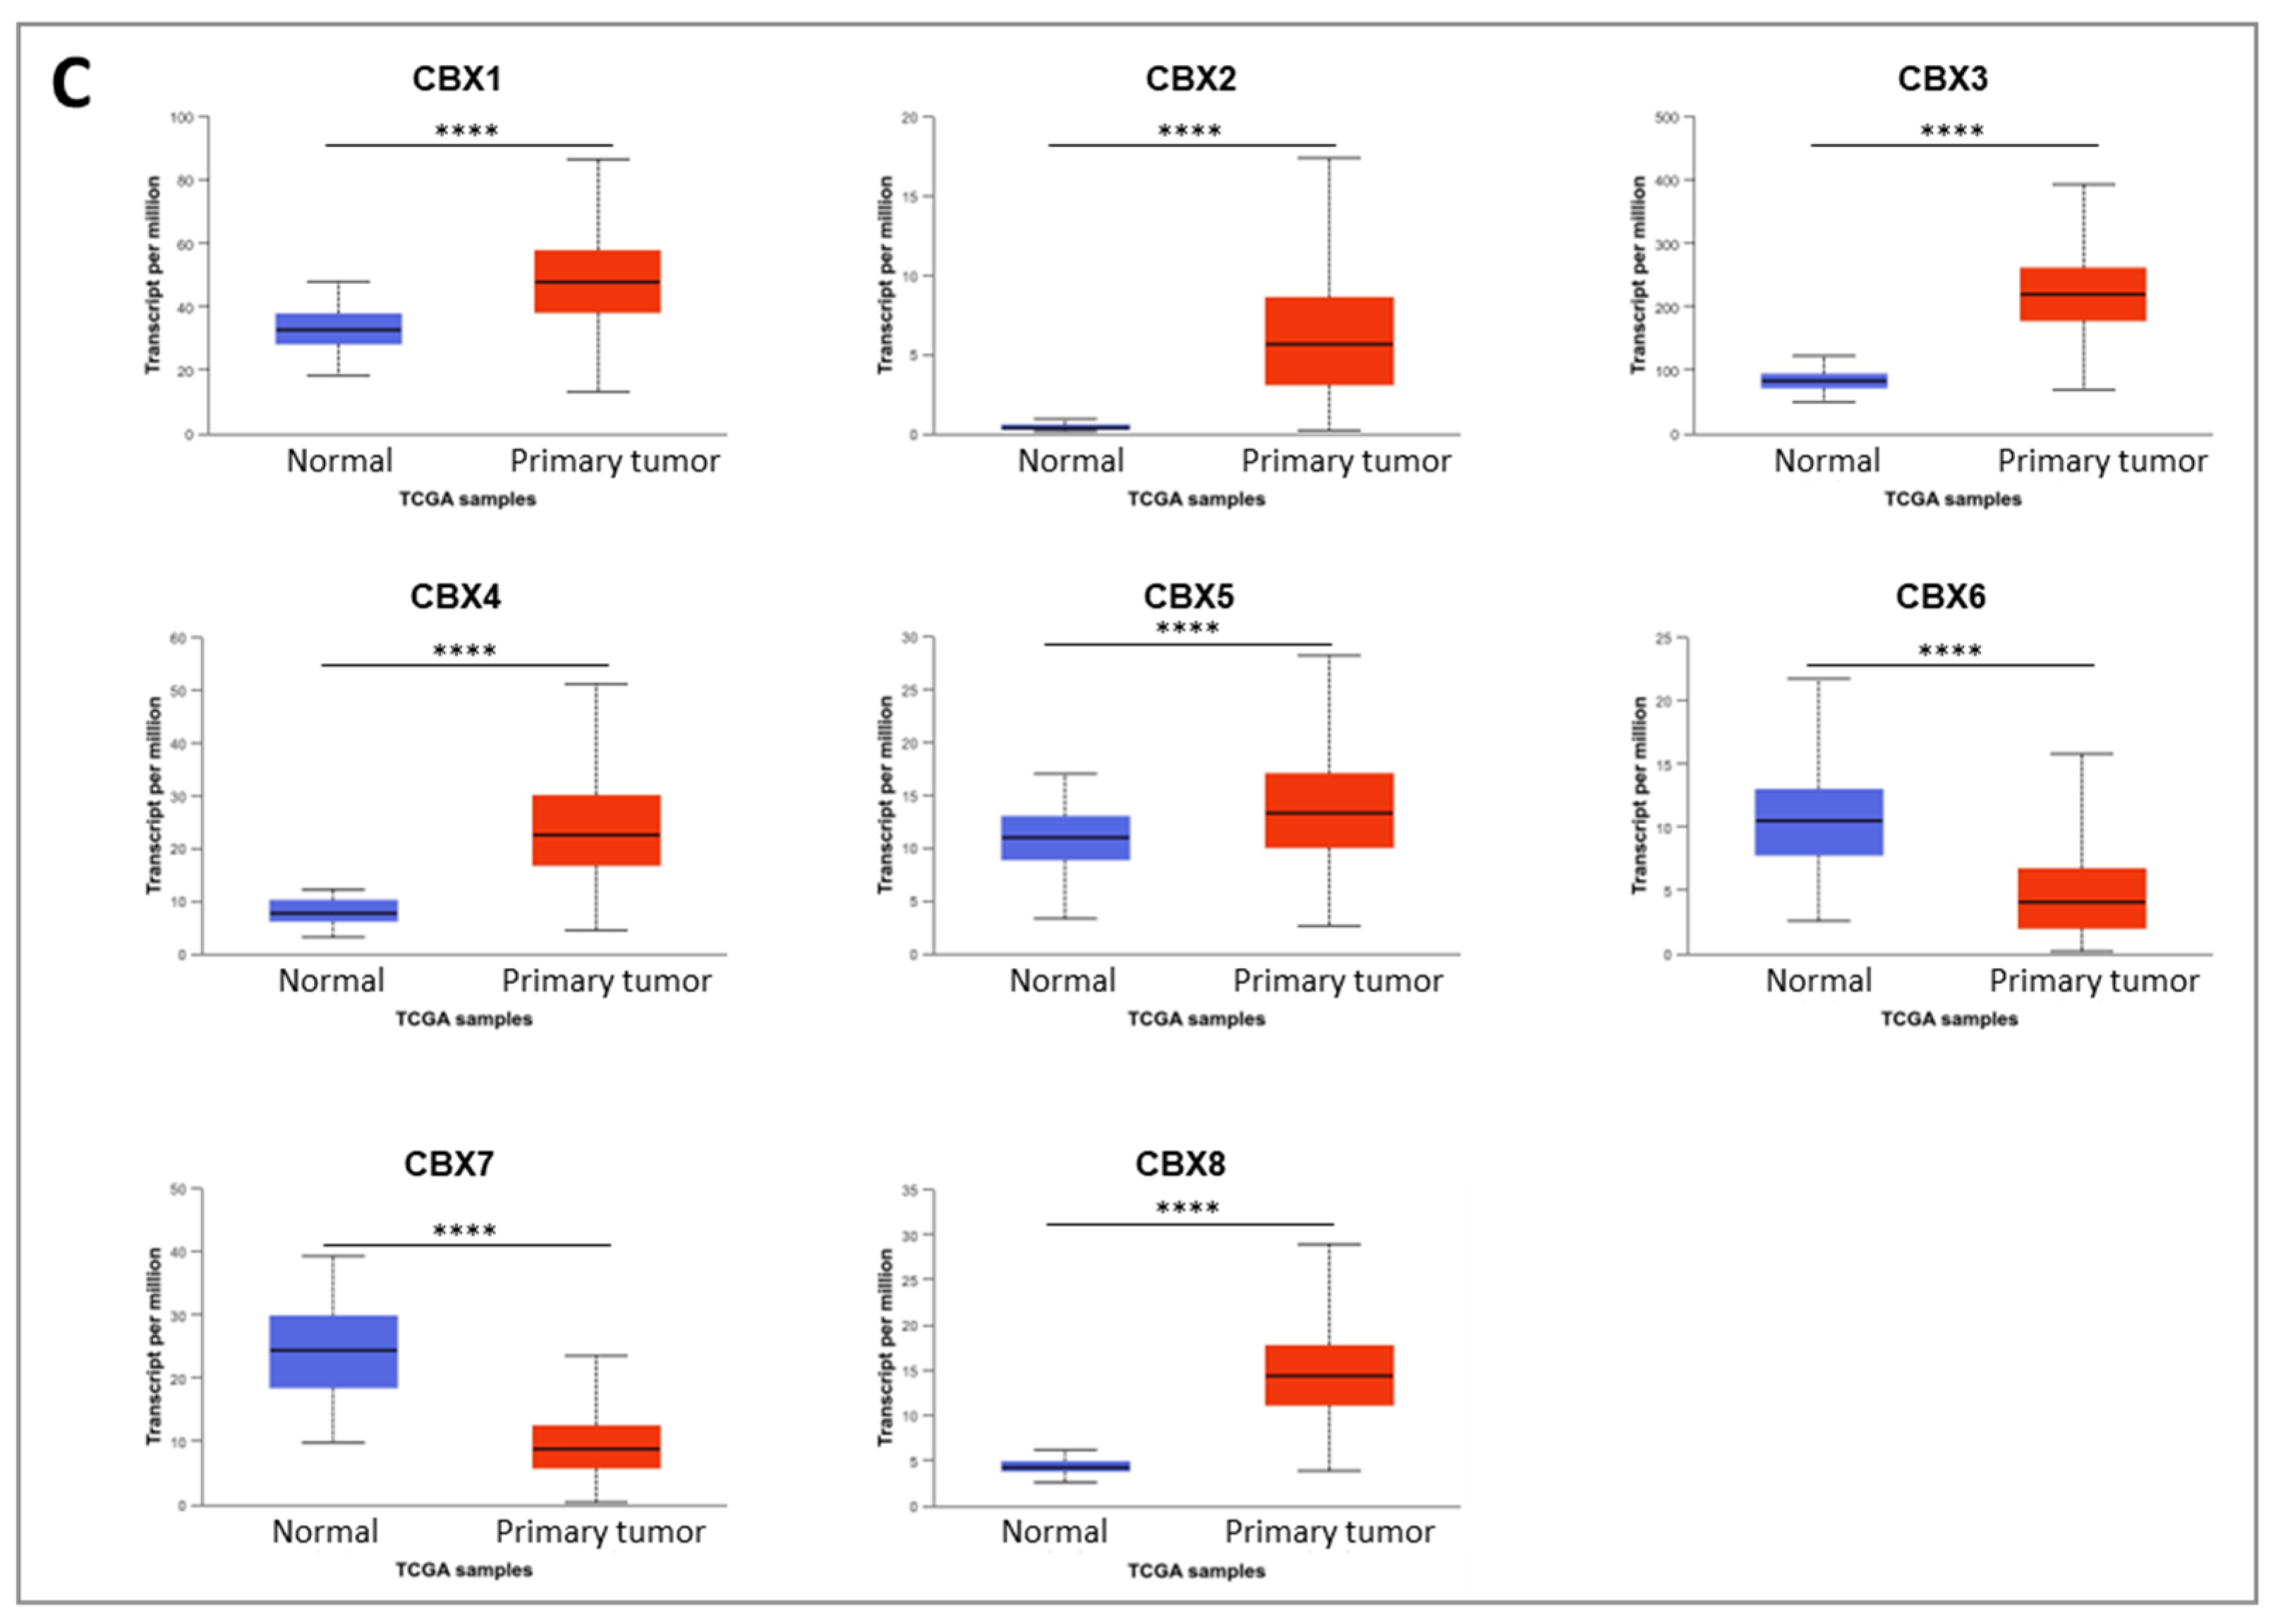
Our findings show that CBX3, CBX4, and CBX8, all members of the polycomb (Pc) group of the non-canonical PRC1 (nPRC1) complex, are significantly upregulated in both CRC cell lines and tumor tissues. In contrast, CBX6 displays a consistent downregulation across both CRC cell lines and tumor samples. The role of this gene appears highly context-dependent, acting either as an oncogene or tumor suppressor depending on the cancer type and cellular environment. For instance, significant downregulation of CBX6 was reported in breast cancer, where its ectopic overexpression inhibited tumor progression [
19]. Otherwise, in liver cancer, elevated CBX6 expression was associated with a worse prognosis [
13]. The consistent downregulation of CBX6 observed in our study supports previous pan-cancer analyses of CBX gene expression and prognosis [
20]. It suggests a tumor-suppressive role for CBX6 in colorectal cancer, particularly in COAD.
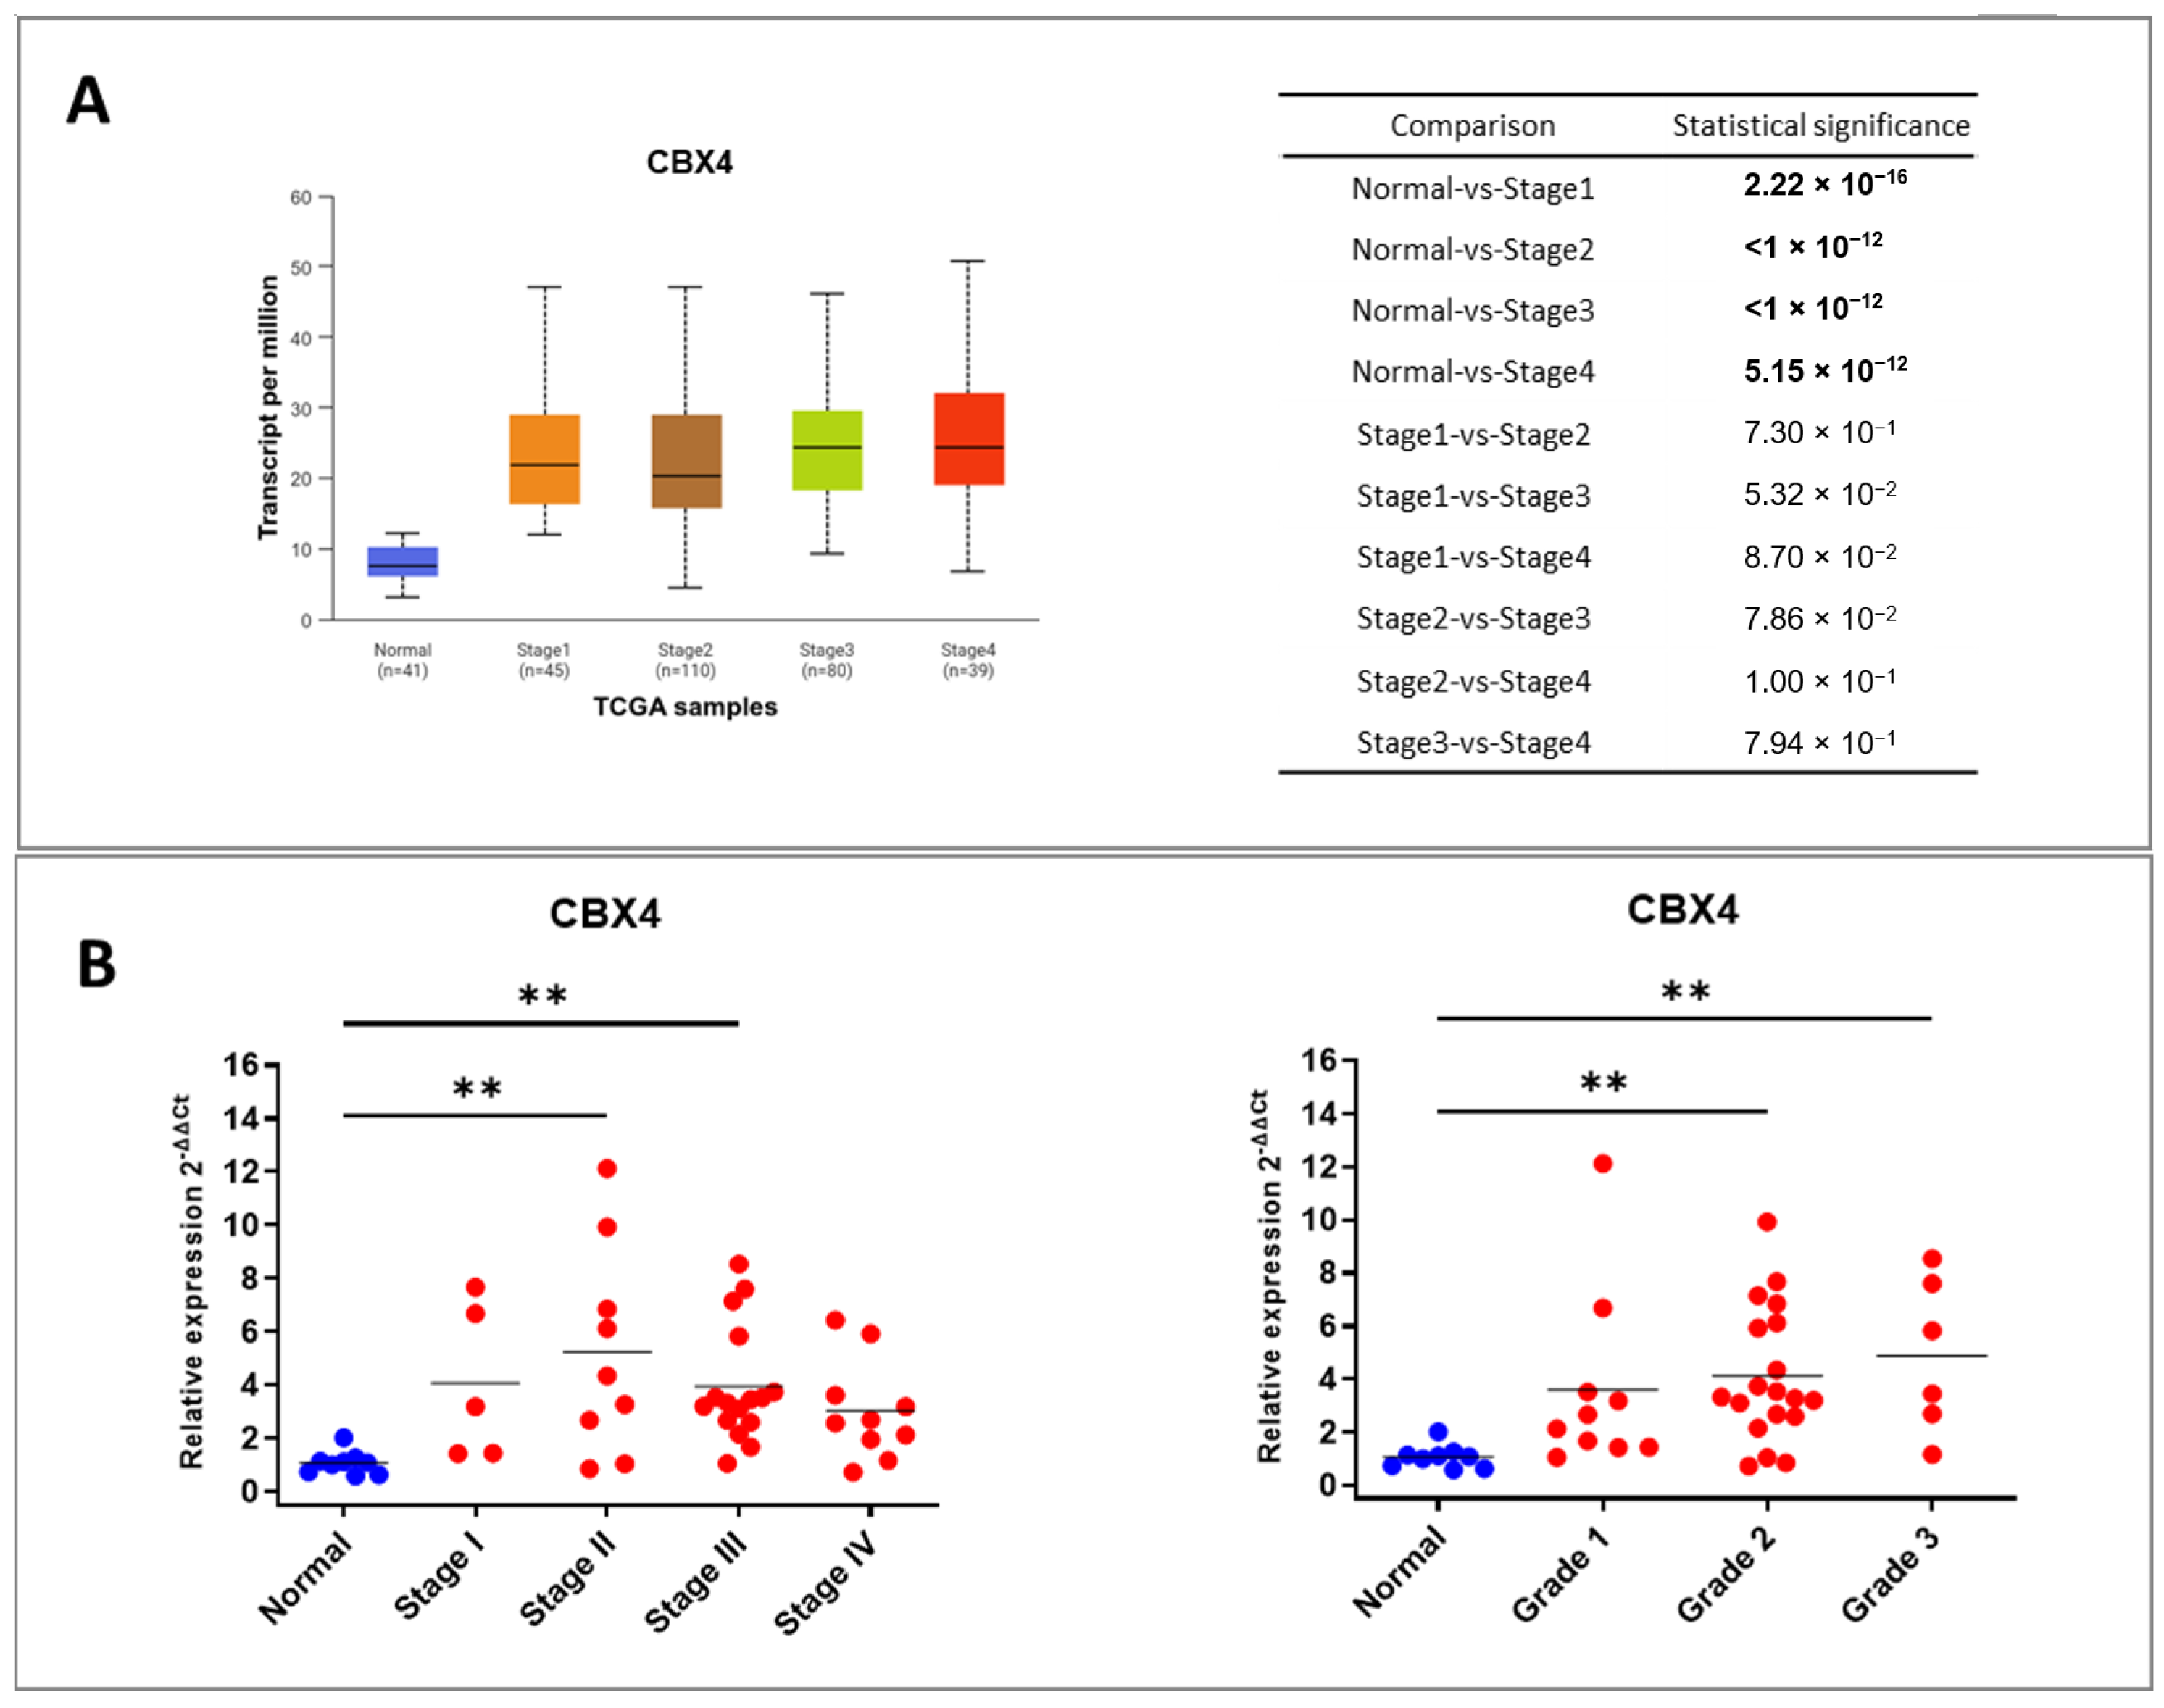
Notably, CBX4 has been reported to play a pivotal role in epigenetic regulation, contributing to transcriptional repression and the DNA damage response through its chromatin-binding ability and SUMO E3 ligase activity [
21], influencing the transcriptional activity of critical transcription factors and controlling the cell cycle in cancer cells [
22]. It is involved in various biological processes, including cell growth, senescence, and cancer development. Its expression levels influence tumor initiation and patient prognosis across multiple cancer types [
23]. Several studies have demonstrated that CBX4 expression scores are significantly higher in the recurrence group compared to the non-recurrence group, suggesting that elevated CBX4 expression may be associated with poor prognosis in patients with colon cancer. Moreover, CBX4 expression has shown a positive correlation with postoperative recurrence in early-stage colon cancer cases [
24]. However, the role of CBX4 in CRC remains understudied: its function in CRC and its possible interaction with inflammatory pathways—central to colorectal tumorigenesis—have not been systematically investigated. Given this uncertainty and the increasing evidence linking CBX proteins to inflammation-driven cancer progression, we focused our study on CBX4 to elucidate its expression pattern, regulatory networks, and clinical relevance in CRC.
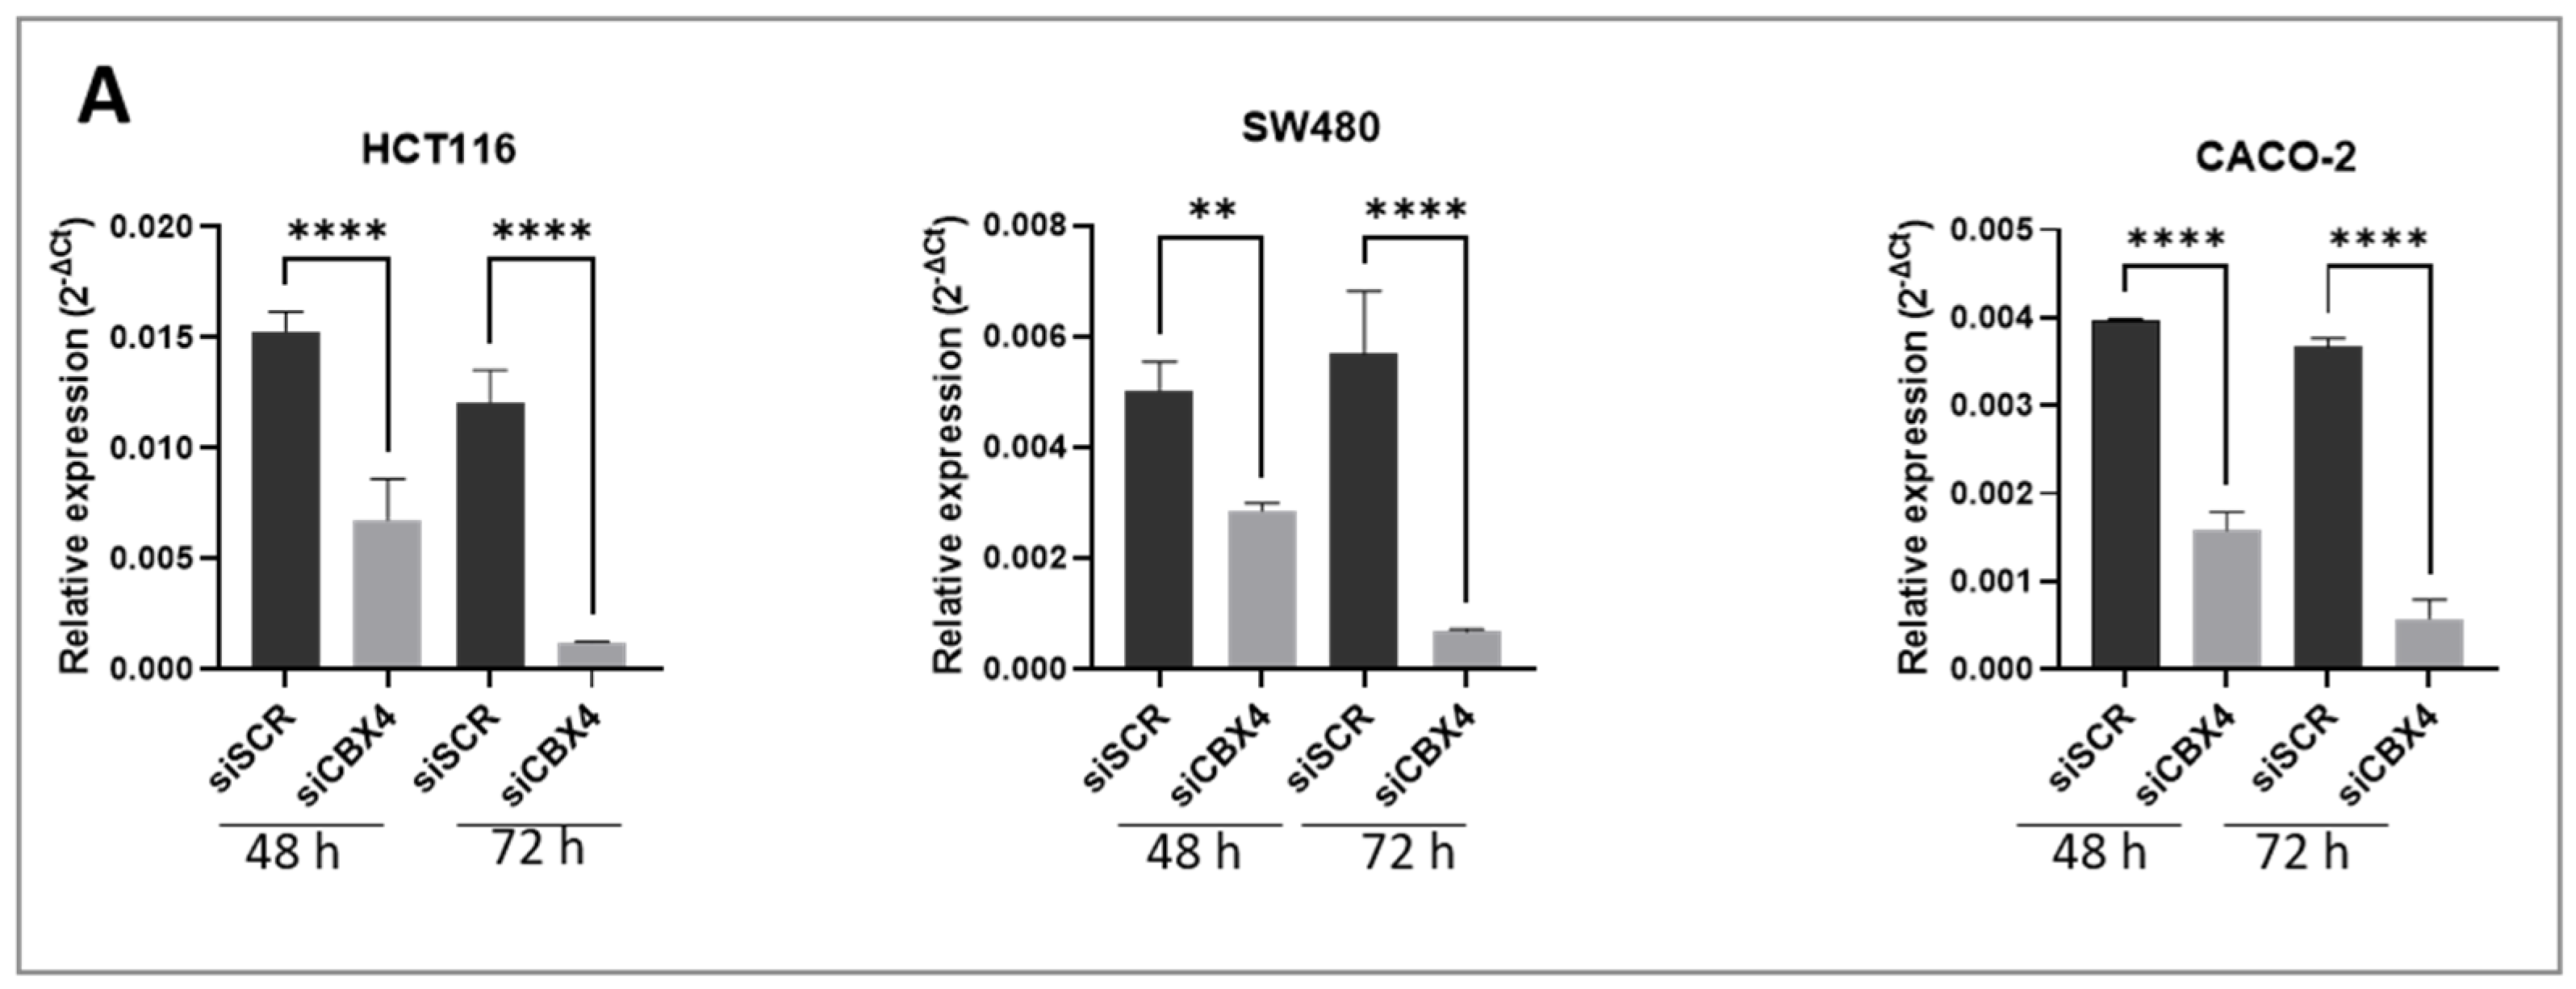
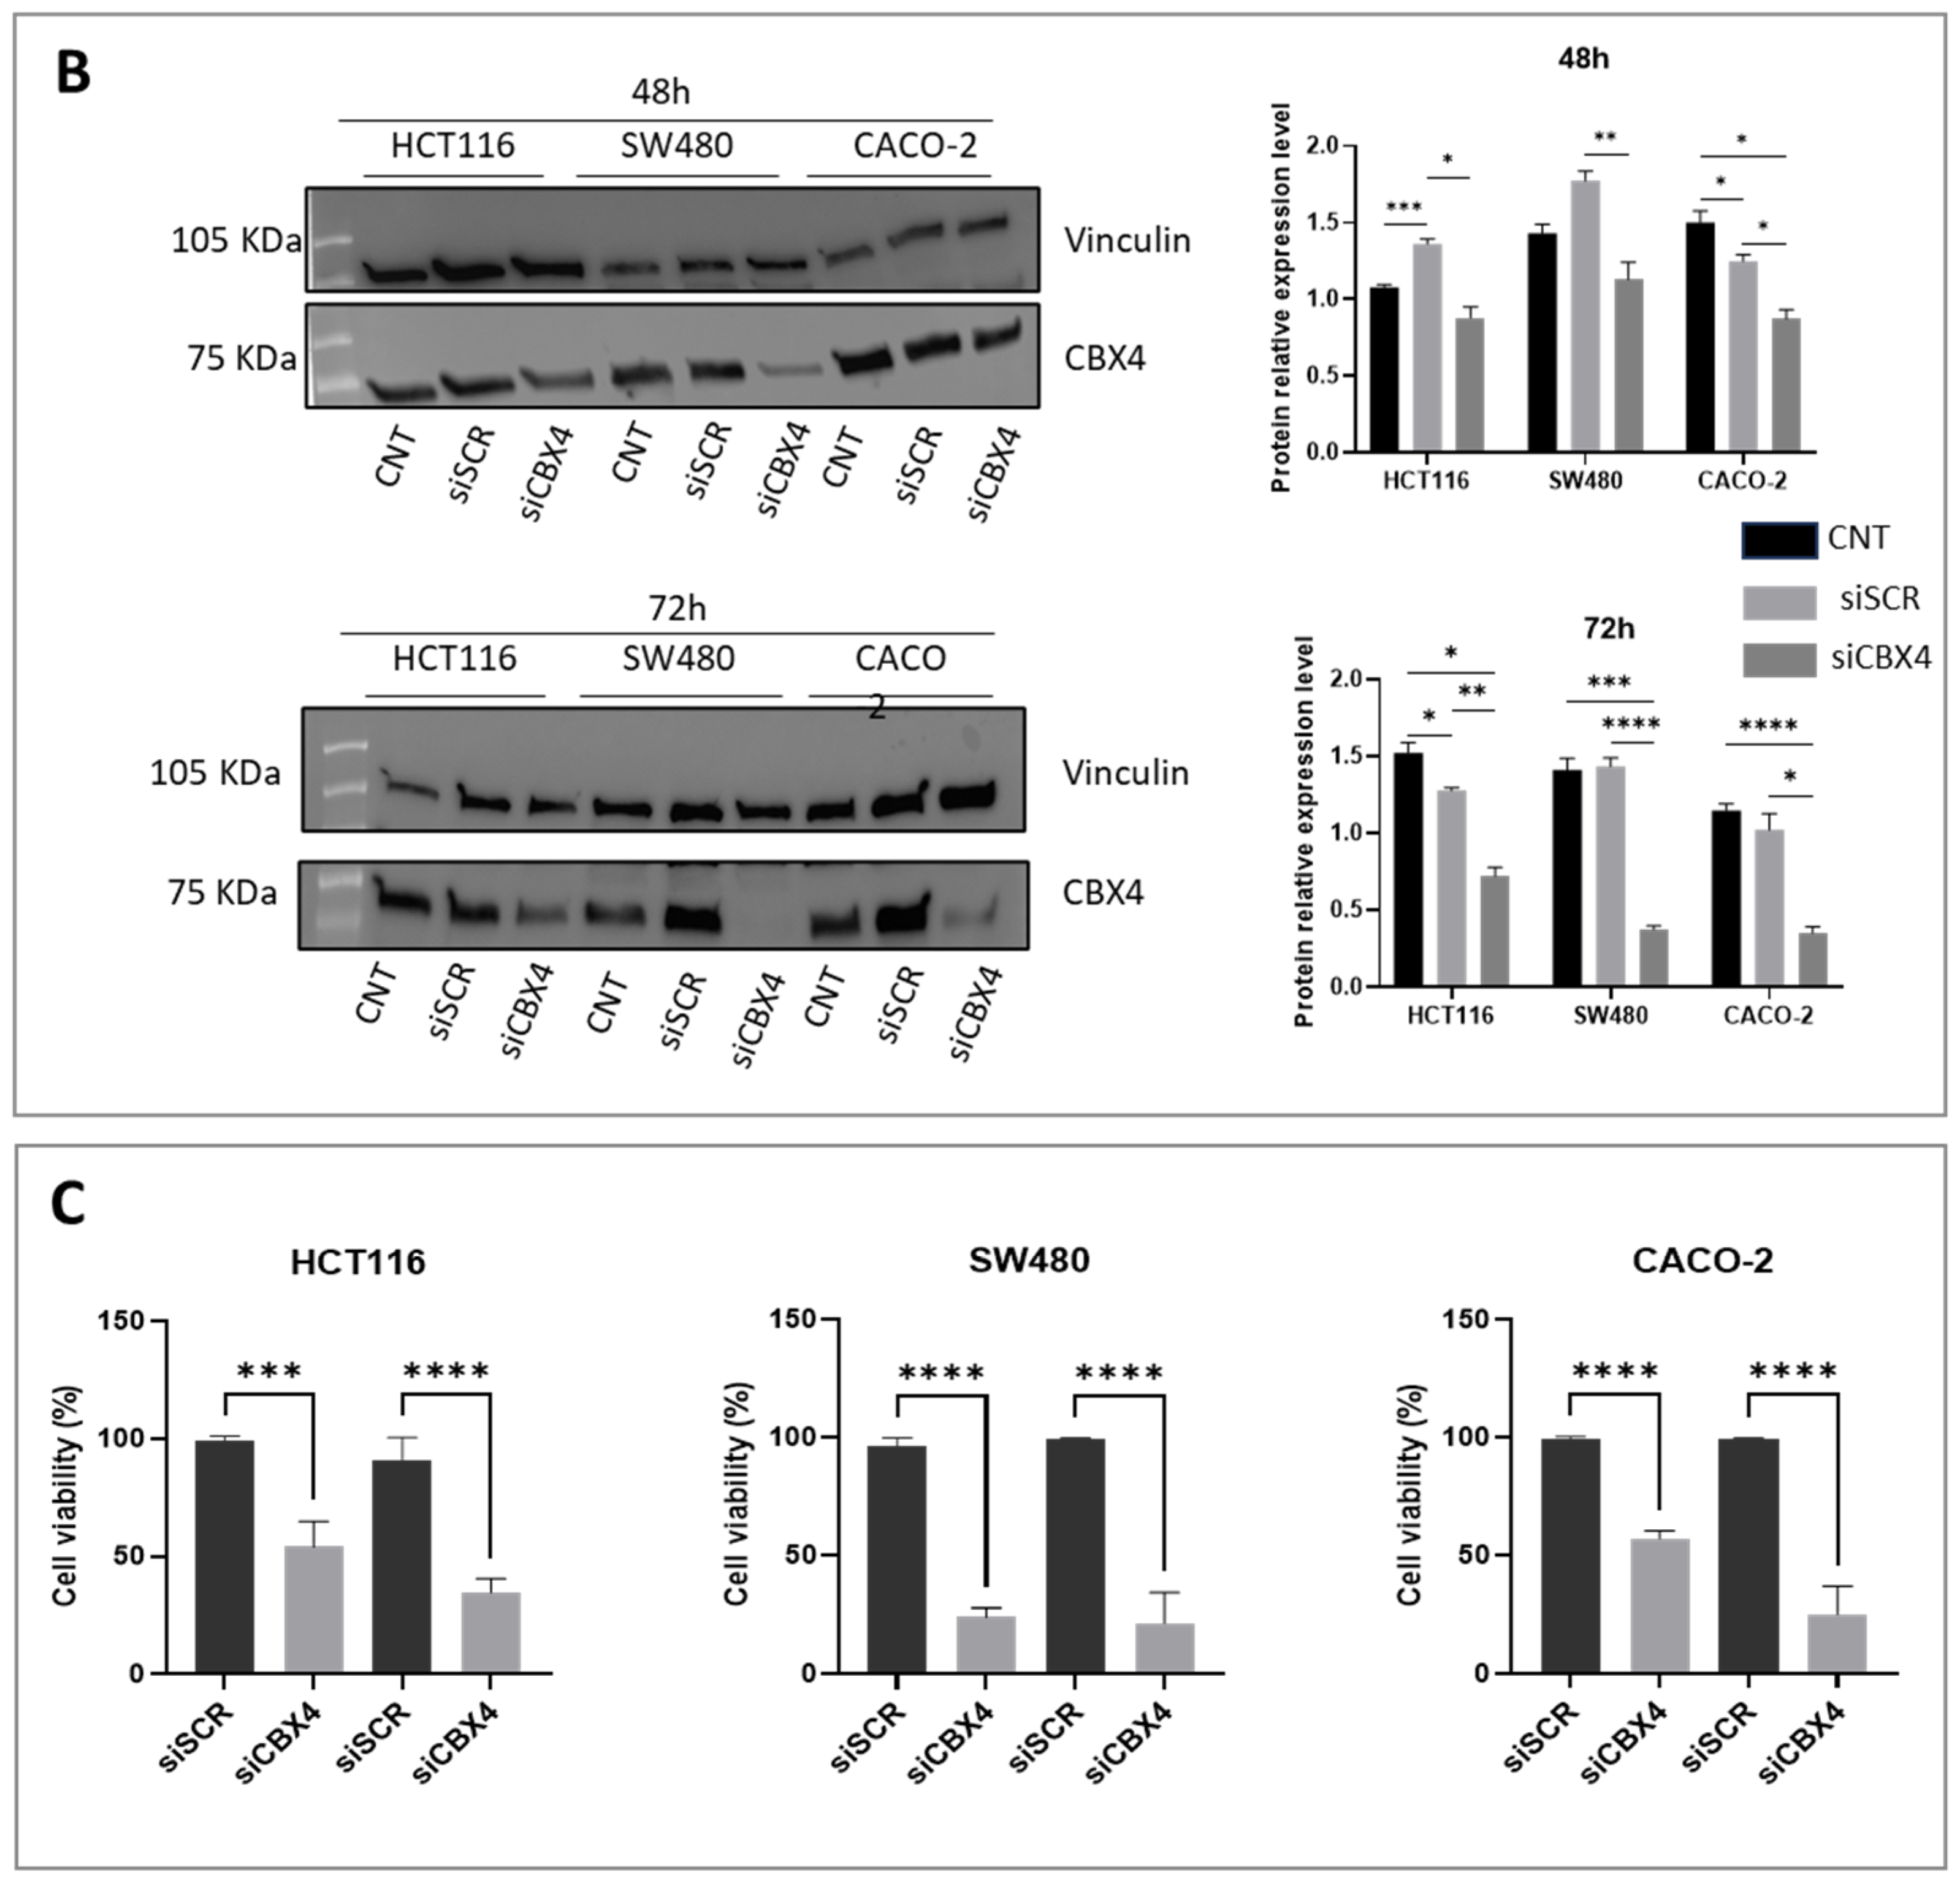
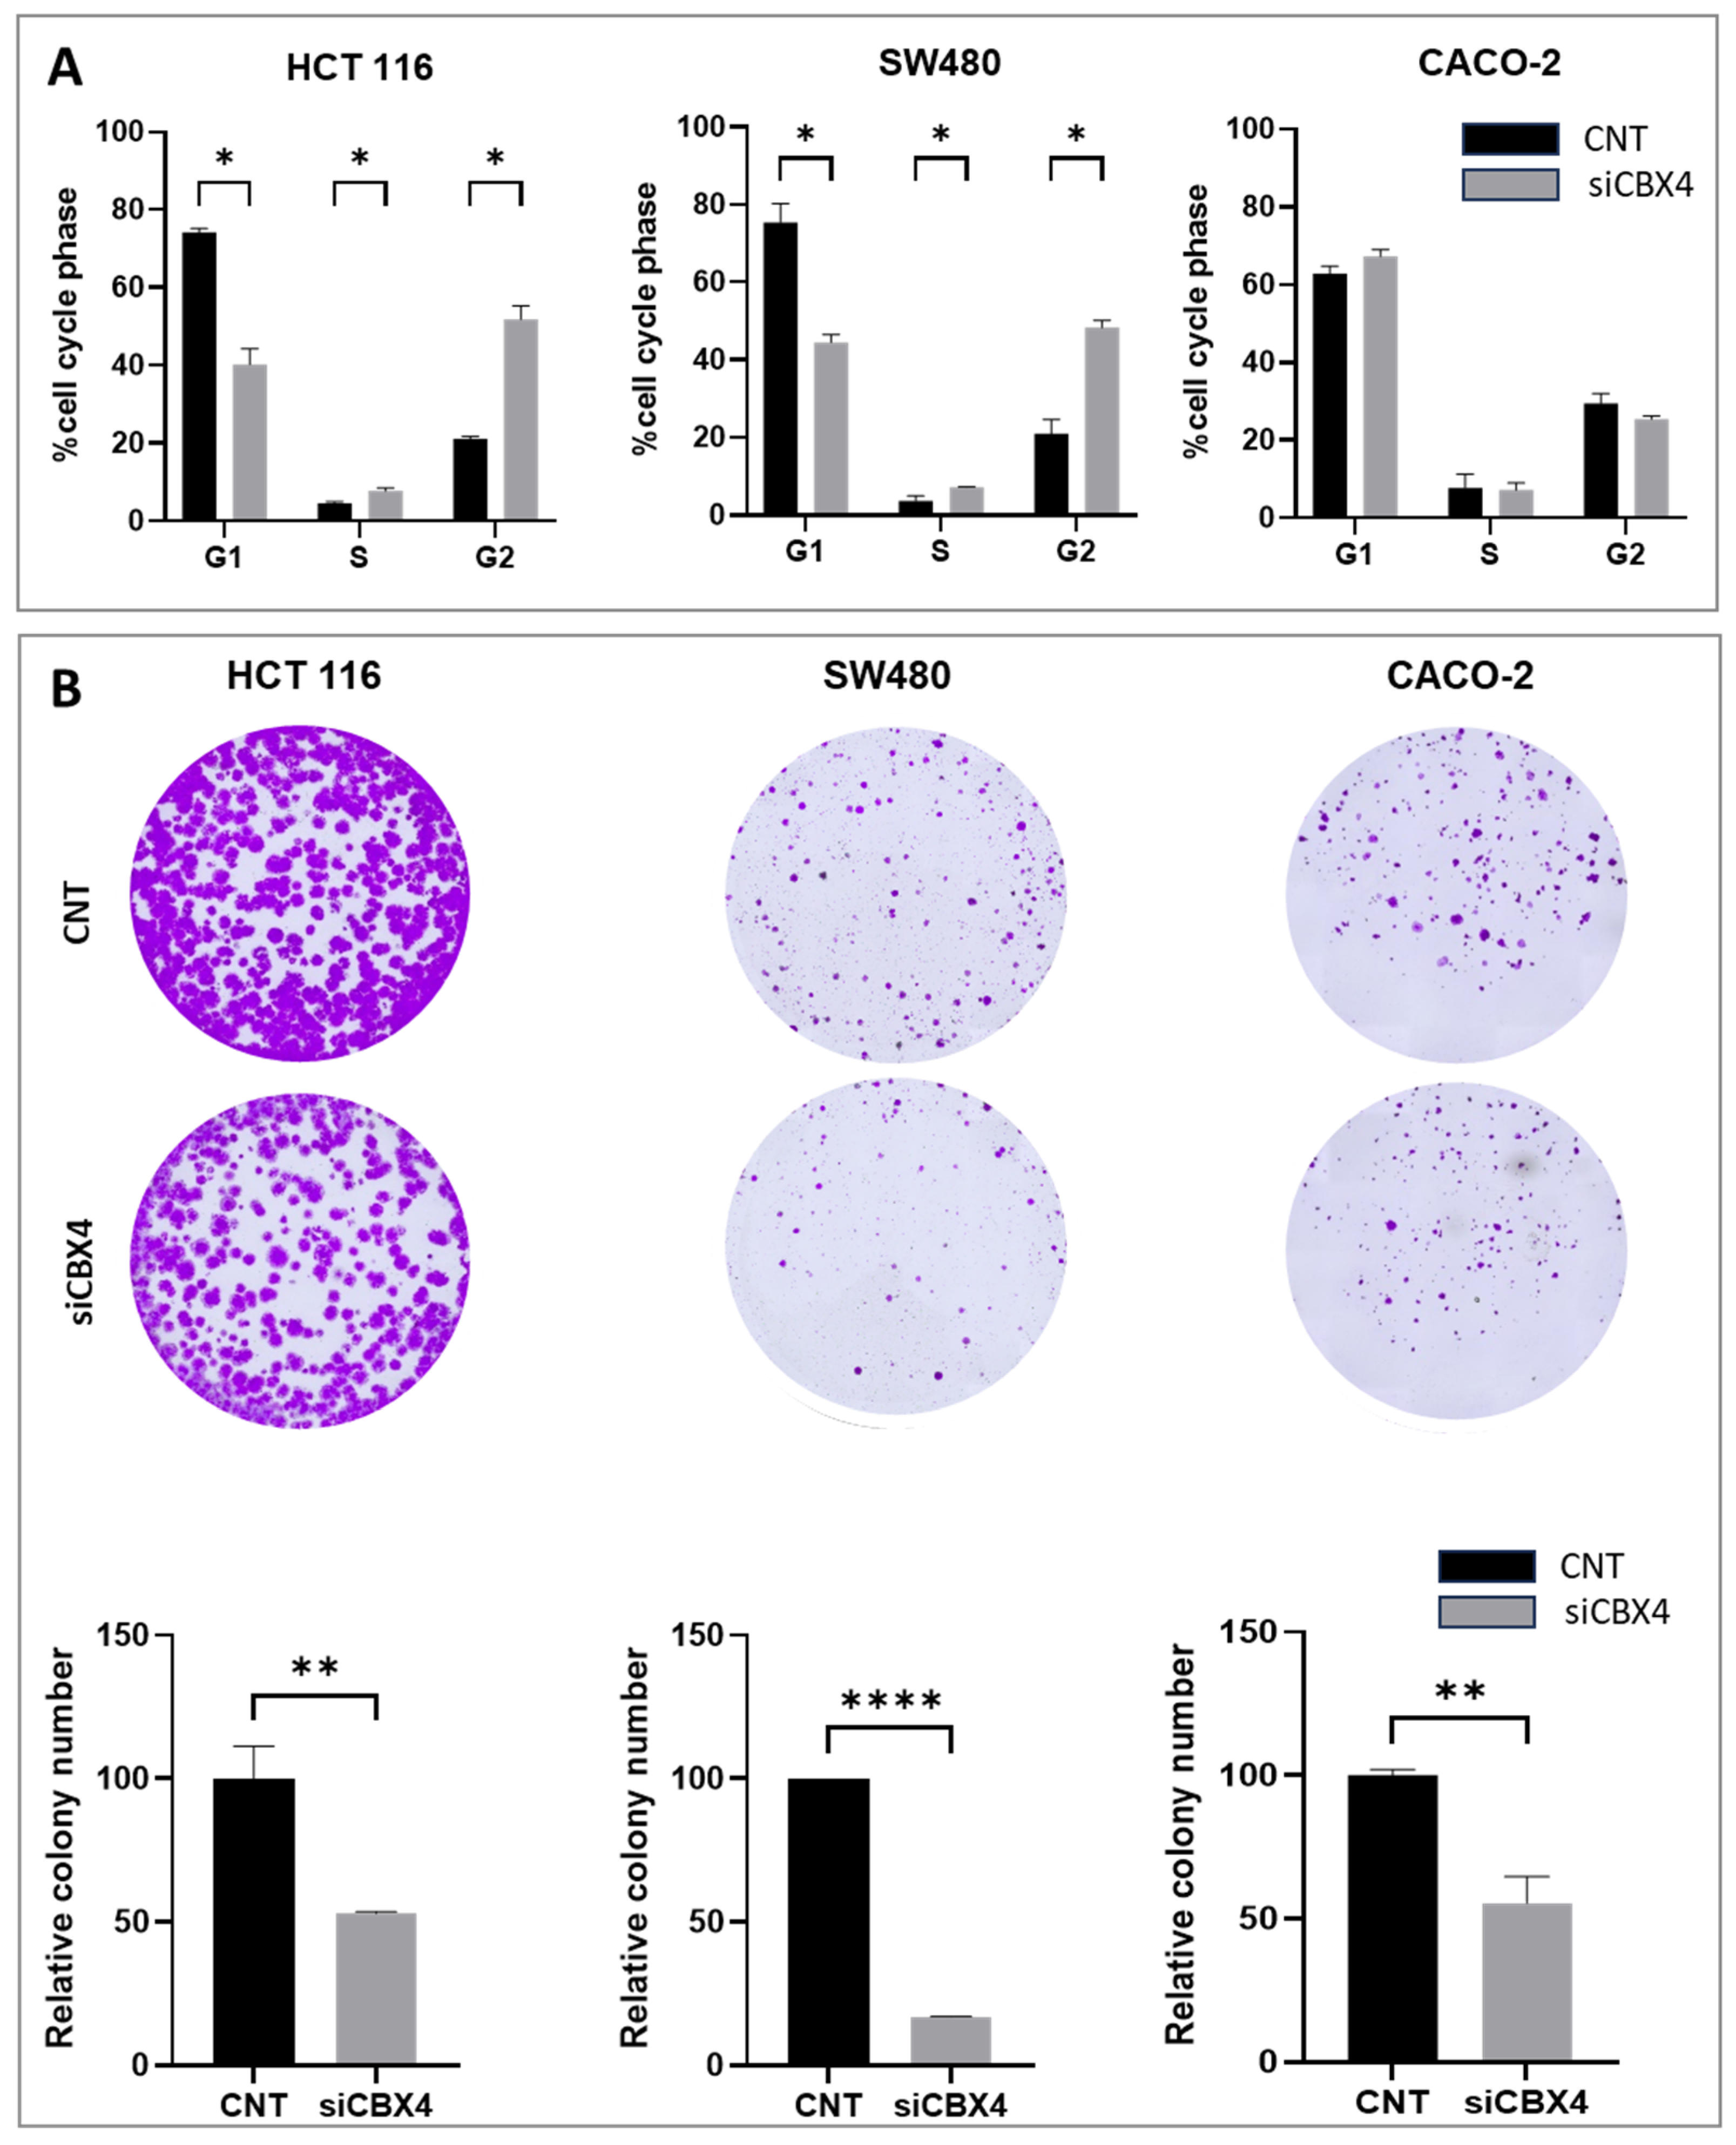
Functional assays following CBX4 knockdown in colon cancer cells demonstrated that its silencing leads to a marked reduction in cell proliferation, induction of G2 cell cycle arrest, and impaired clonogenic potential, underscoring its contribution to tumor cell growth and survival. These results are in line with previous findings in other cancer types, where CBX4 has been implicated in promoting oncogenic behaviors via epigenetic mechanisms. Interestingly, although CBX4 has been reported to act as a tumor suppressor by interacting with histone deacetylase 3 (HDAC3) to inhibit RUNX2 gene expression [
25], our data suggest that CBX4 may also function as an oncogenic driver in a broader cellular context, supporting CRC cell proliferation and tumorigenic capacity. This apparent dual role may reflect a context-dependent function of CBX4, influenced by the specific epigenetic landscape or interaction partners in different cellular environments.
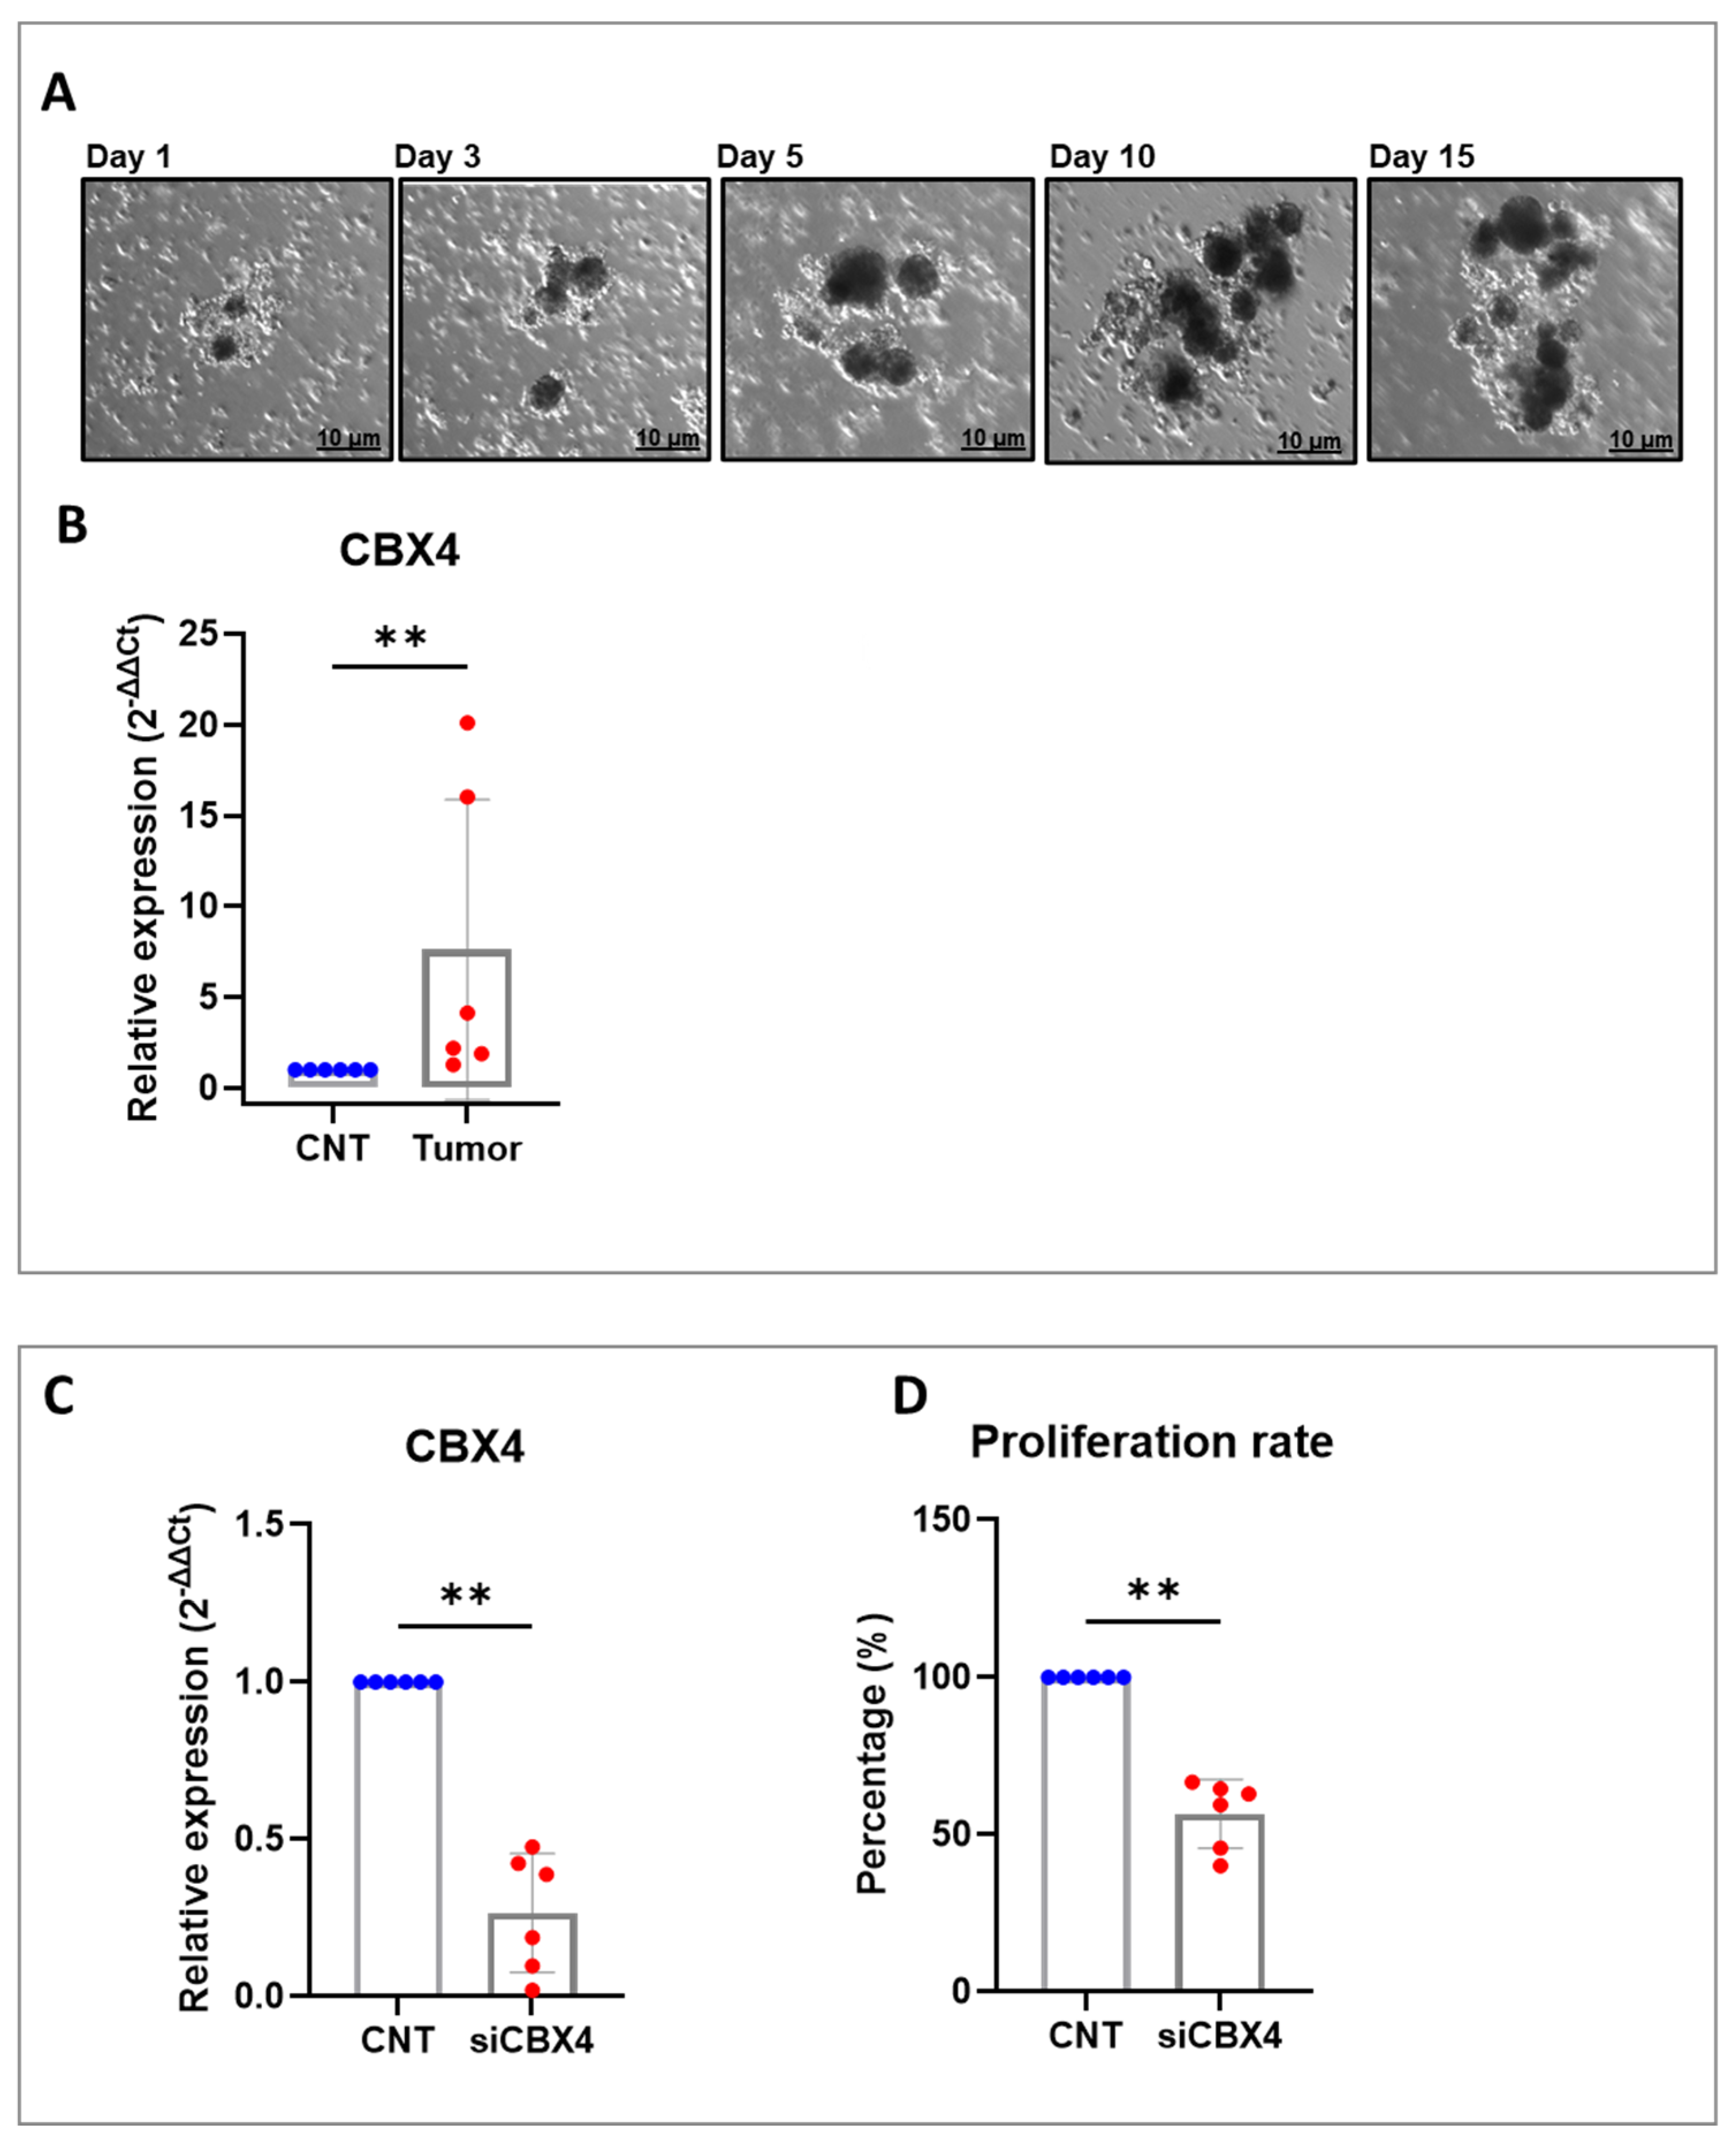
By integrating in vitro assays with ex vivo tumor organoid cultures, we aimed to develop a complementary platform for translational colorectal cancer research. This dual approach enhances our ability to study tumor behavior under controlled conditions while preserving the complex interactions within the native microenvironment. Organoids, derived directly from patient tissues, closely mimic the in vivo clinical setting by retaining the unique genetic, molecular, and cellular characteristics of the original tumor, including its heterogeneity and microenvironmental features. Compared to traditional cell lines, they offer a more physiologically accurate model for investigating disease progression, drug responses, and therapeutic interventions. This patient-specific platform enables diverse applications such as studying tumor-immune interactions, identifying novel molecules involved in immunotherapy response, and predicting clinical outcomes in a reproducible, straightforward, and cost-effective manner. Overall, these 3D patient-derived models are valuable tools for pre-clinical testing, biomarker discovery, and developing personalized therapeutic strategies. Depending on the cell type, NF-κB is most potently activated following engagement with pattern-recognition receptors, receptors for pro-inflammatory cytokines such as TNF-α or IL-1, and antigen receptors [
26]. These cytokines regulate and mediate the crosstalk between tumor cells and tumor-infiltrating immune and inflammatory cells, and they are responsible both for inflammation-driven tumor growth and the inhibition of antitumor immune surveillance. It is important to highlight that, although cytokines in the tumor microenvironment are mainly produced by hematopoietic cells, some of them can also be produced directly by malignant tumor cells to establish an autocrine pro-tumor signaling loop that further enhances NF-κB activation [
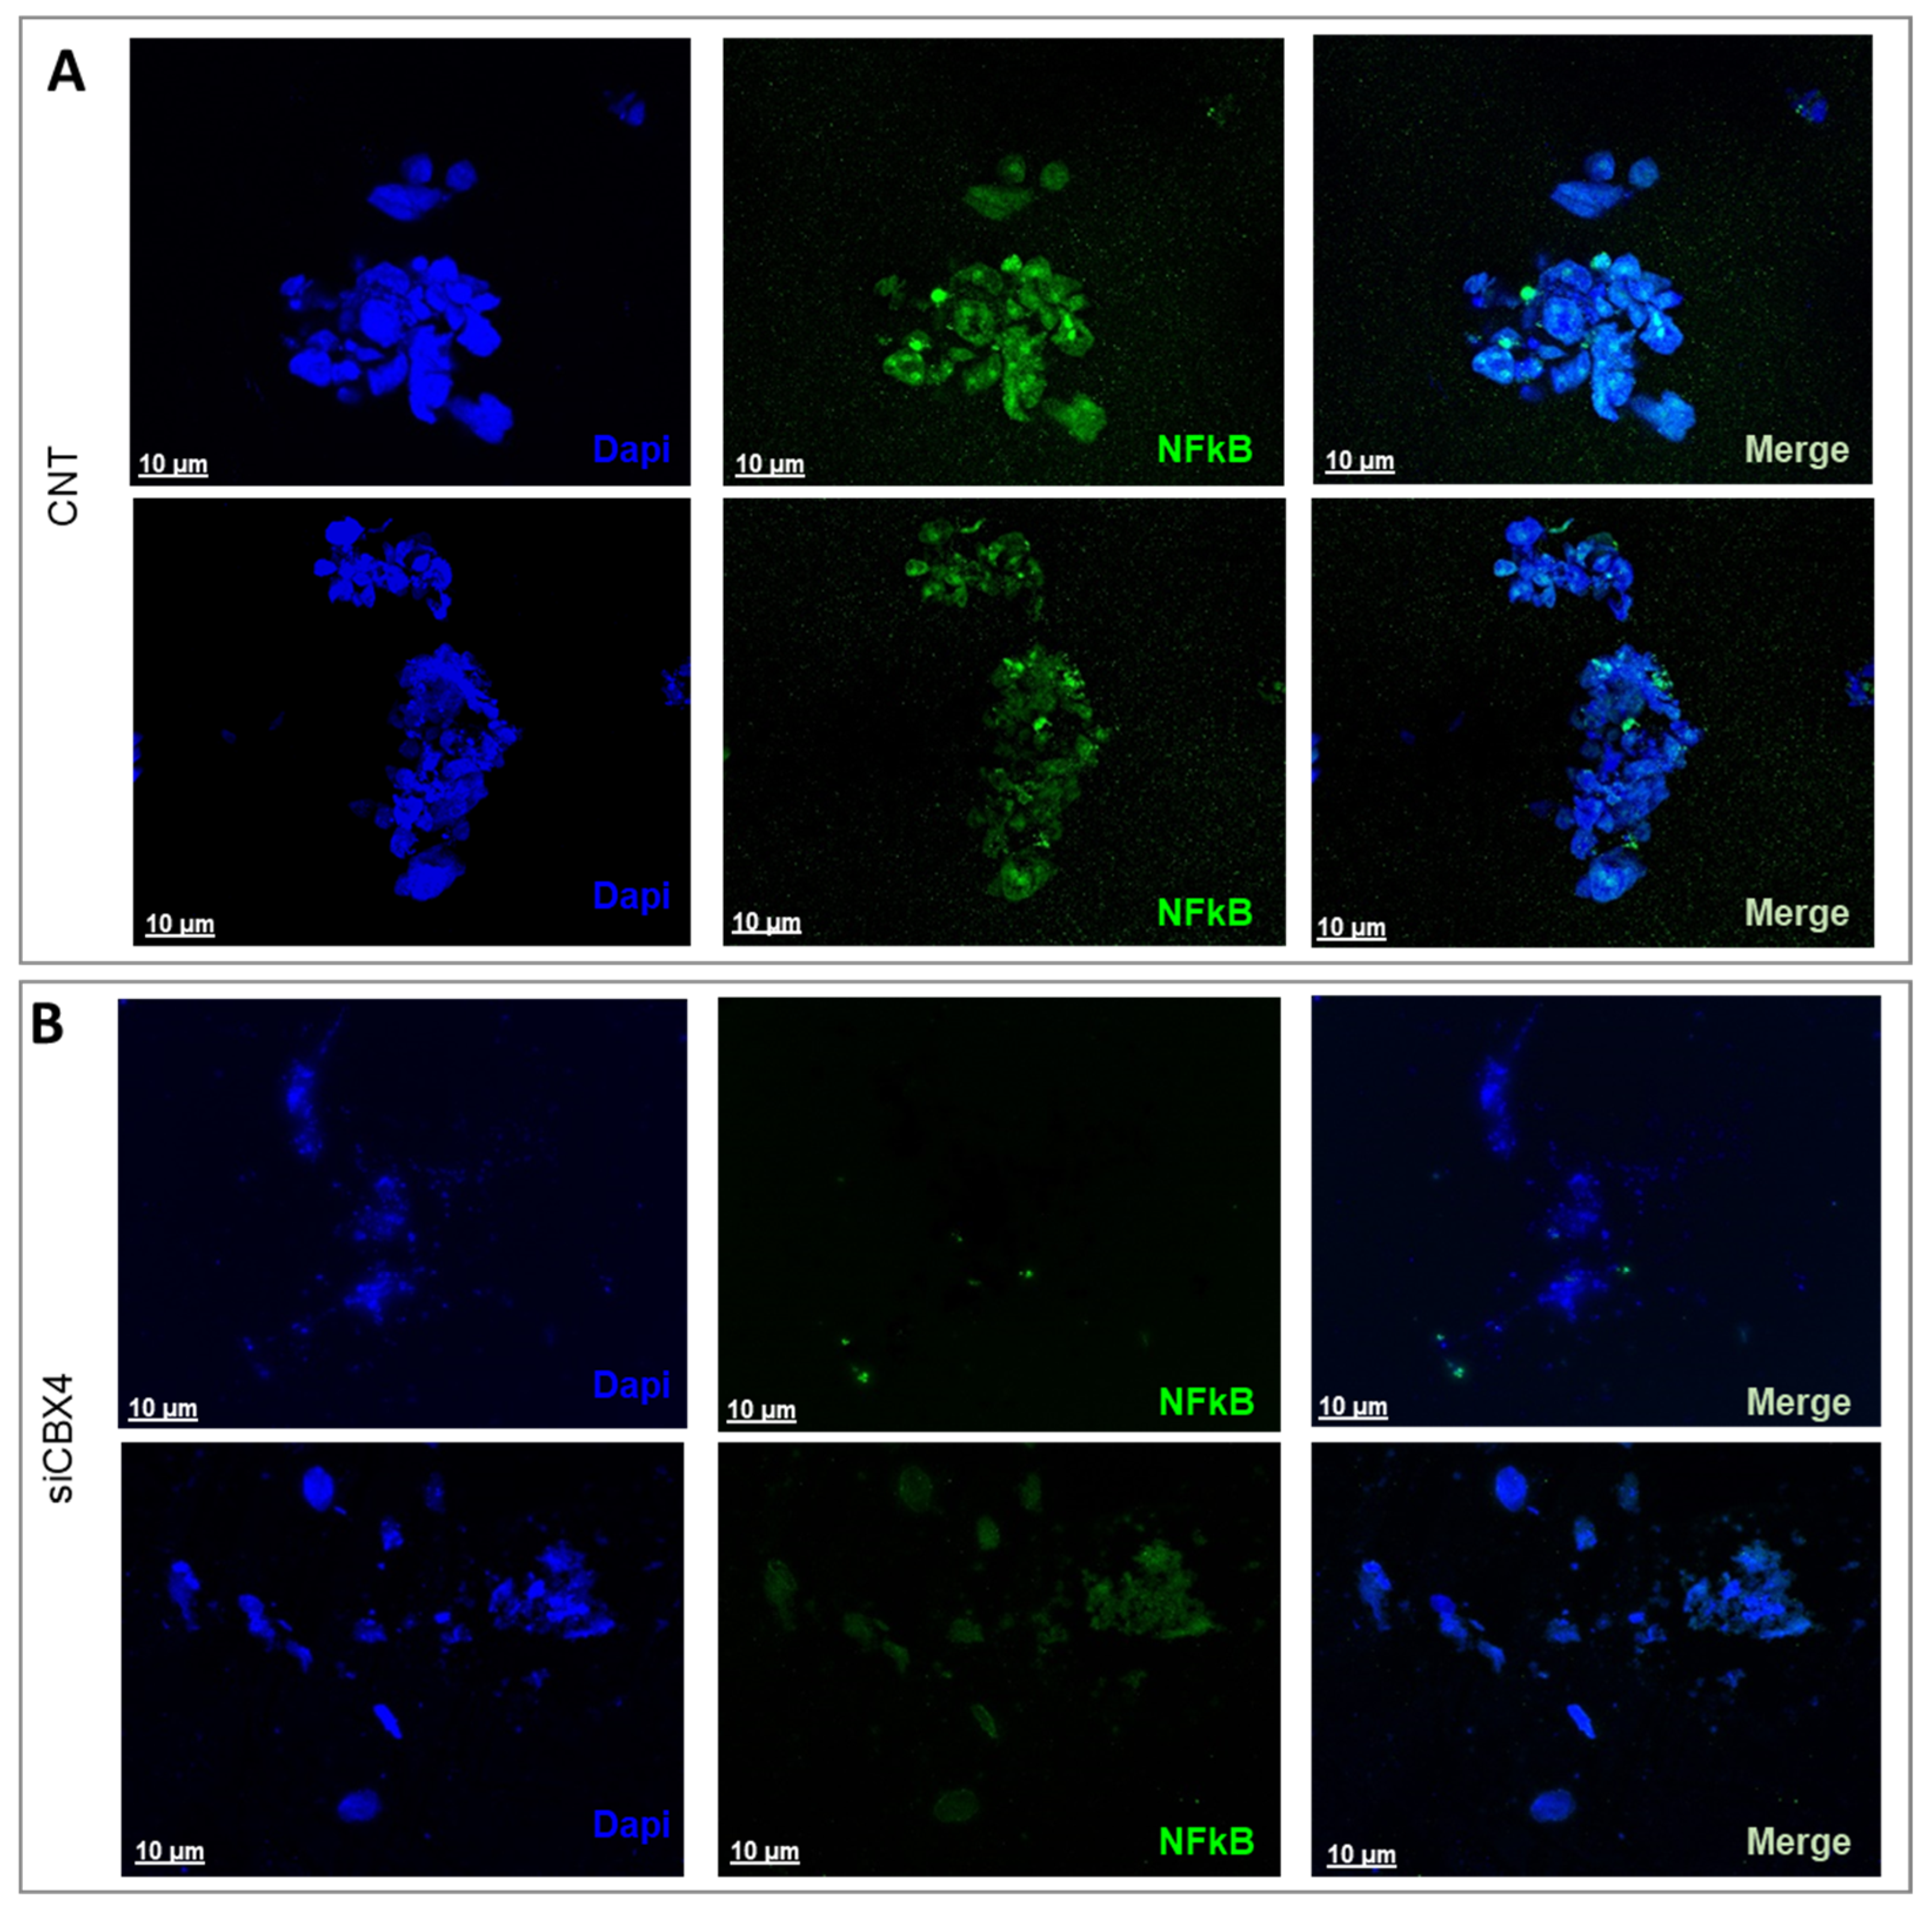
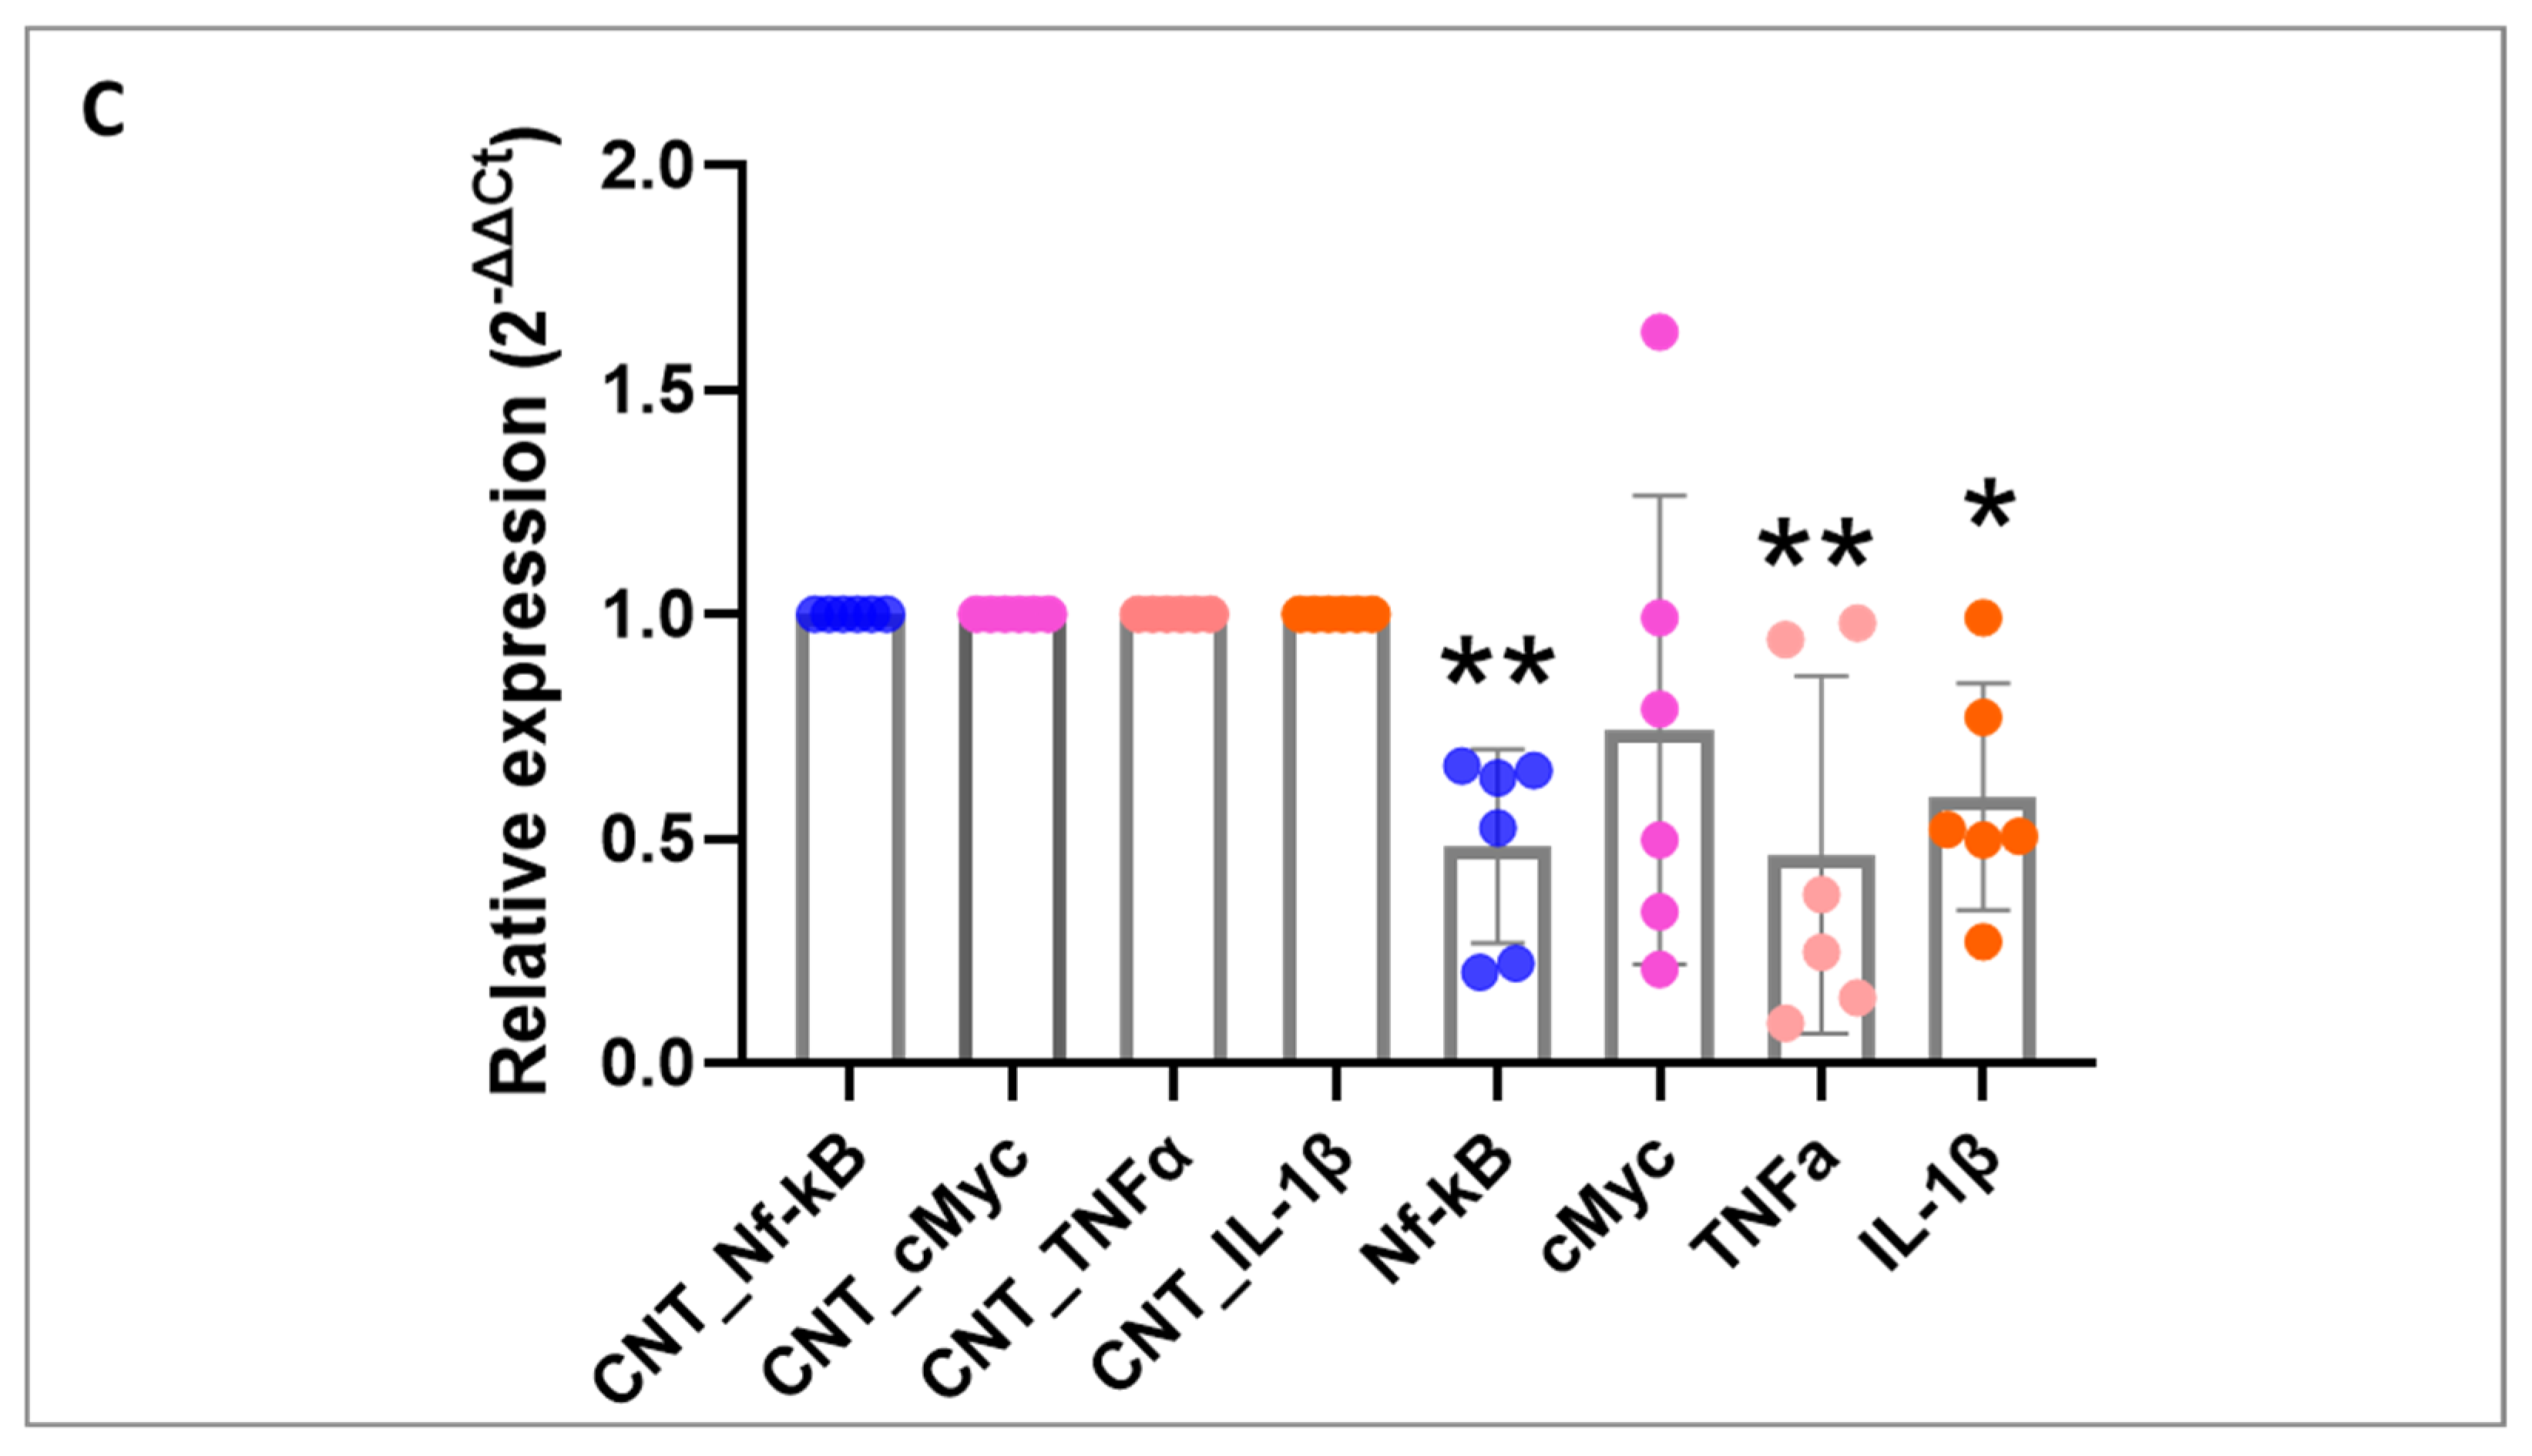
27]. In our study, we demonstrated that silencing CBX4 in patient-derived organoids leads to NF-κB inactivation and a consequent reduction in the expression of molecules involved in this activation, such as TNF-α and IL-1. This finding suggests that CBX4 may regulate the expression of genes involved in cell proliferation and survival, both in premalignant cells and their neoplastic progeny, through the NF-κB signaling circuit, potentially serving as an early disease marker.
Concluding, our findings highlight CBX4 as a key epigenetic regulator in CRC. Its consistent overexpression in cell lines, tumor tissues, and patient-derived organoids, along with its role in promoting proliferation and sustaining NF-κB–mediated inflammatory signaling, suggests a pro-tumorigenic function. siCBX4 impaired CRC cell growth and reduced the expression of key oncogenic and inflammatory markers. These results support CBX4 as a potential therapeutic target and early biomarker in CRC. Further investigations are warranted to dissect the molecular mechanisms underlying CBX4-mediated oncogenic activity in CRC and to determine whether its inhibition could be leveraged therapeutically, either alone or in combination with existing treatment strategies.
Given its central role in repressing tumor suppressor genes and promoting oncogenic pathways, CBX4 represents a promising target for therapeutic intervention in CRC. Its inhibition has been shown to reduce tumor cell proliferation and enhance sensitivity to treatment. Furthermore, the detection of CBX4 overexpression in early tumorigenesis suggests its potential as an early diagnostic biomarker [
28]. Recent evidence also implicates CBX4 in chemotherapy resistance, particularly through the regulation of YAP1 SUMOylation and the suppression of cellular senescence [
29]. Future studies will focus on elucidating CBX4′s role in treatment resistance and its clinical utility as both a therapeutic target and a biomarker to guide personalized treatment strategies.
Future studies may investigate the potential of combining CBX4 inhibitors with immune checkpoint inhibitors as a novel therapeutic strategy. Given CBX4′s role in modulating gene expression, chemoresistance, and possibly immune evasion, its inhibition could enhance the efficacy of immunotherapy by promoting a more immunogenic tumor microenvironment. Specifically, CBX4 blockade may facilitate T cell infiltration and activation, thereby synergizing with checkpoint blockade therapies such as anti-PD-1 or anti-CTLA-4. Preclinical models will be essential to assess the therapeutic benefit, identify predictive biomarkers, and optimize treatment regimens, ultimately paving the way for translational applications in CRC.
4. Materials and Methods
4.1. CBX4 Knockdown Reduces NF-κB Activation in CRC Organoids
The human colon cancer cell lines CACO-2 (DMSZ #ACC 169), HCT 116 (DMSZ #ACC 581), and SW480 (DMSZ #ACC 313), as well as the human normal epithelial cell line NMC 460D (INCELL, San Antonio, TX, USA), were cultured according to the manufacturer’s recommendations. CACO-2 cells were grown in 80% MEM (with Earle’s salts) supplemented with 20% HI-FBS and 1× non-essential amino acids. HCT 116 cells were cultured in 90% McCoy’s 5A medium, supplemented with 10% heat-inactivated (hi) FBS and 2 mM L-glutamine. SW480 cells were grown in 90% RPMI 1640, supplemented with 10% hi-FBS. The NMC 460D cells were grown in DMEM high glucose with 10% hi-FBS and 2 mM L-glutamine. The cells were seeded at approximately 1 × 10⁶ cells/80 cm2, split when the culture reached confluence, every 3–4 days using trypsin/EDTA. The cells were maintained at 37 °C in a humidified chamber at 5% CO2. Cell stocks were prepared by cryopreserving cells in a solution of 90% FBS and 10% dimethyl sulfoxide (DMSO; Sigma-Aldrich, Merck, Darmstadt, Germany) and stored either at −80 °C for up to 30 days or in liquid nitrogen for long-term preservation.
4.2. Transfection of Small Interfering RNA (siRNA)
CBX4 siRNA and negative control siRNA were purchased from Qiagen (GS8535—FlexiTube GeneSolution GS8535, Hilden, Germany) to silence CBX4 expression in colon cancer cells and PDOs. It is worth noting that the siRNA sequence used for transfection was siCBX4_s5, because this sequence has previously been shown to provide the most effective silencing results. The cells and PDOs were seeded into six-well plates at 2.0 × 10⁵ cells per well. On the following day, CBX4 siRNA (siCBX4) or siRNA control (siSCR) was transfected into cells using Lipofectamine RNAimax (Thermo Fisher Scientific, Waltham, MA, USA, 13778100) according to the manufacturer’s instructions. Briefly, for each well of a 6-well plate, 30 pmol of siRNA was diluted in 150 μL of Opti-MEM without serum. Separately, 9 μL of Lipofectamine RNAiMAX was diluted in an additional 150 μL of Opti-MEM. The two solutions were mixed gently and incubated at room temperature for 10 min to allow complex formation. Then, 250 uL of resulting siRNA–Lipofectamine™ complexes was added to each well containing 1000 μL of complete growth medium and adherent cells at ~70–80% confluency. Cells were incubated at 37 °C with 5% CO2 for 48 to 72 h prior to subsequent analysis. Knockdown efficiency was confirmed by quantitative polymerase chain reaction (RT-qPCR) and Western blotting.
4.3. RNA Isolation and qRT-PCR
Total RNA was isolated from cells and PDOs using TRIzol reagent (Cat: # 15596026, Invitrogen, Carlsbad, CA, USA), followed by phase separation with chloroform and RNA precipitation with isopropanol. The RNA pellet was washed with 70% ethanol, air-dried, and resuspended in RNase-free water. RNA yield and purity were assessed using a NanoDrop spectrophotometer (Thermo Fisher). For cDNA synthesis, 1 µg of total RNA was reverse-transcribed using the SensiFAST cDNA synthesis kit (BIO-65053, Meridian Bioscience, Memphis, TN, USA), following the manufacturer’s instructions. Quantitative real-time PCR (RT-qPCR) was then performed to assess gene expression levels, and amplification was conducted using SYBR Green PCR Master Mix (Applied Biosystems by Life Technologies, Monza, Italy). The thermal cycling protocol included an initial step at 50 °C for 2 min, and denaturation at 95 °C for 10 min, followed by 40 amplification cycles of 95 °C for 15 s and 60 °C for 1 min. Reactions were set up in 20 µL volumes and run in duplicate using the QuantStudio 7 Flex Real-Time PCR System (Applied Biosystems). Relative gene expression was normalized to GADPH for cells and to 18S ribosomal RNA subunit for organoids as the endogenous control, and data were analyzed using the 2
−ΔΔCt method. Primer sequences are listed in
Table S1. Samples from human colon carcinoma patients were obtained from commercial arrays (TissueScan™ cDNA arrays, HCRT304, OriGene, Rockville, MD, USA). Human TissueScan Colon Cancer Tissue qPCR Panel IV (HCRT304), containing first-strand cDNA from 48 samples covering 8-normal, 5-Stage I, 8-IIA, 1-II, 1-IIIA, 6-IIIB, 3-IIIC, 6-III, and 10-IV patients, was purchased from Origene (Rockville, MD, USA). Nine identical plates were used to determine the expressions of CBX1-8 and β-Actin (housekeeping gene). RT-qPCR was used to determine the condition. Data were expressed as mean fold-change using the comparative 2
−ΔΔCq method (compared to non-malignant control tissue).
4.4. Protein Extraction and Western Blot Analysis
Cells were washed twice in ice-cold PBS and lysed in JS buffer (50 mmol/L HEPES (pH 7.5) containing 150 mmol/L NaCl, 1% glycerol, 1% Triton X100, 1.5 mmol/L MgCl2, 5 mmol/L EGTA, 1 mmol/L Na3VO4, and 1× protease inhibitor cocktail). Protein concentration was determined by Bradford assay (Bio-Rad, Hercules, CA, USA), and equal amounts of proteins were analyzed by SDS-PAGE (TGX Stain-Free Precast Gels (8/16%), Biorad, Hercules, CA, USA). Gels were electroblotted onto polyvinylidene difluoride membranes (Millipore). For immunoblot experiments, membranes were blocked for 1 h with 5% nonfat dry milk in TBS containing 0.1% Tween 20 and incubated at 4 °C overnight with primary antibody: anti-CBX4 (1:1000; # mAb #30559, Cell Signaling Technology, Danvers, MA, USA) and anti-vinculin (1:2000; Cat: # V9264, Sigma-Aldrich). After washing with Tris-buffered saline with 0.1% Tween-20, blots were incubated with the appropriate secondary antibodies for 1 h at room temperature and developed using ECL detection reagent.
4.5. Cell Viability Assay
An ATP-based luminescence assay (ATP Lite 1-step Luminescence Assay System, Revvity) was performed to quantitatively assess cell proliferation and cytotoxicity in cultured cells. Briefly, cells and PDOs were seeded into white-walled 96-well plates and treated according to the experimental protocol. On the day of analysis, the culture medium was aspirated, and luminescence detection reagent was added directly to each well to induce cell lysis. The plates were then incubated at room temperature for 10 min to ensure complete lysis and stabilization of the luminescent signal. Luminescence was measured using a Victor Nivo Multimode Microplate Reader (PerkinElmer, Waltham, MA, USA) at a detection wavelength of 560 nm. Signal intensities were normalized to internal controls, and results were expressed in relative luminescence units to evaluate cell viability and proliferative capacity.
4.6. Colony Formation Assay
Forty-eight hours after the transfection, 5 × 10³ CACO-2 cells/well, 3 × 10³ SW480 cells/well, or 2 × 10³ HCT116 cells/well were seeded in six-well plates. The medium was changed every 3 days. Cells cultured for 15 days were washed twice with ice-cold medium, fixed by in 10% paraformaldehyde, and stained with crystal violet for 15 min (Sigma-Aldrich, Germany). Image acquisition was performed using a Leica microscope (Mica, Leica Microsystems, Wetzlar, Germany).
4.7. Patient Sample and 3D Organoid Generation
Apoptotic cells were identified using the Annexin V-FITC/AAD Kit (Beckman–Colter). The PBS-washed cells were resuspended in ice-cold 1X Binding Buffer and incubated with Annexin V-FITC and 7-amino-actinomycin D (7-AAD) on ice for 15 min in the dark, according to the manufacturer’s instructions. All samples were analyzed within 30 min by flow cytometry (Cytoflex V2-B4-R2—Beckman Colter, Brea, CA, USA). Twenty thousand events were acquired per sample. The COULTER DNA (Beckman–Coulter) Prep kit was used to assess the cell cycle of human colon cancer cells. The DNA PREP LPR reagent was used to permeabilize the cells, and DNA staining solution containing propidium iodide (PI) was used to stain DNA content. After PI staining, the quantification of the cell-cycle distribution was carried out by flow cytometry. Cell-cycle analysis was performed using the J.V. Watson algorithm. All data were analyzed using Kaluza analysis software (Beckman–Colter, CA, USA)
https://www.beckman.com/flow-cytometry/software/kaluza, accessed on 1 July 2025.
4.8. Patient Sample and 3D Organoid Generation
To derive ex vivo 3D organoid cultures from colon cancer patient samples, we adopted a previously published protocol [
30,
31].
Based on the Declaration of Helsinki [
32], all human samples were taken only after each patient and healthy donor provided written informed consent. All the procedures listed below were carried out in compliance with the applicable rules and laws. The study was approved by the Ethics Committee of IRCCS Pascale (Naples, Italy) with reference number 40/11 approved on 16 November 2011. Briefly, all fresh tumor tissue samples were kept on ice and processed in sterile conditions on the day of collection. Tissue fragments were digested in PDOs medium containing Hyaluronidase (Sigma-Aldrich) and Collagenase (Sigma-Aldrich) onto a 37 °C shaker at low to moderate speed (e.g., 200 rpm) for an incubation time between 12 and 18 h. Next, cells were filtered and separated with serial centrifugation. Finally, for 3D culture aggregation, cells were centrifuged, resuspended in PDO medium, and seeded in plates (Corning, New York, NY, USA). After 48 h, PDOs were visible in the cell culture plates.
4.9. Immunofluorescence
To characterize NF-κB expression in both tumor-derived and non-cancerous ex vivo PDOs, the organoids were incubated with a primary antibody targeting NF-κB (catalog No. 3865015; Sony Biotechnology, Inc.) at a 1:100 dilution for 1 h at room temperature. This was followed by incubation with a PE-conjugated secondary antibody (catalog No. 3D6C02; Biolegend Inc., San Diego, CA, USA) at a 1:200 dilution for 1 h at RT, protected from light. After antibody staining, the samples underwent three washing steps, were counterstained with DAPI (Sigma-Aldrich) for 5 min, and were rinsed again with PBS. Image acquisition was performed using a Leica confocal microscope (Mica, Leica Microsystems, Wetzlar, Germany), and visualization was achieved by applying the maximum intensity projection algorithm.
4.10. In Silico Investigation
UALCAN is a comprehensive, user-friendly, and interactive web resource for analyzing cancer OMICS data [
33]. It is built to provide easy access to publicly available cancer OMICS data (accessed on 23 February 2024). We used it to provide graphs and plots depicting CBX1-8 expression profiles between normal and colon cancer tissues and according to cancer stage. The statistical significance is estimated by Student’s
t-test and setting
p-value < 0.05.
4.11. Statistical Analysis
Statistical analysis was conducted on both biological (N) and technical replicates (n). All data presented herein represent mean ± standard deviation (SD). Comparisons between controls and treated groups were performed using non-parametric statistical tests (Mann–Whitney U or Wilcoxon signed-rank tests and Kruskal–Wallis one-way ANOVA). All data were analyzed using Prism software 10.2.3 (Graph pad, Inc.). Differences were considered statistically significant for p-values below 0.05.


 ,
, 