2.1. γ-Radiolysis and Product Analysis at pH 4
Ionizing radiation of neutral water leads to the primary reactive species e
−aq, HO
•, and H
• together with H
+ and H
2O
2 as shown in Reaction 1. The values in brackets represent the radiation-chemical yield (
G) in µmol J
−1 [
25]. In N
2O-saturated solution (~0.02 M of N
2O), e
−aq are efficiently transformed into HO
• radicals via Reaction 2 (
k = 9.1 × 10
9 M
−1 s
−1) [
26], affording
G(HO
•) = 0.56 µmol J
−1. Therefore, HO
• and H
• account for 90% and 10% of the reactive species, respectively.
We recently reported on LC-MS and high-resolution MS/MS analysis of products generated in neutral (pH 7), N
2O-saturated, 1 mM aqueous solutions of 1 or 2 upon exposure to 800 Gy of stationary gamma irradiation at a dose rate of 46.7 Gy/min. Herein, we report the analogous experiments performed at pH 4, followed by the same analytical approach. Representative HPLC runs of irradiated samples are shown in the
Supporting Material (
Figures S1 and S2 for compound
1 and
Figures S3 and S4 for compound
2).
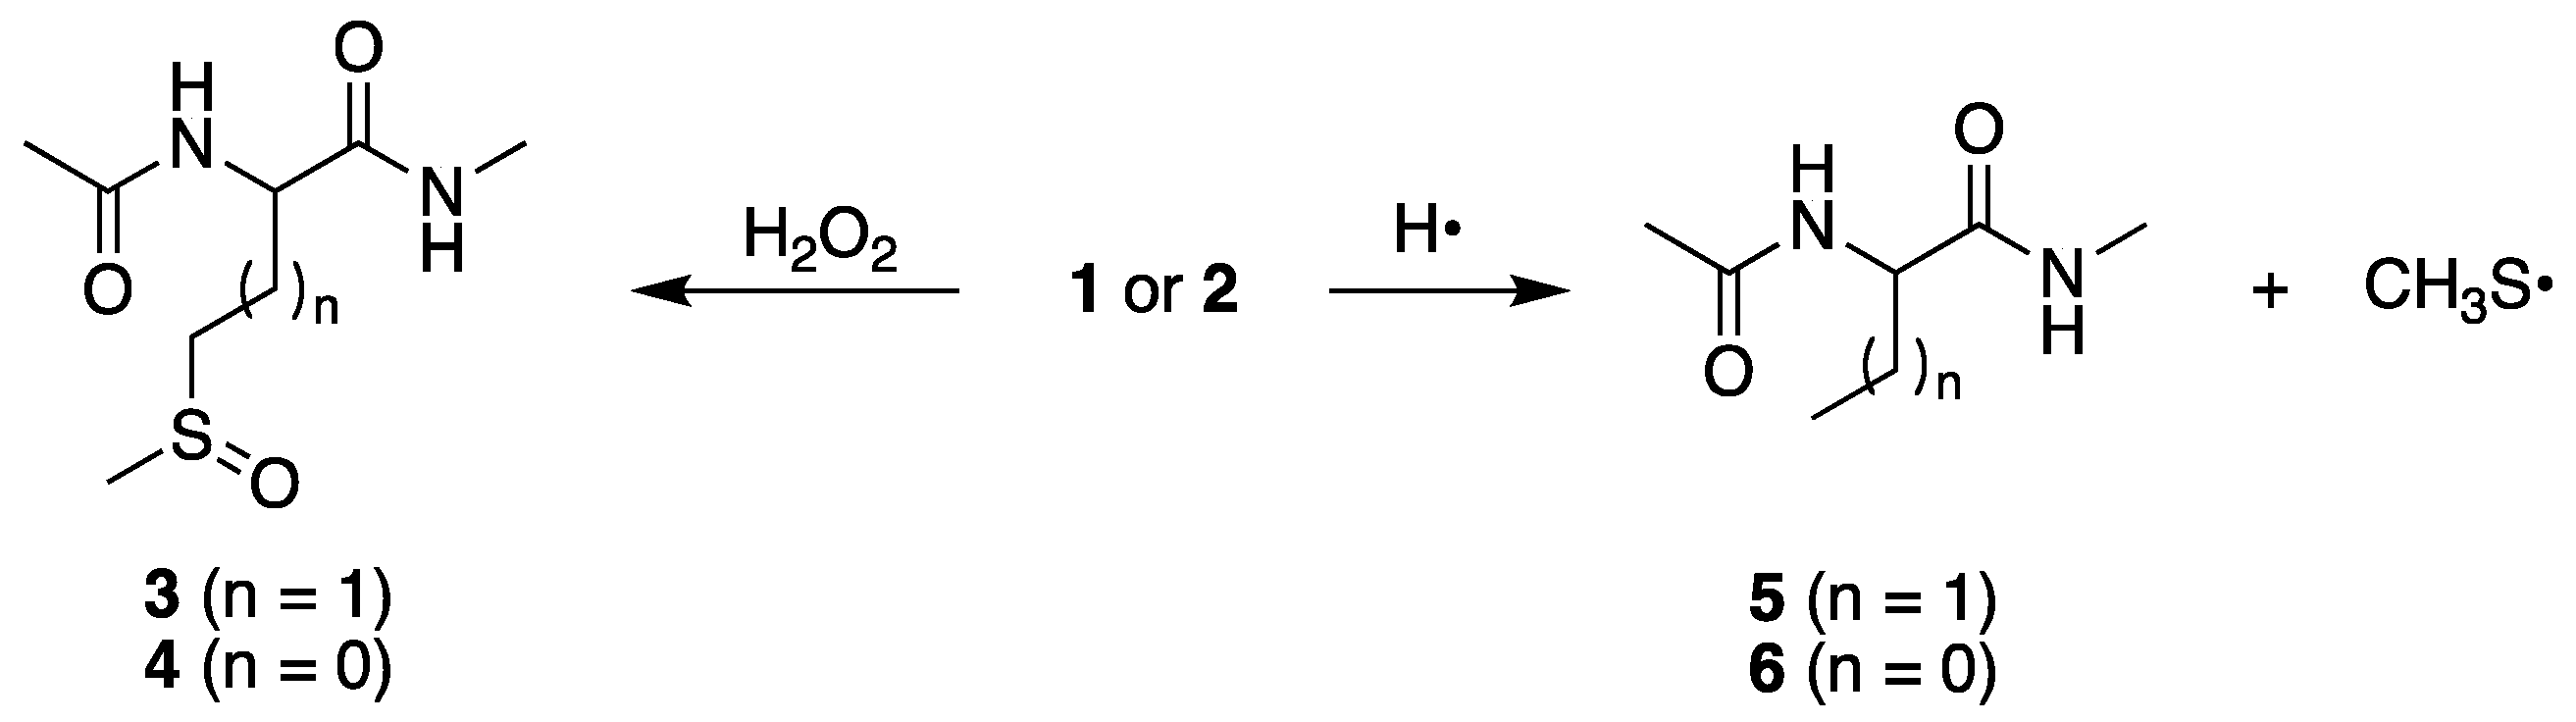
At pH 7, we reported for compound
1 the formation of sulfoxide
3 and α-aminobutyric derivative
5 in the ratio
3/
5 = 4.09, and for S-methyl-cysteine derivative
2 the formation of sulfoxide
4 and alanine derivative
6 in the ratio
4/
6 = 19.28 (
Figure 2) [
23,
24]. These products are also formed at pH 4 in similar ratios,
3/
5 = 3.82 and
4/
6 = 26.59, as expected. It is worth underlining that these reactions are not detectable in the pulse-radiolysis study (
vide infra), therefore their existence is based on the final product identifications. The desulfurization process, with the formation of the methyl thiyl radical (CH
3S
•) depicted in
Figure 2, is fundamental because some of the products are derived from the combination of CH
3S
• with carbon-centered radicals [
27,
28].
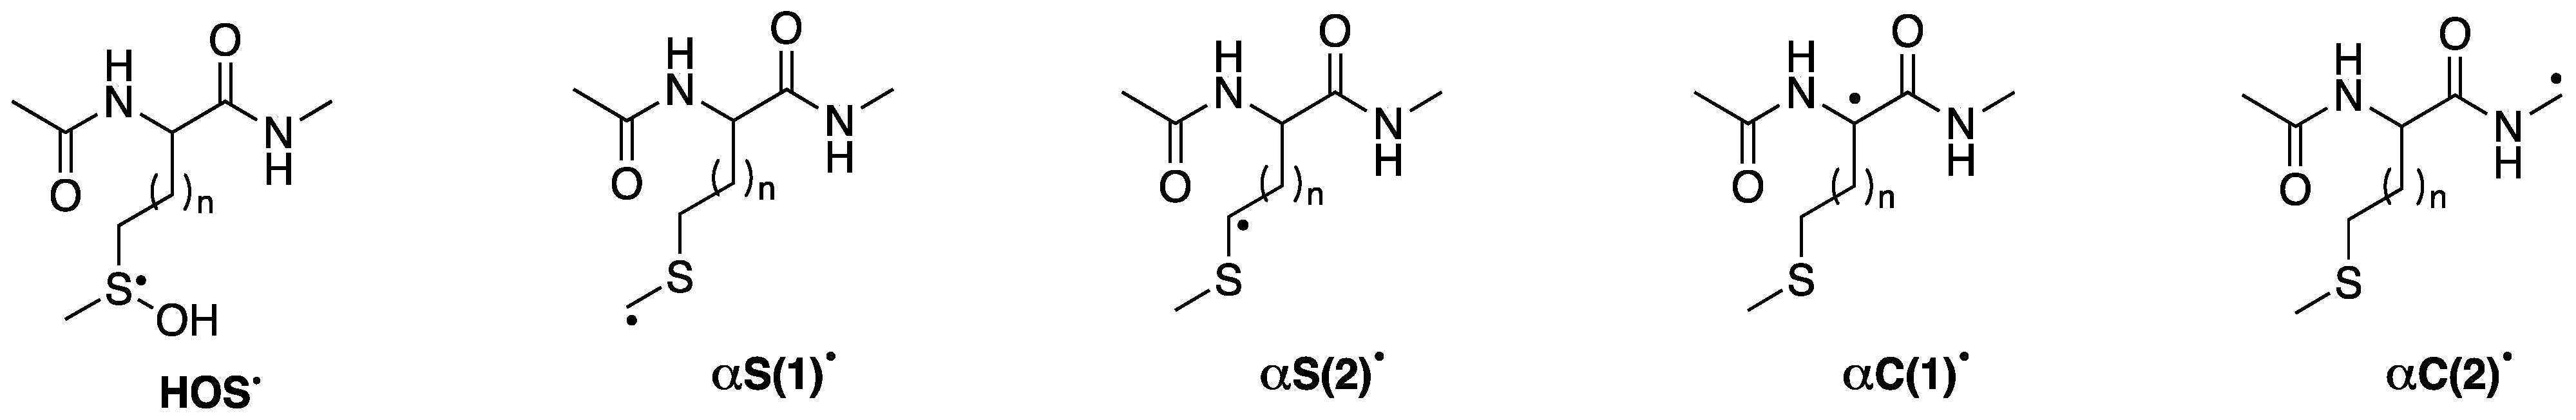
The reaction of HO
• with compound
1 or
2 follows several paths, the main one being the formation of sulfuranyl adduct
HOS• (
vide Figure 3), which is at the crossroads of various reaction pathways affording a variety of carbon-centered radicals. Previously [
24], we found that CH
3S
• couples with the four different carbon-centered radicals to give the corresponding sulfides, and we suggested that the CH
3S
• adducts serve like a footprint of the relative concentration of the four distinct carbon-centered radicals (
Figure 3).
Table 1 lists the precursor radicals and product formations for both starting materials at pH 4. Indeed, CH
3S
• reacts with
αS(1)•,
αS(2)•,
αC(1)•, and
αC(2)• for compound
1 and with
αS(1)•,
αS(2)•, and
αC(2)• for compound
2 (
Figure 3). For the methionine derivative
1, the relative concentrations of
αS(2)•,
αS(1)•,
αC(1)•, and
αC(2)• are 12.2/8.6/0.6/1.0, whereas at pH 7 they were reported as 15.4/9.4/1.4/1.0 [
24]. The
αS• radicals were the most abundant, being at least one order of magnitude higher than
αC• at both pHs. The amount of
αC(2)• radical increases from pH 7 to pH 4, whereas all the others decrease. In particular, the relative concentrations of two
αC• radicals change considerably,
αC(1)• predominating at pH 7 and
αC(2)• predominating at pH 4. The main source of
αS• being the α-deprotonation of radical cation at sulfur, it is expected for α
S(2)• radical to be found at a higher concentration than α
S(1)• and in line with the higher stability of secondary vs. primary alkyl radical due to favorable deprotonation from the precursor sulfide radical cation. The relative percentage of the two
αS• radicals changes slightly going from pH 7 to 4, as the ratio
αS(2)•/
αS(1)• decreases from 1.64 to 1.42, respectively.
For S-methyl-cysteine derivative
2, CH
3S
• couples with the carbon-centered radicals
αS(1)•,
αS(2)•, and
αC(2)• to produce the corresponding sulfides. The relative concentrations of
αS(2)•,
αS(1)•, and
αC(2)• are 54.3/1.0/16.6 (
Table 1), whereas at pH 7 they were reported as 72.2/1.0/2.3 [
24]. The amount of
αC(2)• radical increases going from pH 7 to 4, whereas
αS(2)• decreases. The relative percentages of the two
αS• radicals change slightly going from pH 7 to 4, as the ratio
αS(2)•/
αS(1)• decreases from 72.2 to 54.3, respectively. Moreover, the ratio
αS•/
αC(2)• decreases substantially going from 31.8 at pH 7 to 3.3 at pH 4, suggesting that the acidic conditions favor the formation of
αC(2)• radical.
At pH 4, the high-resolution MS/MS spectra data showed fourteen dimeric compounds obtained from the radiolytic study of starting material
1 (
Table S1). The accurate masses of these products (
m/
z 407.1781) correspond to a molecular weight MH
+ equivalent to the coupling of the two carbon-centered radicals (
αS• and/or
αC•). In comparison, sixteen dimeric compounds with
m/
z 407.1781 have been obtained at pH 7 [
24]. At pH 4, the high-resolution MS/MS spectra data showed five dimeric compounds derived from the radiolytic study of starting material
2 (
Table S2). The accurate masses of these products (
m/
z 379.1468) correspond to a molecular weight MH
+ equivalent to the coupling of the two carbon-centered radicals (
αS• and/or
αC(2)•). In comparison, at pH 7, eight dimeric compounds having masses of
m/
z 379.1468 are observed [
24]. The large majority of these dimeric peaks from compounds
1 and
2 at pH 4 and 7 can be assigned to the same products. These observations align well with the relative concentrations of carbon-centered radicals, which vary at different pHs as discussed in the previous paragraph.
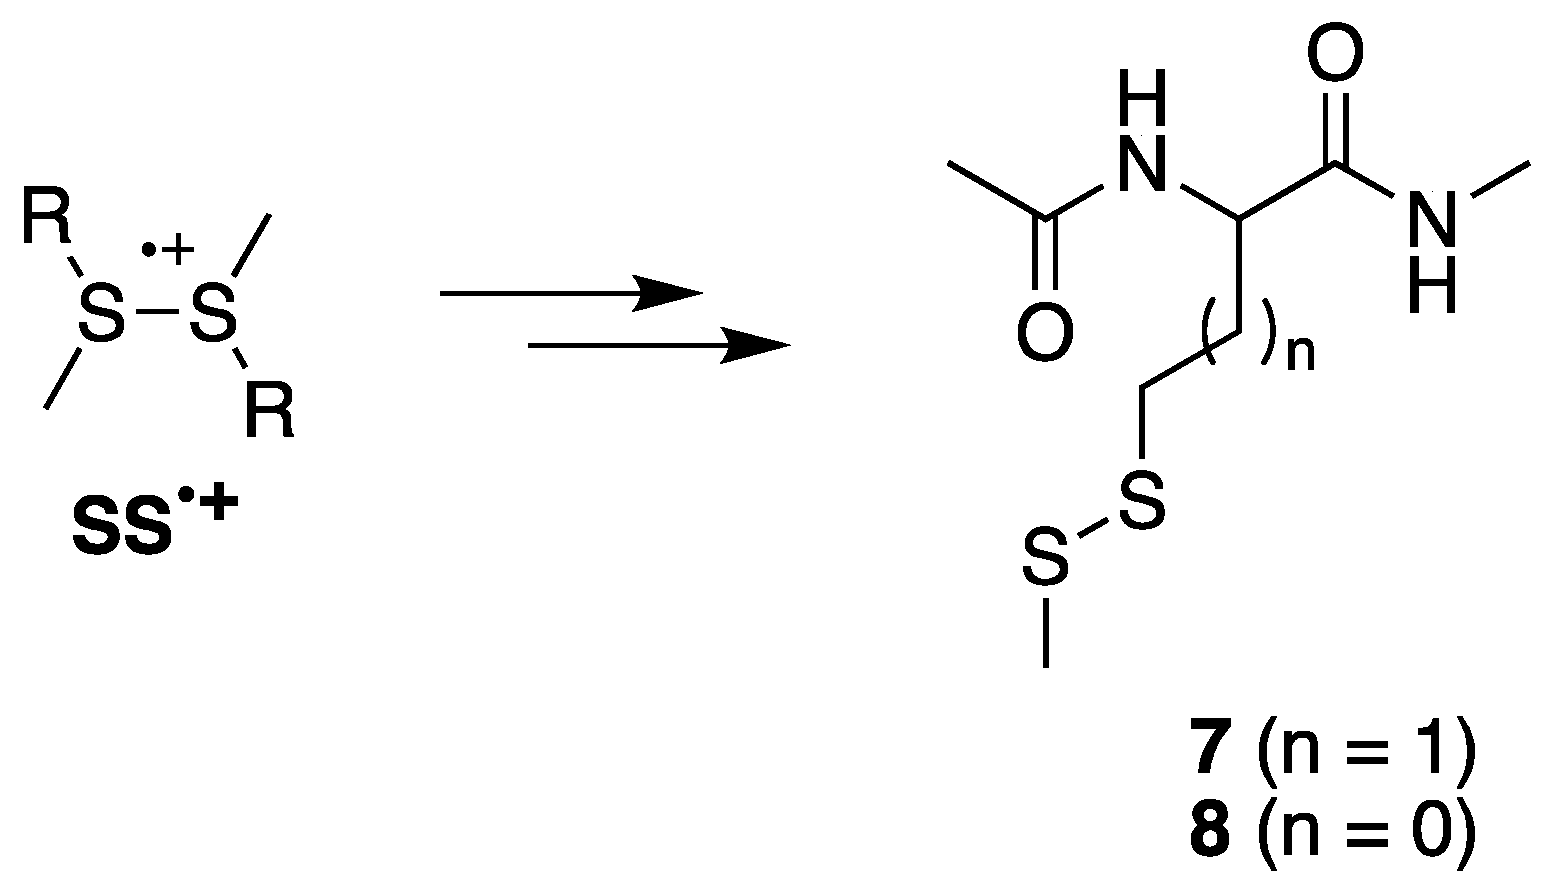
The asymmetric disulfides
7 or
8 are also relevant products derived from the reaction of HO
• with compound
1 or
2, respectively. The sulfide radical cation (
S•+) and the starting material (
S) form an equilibrium with the disulfide radical cation (
SS•+). Fragmentation of
SS•+ affords the observed asymmetric disulfides (
Figure 4). The ratios
5/
7 = 1.28 and
6/
8 = 0.41 at pH 4, in comparison with the ratios
5/
7 = 0.67 and
6/
8 = 0.19 at pH 7, indicate a substantial decrease of
7 and
8 in a more acidic environment.
2.2. Pulse Radiolysis in Acidic Environment with Time-Resolved UV–Vis Spectrophotometry and Conductivity
Pulse radiolysis is the most appropriate technique to study the mechanism of reaction of HO
• with sulfur-containing organic compounds [
19]. The mechanism of the HO
•-induced oxidation of sulfur-containing amino acids is based on the addition of the electrophilic HO
• radical to the sulfur atom (
Figure 5). This was summarized for methionine and its derivatives in a recent review [
20], which shows that this reaction is controlled by the diffusion of the reactants and is independent of pH. The second primary reaction, i.e., hydrogen atom transfer (HAT) occurring by HO
• radical, is the minor path (<10%) (
Figure 5) [
29].
The reaction of HO
• with compounds
1 and
2 (0.2 mM concentration) in N
2O-saturated aqueous solutions at pH 4 was studied using pulse radiolysis with the optical absorption detection in a similar way as for neutral solutions (pH 7) [
24]. In the current paper, complementary to the optical absorption studies, experiments were conducted using time-resolved conductivity as the detection method [
30]. It has been reported in a number of pulse radiolysis studies of simple methionine derivatives and their peptides, that time-resolved conductivity detection can help untangle mechanistic nuances encountered in the analysis of spectral and kinetic changes in optical absorption when multiple transients are formed in the similar spectral range. Their formation can either proceed via the formation of the monomeric sulfur radical cation or by separated coupled electron–proton transfer reactions [
31,
32,
33,
34].
Transient absorption spectra in the range 250–700 nm recorded during pulse radiolysis of
1 at pH 4 for time delays in the range 0.6–100 µs are presented in
Figure S5A,B. Taking into account known transient spectra of predicted intermediates [
24] (
Figure S6), one can directly observe from
Figure S5A,B the formation and decay of the intermolecular
SS•+ (at 490 nm) and
αS• (at 290 nm) intermediates for
1. The obtained transient spectra for various delay times can be analyzed more quantitatively. They can be resolved for a contribution of particular components using the spectral resolution procedure identical to that described previously [
22,
23,
24,
29,
33]. The results of such a procedure for
1 showing concentration profiles of the most expected intermediates formed in the reaction of HO
• with
1 (0.2 mM) are presented in
Figure 6A and
Figure S7 for pH 4 in N
2O-saturated aqueous solutions, i.e.,
HOS•,
αS•,
SS•+,
SN•,
αC(1)•, and
αC(2)• or
HOS•,
αS•,
SS•+,
SO•+,
αC(1)•, and
αC(2)•, respectively.
As can be seen from
Figure 6A and
Figure S7, two main intermediates,
αS• and
SS•+, were formed upon the decay of the
HOS• adduct, irrespective of whether
SN• or
SO•+ (
Figure 7) was included in the resolution, yet with a clear dominance of the former.
It is important to note that the comparison of radiation-chemical yields of
SS•+ calculated directly from the absorption changes at λ = 490 nm (
vide Figure S5A,B) with those obtained from the spectral resolutions (
vide Figure 6A) agrees very well (
vide Figure S8). There is only a small mismatch in the time region < 10 μs where
SN• and/or
SO•+ have only a negligible contribution due to their lower radiation-chemical yields (
vide Figure 6A and
Figure S8), respectively, and much lower molar absorption coefficients at λ = 490 nm (ε
490) as compared to
SS•+ (
vide Figure S6).
Unfortunately, the application of pulse radiolysis with spectral detection, without taking into account results from the conductivity experiments (as it was presented in [
24] at pH 7), did not allow to differentiate between
SO•+ and
SN• transients, since the replacement of
SN• by
SO•+ in spectral resolutions can still yield similar results (
vide Figure 6A and
Figure S7 for comparison). At pH 7, applying the pulse radiolysis technique with conductivity detection was impossible because the neutralization reaction (
vide infra) would take too long to reach the base conductivity level after the electron pulse. The application of this technique in an acidic environment could provide additional information on the kinetics and yields of transient ionic species formed during the reaction of HO
• with
1 in aqueous solutions. This is based on the fact that the formation of
SS•+ and
SO•+ proceeds via the formation of the monomeric sulfur radical cation
S•+, and its formation is related to the consumption of protons, reflected in a net decrease in conductivity at acidic conditions. On the other hand, the formation of
SN• proceeds via separated coupled electron–proton transfer reactions involving
HOS• [
33]. The HO
− generated in the inner-sphere ET, accompanied by
S•+ formation, would require large solvent reorganization to accommodate two oppositely charged species replacing a neutral
HOS•, as ET precursor. The hydration of the hydroxide anion, whose hydration energy is one of the largest among all anions, would cause the most significant entropic penalty. Therefore, HO
− would rather become neutralized in the concerted reaction by the proton released from the neighboring N atom of the amide moiety. This would result in the formation of
S•+ and
>N−, oppositely charged molecular fragments separated by the -OH moiety of a freshly formed water molecule. Upon the attraction of two oppositely charged fragments, the water molecule becomes squeezed out, and a new hemibonded
SN• transient is formed, showing an apparent transient absorption signal but no evident net change in conductivity [
33]. The results of these studies at pH 4 are shown in
Figure 6B–D.
After electron pulse in N
2O-saturated acidic solution (pH = 4) containing 0.2 mM of
1, an instantaneous growth of the equivalent conductivity was observed followed by its fast decrease below the conductivity level recorded before the pulse, reaching the minimum at 2 μs after the pulse and followed by its slow increase for the next 100 microseconds (
Figure 6B). The initial transient conductivity spike is a result of a net increase in conductivity due to the production of conducting species of water radiolysis (hydrated electrons (e
−aq) and protons (H
+)). In N
2O-saturated aqueous solutions, e
−aq is quickly converted into HO
• radicals, with the side product of HO
− anions being released as well within just a few nanoseconds after the electron pulse. Therefore, the fast decrease in conductivity is recorded within less than 1 μs after the pulse, through a stoichiometric neutralization reaction (H
+ + HO
− → H
2O) with (1.1–1.2) × 10
11 M
−1 s
−1 [
35,
36], involving highly conducting HO
− and H
+ ions. This was confirmed by the observation of the relaxation of ionic conductivity in pulse-irradiated N
2O-saturated pure water at pH 4 (
vide Figure S9). Upon completion of this reaction, the conductivity level further decreases, since HO
− anions formed in reaction leading to the monomeric sulfur radical cations (
S•+) removes H
+, and consequently, highly conducting protons (H
+) (Λ = 350 S cm
2) are replaced by weakly conducting sulfur radical cations (
SS•+) and/or (
SO•+) (Λ = 45 S cm
2) (
vide Figure 6B). Thus, the overall loss of equivalent conductivity can be calculated as ΔΛ
0 = −305 S cm
2. The conductivity data not only provide kinetic data but also allow for an estimation of the radiation-chemical yields of
S•+ and, consequently, the radiation-chemical yields of
SS•+ and/or
SO•+. The radiation-chemical yields of ions (
G(ions)) can be calculated from the experimental changes in equivalent conductivity at given times (
G × ΔΛ) (
vide Figure 6B). Dividing these values by ΔΛ
0 = −305 S cm
2 gave
G(ions) at given times presented in
Figure 6C,D. A comparison of the radiation-chemical yields of
SS•+ and the sum of
SS•+ + SO•+ obtained from the resolution of absorption spectra and
G(ions) is presented in
Figure 6C and D, respectively.
At this point, it is important to note that neither the inclusion of
SN• while leaving out
SO•+, nor inclusion of
SO•+, while leaving out
SN• in spectral resolutions, gives
G(
SS•+) or the sum of
G(
SS•+ +
SO•+), respectively, that matches
G(ions) as determined by conductivity measurements. In the first case, the significant discrepancy between
G(ions) = 0.27(5) μmol J
−1 and
G(
SS•+) = 0.12(5) μmol J
−1 occurs at 2 μs after the pulse (
vide inset in
Figure 6C). In the second case, this discrepancy is less pronounced:
G(ions) = 0.27(5) μmol J
−1 vs. the sum of
G(
SS•+ +
SO•+) = 0.20 μmol J
−1 (
vide inset in
Figure 6D). Therefore, the only possible intermediate responsible for the observed loss of conductivity (higher than would result from the radiation-chemical yields of
SS•+ and
SO•+ obtained from the resolution of absorption spectra) is
S•+, which was not included in the spectral resolutions. Furthermore, the rapid increase in equivalent conductivity in the range of 2 to 10 microseconds can be explained by its deprotonation leading to the
αS• (
vide inset in
Figure 6B).
Another important issue is to make a conclusive decision on which of the
SN• and
SO•+ transients is responsible for the absorption band located in the range of 390–400 nm. The results obtained from the time-resolved conductivity would indicate the involvement of
SO•+ rather than
SN•; however, they are not clearly convincing. This raises another question: is there a process by which these two transient species can be ultimately distinguished? Based on the known sulfur radical chemistry derived from research on the oxidation of peptides containing methionine and S-methylcysteine [
33,
37], the decay mechanisms of
SO•+ and
SN• should allow them to be distinguished. The mechanism of
SN• decay, related to the ring opening, involves protons leading, inter alia, to
S•+. In turn, the mechanism of
SO•+ decay, related to the ring opening, involves only a dynamic equilibrium between
SO•+ and
S•+, without participation of protons, followed by
S•+ deprotonation. In other words, the rate of
SN• decay, unlike the rate of
SO•+ decay, should be pH-dependent.
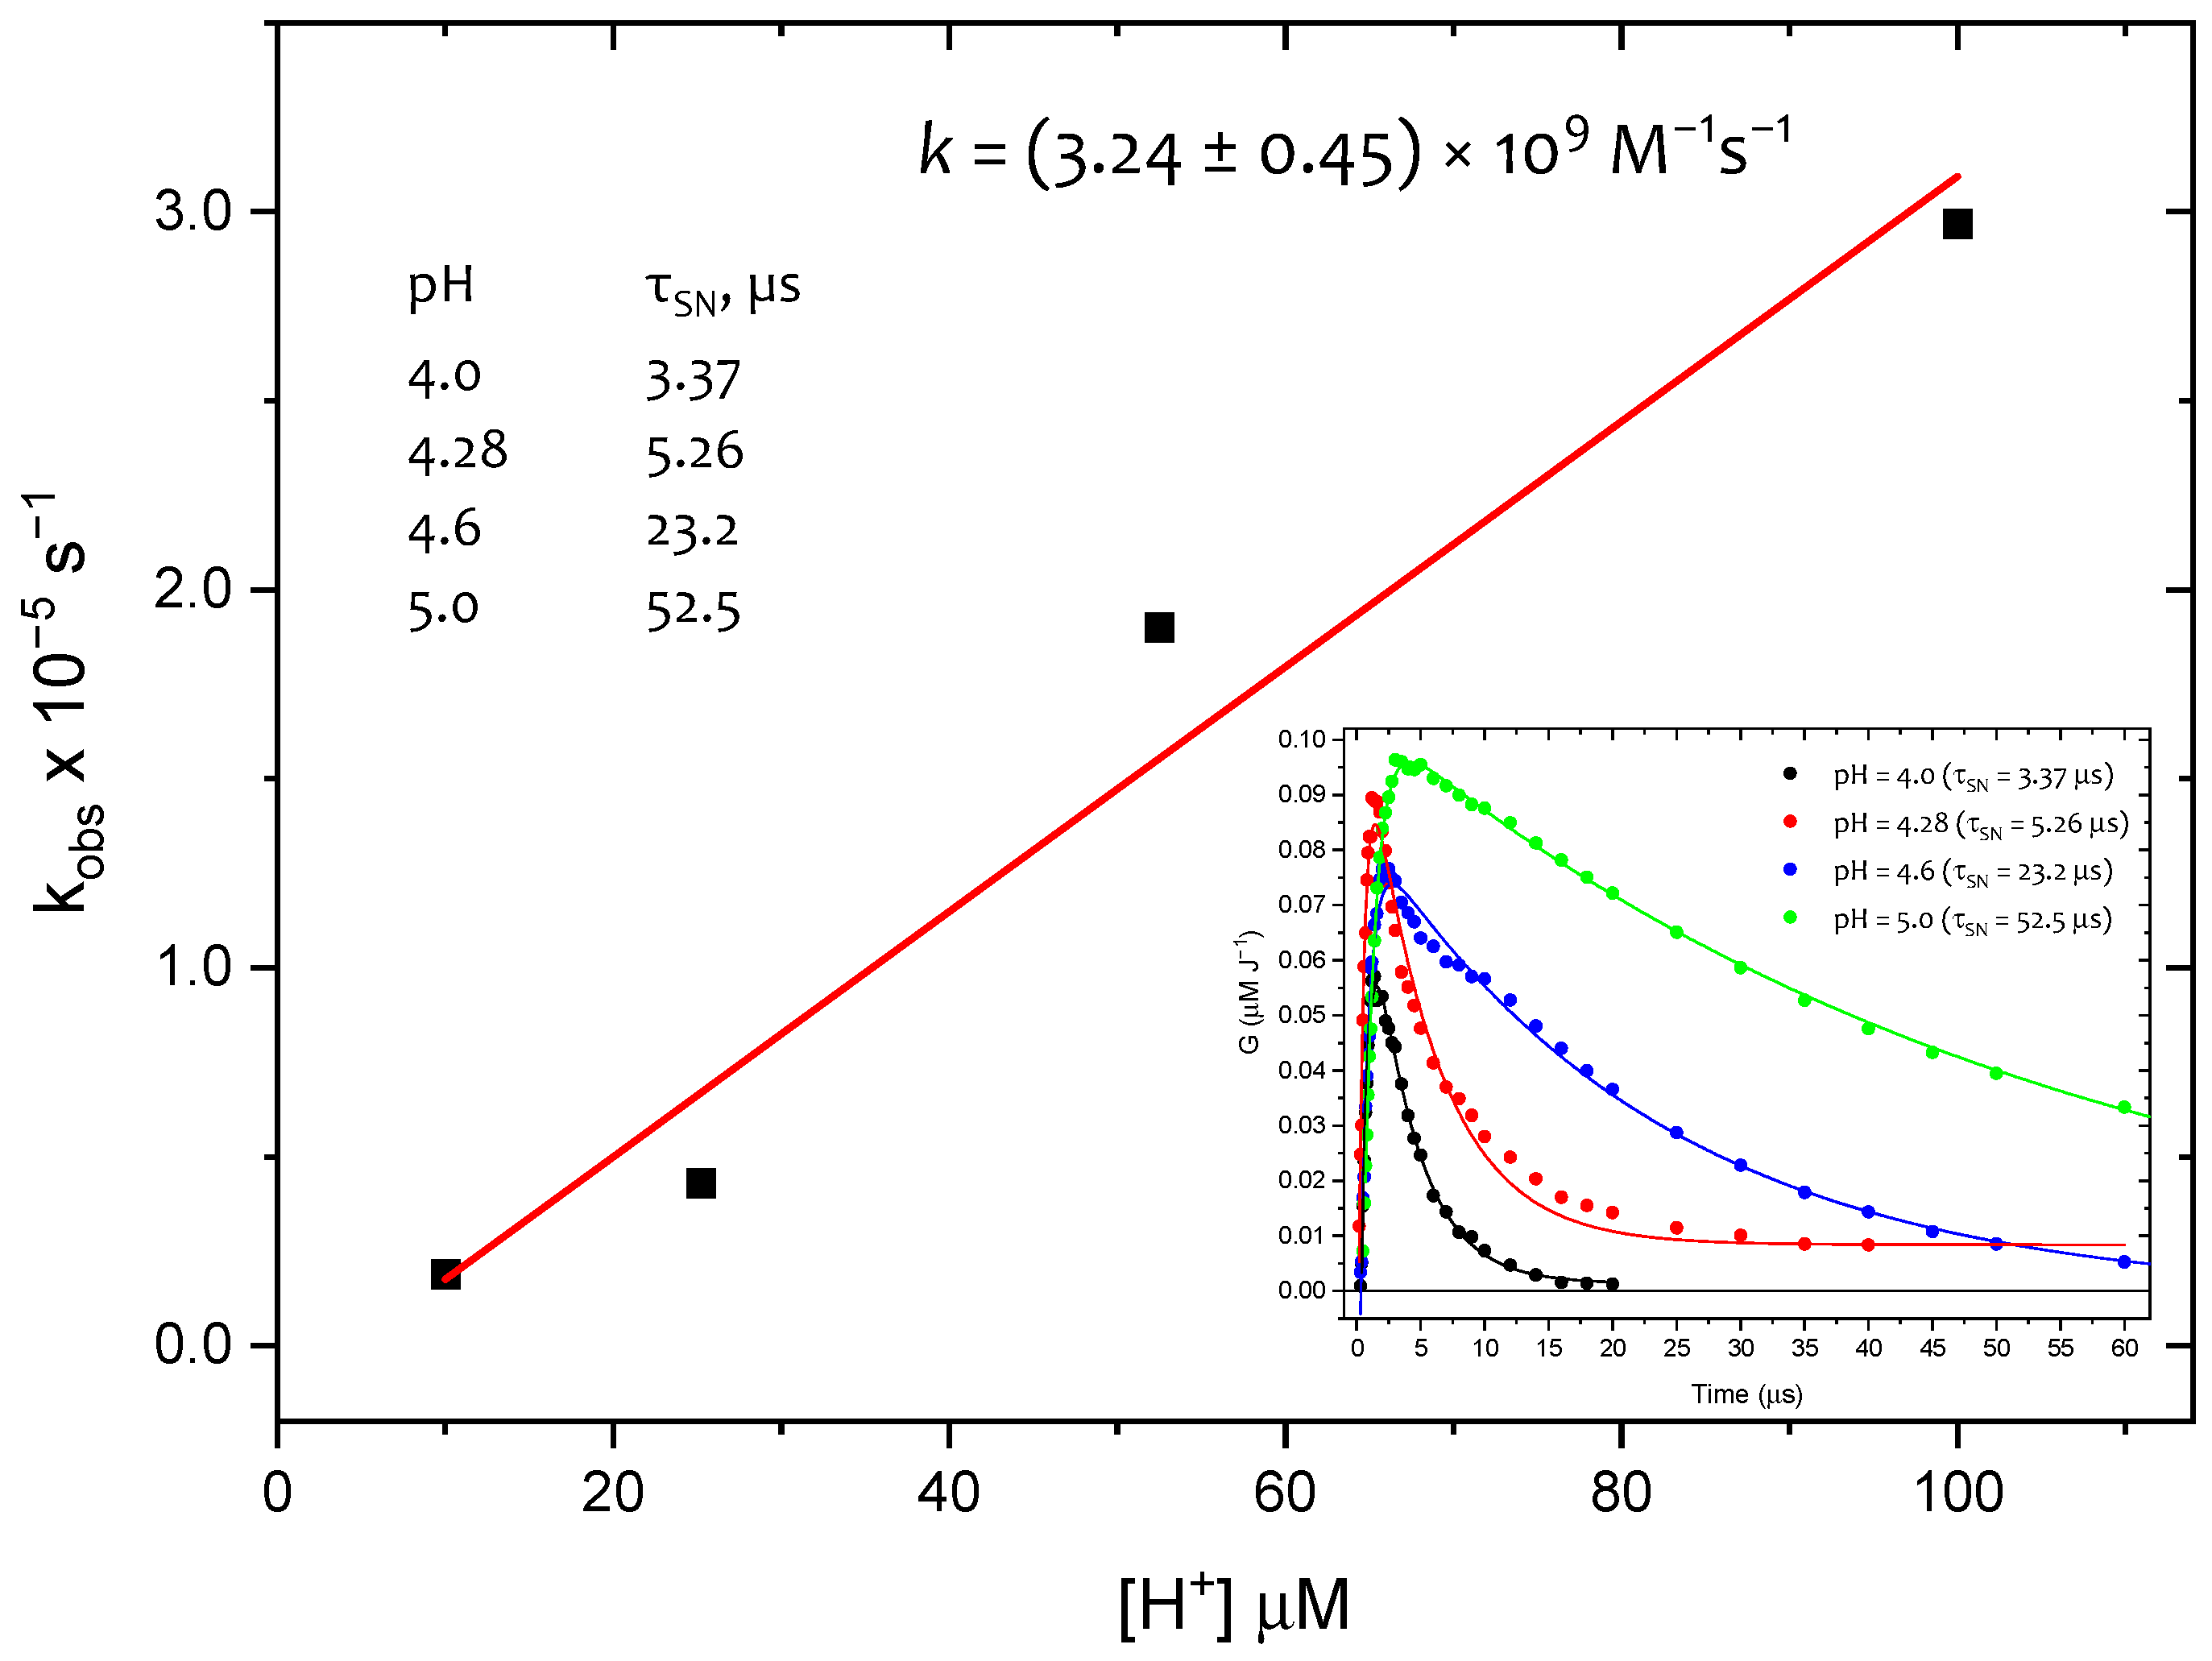
The resolutions of absorption spectra at additional pH values of, 4.3, 4.6, and 5.0, yielded concentration profiles of SN
• (inset in
Figure 8).
As expected, the decay rate of
SN• was pH-dependent, increasing with higher proton concentrations (inset in
Figure 8). From the plot of the pseudo-first-order rate constants versus proton concentration (
Figure 8), the rate constant
k(SN
• + H
+) was determined to be (3.2 ± 0.5) × 10
9 M
−1 s
−1. This
k-value is in very good agreement with the
k-value determined for the same reaction in cyclic dipeptide
c-(L-Met-L-Met) and equal to
k(SN
• + H
+) = (2.1 ± 0.1) × 10
9 M
−1 s
−1 [
33]. For comparison, using the same spectral resolution approach but with
SO•+, instead of
SN•, a similar picture was obtained (
vide Figure S10). This fact clearly indicates the inconsistency of these results with the expected independence of the
SO•+ decay rate from the proton concentration, and thus confirms the involvement of
SN• in the oxidation mechanism of
1 by HO
•. With this information in hand, the phenomenon of the increasing mismatch between
G(
SS•+) and the
G(ions) with increasing time after the electron pulse (
Figure 6C) requires explanation.
As it was mentioned earlier, the decay of the conductivity signal, that is, an increase in acid solutions after reaching the negative extreme value, is indicative of a liberation of protons from
S•+ (
vide inset in
Figure 6B). This first step in the recovery of the conductivity signal occurring during the first 7 μs after the electron pulse coincides very well with the first step of formation of
αS• radicals and is attributed to the deprotonation of
S•+ (
vide inset in
Figure 6A). Then, the persistent constant difference between
G(ions) and
G(
SS•+), observed in the time domain up to 12 μs (
vide inset in
Figure 6C), is consistent with the
SN• decay (
vide inset in
Figure 8) and is attributed to the presence of
S•+ and
NH•+ radical cations, which are formed upon protonation of
SN•. Interestingly, the recovery of the conductivity signal is similar to the decay of
SS•+. This observation can be rationalized as follows: though protons are consumed during the protonation of
SN•, the transients formed in this reaction, i.e., S
•+ and NH
•+ radical cations, undergo rapid deprotonation. The occurrence of these two reactions causes no net change in conductivity. However, with the further elapse of time, a difference between the kinetics of
SS•+ decay and the kinetics of recovery of the conductivity signal becomes more and more pronounced. The conductivity signal uptake up to 100 μs, plateauing between 50 and 100 μs (even though
SS•+ optical signal decays to nearly zero in the same time) (
vide Figure 6C), has to be explained by the secondary processes in which protons are consumed. This suggestion is based on similar findings in the oxidation of simple thioethers [
38], as well as cyclic 1,3-dithiane [
39], and 1,3,5-trithiane compounds [
40]. As for the moment, the most reasonable explanation seems to be disproportionation of
αS•, resulting in the restored original compound
1 and formation of sulfur cation (
S+) (
vide Figure S11).
The αS•(2), which can be described in two mesomeric forms, undergoes a disproportionation reaction that leads to negative [–CH=S−–CH3] and positive ions [–CH=S+–CH3]. The negative ions, which can also exist in another mesomeric form [–C−H–S–CH3], will presumably pick up a proton, yielding the original compound 1. This reaction reflects the substitution of a proton (H+) by a positive ion [–CH=S+–CH3], resulting in a negative conductivity signal that persists up to 100 μs. The plateau section is compatible with the expected long lifetime of a positive ion (S+).
There is one more observation that needs to be explained, namely the high radiation chemical yield of
αS• (
G = 0.27 μmol J
−1) at 4 μs after the electron pulse. Direct abstraction of the hydrogen atom by HO
• cannot be responsible because the contribution of this reaction is only 10% and can lead to the formation of
αS• with a maximum radiation chemical yield,
G = 0.06 μmol J
−1. Similarly, the deprotonation of
S•+ within this time range does not fully account for the high G-value of
αS•. Based on the concentration profiles of
Gions (
vide inset in
Figure 6C), the radiation chemical yield of
αS• formed via this reaction is nearly equal to
G = 0.05 μmol J
−1. Simple calculation indicates that the remaining 0.16 μmol J
−1 of
αS• must be formed in another competing process, which is not associated with the change in conductivity. By analogy with the formation of
SN•, the formation of
αS• must also proceed via separated coupled electron–proton transfer reactions involving
HOS•. The HO
− generated in the inner-sphere electron transfer that leads to
S•+ is neutralized in the concerted reaction by the proton released at C atoms located in methylene and/or methyl groups adjacent to the S atom, leading to the formation of either
αS(2)• or
αS(1)• radicals, respectively. An analogous reaction was proposed earlier for simple aliphatic sulfides [
38], and tetrahydrothiophene [
36].
Table 2 summarizes the radiation chemical yields of all transients formed from
1 at selected times when one of the transients reaches its maximum yield.
Next, we will discuss the results for compound
2. Transient absorption spectra in the range 250–700 nm recorded during pulse radiolysis of
2 at pH 4 for time delays in the range 0.6–100 µs are presented in
Figure S12A,B.
From the comparison of these spectra with those of compound
1 (
vide Figure S5A,B), it is evident that the
SS•+ intermediate for
2 is nearly absent, the yield of
αS• is lower, and a strong, distinct absorption band with λ
max = 390 nm appears. Similarly to
1, the high radiation chemical yield of
αS• (
G = 0.22 μmol J
−1) at 2.5 μs after the electron pulse can be rationalized by a separated coupled electron–proton transfer reaction involving
HOS•. The question arises as to which transient species are responsible for the absorption with a maximum located at λ = 390 nm, given the expected presence of
SO•+ and/or
SN• transients. In our previous paper, we assigned this absorption band only to
SO•+ [
24]. Fortunately, the pulse radiolysis technique, combined with conductivity detection, played a crucial role in reaching the final conclusion on this issue. Assuming that
SO•+ was the only transient responsible for the absorption, the radiation-chemical yield of
SO•+, calculated directly from the absorption change at λ = 390 nm and assuming ε
390 = 3009 (
vide Figure S6), measured at 1.8 μs, was found to be equal to 0.47 μM J
−1 (
vide Figure 9C). On the other hand, the
G(ions) at 1.8 μs calculated from the experimental changes in equivalent conductivity at given times (
G × ΔΛ) (
vide Figure 9B) were found to be equal to 0.23 μM J
−1 (
vide Figure 9C).
Since
SO•+ is the only possible intermediate responsible for the observed loss of conductivity at 1.8 μs, it is obvious that
SO•+ cannot be the only transient responsible for absorption with λ
max = 390 nm. The obvious candidate is
SN•, which is characterized by an identical shape and location of the absorption band; however, it has a higher molar absorption coefficient compared to
SO•+ (
vide Figure S6). Therefore, the usual procedure for resolving experimental transient spectra cannot be applied to compute their initial radiation-chemical yields reliably. To achieve this, a slightly modified spectral resolution procedure, combined with conductivity measurements, was employed. The radiation-chemical yield of
SO•+ at 1.8 μs can be measured independently from the conductivity (
G = 0.23 μM J
−1, vide supra), so their contribution in the resulting experimental spectrum
G(SO
•+) × ε(SO
•+)
390 can be easily determined and subtracted from the experimental spectra. Subsequently, the spectrum resulting from that subtraction was decomposed into the component spectra associated with the various transient species present (
HOS•,
SN•,
αS•,
SS•+, and
αC(2)•) except
SO•+, using the spectral resolution procedure identical to that described previously [
24] (see also Material and Methods section). At this step of the procedure, the most important parameter is the radiation-chemical yield of
SN• at the maximum of its formation (G
SN• = 0.14 μM J
−1, vide supra), which is taken later as an initial concentration in its decay. Our previous experiments with the cyclic peptide
c-(Met-Met) have demonstrated partial conversion of
SN•, involving proton participation, into the intramolecular dimeric radical cation
SS•+. Based on this observation, it was assumed that a similar type of reaction might occur in compound
2, in which
SN• undergoes proton-dependent conversion into
SO•+. The
G(SN
•) determined from these decays for selected time points was used to calculate their contribution to the resulting experimental spectrum
G(SN
•) × ε(SN
•)
390, and was further subtracted from the experimental spectra. Subsequently, the spectrum resulting from that subtraction was decomposed into the component spectra associated with the various transient species present (
HOS•,
SO•+,
αS•,
SS•+, and
αC(2)•) except
SN•. The rate constant of this reaction was taken as a parameter, and using the trial-and-error method, the optimum rate constant for
SN• decay was adjusted, until a concentration profile of
SO•+ for an initial period of its decay was similar to a concentration profile of ions determined by conductivity (
vide Figure S13). Thus, the determined pseudo first-order rate constant for the protonation of
SN• was found to be equal to 7 × 10
4 s
−1 (
vide Figure 9C), which roughly corresponds to a second-order rate constant
k = 7 × 10
8 M
−1 s
−1. This value is lower than the rate constant for the
SN• protonation reaction of
1 (vide supra). It is worth emphasizing that pulse radiolysis experiments, which included conductivity and spectral detections, enabled the determination of concentration profiles of
SO•+ formed simultaneously with
SN• during
•OH-induced oxidation of
2. Similarly to 1, with the further elapsed time after completion of
SN• decay, a difference between the kinetics of
SO•+ decay and the kinetics of recovery of the conductivity signal becomes increasingly pronounced. Just as for
1, this observation can be explained again by a set of reactions starting with the disproportionation of
αS•, resulting in the restoration of the original compound
2 and formation of the respective sulfur cation (
S+) (
vide Figure S11).
Table 3 summarizes the radiation-chemical yields of all transients formed from
2 at selected times when one of the transients reaches its maximum yield.
2.3. Mechanistic Insights
The radiation-chemical yields (G) of the primary reactive species (e
−aq, HO
•, and H
•) are the same in the pH range of 4–7 (
vide Reaction 1); therefore, the differences only apply to those processes involving protons (H
+) from the bulk of solution. It is well known that the reaction of HO
• with Met, and, in general, with dialkyl sulfides, occurs mainly by addition to the sulfur atom, generating a sulfuranyl radical (
HOS•). With Met, the direct H-atom abstraction from the C—H bonds is a minor path that accounts for less than 10% (
vide Figure 5).
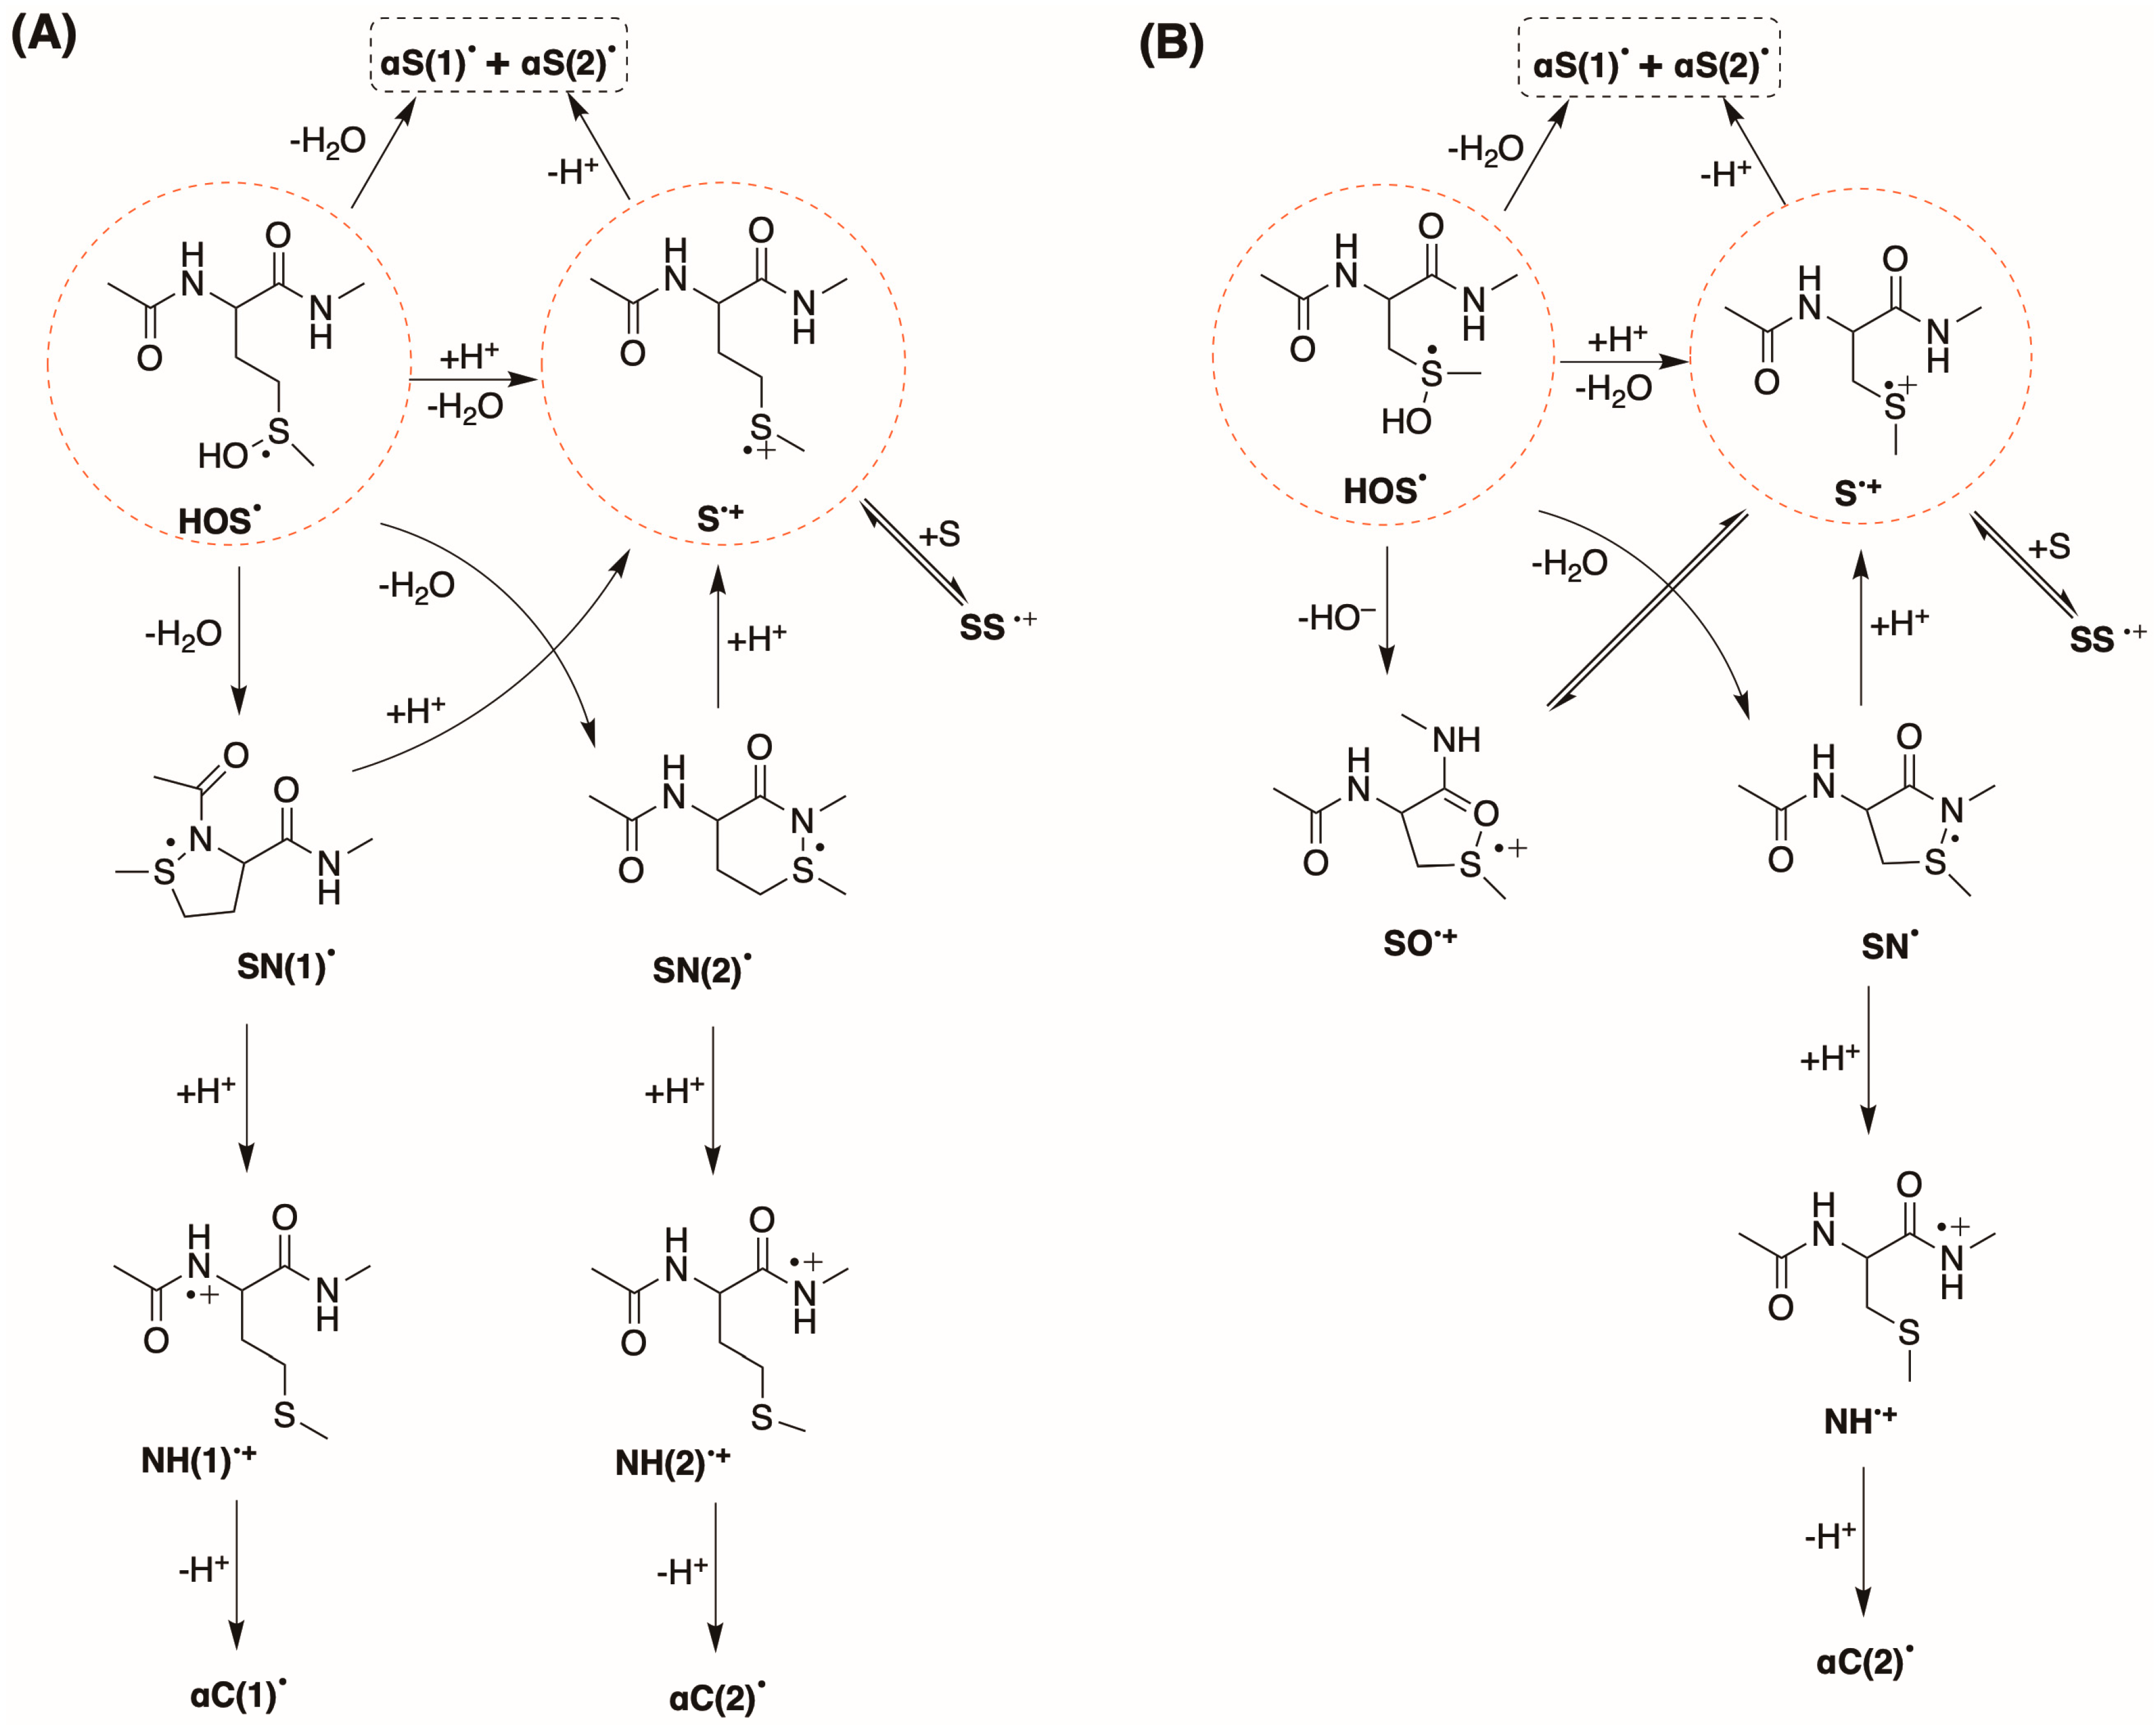
Figure 10A,B summarizes the fate of
HOS• for compounds
1 and
2, respectively. In both cases, the
HOS• eliminates HO
− very fast which is subsequently neutralized either by external protons (H
+) and affording the one-electron oxidation of the thioether moiety (
S•+) or by protons released either at the C atoms located in methylene and/or methyl groups adjacent to the S atom, leading to the formation of either
αS(2)• or
αS(1)•, respectively. Additionally, the
HOS• eliminates HO
−, which is neutralized by protons released at the N-atoms located on both sides of the Met moiety, leading to the formation of
SN(1)• and
SN(2)• for compound
1. Part of
S•+ undergoes deprotonation, affording the formation of α
S•(1) and α
S•(2) radicals, and the latter is a precursor of
SS•+ in the case of
1 and
SO•+ in the case of
2.
The
αS• radicals account for ca. 50% in
1 (
vide Table 2) and ca. 35% in
2 (
vide Table 3) of all radicals present after full decay of
HOS•. Comparison of the respective contribution of
αS• obtained at pH 7 [
24] clearly shows that deprotonation of S
•+ is an additional source of them beyond the process of their formation directly from
HOS• (vide supra). From product studies, the ratio
αS(2)•/
αS(1)• is ca. 1.5 for
1 in both pH 4 and 7, whereas for
2 is 72.2 and 54.3 at pH 7 and 4, respectively. Therefore, the deprotonation of an internal –CH
2S– is much faster than the external –SCH
3 in
2, probably due to conformational preference and/or to higher radical stabilization of
αS(2)•.
The formation of
SS•+ for
1 is an important reaction path, as further confirmed by the conductivity experiments and formation of disulfide
7 (
vide Figure 4). The
SS•+ radicals account for ca. 35% (at the maximum of their formation) of all radicals present after full decay of
HOS• in
1 (
vide Table 2). On the other hand, the contribution of
SS•+ is minor, as evident from the formation and decay of transients in
Figure S12A,B for
2. Their contribution accounts for ca. 3% of all radicals present (
vide Table 3). It is worth mentioning that disulfide
8 is a reaction product of
2, confirming the
SS•+ reaction path, but the yield is approximately four-fold lower than that of the corresponding product 7 in both pH 4 and 7 (
vide Figure 4).
The five- and/or six-membered
SN• species containing 2c-3e bonds are well documented [
33]. In
1, there is a possibility to obtain both five-membered
SN(1)• and six-membered
SN(2)• species by the left and right interactions of the sulfur atom with N-atoms in the peptide backbone. It has to be stressed that the formation of both
SN• species does not occur via the
S•+ pathway but involves their direct formation from
HOS• via separated coupled electron–proton transfer reactions (vide supra). Their contribution is not very high and accounts for ca. 13% of all radicals present at the time of their maximum yield (
vide Table 2). It is well documented that
SN• species undergo fast reaction with protons (H
+) [
33]. In
1, the protonation of both,
SN(1)• and
SN(2)•, can lead either to
S•+ which further deprotonate to
αS• or to
NH(1)•+ and
NH(2)•+, which further deprotonate, yielding
αC(1)• and
αC(2)• radicals, respectively. The transient absorption spectra of SN
• do not distinguish the latter two reaction paths. However, these two distinct pathways are confirmed by the product studies, where the ratio CH
3S—αC(1)/CH
3S—αC(2) is 0.6/1 at pH 4 and 1.4/1 at pH 7, thus the acidic environment favoring the formation of
αC(1)• respect to
αC(2)•.
One more issue requires comment, namely, the absence of
SO•+ in the reaction scheme for
1. Analyzing the structure of
1, the cyclic
SO•+ formed will be six- or seven- membered. As reported previously [
41], formation of six-membered
SO•+, though thermodynamically possible, is not able to compete kinetically with deprotonation of its immediate precursor, i.e., S
•+. A similar argument can be applied to the seven-membered
SO•+. Moreover, supporting the above conclusions, their presence was not necessary to explain the experimental observations.
Interestingly, in the case of
2,
αC(1)• is not formed in the acidic environment, similar to the experiments at pH 7 (
vide Figure 9A and
Table 3). This is in agreement with the results from the analysis of the stable products, where products containing
αC(1)• are not detected (
vide Table 1). The lack of
αC(1)• can be rationalized by the absence of
SN• (cyclic four-membered
SN radical with N-atom from N-acetyl group of N-terminal) and consequently NH
•+ as its precursor. It has to be stressed that the contribution of
SN• and
SO•+ accounts for ca. 21% and 45% of all radicals present at the time of their maximum yield (
vide Table 3). This is not surprising, considering that both transients are characterized by a five-membered cyclic structure. It is also worth underlining that the ratio CH
3S—αS/CH
3S—αC(2) decreases substantially going from 31.8 at pH 7 to 3.3 at pH 4, suggesting that the acidic conditions favor the formation of
αC(2)•.
Figure 10A,B summarize the fate of HOS
• species for compounds
1 and
2.
Both starting compounds
1 and
2 have
αS• radicals as one of the main intermediates, although the ratio
αS(2)•/
αS(1)• changes substantially from
1 to
2 (
vide Table 1). Other important intermediates are the following:
SS•+ for
1 and
SN• and
SO•+ for
2. In turn, the contribution of
αC(1)• and
αC(2)• for
1 and
αC(2)• for
2 is rather minor (
vide Table 2 and
Table 3, respectively). However, in relation to
αS(2)• radicals, contribution of
αC(2)• radicals for
2 compared to
1 is higher which was confirmed by the ratio CH
3S—αS(2)/CH
3S—αC(2) equal 12.2/1 for
1 and 54.3/16.6 for
2, respectively (
vide Table 1).


 ,
, 

 e− aq (0.28), HO• (0.28), H• (0.062), H+ (0.28) and H2O2 (0.073)


